Embed Size (px)
Citation preview
DAViS: a unified solution for data collection, analyzation, and visualization in real‑time stock market predictionSuppawong Tuarob1, Poom Wettayakorn1, Ponpat Phetchai1, Siripong Traivijitkhun1, Sunghoon Lim2,3, Thanapon Noraset1 and Tipajin Thaipisutikul1*
Abstract
The explosion of online information with the recent advent of digital technology in information processing, information storing, information sharing, natural language processing, and text mining techniques has enabled stock investors to uncover market movement and volatility from heterogeneous content. For example, a typical stock market investor reads the news, explores market sentiment, and analyzes technical details in order to make a sound decision prior to purchasing or selling a particular company’s stock. However, capturing a dynamic stock market trend is challenging owing to high fluctuation and the non-stationary nature of the stock market. Although existing studies have attempted to enhance stock prediction, few have provided a complete decision-support system for investors to retrieve real-time data from multi-ple sources and extract insightful information for sound decision-making. To address the above challenge, we propose a unified solution for data collection, analysis, and visualization in real-time stock market prediction to retrieve and process relevant financial data from news articles, social media, and company technical information. We aim to provide not only useful information for stock investors but also meaningful visualization that enables investors to effectively interpret storyline events affecting stock prices. Specifically, we utilize an ensemble stacking of diversified machine-learn-ing-based estimators and innovative contextual feature engineering to predict the next day’s stock prices. Experiment results show that our proposed stock forecasting method outperforms a traditional baseline with an average mean absolute percentage error of 0.93. Our findings confirm that leveraging an ensemble scheme of machine learning methods with contextual information improves stock prediction performance. Finally, our study could be further extended to a wide variety of innovative financial applications that seek to incorporate external insight from contextual information such as large-scale online news articles and social media data.
Keywords: Investment support system, Stock data visualization, Time series analysis, Ensemble machine learning, Text mining
Open Access
© The Author(s), 2021. Open Access This article is licensed under a Creative Commons Attribution 4.0 International License, which permits use, sharing, adaptation, distribution and reproduction in any medium or format, as long as you give appropriate credit to the original author(s) and the source, provide a link to the Creative Commons licence, and indicate if changes were made. The images or other third party material in this article are included in the article’s Creative Commons licence, unless indicated otherwise in a credit line to the mate-rial. If material is not included in the article’s Creative Commons licence and your intended use is not permitted by statutory regulation or exceeds the permitted use, you will need to obtain permission directly from the copyright holder. To view a copy of this licence, visit http:// creat iveco mmons. org/ licen ses/ by/4. 0/.
RESEARCH
Tuarob et al. Financ Innov (2021) 7:56 https://doi.org/10.1186/s40854‑021‑00269‑7 Financial Innovation
*Correspondence: [email protected] 1 Faculty of Information and Communication Technology, Mahidol University, Nakhon Pathom 73170, ThailandFull list of author information is available at the end of the article
Page 2 of 32Tuarob et al. Financ Innov (2021) 7:56
IntroductionThe stock market prediction has become a prominent research topic for both researchers and investors due to its important role in the economy and obvious finan-cial benefits. There is an urgent need to uncover the stock market’s future behavior in order to avoid investment risks while achieving the best profit margins for invest-ments. Nevertheless, stock market decision-making is difficult due to the stock market’s complex behavior and unstable nature. Accurate prediction is even more challenging considering the need to forecast the local stock market in different coun-tries (Wu et al. 2019; Selvamuthu et al. 2019; Gopinathan and Durai 2019) since there are unique cultures, different norms, and diverse heterogeneous sources that can affect investors’ decision-making processes. Therefore, we take the Thai stock market as an empirical study to demonstrate how to leverage stock prediction performance locally.
Despite the high prevalence of existing stock prediction approaches, there are several challenges that we need to consider when designing a practical end-to-end stock predic-tion framework to tackle the dynamic nature of the stock market (Hu et al. 2015).
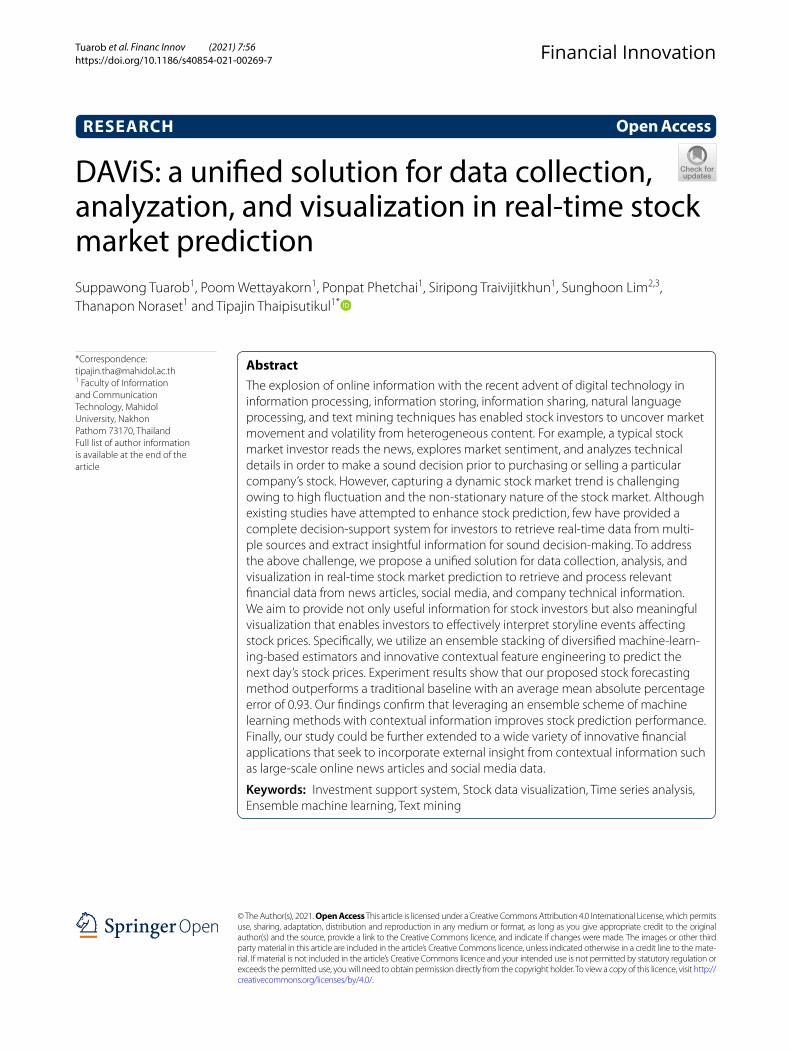
CH1: There are heterogeneous sources of stock information as shown in Fig. 1. The large amount of data generated by the Internet users is considered a treasure trove of knowledge for investors. Real-time data collection and analysis are needed to explore and evaluate the enormous amount of valuable available data. This process is an essential step to enhance stock prediction performance since stock market circum-stances are known to fluctuate frequently. This means that decisions made with even minutes-old data can potentially result in poor decisions.
Hence, when proposing an end-to-end framework for stock prediction, the most current data from all important information sources should be collected in real-time to obtain a full and accurate picture of the most updated status of stock companies.
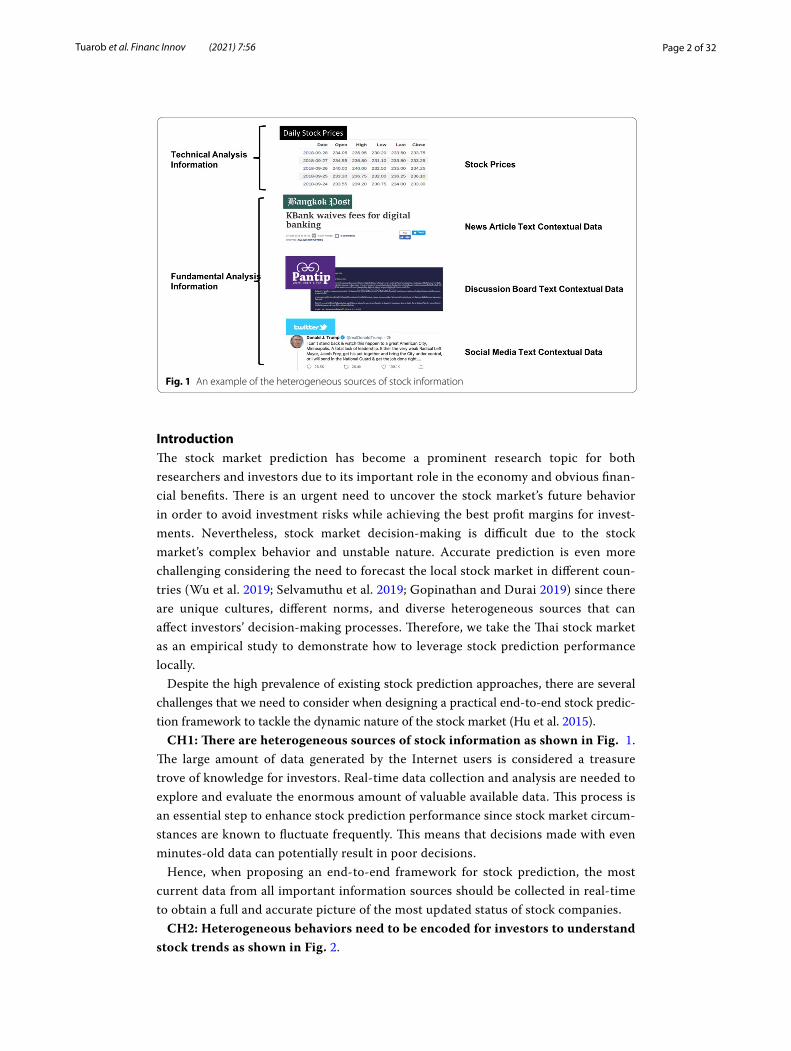
CH2: Heterogeneous behaviors need to be encoded for investors to understand stock trends as shown in Fig. 2.
Fig. 1 An example of the heterogeneous sources of stock information
Page 3 of 32Tuarob et al. Financ Innov (2021) 7:56
Since financial information available on the Internet comes in a wide variety of types, sources, temporal dimensions, and thematic scales, it would be unfeasible to assemble all the information available. According to reports from Bomfim (2003), there is strong evidence that news articles, social media contents, and general discussion contents are often important indicators of market movements. Moreover, they are critical for inves-tors to keep abreast of the collective expectation and various reports or predictions on stock prices. For instance, as presented in Fig. 2, we can observe that there is a strong causal relationship between news and KBank stock price. Before the price suddenly dropped on March 27, 2018, there is a news announcement, “KBank waives fees for digital banking.” Similarly, when the news headline “Scrapped digital fees to hit banking income” was released, an increase in the stock price was observed on the following date. Therefore, we should include these contextual data in the system.
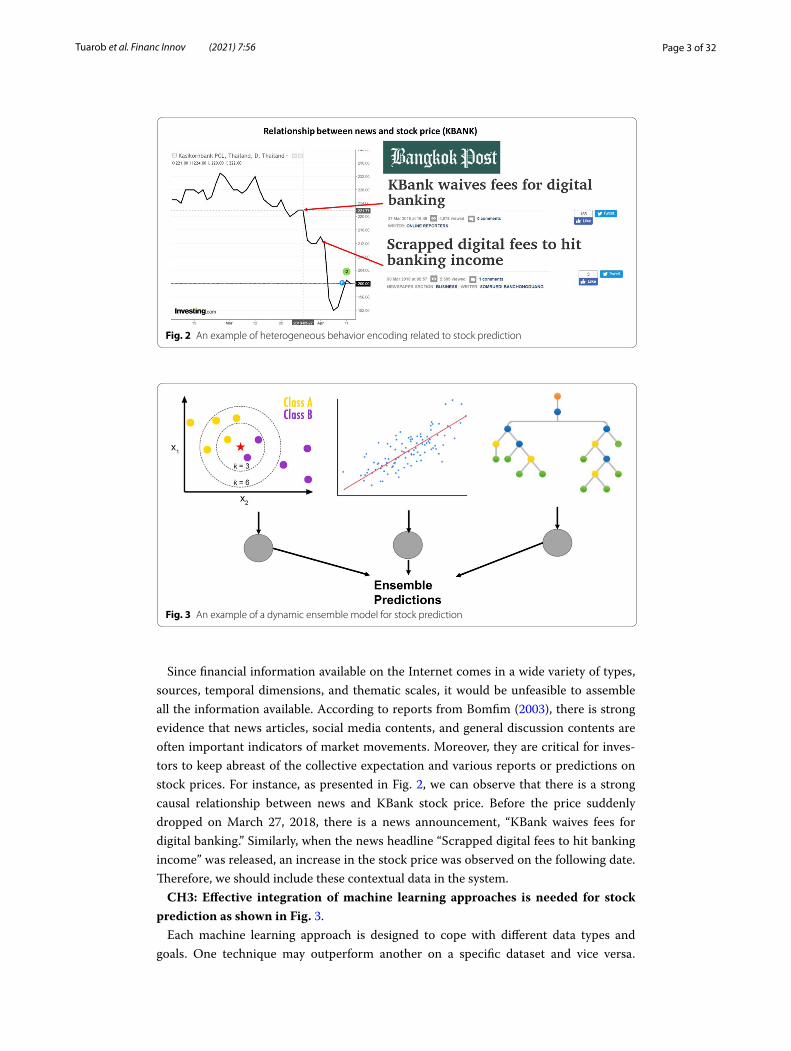
CH3: Effective integration of machine learning approaches is needed for stock prediction as shown in Fig. 3.
Each machine learning approach is designed to cope with different data types and goals. One technique may outperform another on a specific dataset and vice versa.
Fig. 2 An example of heterogeneous behavior encoding related to stock prediction
Fig. 3 An example of a dynamic ensemble model for stock prediction
Page 4 of 32Tuarob et al. Financ Innov (2021) 7:56
For example, Zhong and Enke (2019b) used deep neural networks (DNNs) with Prin-cipal Component Analysis (PCA) to classify the stock return daily. Seker et al. (2013) utilized the combination of k-NN, C4.5, and SVM approaches to classify stock market trends. The effective integration of various machine learning algorithms should provide a dynamic method to adjust the impact of each standalone model in the final predictions with respect to the different types of stock datasets.
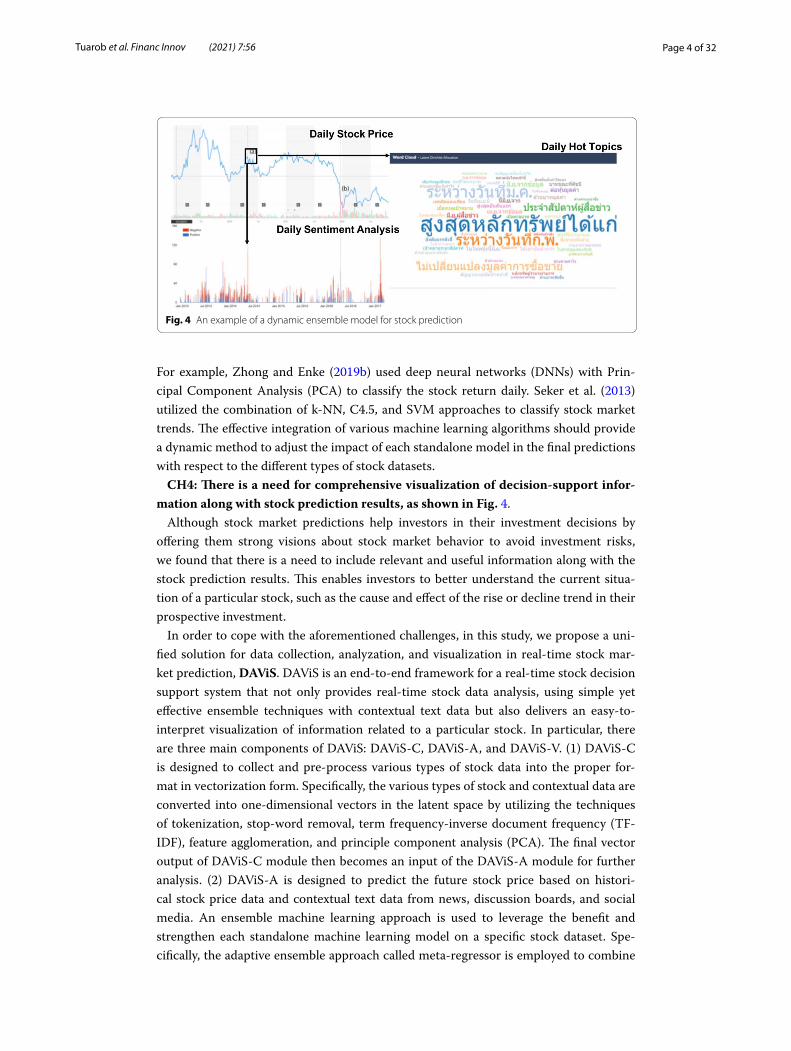
CH4: There is a need for comprehensive visualization of decision-support infor-mation along with stock prediction results, as shown in Fig. 4.
Although stock market predictions help investors in their investment decisions by offering them strong visions about stock market behavior to avoid investment risks, we found that there is a need to include relevant and useful information along with the stock prediction results. This enables investors to better understand the current situa-tion of a particular stock, such as the cause and effect of the rise or decline trend in their prospective investment.
In order to cope with the aforementioned challenges, in this study, we propose a uni-fied solution for data collection, analyzation, and visualization in real-time stock mar-ket prediction, DAViS. DAViS is an end-to-end framework for a real-time stock decision support system that not only provides real-time stock data analysis, using simple yet effective ensemble techniques with contextual text data but also delivers an easy-to-interpret visualization of information related to a particular stock. In particular, there are three main components of DAViS: DAViS-C, DAViS-A, and DAViS-V. (1) DAViS-C is designed to collect and pre-process various types of stock data into the proper for-mat in vectorization form. Specifically, the various types of stock and contextual data are converted into one-dimensional vectors in the latent space by utilizing the techniques of tokenization, stop-word removal, term frequency-inverse document frequency (TF-IDF), feature agglomeration, and principle component analysis (PCA). The final vector output of DAViS-C module then becomes an input of the DAViS-A module for further analysis. (2) DAViS-A is designed to predict the future stock price based on histori-cal stock price data and contextual text data from news, discussion boards, and social media. An ensemble machine learning approach is used to leverage the benefit and strengthen each standalone machine learning model on a specific stock dataset. Spe-cifically, the adaptive ensemble approach called meta-regressor is employed to combine
Fig. 4 An example of a dynamic ensemble model for stock prediction
Page 5 of 32Tuarob et al. Financ Innov (2021) 7:56
multiple machine learning prediction results while learning to estimate the impact of different models. (3) DAViS-V is designed to provide not only useful information for stock investors, such as future predicted stock prices, but also meaningful visualization that allows investors to effectively interpret storyline events affecting stock prices.
In summary, the main contributions of our study are as follows.
• To the best of our knowledge, this is the first study to provide the end-to-end frame-work called DAViS for real-time stock data collection (DAViS-C), analyzation (DAViS-A), and visualization (DAViS-V) for stock market researchers and investors.
• The proposed DAViS-C module is designed in a proactive fashion to pull and process the related heterogeneous stock data in real-time.
• The concept of integrating the simple yet effective machine learning approaches is introduced in DAViS-A to not only efficiently enhance the accuracy of stock predic-tion but also provide interpretable prediction results to users.
• The proposed DAViS-A module integrates various contextual knowledge, including financial news websites, discussion boards, and social media, into an ensemble learn-ing technique to strengthen diversified regressors and bolster a robust predictive model.
• The proposed DAViS-V module could aid investors and traders in their decision-making processes and provide easy-to-interpret as well as sufficient information to support their future investment plans over time.
• We perform experiments on real 21 stocks from the Stock Exchange of Thailand.1 The experimental results demonstrate that our proposed framework outperforms the standalone machine learning approaches by a large margin.
The rest of the paper is organized as follows. Related literature section discusses the background and Related literature. Preliminary and The proposed DAViS Framework sections explain the preliminary notations used throughout this study as well as the details of our proposed end-to-end framework. Experimental setup section presents the Experimental setup and the main research questions. Experimental result section pro-vides in-depth details on the Experimental results, including the overall comparisons, an ablation study, and discussion. Finally, the concluding remarks are summarized in Con-clusions and future direction.
Related literatureMultiple techniques have been proposed to analyze the various phenomena in finan-cial markets (Wen et al. 2019; Kou et al. 2021). The overarching goal of this research is to implement a computational model that derives the relationship between contex-tual information and related stocks in the financial market. We can divide the traditional models into two main approaches based on the type of information they are focused on: technical data or fundamental data.
Technical Analysis makes predictions on future stocks based on time-series numer-ical data, such as opening and closing price and trade volume. The main purpose of
1 https:// www. set. or. th/.
Page 6 of 32Tuarob et al. Financ Innov (2021) 7:56
this approach is to find trading patterns that can be exploited for future predictions. For example, Nayak et al. (2015) and Alhassan et al. (2014) discovered a complicated stock pattern by utilizing the auto-regressive model (AR), linearity, and stationary-time series. Nassirtoussi et al. (2015), Nguyen et al. (2015), and Hagenau et al. (2013) predicted future stock prices from historical data. Zhong and Enke (2019a) presented comprehensive big data analytics based on 60 financial and economic features. They utilized DNNs and traditional artificial neural networks (ANNs) along with the prin-cipal component analysis (PCA) method to predict the daily direction of future stock market index returns. Stoean et al. (2019) exploited deep-learning methods with a heuristic-based strategy for trading simulations and stock prediction. Nti et al. (2020) used an ensemble support vector machine to boost stock prediction performance. However, the nature of stock price prediction is highly volatile and non-stationary. Therefore, only utilizing the numerical price data with technical analysis is inad-equate to discover dynamic market trends. In contrast, fundamental analysis inte-grates information from outside market historical data such as news, social media, and business reports as additional inputs for stock predictive models. For example, Bollen et al. (2011) and Mao et al. (2011) proposed techniques that mine opinions from social media for improved stock prediction. Vu et al. (2012) first used a key-word-based algorithm to analyze and categorize Twitter messages as positive, nega-tive, and neutral. Then all features along with historical prices were used to train a Decision Tree (C4.5) classifier to predict the direction of future prices. Schumaker et al. (2012) investigated the correlation between the sentiment of financial news articles and stock movements. Later, Li et al. (2014) constructed sentiment vectors with the Harvard psychological dictionary and used them to train a Support Vector Machine (SVM) classifier to predict the daily open and closing prices. Jin et al. (2013) presented Forex-Foreteller (FF), a currency trend model using news articles as well as historical prices and currency exchange values. The system used sentiment analysis and LDA (Blei et al. 2003a) to obtain a topical distribution of each article. Akhtar et al. (2017) and Araque et al. (2017) proposed ensemble model construction to enhance sentiment analysis. Such methods are based on the work of Cheng et al. (2012), who examined whether ensemble methods could outperform the base learning algorithms, each of which learns from previous price information (as a time series). Afzali and Kumar (2019) integrated a company’s textual information to improve stock prediction performance. Lim and Tucker (2019) quantified the sentiment in a financial market and social media to enhance performance in many financial applications. Chattupan and Netisopakul (2015) used word-pair features (i.e., a keyword and polarity word) to conduct a news sentiment classification based on three sentiments: positive, negative, and neutral. In addition, Lertsuksakda et al. (2014) used the hourglass of emotions which is an improvement over Camras (1981)’s wheel of emotions—comprising eight emotional dimensions, namely, joy, trust, fear, surprise, sadness, disgust, anger, and anticipation—which has been utilized for many emotion-inspired predictive tasks. While there have been many efforts to enhance the performance of stock price pre-diction, few studies have provided an end-to-end framework to collect, analyze, and visualize stock insights in a real-time system. Our work differs from the exiting stud-ies since we leverage both technical and fundamental data from online news, social
Page 7 of 32Tuarob et al. Financ Innov (2021) 7:56
networks, and discussion boards to support investors’ decision-making processes. Details on our proposed model are provided in the next section.
PreliminaryIn this section, we present the notations used throughout this paper. We denote the sets of stock companies, technical data analysis, and fundamental data analysis as S, T, and F, where the sizes of these sets are |S|, |T|, and |F|, respectively. The technical data analy-sis utilizes technical information such as the price-earnings ratio, market capitalization, and volume. These types of data can be kept in a tabular format of real numbers. Inves-tors can conveniently gather this information from many stock-price reporting sources, such as the Stock Exchange of Thailand (SET),2,Yahoo Finance,3 and Stock Radars.4 On the other hand, fundamental data analysis involves monitoring primarily three basic fac-tors (i.e., economic, industrial, and organizational performance) that can affect stock prices. Such analysis requires examining both quantitative and qualitative data. While it is not convenient to represent qualitative data, often distilled from news articles, in a defined structural format, such insight can be helpful to investors and therefore cannot be neglected.
Definition 1 Technical Data Analysis Time Series (T): Each stock company s ∈ S has historical stock prices sorted by the time in chronological order. We define a company’s historical stock prices as s =< pst−l , . . . , p
st−2, p
st−1, p
st > where t is the current timestamp
of the recent stock price belonging to company s and l denotes the number of historical days used as the time lag.
Definition 2 Fundamental Data Analysis Time Series (F): There are three types of fun-damental data analysis used in this study, including financial news information, discus-sion board information, and social media information. We denote n ∈ N as a set of financial news articles, m ∈ M as a set of social media posts, and d ∈ D as a set of discus-sion board posts. For all the fundamental (F) data, we sort each n ∈ N , m ∈ M , and d ∈ D by time in chronological order. We then define a company’s historical contextual text data input as s = [< n
s
t−l, . . . , ns
t−2, ns
t−1, nst >,< m
s
t−l, . . . ,ms
t−2,ms
t−1,ms
t >,
< ds
t−l, . . . , ds
t−2, ds
t−1, dst >] where t is the current timestamp of the recent contextual
text data belonging to company s and l denotes the number of historical days used as the time lag.
Definition 3 Stock Data Time Series Input: This research focuses on time-series data, that is, historical prices along with contextual information are used as the input to the proposed stock predictive model. We therefore combine the l his-torical data from T and F, and construct the horizontal input data to the model as s = [< pst−l , . . . , p
st−2
, pst−1, pst >,< nst−l , . . . , n
st−2
, nst−1, nst >,< ms
t−l , . . . ,mst−2
,mst−1
,mst >
,< d, . . . , dst−2
, dst−1
, dst >].
2 https:// www. set. or. th/.3 https:// finan ce. yahoo. com/.4 https:// www. stock radars. co/.
Page 8 of 32Tuarob et al. Financ Innov (2021) 7:56
Problem formulation: For each stock company s ∈ S , given the time-series transactions T and F as s = [< pst−l , . . . , p
st−2
, pst−1, pst >,< nst−l , . . . , n
st−2
, nst−1, nst >,< ms
t−l , . . . ,
mst−2
,mst−1
,mst >,< d, . . . , ds
t−2, ds
t−1, dst >] , our goal is to predict the future closing
stock price in the next k days. In our study, we set l to three days and k to one day. In this way, the stock price prediction problem can be framed as a one-step multivariate time series forecasting task since it focuses on predicting the stock price for the next day (t+1). The horizon of one day is assumed, and our methodology focuses on short-term trading where decisions to purchase or sell can be made on a daily basis. For the lag observations, the data of the past three days (t−2, t−1, and t) is used to supervise the model. Such lag settings were also used by Bollen et al. (2011) to predict the Dow Jones Industrial Average (DJIA).
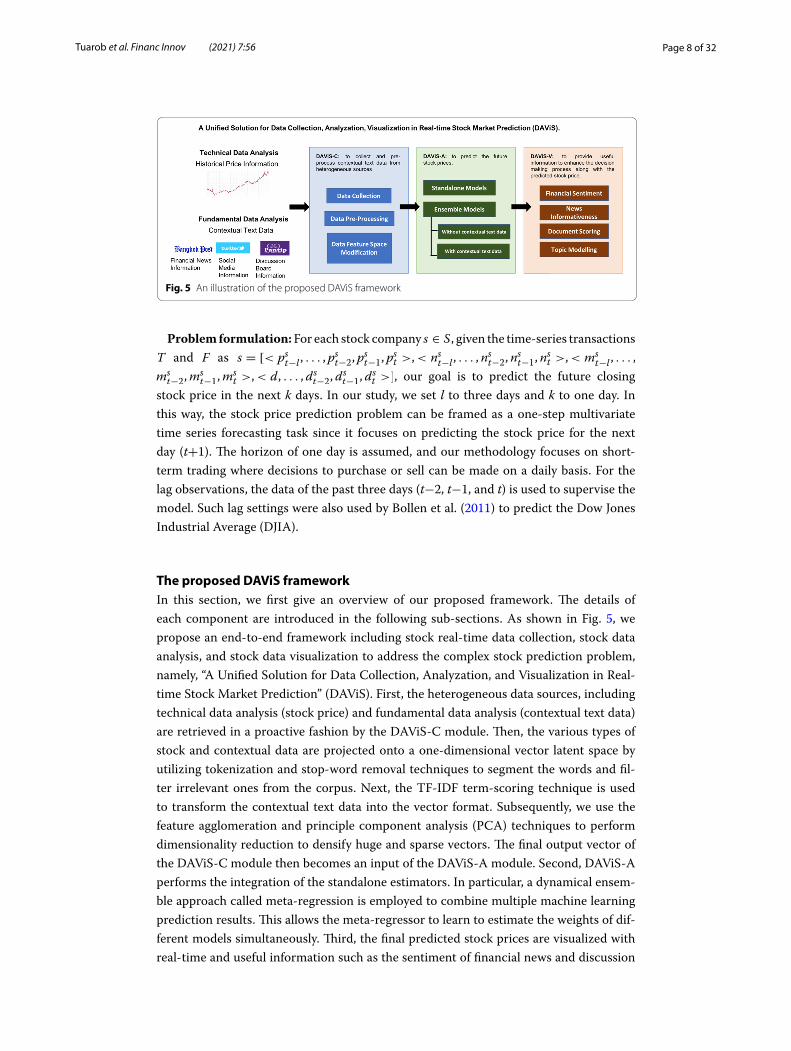
The proposed DAViS frameworkIn this section, we first give an overview of our proposed framework. The details of each component are introduced in the following sub-sections. As shown in Fig. 5, we propose an end-to-end framework including stock real-time data collection, stock data analysis, and stock data visualization to address the complex stock prediction problem, namely, “A Unified Solution for Data Collection, Analyzation, and Visualization in Real-time Stock Market Prediction” (DAViS). First, the heterogeneous data sources, including technical data analysis (stock price) and fundamental data analysis (contextual text data) are retrieved in a proactive fashion by the DAViS-C module. Then, the various types of stock and contextual data are projected onto a one-dimensional vector latent space by utilizing tokenization and stop-word removal techniques to segment the words and fil-ter irrelevant ones from the corpus. Next, the TF-IDF term-scoring technique is used to transform the contextual text data into the vector format. Subsequently, we use the feature agglomeration and principle component analysis (PCA) techniques to perform dimensionality reduction to densify huge and sparse vectors. The final output vector of the DAViS-C module then becomes an input of the DAViS-A module. Second, DAViS-A performs the integration of the standalone estimators. In particular, a dynamical ensem-ble approach called meta-regression is employed to combine multiple machine learning prediction results. This allows the meta-regressor to learn to estimate the weights of dif-ferent models simultaneously. Third, the final predicted stock prices are visualized with real-time and useful information such as the sentiment of financial news and discussion
Fig. 5 An illustration of the proposed DAViS framework
Page 9 of 32Tuarob et al. Financ Innov (2021) 7:56
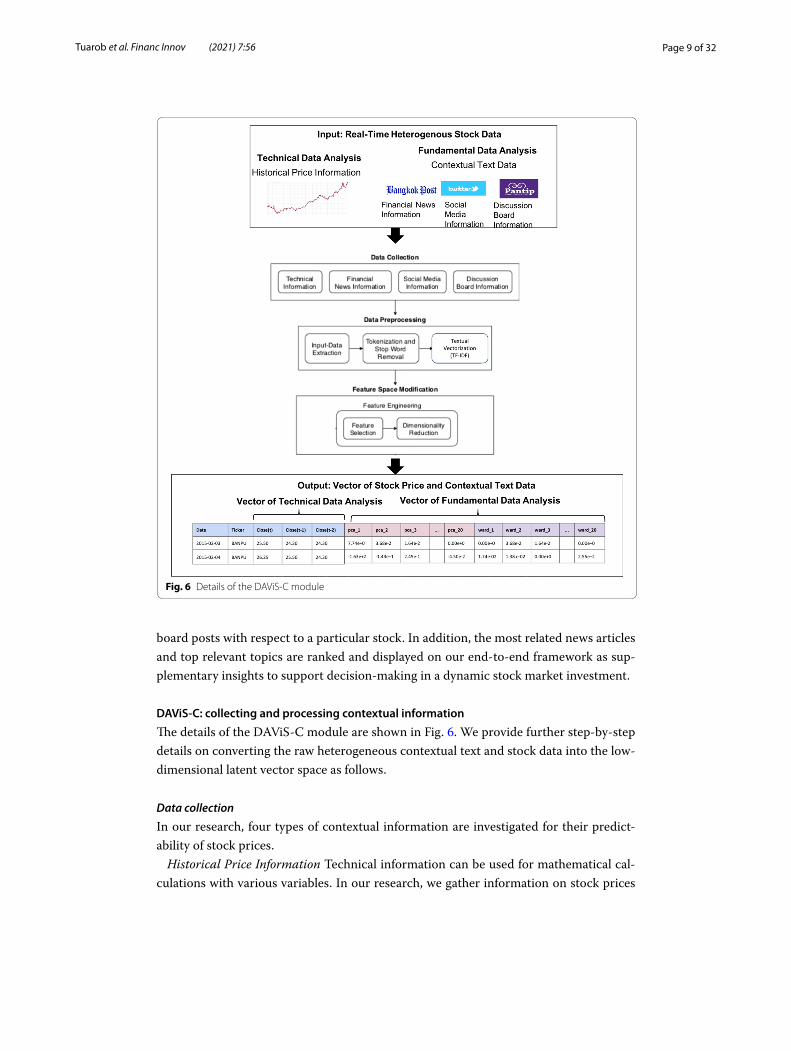
board posts with respect to a particular stock. In addition, the most related news articles and top relevant topics are ranked and displayed on our end-to-end framework as sup-plementary insights to support decision-making in a dynamic stock market investment.
DAViS‑C: collecting and processing contextual information
The details of the DAViS-C module are shown in Fig. 6. We provide further step-by-step details on converting the raw heterogeneous contextual text and stock data into the low-dimensional latent vector space as follows.
Data collection
In our research, four types of contextual information are investigated for their predict-ability of stock prices.
Historical Price Information Technical information can be used for mathematical cal-culations with various variables. In our research, we gather information on stock prices
Fig. 6 Details of the DAViS-C module
Page 10 of 32Tuarob et al. Financ Innov (2021) 7:56
using the application programming interface (API) to download historical stock data from the SiamChart5 website, with a focus on seven attributes: date, opening price, high-est price, lowest price, closing price, adjusted closing price, and trading volume.
Financial News Information Financial news often reports important events that may directly and/or indirectly affect a company’s stock price. Publicly available news arti-cles from reliable news sources such as Kaohoon6 and Money Channel7 are routinely crawled. To minimize the assumption of a news article’s metadata, only common attrib-utes such as the news ID, textual header, content, timestamp, and news source are parsed and stored. A news article is mapped to corresponding companies by detecting the pres-ence of stock symbols in the news content; it is a common protocol for financial news sources to include related stock symbols in the corresponding news articles.
Social Media Information: Investors often express their opinions on social networks. In this research, Twitter messages (or tweets) are used as social media information. The open-source Get Old Tweets8 is used to collect public tweets. To allow the methodol-ogy to be generalized to other social media platforms, only common social media infor-mation such as textual content and timestamp is extracted and stored. User-identifiable information such as usernames and mentions are removed before storing and further processing.
Discussion Board Informatio: Discussion boards are used to exchange opinions on a company’s situation, which may or may not be related to stock prices. A discussion thread comprises the main post and a sequence of comments. Such information could be used to infer the current sentiment toward a particular company. Pantip9 discussion forum is used in our research due to its public availability and popularity among Thai investors. Based on our observations, the messages and discussed topics usually con-tain or are related to facts and company news that could be indicators for stock price movements. Furthermore, the overall sentiment expressed by users also indicates the situation of the mentioned companies and, subsequently, their stock movements. For our study, only public discussion threads that mention stock symbols are collected, with user-identifiable information, such as usernames, removed prior to storing and further processing.
Data preprocessing
In this section, the techniques used in data pre-processing are explained. These tech-niques can be divided into three steps.
Input-Data Extraction This phase refers to the process of extracting useful content from the crawled HTML pages using an HTML parser. With the help of Python Beauti-fulSoup410 library, a document object model (DOM) traversal is used to extract neces-sary information by defining the ID, class, or tag that the content belongs to. Following
8 https:// github. com/ Jeffe rson- Henri que/ GetOl dTwee ts- python.9 https:// www. pantip. com.10 https:// pypi. python. org/ pypi/ beaut ifuls oup4.
5 http:// www. siamc hart. com.6 https:// www. kaoho on. com.7 http:// www. money chann el. co. th.
Page 11 of 32Tuarob et al. Financ Innov (2021) 7:56
this, the timestamp is extracted to show when the article was released, which could help to visualize the connection between the data and the prices in a storyline format.
Tokenization and Stop Word Removal Tokenization or word segmentation is one of the first processes in traditional natural language processing (NLP). While effective tokeni-zation tools are available for standard languages such as English, most algorithms for tokenizing Thai text are still under investigation (Tuarob and Mitrpanont 2017; Nora-set et al. 2021). In our work, the Thai word segmentation open-source model devel-oped by the National Electronics and Computer Technology Center (NECTEC), namely LexTo (Thai Lexeme Tokenizer)11 is used to tokenize the text. LexTo is a dictionary-based tokenizer that implements the longest matching algorithm. A textual document is mapped to corresponding companies using stock symbol detection. Information per-taining to each company is also extracted in this step.
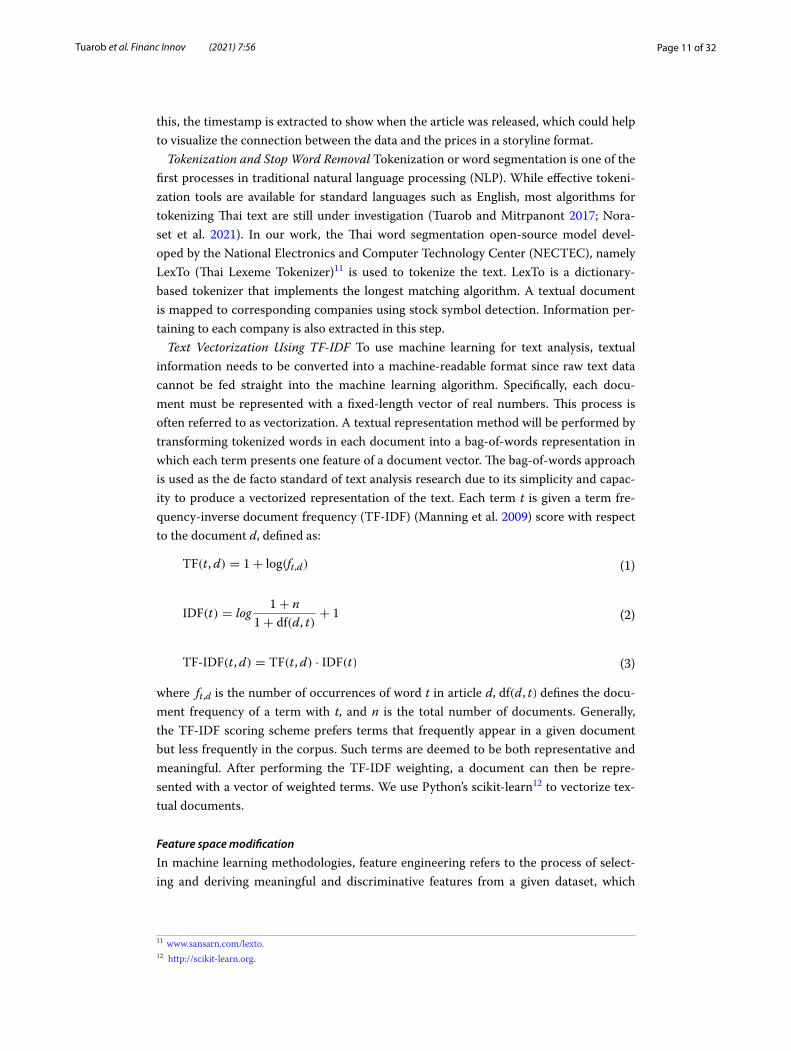
Text Vectorization Using TF-IDF To use machine learning for text analysis, textual information needs to be converted into a machine-readable format since raw text data cannot be fed straight into the machine learning algorithm. Specifically, each docu-ment must be represented with a fixed-length vector of real numbers. This process is often referred to as vectorization. A textual representation method will be performed by transforming tokenized words in each document into a bag-of-words representation in which each term presents one feature of a document vector. The bag-of-words approach is used as the de facto standard of text analysis research due to its simplicity and capac-ity to produce a vectorized representation of the text. Each term t is given a term fre-quency-inverse document frequency (TF-IDF) (Manning et al. 2009) score with respect to the document d, defined as:
where ft,d is the number of occurrences of word t in article d, df(d, t) defines the docu-ment frequency of a term with t, and n is the total number of documents. Generally, the TF-IDF scoring scheme prefers terms that frequently appear in a given document but less frequently in the corpus. Such terms are deemed to be both representative and meaningful. After performing the TF-IDF weighting, a document can then be repre-sented with a vector of weighted terms. We use Python’s scikit-learn12 to vectorize tex-tual documents.
Feature space modification
In machine learning methodologies, feature engineering refers to the process of select-ing and deriving meaningful and discriminative features from a given dataset, which
(1)TF(t, d) = 1+ log(ft,d)
(2)IDF(t) = log1+ n
1+ df(d, t)+ 1
(3)TF-IDF(t, d) = TF(t, d) · IDF(t)
11 www. sansa rn. com/ lexto.12 http:// scikit- learn. org.
Page 12 of 32Tuarob et al. Financ Innov (2021) 7:56
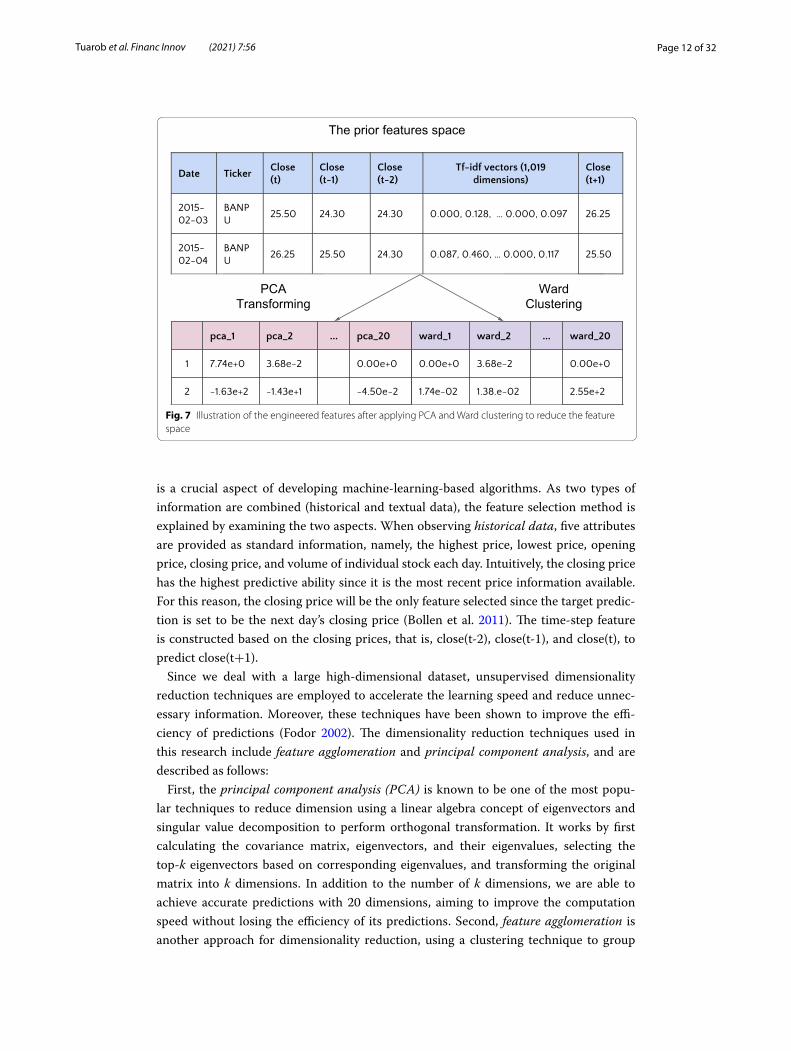
is a crucial aspect of developing machine-learning-based algorithms. As two types of information are combined (historical and textual data), the feature selection method is explained by examining the two aspects. When observing historical data, five attributes are provided as standard information, namely, the highest price, lowest price, opening price, closing price, and volume of individual stock each day. Intuitively, the closing price has the highest predictive ability since it is the most recent price information available. For this reason, the closing price will be the only feature selected since the target predic-tion is set to be the next day’s closing price (Bollen et al. 2011). The time-step feature is constructed based on the closing prices, that is, close(t-2), close(t-1), and close(t), to predict close(t+1).
Since we deal with a large high-dimensional dataset, unsupervised dimensionality reduction techniques are employed to accelerate the learning speed and reduce unnec-essary information. Moreover, these techniques have been shown to improve the effi-ciency of predictions (Fodor 2002). The dimensionality reduction techniques used in this research include feature agglomeration and principal component analysis, and are described as follows:
First, the principal component analysis (PCA) is known to be one of the most popu-lar techniques to reduce dimension using a linear algebra concept of eigenvectors and singular value decomposition to perform orthogonal transformation. It works by first calculating the covariance matrix, eigenvectors, and their eigenvalues, selecting the top-k eigenvectors based on corresponding eigenvalues, and transforming the original matrix into k dimensions. In addition to the number of k dimensions, we are able to achieve accurate predictions with 20 dimensions, aiming to improve the computation speed without losing the efficiency of its predictions. Second, feature agglomeration is another approach for dimensionality reduction, using a clustering technique to group
Fig. 7 Illustration of the engineered features after applying PCA and Ward clustering to reduce the feature space
Page 13 of 32Tuarob et al. Financ Innov (2021) 7:56
similar features. The Ward hierarchical clustering technique is used to perform feature agglomeration by minimizing the variance of the clusters rather than calculating dis-tances between features. In addition to the number of k clusters, we also define 21 clus-ters based on the assumption that each cluster represents each of the 21 company stocks in our experimentation dataset. In short, while the feature agglomeration produces clus-ters of features, the principal component analysis allows us to filter out noisy features based on how significant the variance is and how spread-out they are.
As a result of feature engineering, the feature space is reduced to 40 dimensions that are derived from the integration of two-dimensional reduction techniques (the first 20 dimensions come from the principal component analysis (PCA), and the other 20 dimensions come from Ward hierarchical agglomerative clustering), as illustrated in Fig. 7.
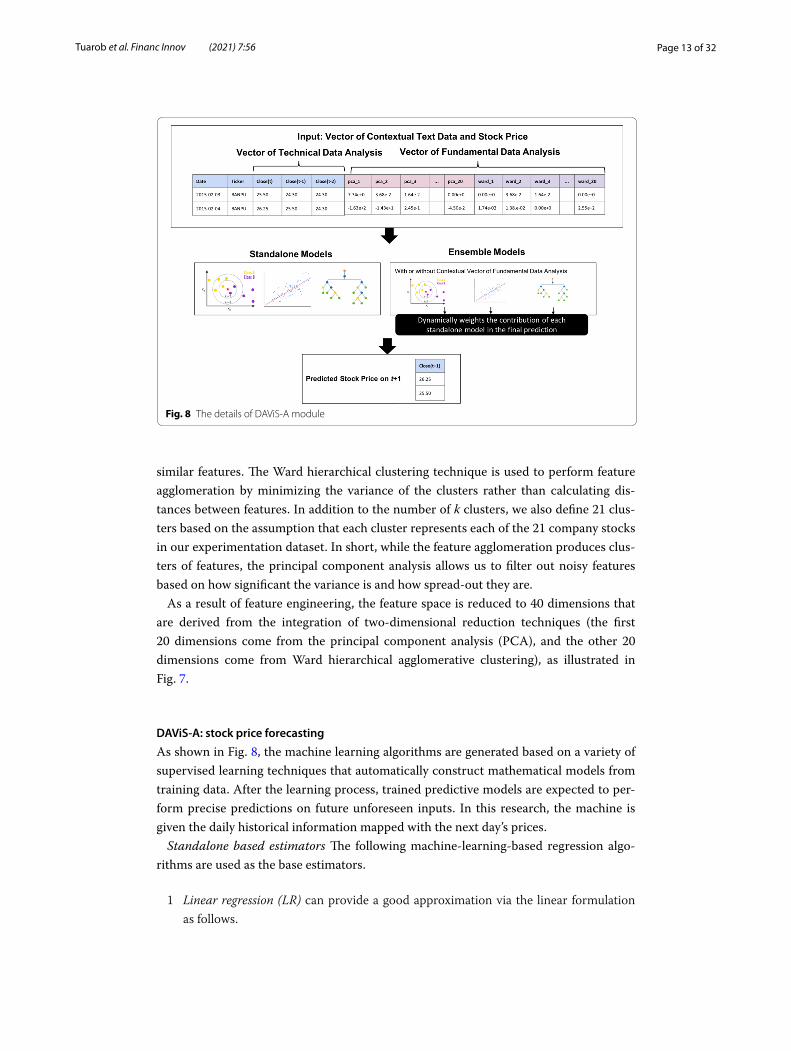
DAViS‑A: stock price forecasting
As shown in Fig. 8, the machine learning algorithms are generated based on a variety of supervised learning techniques that automatically construct mathematical models from training data. After the learning process, trained predictive models are expected to per-form precise predictions on future unforeseen inputs. In this research, the machine is given the daily historical information mapped with the next day’s prices.
Standalone based estimators The following machine-learning-based regression algo-rithms are used as the base estimators.
1 Linear regression (LR) can provide a good approximation via the linear formulation as follows.
Fig. 8 The details of DAViS-A module
Page 14 of 32Tuarob et al. Financ Innov (2021) 7:56
where Yi refers to the predicted value, and ( w1,w2,w3, . . . ,wp ) refer to the coeffi-cients corresponding to individual features or variables. In addition to the learning criteria, the linear regression will be able to fit into the model, as it has the objec-tive to minimize the residual sum of squares (RSS) between the actual and predicted stock prices as shown in Eq. 5.
A more robust version of linear regression is called the Huber regression, designed to overcome regular linear regressions which are highly sensitive to noises or outliers. We use Huber regression to perform ensemble stacking in the subsequent section.
2 Bayesian Ridge regression (BAY) is a generalized linear estimator that works by com-puting a probabilistic model with the ℓ2 regularization used in ridge regression.
3 Decision Tree (DT) is a tree-based estimator and one of the most common machine learning techniques. The method is executed by creating decision rules and branch-ing the tree into many levels of depth. However, the tree depth varies directly in line with the model complexity. A highly complex model can lead to a high variation or so-called “over-fitting.”
4 Random Forest (RF) is based on an ensemble learning technique with multiple deci-sion trees. In this model, the “forest” refers to a multitude of decision trees that are used to randomly select features and sub-samples from a dataset. Therefore, the Ran-dom Forest algorithm may have a lower risk of over-fitting than the individual deci-sion tree algorithms due to the incorporated randomness.
5 k-Nearest Neighbors regression (k-NN) is an instance-based estimator that finds the k-nearest neighbors in the training data to make a prediction.
6 Adaptive Boosting (AdaBoost) is an ensemble learning method (also known as meta-learning), which was initially created to increase the efficiency of binary classifiers. AdaBoost uses an iterative approach to learn from the mistakes of weak classifiers and turn them into strong ones.
7 Gradient Boosting (GB) is a boosting-based estimator based on sequential modeling that aims to reduce errors from previous models by adding stronger models, which works to decrease the estimator’s bias.
8 Extreme Gradient Boosting (XGB) is known to optimize gradient boosting by ena-bling a parallel tree boosting technique that has outperformed general machine learning models in many cases; it has become widely used among data scientists in the industry.
Ensemble Estimators After the base machine learning estimators are trained, and their hyperparameters are tuned, experiments will be performed on the following ensem-ble learning techniques to combine all base learners, and the results will be evalu-ated to achieve a robust ensemble model. As illustrated in Fig. 8, when attempting to integrate the individual base learners, the dynamic ensemble approach called meta-regressor will be employed to combine multiple machine learning models. First, the
(4)Yi = w0 + w1X1 + · · · + wpXp
(5)RSS =
(
1
n
) n∑
i=1
(yi − Yi)2
Page 15 of 32Tuarob et al. Financ Innov (2021) 7:56
outputs of all the standalone models become the inputs of the meta-regressor. Then the meta-regressor will learn to estimate the weights of different models. In other words, it will determine which models perform well or poorly based on given input data. The meta-regressor is a more effective way to use and outperform the individ-ual estimators since it can dynamically handle complex stock data. Furthermore, the Huber regressor, used as the meta-regressor, can tolerate the noises and outliners of stock data.
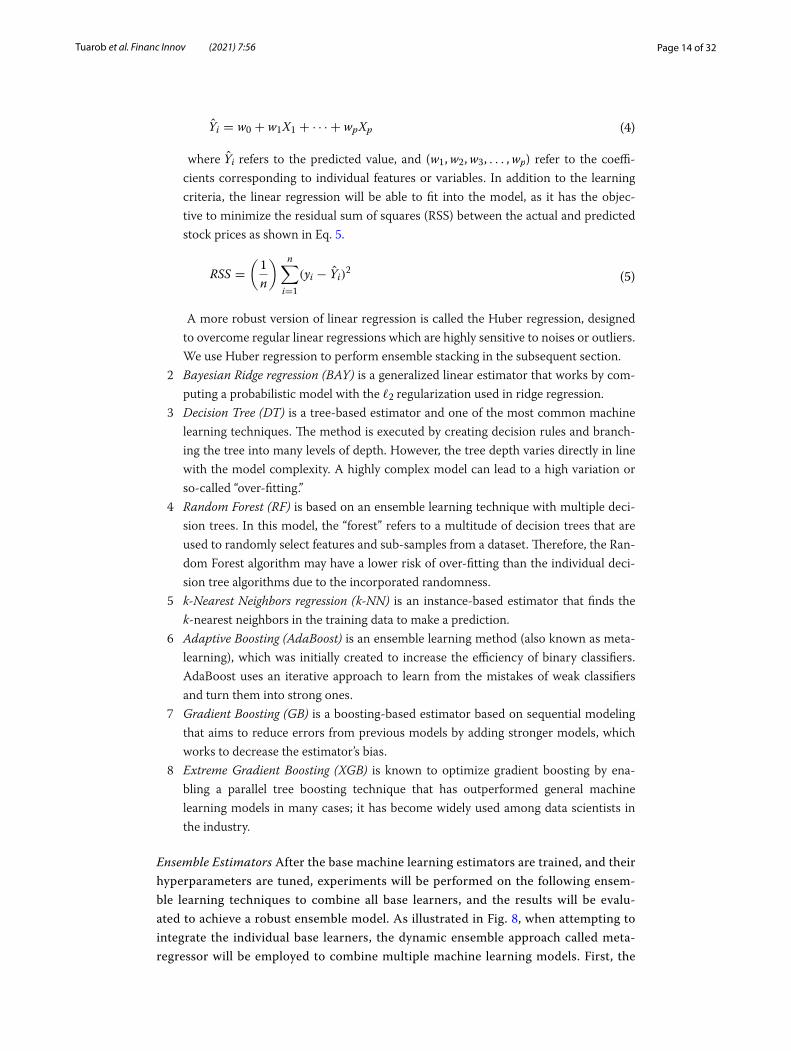
We propose two variants of DAViS-A denoted as (1) DAViS-A-wo-c and (2) DAViS-A-w-c. The difference between these two variants is the integration of the contex-tual text data into the meta-regressor in the ensemble estimator. Figure 9a shows the
Fig. 9 Two variants of DAViS-A model architecture
Page 16 of 32Tuarob et al. Financ Innov (2021) 7:56
model architecture of DAViS-A-wo-c. It utilizes the predicted stock prices from stan-dalone models as inputs to the meta-regressor. Then, the meta-regressor attentively weights the contribution of each standalone model and returns the final predicted stock price as output. In contrast, in DAViS-A-w-c, as shown in Fig. 9b, we further incorporate the standalone prediction results with the vector of contextual text data to compute a combination of a high-dimensional vector of stock price and contextual text. Then, we decompose the high-dimensional features into lower-dimensional fea-tures via the PCA technique. As a result, the high-dimensional features are encoded into 7-dimensional vectors before applying the meta-regressor to generate the ensem-ble estimator. More details on this parameter setting are described in Experimental result section.
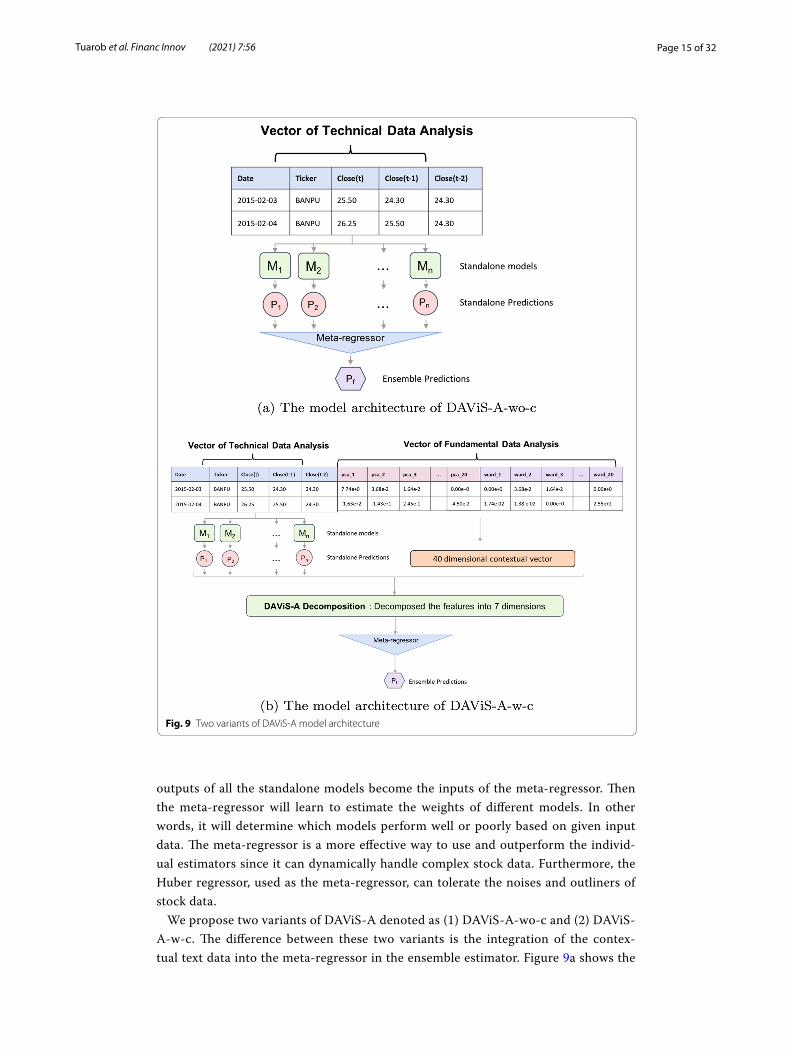
DAViS‑V: stock price visualization
As shown in Fig. 10, after we obtain the predicted stock price in the following days via the DAViS-A module, we perform four sub-tasks to further extract useful information for real-time stock prediction.
Financial sentiment analysis
As sentiments have continuously driven the financial market, the news and public sen-timent are digested to explicate the relationship between sentiments and stock prices (Zha et al. 2021). The analyses are divided into different classes corresponding to each source of information as follows:
• The news sentiment refers to the sentiment of the news article itself, which is catego-rized into three classes, namely, positive, negative, and neutral. For example, news that reports a company’s revenue growth is deemed positive while an article that reports an event that could jeopardize a company’s income or reputation is treated as negative. However, news articles that do not convey any direction of the stock move-
Fig. 10 The details of DAViS-V module
Page 17 of 32Tuarob et al. Financ Innov (2021) 7:56
ments are classified as neutral, such as general news of an overview of the daily mar-ket that lists daily stock prices.
• The public sentiment is extracted from public comments pertaining to each individ-ual stock. The classifier detects both positive and negative sentiments in a thread.
News informativeness analysis
Due to uncategorized news information or insufficient evidence for classification, news categorization based on its informativeness becomes crucial in our news-analy-sis system. The system categorizes news articles into three classes as follows:
• The report category refers to news that may come from primary information sources or reporters. Such sources merely report business activities or announce-ments such as company earnings, industry statistics, and other corporate news.
• The review category refers to articles that provide stock reviews. The security reviews can be provided by analysts or brokers. Stock reviews usually provide information on the analysis of the companies, suggested trading strategies, and target prices.
• The market category refers to news articles that discuss the current situation of the overall financial market and do not target any particular stock or company.
DAViS-V’s Classification Methods used in Sect 4.3.1 and 4.3.2: To process the afore-mentioned financial information, the machine learning methodology is applied to automate the system analyses. In addition, the machine learning algorithms of our system are based on a supervised learning method, whereby the machine is super-vised or trained from provided training samples to perform classification on unseen data. For the comparison of learning algorithms, we use three representative classifi-cation algorithms from different classification families:
• Naïve Bayes (NB), a probability-based classifier, represents each document as a probability-weighted vector of words. One of the benefits of Naïve Bayes is its
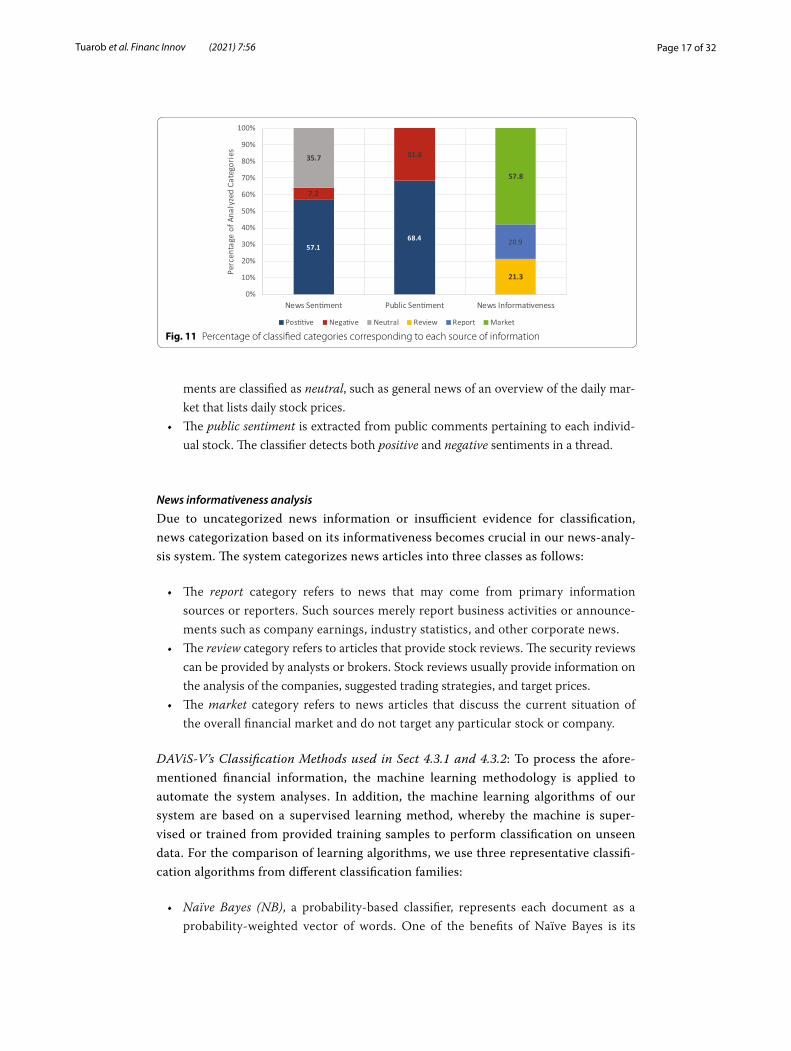
Fig. 11 Percentage of classified categories corresponding to each source of information
Page 18 of 32Tuarob et al. Financ Innov (2021) 7:56
simple architecture, which enables the model to scale and adapt quickly to the changes of new datasets.
• Random Forest, a tree-based classifier, has been shown to perform well on text classification tasks due to its ability to avoid overfitting issues.
• Support Vector Machine (SVM), a function-based classifier, has been used exten-sively and shown in previous studies to be effective for text classification (Colas and Brazdil 2006). The operation behind the SVM algorithm is to find hyper-planes that maximize the margin of labeling-data points of any class.
Document scoring analysis
A well-formulated ranking scoring is needed for the information retrieval system to retrieve and rank news articles relevant to users’ needs. Our proposed ranking scheme is incorporated with an automated document classifier where we utilize the text analysis classes to compute the weight of each document. Consequently, the weight of each class is examined to find its best value.
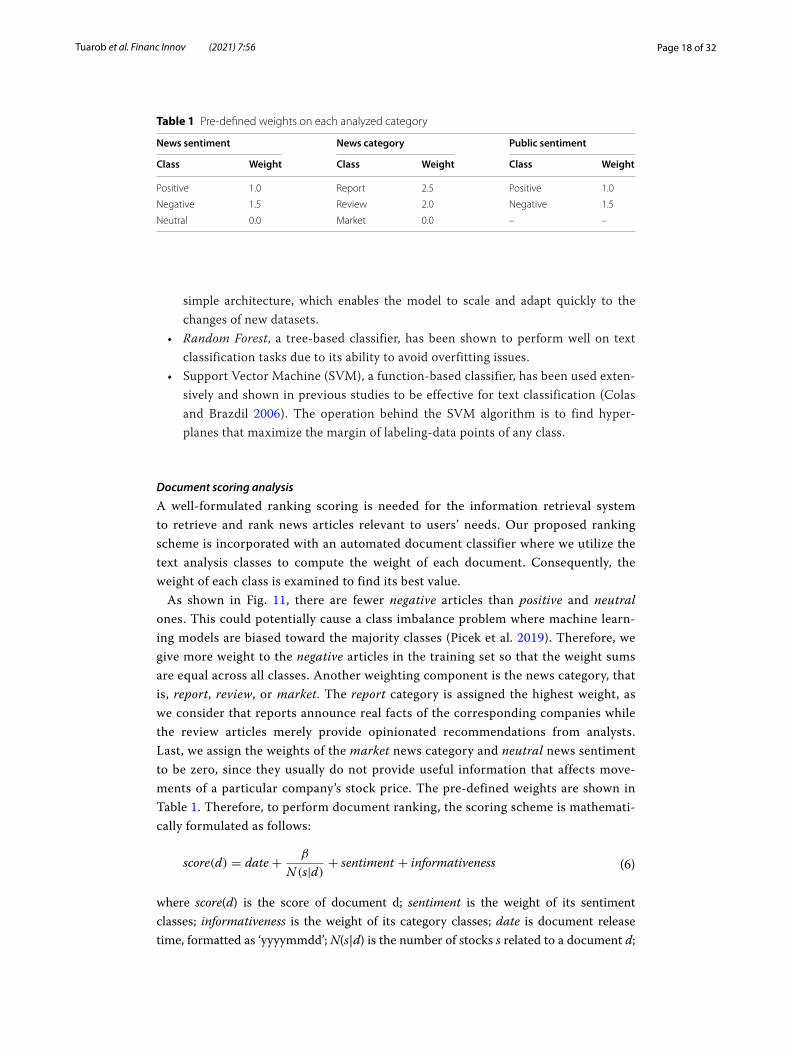
As shown in Fig. 11, there are fewer negative articles than positive and neutral ones. This could potentially cause a class imbalance problem where machine learn-ing models are biased toward the majority classes (Picek et al. 2019). Therefore, we give more weight to the negative articles in the training set so that the weight sums are equal across all classes. Another weighting component is the news category, that is, report, review, or market. The report category is assigned the highest weight, as we consider that reports announce real facts of the corresponding companies while the review articles merely provide opinionated recommendations from analysts. Last, we assign the weights of the market news category and neutral news sentiment to be zero, since they usually do not provide useful information that affects move-ments of a particular company’s stock price. The pre-defined weights are shown in Table 1. Therefore, to perform document ranking, the scoring scheme is mathemati-cally formulated as follows:
where score(d) is the score of document d; sentiment is the weight of its sentiment classes; informativeness is the weight of its category classes; date is document release time, formatted as ‘yyyymmdd’; N(s|d) is the number of stocks s related to a document d;
(6)score(d) = date +β
N (s|d)+ sentiment + informativeness
Table 1 Pre-defined weights on each analyzed category
News sentiment News category Public sentiment
Class Weight Class Weight Class Weight
Positive 1.0 Report 2.5 Positive 1.0
Negative 1.5 Review 2.0 Negative 1.5
Neutral 0.0 Market 0.0 – –
Page 19 of 32Tuarob et al. Financ Innov (2021) 7:56
β is the bias factor, which is a pre-defined weight scheme added to compute the inverse relation of N(s|d), and is set to 5.0 by default.
Topic modeling analysis
Latent Dirichlet Allocation (LDA) is a topic-modeling algorithm that represents a docu-ment as a mixture of various topics, each of which is a distribution of term probabilities. LDA has been widely used in text mining applications, such as extracting important key phrases (Liu et al. 2010), recommending citations (Huang et al. 2014), and measuring topical document similarity (Tuarob et al. 2021). By utilizing the topic-modeling algo-rithm, the usefulness of this technique in the field of financial topic discovery is exam-ined, where new terms or insights can be detected ahead of time. Therefore, the LDA algorithm is formulated to obtain the probability of term wi being in the document d, given by P(wi|d) , as follows:
For the implementation, we apply the TwittDict algorithm proposed by Tuarob et al. (2015), which is an extension of Latent Dirichlet Allocation (LDA) (Blei et al. 2003b) that extracts emerging social-oriented key phrase semantics from Twitter messages. Such key phrases extracted from a corpus of news articles are ranked based on their prevalence
(7)P(wi|d) =
|Z|∑
j=1
P(wi|zi = j) · P(zi = j|d)
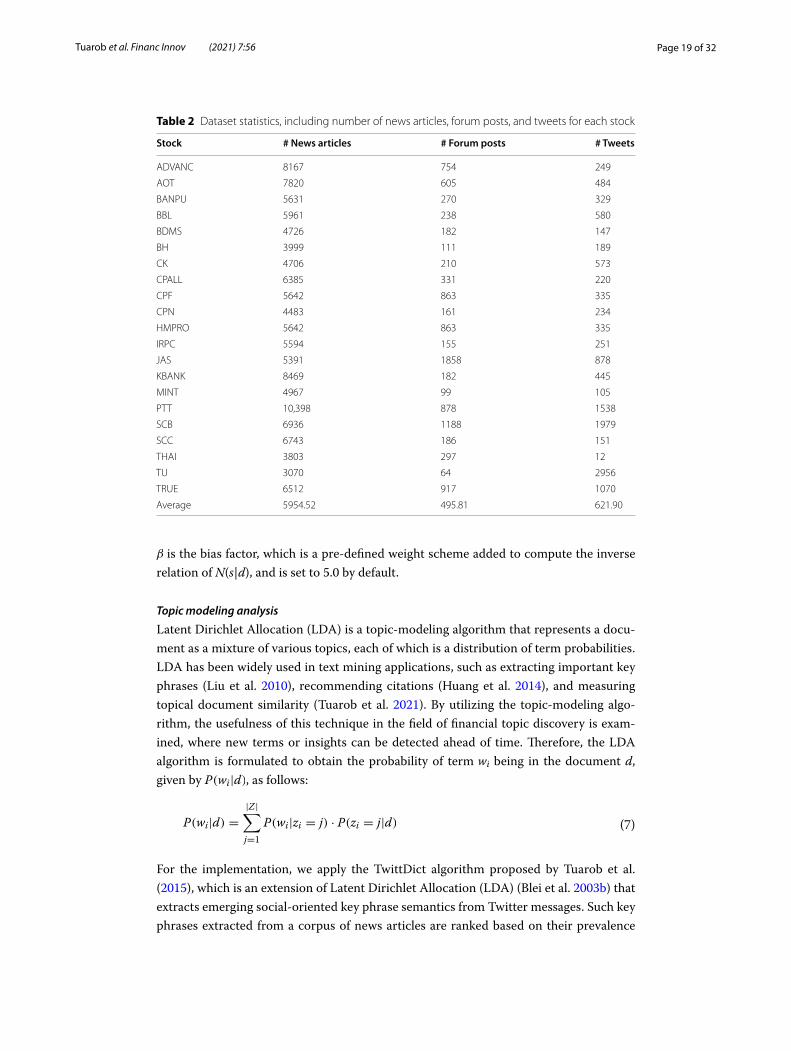
Table 2 Dataset statistics, including number of news articles, forum posts, and tweets for each stock
Stock # News articles # Forum posts # Tweets
ADVANC 8167 754 249
AOT 7820 605 484
BANPU 5631 270 329
BBL 5961 238 580
BDMS 4726 182 147
BH 3999 111 189
CK 4706 210 573
CPALL 6385 331 220
CPF 5642 863 335
CPN 4483 161 234
HMPRO 5642 863 335
IRPC 5594 155 251
JAS 5391 1858 878
KBANK 8469 182 445
MINT 4967 99 105
PTT 10,398 878 1538
SCB 6936 1188 1979
SCC 6743 186 151
THAI 3803 297 12
TU 3070 64 2956
TRUE 6512 917 1070
Average 5954.52 495.81 621.90
Page 20 of 32Tuarob et al. Financ Innov (2021) 7:56
probability. Top key phrases are used to generate a tag cloud that captures the current topics prevalently discussed in the news.
In summary, we perform four sub-tasks in order to provide more insights to inves-tors. Our end-to-end stock prediction system provides an easy-to-interpret visualization summarizing the predicted stock prices with supporting information extracted by the DAViS-V module.
Experimental setupDataset statistics
In this section, the dataset statistics of particular sources of information are described, for example, news articles from Kaohoon and Money Channel news sources, social media posts from Twitter, and discussion board posts from Pantip as detailed in Table 2. Looking at the news sources, the data were collected from December 2014 to February 2018, comprising 123,506 data points. Twitter’s data were collected from January 2014 to February 2018, containing 12,776 data points. Finally, for Pantip, the data were col-lected from January 2014 to February 2018, consisting of 14,192 data points. The abbre-viations of all the selected stock companies are as follows: BANPU,PTT,KBANK,AOT,CPF,TU,CPN,CPALL,BDMS,ADVANC,TRUE,IRPC,BBL,SCB,THAI,MINT,SCC,C
K,HMPRO,BH, and JAS. The stock companies used in this study cover various sectors, including technology, transportation, energy, financial, health care, real estate, goods/service, and agriculture. The selected stocks have the highest market cap in each sector and sufficient corresponding textual data (i.e., news articles, forum posts, and tweets) to validate our proposed techniques.
Evaluation metrics
In this section, the performance metrics used to evaluate the predictions, in terms of both the magnitude of the error and directional accuracy, are described as follows:
• Mean Absolute Percentage Error (MAPE) is an error-based measurement that calcu-lates the absolute error by percentage with respect to the actual value.
• Directional Accuracy (DA) provides a measurement of prediction direction accuracy. The predicted values can be considered positive or negative directions.
Models configuration and hyperparameters tuning
This section further explains how these estimators are trained and integrated into the system, and how the hyperparameters are tuned. In addition to machine learning
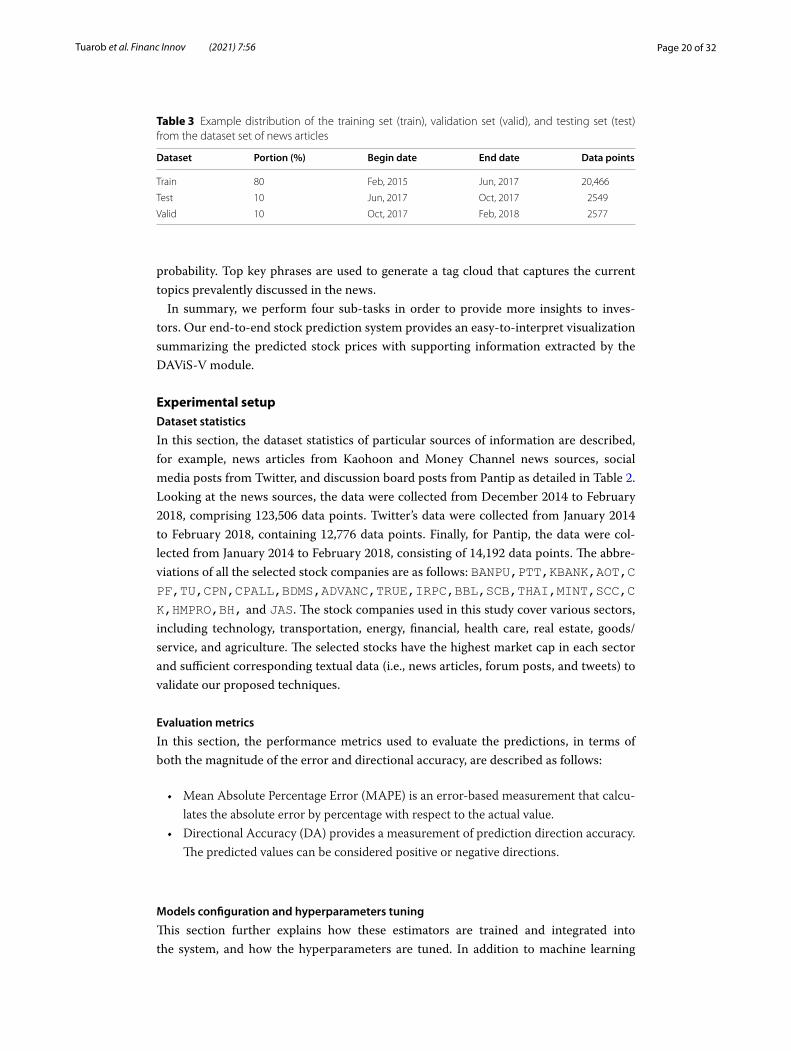
Table 3 Example distribution of the training set (train), validation set (valid), and testing set (test) from the dataset set of news articles
Dataset Portion (%) Begin date End date Data points
Train 80 Feb, 2015 Jun, 2017 20,466
Test 10 Jun, 2017 Oct, 2017 2549
Valid 10 Oct, 2017 Feb, 2018 2577
Page 21 of 32Tuarob et al. Financ Innov (2021) 7:56
methodology, hyperparameter tuning or optimization is crucial since these parameters control the model’s complexity, capacity to learn, and resource utilization.
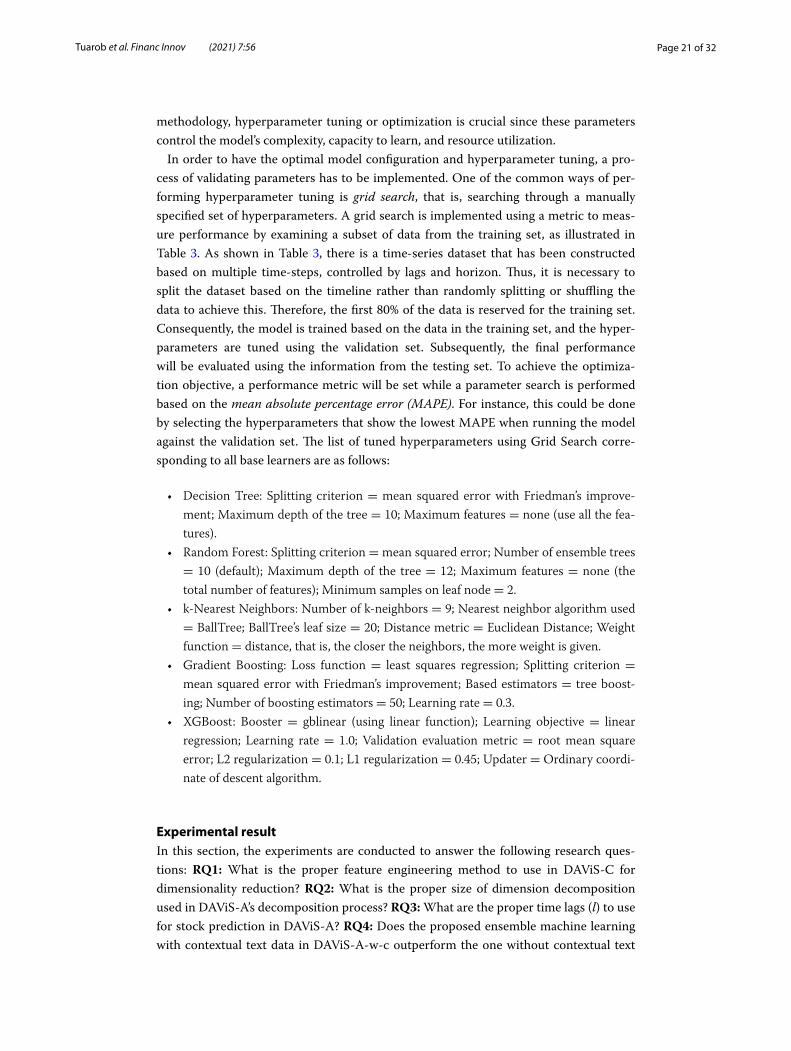
In order to have the optimal model configuration and hyperparameter tuning, a pro-cess of validating parameters has to be implemented. One of the common ways of per-forming hyperparameter tuning is grid search, that is, searching through a manually specified set of hyperparameters. A grid search is implemented using a metric to meas-ure performance by examining a subset of data from the training set, as illustrated in Table 3. As shown in Table 3, there is a time-series dataset that has been constructed based on multiple time-steps, controlled by lags and horizon. Thus, it is necessary to split the dataset based on the timeline rather than randomly splitting or shuffling the data to achieve this. Therefore, the first 80% of the data is reserved for the training set. Consequently, the model is trained based on the data in the training set, and the hyper-parameters are tuned using the validation set. Subsequently, the final performance will be evaluated using the information from the testing set. To achieve the optimiza-tion objective, a performance metric will be set while a parameter search is performed based on the mean absolute percentage error (MAPE). For instance, this could be done by selecting the hyperparameters that show the lowest MAPE when running the model against the validation set. The list of tuned hyperparameters using Grid Search corre-sponding to all base learners are as follows:
• Decision Tree: Splitting criterion = mean squared error with Friedman’s improve-ment; Maximum depth of the tree = 10; Maximum features = none (use all the fea-tures).
• Random Forest: Splitting criterion = mean squared error; Number of ensemble trees = 10 (default); Maximum depth of the tree = 12; Maximum features = none (the total number of features); Minimum samples on leaf node = 2.
• k-Nearest Neighbors: Number of k-neighbors = 9; Nearest neighbor algorithm used = BallTree; BallTree’s leaf size = 20; Distance metric = Euclidean Distance; Weight function = distance, that is, the closer the neighbors, the more weight is given.
• Gradient Boosting: Loss function = least squares regression; Splitting criterion = mean squared error with Friedman’s improvement; Based estimators = tree boost-ing; Number of boosting estimators = 50; Learning rate = 0.3.
• XGBoost: Booster = gblinear (using linear function); Learning objective = linear regression; Learning rate = 1.0; Validation evaluation metric = root mean square error; L2 regularization = 0.1; L1 regularization = 0.45; Updater = Ordinary coordi-nate of descent algorithm.
Experimental resultIn this section, the experiments are conducted to answer the following research ques-tions: RQ1: What is the proper feature engineering method to use in DAViS-C for dimensionality reduction? RQ2: What is the proper size of dimension decomposition used in DAViS-A’s decomposition process? RQ3: What are the proper time lags (l) to use for stock prediction in DAViS-A? RQ4: Does the proposed ensemble machine learning with contextual text data in DAViS-A-w-c outperform the one without contextual text
Page 22 of 32Tuarob et al. Financ Innov (2021) 7:56
data in DAViS-A-wo-c? RQ5: How do the different types of contextual text data affect stock prediction performance? RQ6: How well does the DAViS-V classification task perform on financial sentiment analysis and news informative analysis? RQ7: How well does DAViS-V perform in the document scoring task? RQ8: How well does DAViS-V perform in the topic modeling task? RQ9: Can our proposed ensemble machine learning approach in DAViS-A provide interpretable results to stock investors? RQ10: Can our
Fig. 12 Sensitivity of DAViS hyperparameters
Table 4 The MAPE and DA performance of DAViS-A-w-c (with contextual text data) on individual stocks
Stocks MAPE (%) DA (%) Stocks MAPE (%) DA (%)
BANPU 0.97 58 IRPC 1.27 37
PTT 0.50 59 BBL 0.57 53
KBANK 0.84 60 SCB 0.74 57
AOT 1.28 55 THAI 1.56 61
CPF 1.17 47 MINT 0.92 53
TU 0.85 60 SCC 0.69 54
CPN 1.07 61 CK 0.96 58
CPALL 0.53 49 HMPRO 1.07 55
BDMS 0.86 51 BH 0.90 50
ADVANC 0.74 64 JAS 0.89 46
TRUE 1.27 54 Avg. 0.93 54
Page 23 of 32Tuarob et al. Financ Innov (2021) 7:56
end-to-end DAViS framework provide useful insights for investors to make real-time decisions on stock investments?
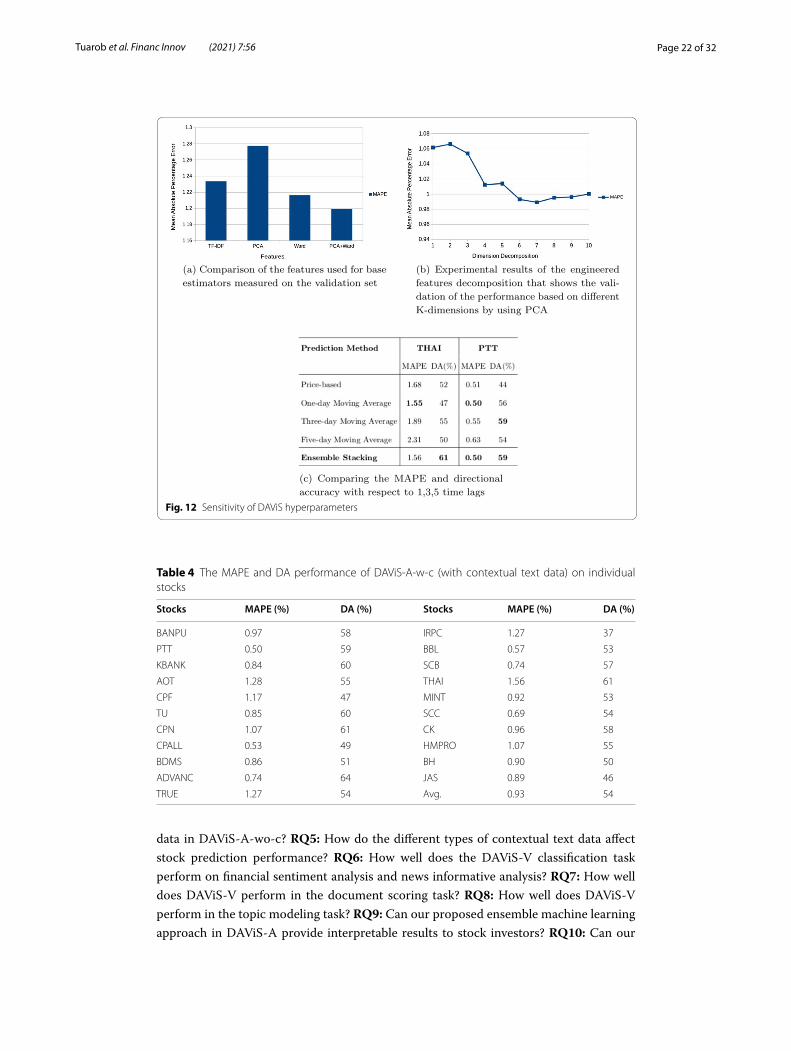
The sensitivity of the proposed model hyperparameters (RQ1,RQ2,RQ3)
As shown in Fig. 12a, to supervise the predictive models, we incorporated price and tex-tual features. After the elementary features were prepared, the identified features are then evaluated, including the bag-of-words features with TF-IDF term weighting, only PCA, only Ward clustering, and the combination of PCA and Ward features. Since the combination of PCA and Ward yields the best MAPE of 1.20 on the validation set, we use this combination as our feature engineering method in DAViS-C. Figure 12b and c show that when DAViS-A’s dimension decomposition and the time lag (l) are set to 7 and 3, respectively, we obtain the best MAPE value. Therefore, these parameters are used in our prediction task.
The effectiveness of incorporating contextual text data into ensemble stock machine
learning (RQ4)
In this section, we first provide an overview performance of DAViS-A-w-c for indi-vidual stocks in Table 4. Note that the bottom-right values show the average results
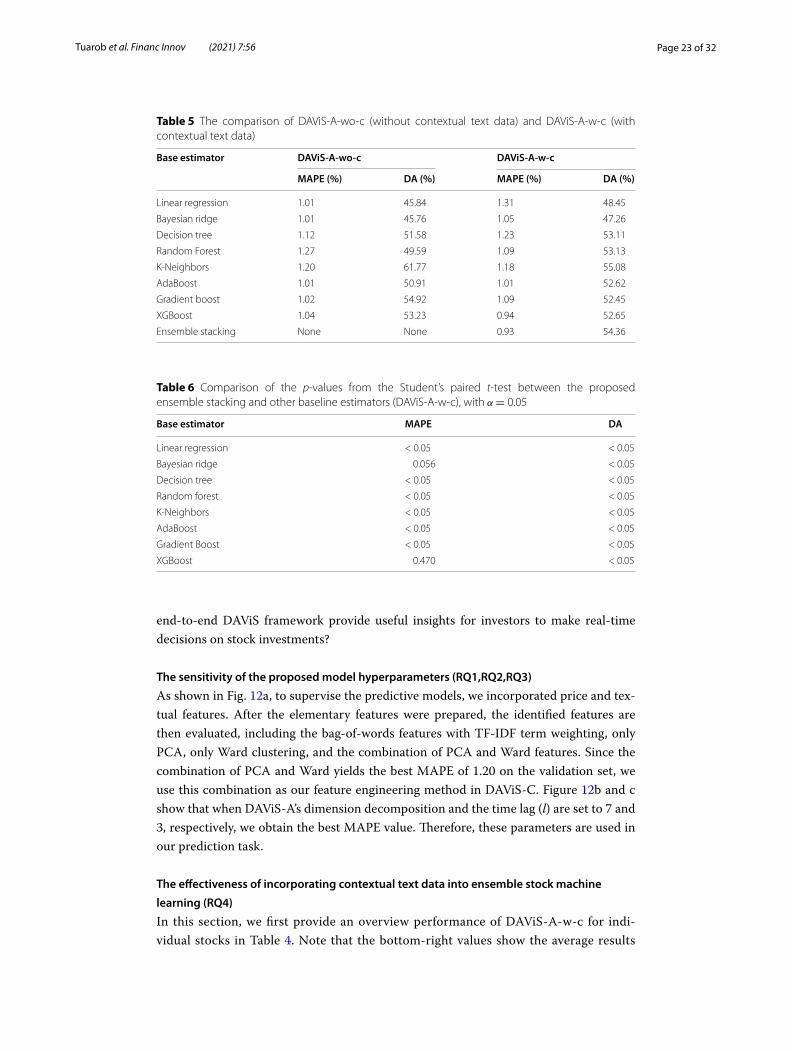
Table 5 The comparison of DAViS-A-wo-c (without contextual text data) and DAViS-A-w-c (with contextual text data)
Base estimator DAViS‑A‑wo‑c DAViS‑A‑w‑c
MAPE (%) DA (%) MAPE (%) DA (%)
Linear regression 1.01 45.84 1.31 48.45
Bayesian ridge 1.01 45.76 1.05 47.26
Decision tree 1.12 51.58 1.23 53.11
Random Forest 1.27 49.59 1.09 53.13
K-Neighbors 1.20 61.77 1.18 55.08
AdaBoost 1.01 50.91 1.01 52.62
Gradient boost 1.02 54.92 1.09 52.45
XGBoost 1.04 53.23 0.94 52.65
Ensemble stacking None None 0.93 54.36
Table 6 Comparison of the p-values from the Student’s paired t-test between the proposed ensemble stacking and other baseline estimators (DAViS-A-w-c), with α = 0.05
Base estimator MAPE DA
Linear regression < 0.05 < 0.05
Bayesian ridge 0.056 < 0.05
Decision tree < 0.05 < 0.05
Random forest < 0.05 < 0.05
K-Neighbors < 0.05 < 0.05
AdaBoost < 0.05 < 0.05
Gradient Boost < 0.05 < 0.05
XGBoost 0.470 < 0.05
Page 24 of 32Tuarob et al. Financ Innov (2021) 7:56
of all stocks corresponding to each metric. The contextual text data used in DAViS-A-w-c includes all text from news articles, social media messages, and discussion board posts. Next, we analyze the performance comparison between the ensemble stock machine learning prediction with and without contextual text data denoted as DAViS-A-wo-c and DAViS-A-w-c, respectively. Table 5 shows that DAViS-A-w-c could outperform all base estimators in terms of error-based performance metrics by yielding a MAPE of 0.93% and a DA of 54.36%. Statistical tests shown in Table 6
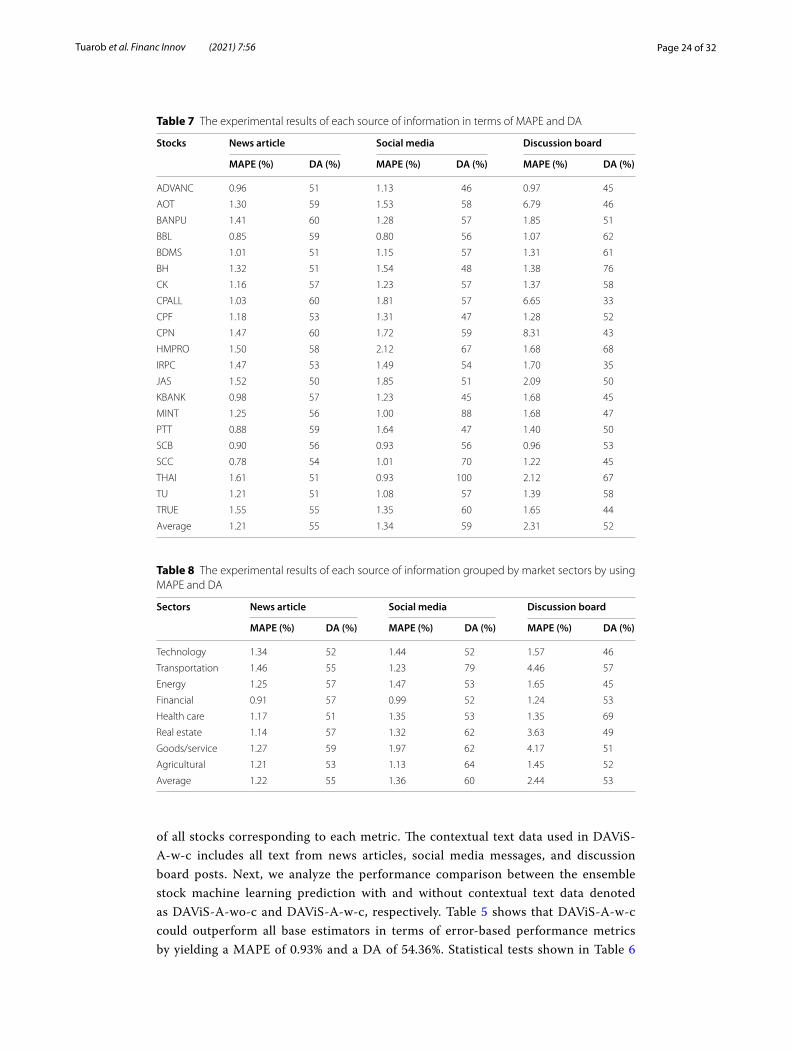
Table 7 The experimental results of each source of information in terms of MAPE and DA
Stocks News article Social media Discussion board
MAPE (%) DA (%) MAPE (%) DA (%) MAPE (%) DA (%)
ADVANC 0.96 51 1.13 46 0.97 45
AOT 1.30 59 1.53 58 6.79 46
BANPU 1.41 60 1.28 57 1.85 51
BBL 0.85 59 0.80 56 1.07 62
BDMS 1.01 51 1.15 57 1.31 61
BH 1.32 51 1.54 48 1.38 76
CK 1.16 57 1.23 57 1.37 58
CPALL 1.03 60 1.81 57 6.65 33
CPF 1.18 53 1.31 47 1.28 52
CPN 1.47 60 1.72 59 8.31 43
HMPRO 1.50 58 2.12 67 1.68 68
IRPC 1.47 53 1.49 54 1.70 35
JAS 1.52 50 1.85 51 2.09 50
KBANK 0.98 57 1.23 45 1.68 45
MINT 1.25 56 1.00 88 1.68 47
PTT 0.88 59 1.64 47 1.40 50
SCB 0.90 56 0.93 56 0.96 53
SCC 0.78 54 1.01 70 1.22 45
THAI 1.61 51 0.93 100 2.12 67
TU 1.21 51 1.08 57 1.39 58
TRUE 1.55 55 1.35 60 1.65 44
Average 1.21 55 1.34 59 2.31 52
Table 8 The experimental results of each source of information grouped by market sectors by using MAPE and DA
Sectors News article Social media Discussion board
MAPE (%) DA (%) MAPE (%) DA (%) MAPE (%) DA (%)
Technology 1.34 52 1.44 52 1.57 46
Transportation 1.46 55 1.23 79 4.46 57
Energy 1.25 57 1.47 53 1.65 45
Financial 0.91 57 0.99 52 1.24 53
Health care 1.17 51 1.35 53 1.35 69
Real estate 1.14 57 1.32 62 3.63 49
Goods/service 1.27 59 1.97 62 4.17 51
Agricultural 1.21 53 1.13 64 1.45 52
Average 1.22 55 1.36 60 2.44 53
Page 25 of 32Tuarob et al. Financ Innov (2021) 7:56
confirm that the performance of our proposed ensemble stacking estimator is statisti-cally significantly different from that of the other baseline estimators, especially in terms of DA. We also observed that including contextual text data in DAViS-A-w-c could improve the stock prediction performance by large margins.
Analysis of the impact of different types of contextual data (RQ5)
This section investigates the efficiency of integrating each source of information from news articles, Twitter messages (i.e., Tweets), and Pantip posts. In this experiment, we enabled each type of contextual text data at a time in DAViS-A-w-c. Table 7 shows that news infor-mation yields the best performance in terms of error-based metrics, with a MAPE of 1.21% on average. However, social media information (i.e., Twitter) achieves the highest direc-tional accuracy with an average of 59%. Moreover, the discussion board (i.e., Pantip) seems to have the lowest efficiency in terms of both MAPE and DA. Based on further investiga-tion, this might be due to the nature of the discussion board, where an author creates a topic or post on which other people comment/reply. Hence, it was discovered that, particu-larly with Pantip posts, random opinions/sentiments from investors that carried less infor-mation compared to the news articles were quite prevalent. In addition, we grouped stocks based on their market sectors and performed another experiment to observe the impact of contextual data on different business sectors. As presented in Table 8, we observe that inte-grating news articles and social media contextual data into our proposed DAViS-A model could improve the stock prediction results while including discussion board data has less impact on performance improvement. Specifically, we found that incorporating news arti-cles in the business sectors related to technology, transportation, energy, financial, and real
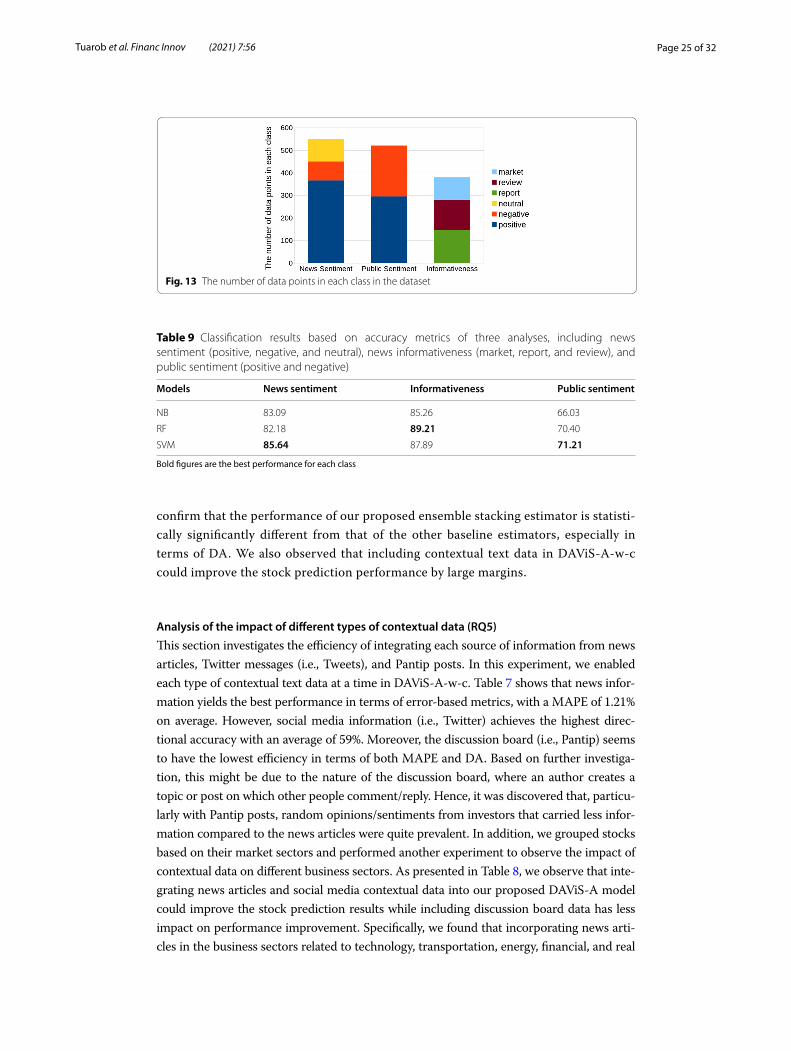
Fig. 13 The number of data points in each class in the dataset
Table 9 Classification results based on accuracy metrics of three analyses, including news sentiment (positive, negative, and neutral), news informativeness (market, report, and review), and public sentiment (positive and negative)
Bold figures are the best performance for each class
Models News sentiment Informativeness Public sentiment
NB 83.09 85.26 66.03
RF 82.18 89.21 70.40
SVM 85.64 87.89 71.21
Page 26 of 32Tuarob et al. Financ Innov (2021) 7:56
estate while incorporating social media posts in the business sectors related to health care, goods/service, and agriculture could improve the stock prediction performance.
Analysis of the performance of DAViS‑V classification task on financial sentiment analysis
and news informative analysis (RQ6)
To evaluate the performance of three different machine learning algorithms, a tenfold cross-validation technique is applied to randomly partition our dataset into 10 subsam-ples. Then the evaluation results from the ten folds are averaged. In addition, the data-set used for evaluating the contextual classification comprises 550 news sentiment-type articles, 380 news informativeness-type articles, and 521 public sentiment-type articles. Dataset statistics are shown in Fig. 13. For measurement metrics, classification accuracy is used to evaluate the correctness of classifiers.
As seen in Table 9, first, Random Forest has the highest news informativeness accu-racy score (89.21%). Second, Support Vector Machine has the highest news and public sentiment accuracy scores; 85.64% and 71.21%, respectively. Finally, to measure the aver-age classification accuracy of the three tasks, SVM yields the highest average accuracy (81.58%), while RF and NB have average accuracies of 80.60% and 78.13%, respectively.
In addition, we notice that the news classification task yields higher accuracy than the public sentiment classification from the discussion board. Two major factors could explain why discussed messages are harder to analyze. The first factor is that news arti-cles commonly use a formal writing style and are structured in a consistent pattern. Equally important, the second factor is the high level of noise generated by misspelled words in informal discussions on message boards. These spelling errors could affect text analysis processes, which add spurious non-standard words to the feature space, leading to reduced learning efficacy. The other discussion result is the fact that news informa-tiveness can yield significantly high accuracy. From observation, those three categories have their own uniqueness, which usually has the same patterns of trivially distinguish-able keywords. For instance, in the review category, statements like “Analysts said com-pany X is strongly recommended” are commonly used. Thus, there are quite obvious feature words that help the machine to better identify the differences between classes.
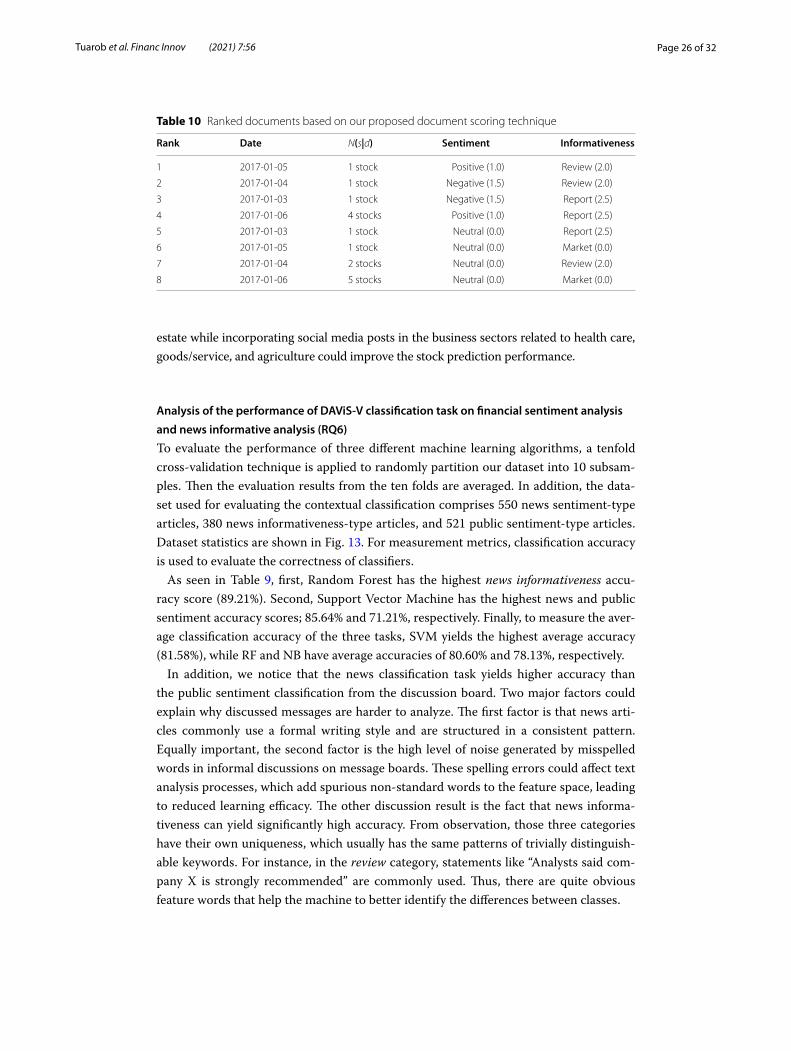
Table 10 Ranked documents based on our proposed document scoring technique
Rank Date N(s|d) Sentiment Informativeness
1 2017-01-05 1 stock Positive (1.0) Review (2.0)
2 2017-01-04 1 stock Negative (1.5) Review (2.0)
3 2017-01-03 1 stock Negative (1.5) Report (2.5)
4 2017-01-06 4 stocks Positive (1.0) Report (2.5)
5 2017-01-03 1 stock Neutral (0.0) Report (2.5)
6 2017-01-05 1 stock Neutral (0.0) Market (0.0)
7 2017-01-04 2 stocks Neutral (0.0) Review (2.0)
8 2017-01-06 5 stocks Neutral (0.0) Market (0.0)
Page 27 of 32Tuarob et al. Financ Innov (2021) 7:56
Analysis on the performance of DAViS‑V in the document scoring task (RQ7)
This section investigates whether the formulated document scoring equation can be applied in practice and how different weights perform in comparison. Accordingly, ana-lyzed news articles are collected and sorted by scores. To demonstrate the calculation, a set of dummy data is generated with their tags and info, including date, news sentiment, news informativeness, and the number of related stocks. The results of news articles scoring and ranking are listed in Table 10.
To discuss the analysis of the parameters shown in the scoring function (Eq. 6), a rami-fication on the variance of each parameter is clarified as follows:
• date: set as exogenous feedback where the article is generally ranked based on recency.
• sentiment & informativeness: the sentiment and the informativeness parameters are weighted on the gravity of each class, where some classes are ranked higher than oth-ers. In addition, the overall weights of news informativeness are set higher than the sentiment classes. This is because informativeness, such as that in news reports, is found to be more important than examining its sentiment alone.
• N(s|d): as N(s|d) refers to the number of companies related to a document. It has been found that articles that refer to too many companies are less meaningful. For instance, the statement “Today’s top 5 most active stocks are A, B, C, D, and E” will be given a lower score. Thus, N(s|d) is placed as the divisor of β that infers an inverse relationship with the increase in the number of mentioned companies.
• β : the β variable defines the importance of the inverse relation of N(s|d). Thus, there is no different weight between higher and lower N(s|d) values if β equals zero.
Analysis of the performance of DAViS‑V in the topic modeling task (RQ8)
To determine the effectiveness of the key phrases extracted by the TwittDict algorithm, the articles related to a given company are collected to perform topic discovery. The
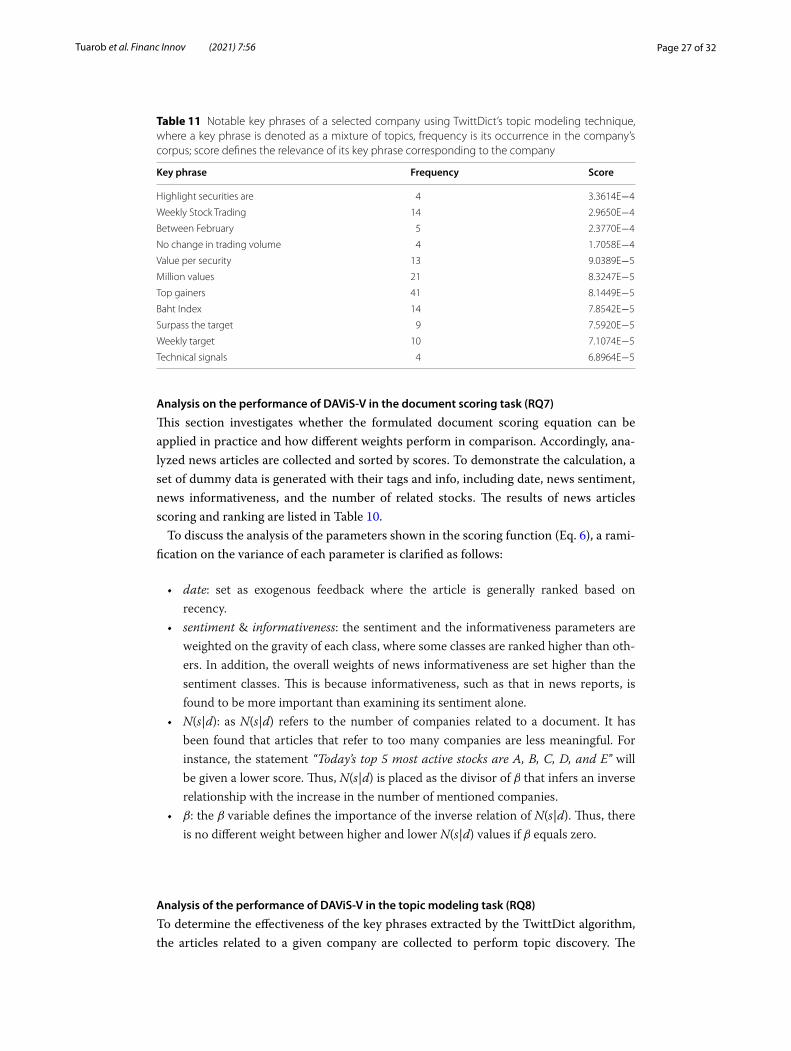
Table 11 Notable key phrases of a selected company using TwittDict’s topic modeling technique, where a key phrase is denoted as a mixture of topics, frequency is its occurrence in the company’s corpus; score defines the relevance of its key phrase corresponding to the company
Key phrase Frequency Score
Highlight securities are 4 3.3614E−4
Weekly Stock Trading 14 2.9650E−4
Between February 5 2.3770E−4
No change in trading volume 4 1.7058E−4
Value per security 13 9.0389E−5
Million values 21 8.3247E−5
Top gainers 41 8.1449E−5
Baht Index 14 7.8542E−5
Surpass the target 9 7.5920E−5
Weekly target 10 7.1074E−5
Technical signals 4 6.8964E−5
Page 28 of 32Tuarob et al. Financ Innov (2021) 7:56
textual content in each article is tokenized and fed to the TwittDict algorithm to gener-ate topical-oriented key phrases.
As seen in Table 11, most of the key phrases might not convey sufficient information. This might be because imbalanced news articles are generated each day, as illustrated in Fig. 11. Thus, the topic modeling could be misled by a high volume of the market news category. Although the extracted key phrases do not provide meaningful messages to investors, it is undeniable that there would be potential benefits if this topic mod-eling approach can discover emerging insightful information early. Therefore, a possible improvement would be to equip the system with the ability to automatically perform document filtering and extract valuable topics.
Analysis of interpretable machine learning (RQ9)
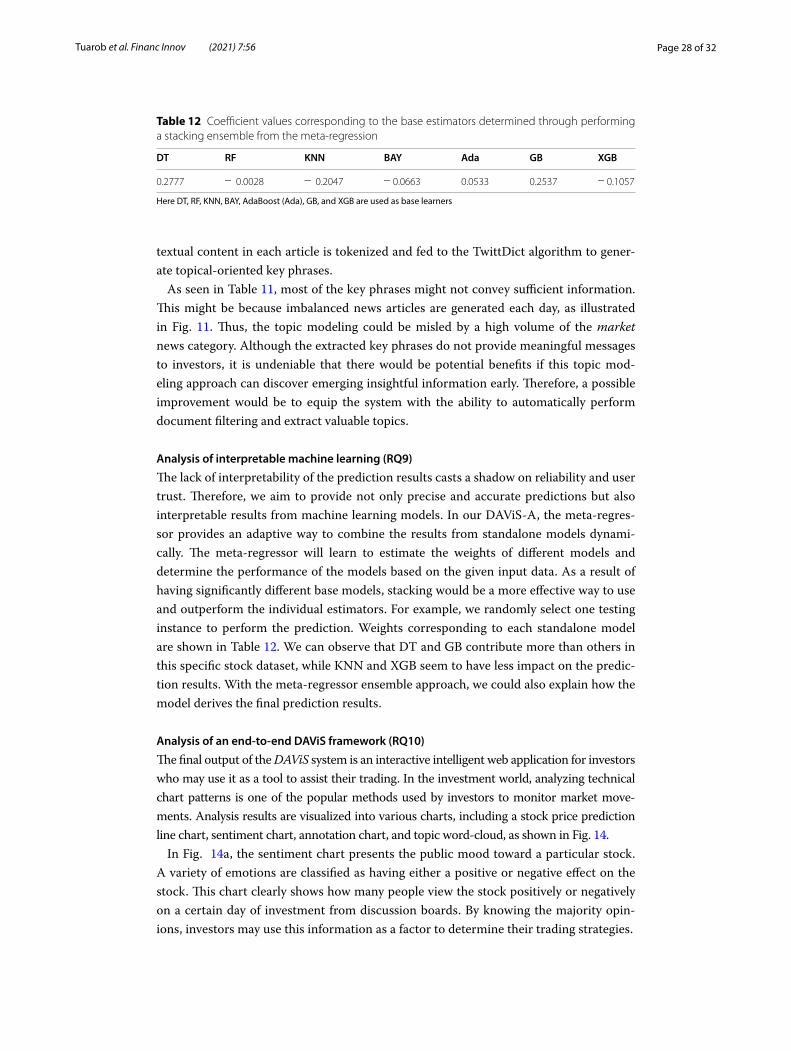
The lack of interpretability of the prediction results casts a shadow on reliability and user trust. Therefore, we aim to provide not only precise and accurate predictions but also interpretable results from machine learning models. In our DAViS-A, the meta-regres-sor provides an adaptive way to combine the results from standalone models dynami-cally. The meta-regressor will learn to estimate the weights of different models and determine the performance of the models based on the given input data. As a result of having significantly different base models, stacking would be a more effective way to use and outperform the individual estimators. For example, we randomly select one testing instance to perform the prediction. Weights corresponding to each standalone model are shown in Table 12. We can observe that DT and GB contribute more than others in this specific stock dataset, while KNN and XGB seem to have less impact on the predic-tion results. With the meta-regressor ensemble approach, we could also explain how the model derives the final prediction results.
Analysis of an end‑to‑end DAViS framework (RQ10)
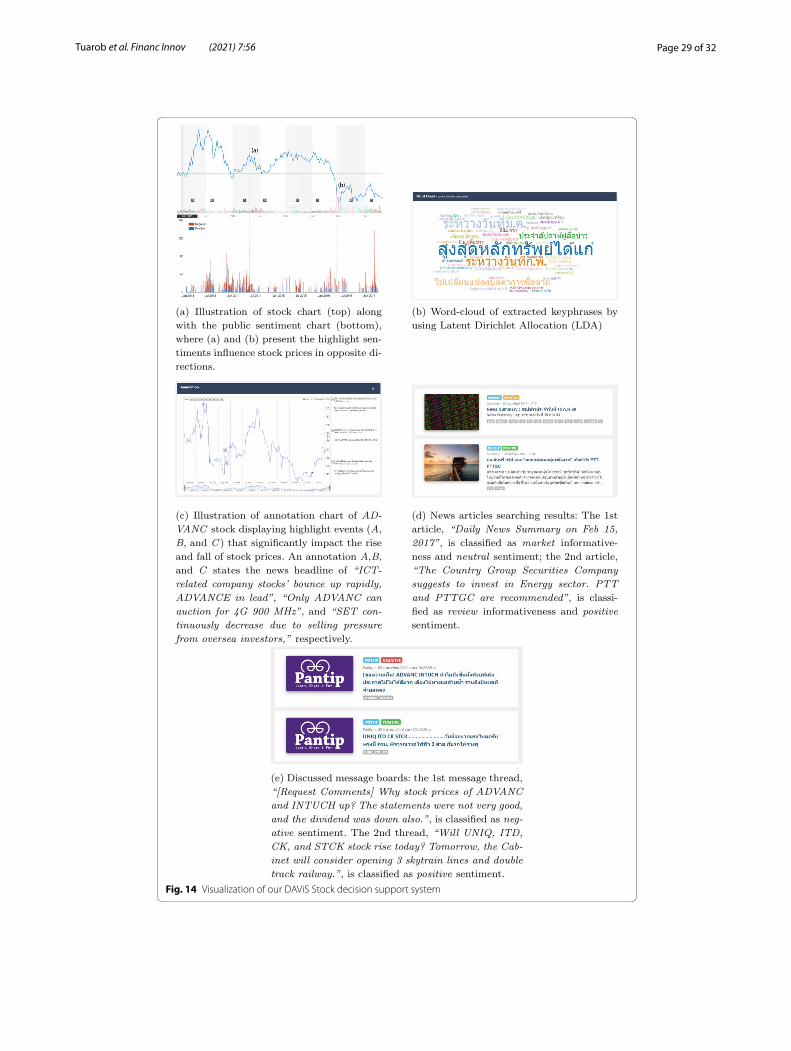
The final output of the DAViS system is an interactive intelligent web application for investors who may use it as a tool to assist their trading. In the investment world, analyzing technical chart patterns is one of the popular methods used by investors to monitor market move-ments. Analysis results are visualized into various charts, including a stock price prediction line chart, sentiment chart, annotation chart, and topic word-cloud, as shown in Fig. 14.
In Fig. 14a, the sentiment chart presents the public mood toward a particular stock. A variety of emotions are classified as having either a positive or negative effect on the stock. This chart clearly shows how many people view the stock positively or negatively on a certain day of investment from discussion boards. By knowing the majority opin-ions, investors may use this information as a factor to determine their trading strategies.
Table 12 Coefficient values corresponding to the base estimators determined through performing a stacking ensemble from the meta-regression
Here DT, RF, KNN, BAY, AdaBoost (Ada), GB, and XGB are used as base learners
DT RF KNN BAY Ada GB XGB
0.2777 − 0.0028 − 0.2047 − 0.0663 0.0533 0.2537 − 0.1057
Page 29 of 32Tuarob et al. Financ Innov (2021) 7:56
Fig. 14 Visualization of our DAViS Stock decision support system

Page 30 of 32Tuarob et al. Financ Innov (2021) 7:56
As illustrated in Fig. 14b, the word cloud defines a group of key phrases generated using the TwittDict algorithm, which prevalently appears on financial news and message boards. The size of each key phrase is represented by the calculated prevalence probabil-ity, where larger words indicate higher scores.
As shown in Fig. 14c, the annotation chart allows investors to observe the collection of related news that causes each specific stock price to change over time. As a result, inves-tors may discover the news patterns and styles that have a major effect on the prices. This kind of chart can be expressed on top of the technical stock chart with marked points to note the associated news. Figure 14c displays the annotation chart of ADVANC stock in the SET market. There are three points of interest, labelled as A, B, and C. Posi-tion A demonstrates that the stock price goes up to the noted point due to the support of positive news toward ADVANC, displayed on the right, marked A. Point B illustrates a behavior similar to A, but due to a different company’s situation. However, it is different in terms of the downward peak C where the news captured by the system is a negative news article toward the entire market. Therefore, there is no doubt that news marked as C would cause the prices of other stocks to drop as well.
As shown in Fig. 14d and e, the search engine system provides two types of search results, namely financial news articles and financial discussions on discussion boards. The articles are ranked based on the proposed ranking algorithm that filters out irrelevant and less significant articles to help investors access useful financial information. Regarding the details of the interface, there are four main visualized components, including published date, content (i.e., news header and synopsis), stock-related information, and analyzed document tags. Additionally, the document annotation contains two automated tagging results displayed as colored boxes on top of the content headers. Finally, the list of related stocks is displayed as grey boxes at the bottom of each content box.
Conclusions and future directionIn the information age, an enormous amount of information is generated rapidly throughout social media and other websites in a matter of seconds. Manually monitor-ing such a massive amount of information can be tedious. We addressed the challenge of analyzing unstructured data and directed our interest to the financial field. Financial contextual information, including news articles, discussion boards, and social media, is extracted and digested using machine-learning techniques to gain insight into stock markets. As discussed in the prototype model of DAViS, we proposed an interpret-able ensemble stacking of diversified machine-learning-based estimators in combina-tion with an engineered textual transformation using the PCA and Ward hierarchical features to predict the next day’s stock prices. The use of textual analysis with a topic modeling-based technique is applied to extract useful information such as sentiment, informativeness, and key phrases. Finally, we described how documents are scored and ranked based on different variables in our system. Future studies could further develop the system to include even more contextual knowledge and discover predictive signals that could be deployed in an innovative algorithmic trading system. Integrating the pre-diction into a trading strategy and comparing it with existing ones could also further expand the practicality of our proposed methods.
Page 31 of 32Tuarob et al. Financ Innov (2021) 7:56
AcknowledgementsThis research project is supported by Mahidol University (Grant No. MU-MiniRC02/2564). We also appreciate the partial computing resources from Grant No. RSA6280105, funded by Thailand Science Research and Innovation (TSRI), (formerly known as the Thailand Research Fund (TRF)), and the National Research Council of Thailand (NRCT).
Authors’ contributionST originated the research idea, reviewed related literature, proposed the methodology, designed and conducted the experiments, coordinated funding, analyzed the results, and wrote the manuscript. PW, PP, and ST collected the data and implemented the data processing and visualization platforms. SL and TN provided technical guidance and edited the draft. TT, in addition to overseeing the project progress and providing meaningful guidance in terms of both research and implementation, significantly improved the quality of the manuscript and corresponded to the submission. All authors have read and approved the final manuscript.
FundingThis research project is supported by Mahidol University.
Availability of data and materialsThe source code is available for research purposes at https://github.com/suppawong/davis.
Competing interestsThe authors declare that they have no competing interests.
Author details1 Faculty of Information and Communication Technology, Mahidol University, Nakhon Pathom 73170, Thailand. 2 Depart-ment of Industrial Engineering, Ulsan National Institute of Science and Technology, Ulsan 44919, Republic of Korea. 3 Insti-tute for the 4th Industrial Revolution, Ulsan National Institute of Science and Technology, Ulsan 44919, Republic of Korea.
Received: 24 July 2020 Accepted: 23 June 2021
ReferencesAfzali M, Kumar S (2019) Text document clustering: issues and challenges. In 2019 International conference on machine
learning, big data, cloud and parallel computing (COMITCon). IEEE, pp 263–268Akhtar MS, Gupta D, Ekbal A, Bhattacharyya P (2017) Feature selection and ensemble construction: a two-step method
for aspect based sentiment analysis. Knowl Based Syst 125(Supplement C):116–135 (ISSN 0950‑7051)Alhassan J, Abdullahi M, Lawal J (2014) Application of artificial neural network to stock forecasting-comparison with ses
and arima. J Comput Model 4(2):179–190Araque O, Corcuera-Platas I, Sánchez-Rada JF, Iglesias CA (2017) Enhancing deep learning sentiment analysis with ensem-
ble techniques in social applications. Exp Syst Appl 77(Supplement C):236–246 (ISSN 0957‑4174)Blei DM, Ng AY, Jordan MI (2003a) Latent dirichlet allocation. J Mach Learn Res 3(Jan):993–1022Blei DM, Ng AY, Jordan MI (2003b) Latent dirichlet allocation. J Mach Learn Res 3(Jan):993–1022Bollen J, Mao H, Zeng X (2011) Twitter mood predicts the stock market. J Comput Sci 2(1):1–8 (ISSN 1877‑7503)Bomfim AN (2003) Pre-announcement effects, news effects, and volatility: monetary policy and the stock market. J Bank
Finance 27:133–151Camras L (1981) Emotion: theory, research and experience. Am J Psychol 94(2):370–372 (ISSN 00029556)Chattupan A, Netisopakul P (2015) Thai stock news sentiment classification using wordpair features. In: The 29th Pacific
Asia conference on language, information and computation, pp 188–195Cheng C, Xu W, Wang J (2012) A comparison of ensemble methods in financial market prediction. In: 2012 Fifth interna-
tional joint conference on computational sciences and optimization. IEEE, pp 755–759Colas F, Brazdil P (2006) Comparison of svm and some older classification algorithms in text classification tasks. In IFIP
international conference on artificial intelligence in theory and practice. Springer, pp 169–178Fodor IK (2002) A survey of dimension reduction techniques. Center Appl Sci Comput Lawrence Livermore Natl Lab
9:1–18Gopinathan R, Durai S (2019) Stock market and macroeconomic variables: new evidence from India. Financ Innov 5:12.
https:// doi. org/ 10. 1186/ s40854- 019- 0145-1Hagenau M, Liebmann M, Neumann D (2013) Automated news reading: stock price prediction based on financial news
using context-capturing features. Decis Supp Syst 55(3):685–697 (ISSN 0167‑9236)Hu D, Schwabe G, Li X (2015) Systemic risk management and investment analysis with financial network analytics:
research opportunities and challenges. Financ Innov 1:12. https:// doi. org/ 10. 1186/ s40854- 015- 0001-xHuang W, Wu Z, Mitra P, Giles CL (2014) Refseer: a citation recommendation system. In IEEE/ACM joint conference on
digital libraries. IEEE, pp 371–374Jin F, Self N, Saraf P, Butler P, Wang W, Ramakrishnan N (2013) Forex-foreteller: currency trend modeling using news arti-
cles. In: Proceedings of the 19th ACM SIGKDD international conference on knowledge discovery and data mining, KDD ’13. ACM, New York, NY, USA, pp 1470–1473. ISBN 978-1-4503-2174-7
Kou G, Akdeniz ÖO, Dinçer H, Yüksel S (2021) Fintech investments in European banks: a hybrid it2 fuzzy multidimensional decision-making approach. Financ Innov 7(1):1–28
Lertsuksakda R, Netisopakul P, Pasupa K (2014) Thai sentiment terms construction using the hourglass of emotions. In: 2014 6th international conference on knowledge and smart technology (KST), pp 46–50
Li X, Xie H, Chen L, Wang J, Deng X (2014) News impact on stock price return via sentiment analysis. Knowl Based Syst 69(Supplement C):14–23. https:// doi. org/ 10. 1016/j. knosys. 2014. 04. 022 (ISSN 0950‑7051)
Page 32 of 32Tuarob et al. Financ Innov (2021) 7:56
Lim S, Tucker CS (2019) Mining twitter data for causal links between tweets and real-world outcomes. Exp Syst Appl X 3:100007Liu Z, Huang W, Zheng Y, Sun M (2010) Automatic keyphrase extraction via topic decomposition. In: Proceedings of the
2010 conference on empirical methods in natural language processing, pp 366–376Manning CD, Raghavan P, Schütze H (2009) Introduction to information retrieval, chapter Stemming and lemmatization
(2.2.4), pp 32–34. Cambridge University Press, Cambridge, EnglandMao H, Counts S, Bollen J (2011) Predicting financial markets: comparing survey, news, twitter and search engine data.
arXiv preprint arXiv: 1112. 1051Nassirtoussi AK, Aghabozorgi S, Wah TY, Ngo DCL (2015) Text mining of news-headlines for forex market prediction: a multi-
layer dimension reduction algorithm with semantics and sentiment. Exp Syst Appl 42(1):306–324 (ISSN 0957‑4174)Nayak RK, Mishra D, Rath AK (2015) A naïve svm-knn based stock market trend reversal analysis for Indian benchmark
indices. Appl Soft Comput 35:670–680Nguyen TH, Shirai K, Velcin J (2015) Sentiment analysis on social media for stock movement prediction. Exp Syst Appl
42(24):9603–9611 (ISSN 0957‑4174)Noraset T, Lowphansirikul L, Tuarob S (2021) Wabiqa: a wikipedia-based thai question-answering system. Inf Process
Manag 58(1):102431Nti IK, Adekoya AF, Weyori BA (2020) Efficient stock-market prediction using ensemble support vector machine. Open
Comput Sci 10(1):153–163. https:// doi. org/ 10. 1515/ comp- 2020- 0199Picek S, Heuser A, Jovic A, Bhasin S, Regazzoni F (2019) The curse of class imbalance and conflicting metrics with machine
learning for side-channel evaluations. IACR Trans Cryptogr Hardware Embed Syst 2019(1):1–29Schumaker RP, Zhang Y, Huang C-N, Chen H (2012) Evaluating sentiment in financial news articles. Decis Supp Syst
53(3):458–464 (ISSN 0167‑9236)Seker SE, Mert C, Al-Naami K, Ayan U, Ozalp N (2013) Ensemble classification over stock market time series and economy
news. In: 2013 IEEE international conference on intelligence and security informatics. IEEE, pp 272–273Selvamuthu D, Kumar V, Mishra A (2019) Indian stock market prediction using artificial neural networks on tick data.
Financ Innov 5:12. https:// doi. org/ 10. 1186/ s40854- 019- 0131-7Stoean C, Paja W, Stoean R, Sandita A (2019) Deep architectures for long-term stock price prediction with a heuristic-
based strategy for trading simulations. PLoS ONE 14(10):e0223593Tuarob S, Mitrpanont JL (2017) Automatic discovery of abusive thai language usages in social networks. In: International
conference on Asian digital libraries. Springer, pp 267–278Tuarob S, Chu W, Chen D, Tucker C (2015) Twittdict: extracting social oriented keyphrase semantics from twitter. In: Asso-
ciation for computational linguistics (ACL), pp 25–31, 01Tuarob S, Assavakamhaenghan N, Tanaphantaruk W, Suwanworaboon P, Hassan S-U, Choetkiertikul M (2021) Automatic
team recommendation for collaborative software development. Empir Software Eng 26(4):1–53Vu TT, Chang S, Ha QT, Collier N (2012) An experiment in integrating sentiment features for tech stock prediction in twitter. In:
Proceedings of the workshop on information extraction and entity analytics on social media data. Mumbai, pp 23–38Wen F, Xu L, Ouyang G, Kou G (2019) Retail investor attention and stock price crash risk: evidence from China. Int Rev
Financ Anal 65:101376Wu W, Chen J, Xu L, He Q, Tindall M (2019) A statistical learning approach for stock selection in the Chinese stock market.
Financ Innov 5:12. https:// doi. org/ 10. 1186/ s40854- 019- 0137-1Zha Q, Kou G, Zhang H, Liang H, Chen X, Li C-C, Dong Y (2021) Opinion dynamics in finance and business: a literature
review and research opportunities. Financ Innov 6(1):1–22Zhong X, Enke D (2019a) Predicting the daily return direction of the stock market using hybrid machine learning algo-
rithms. Financ Innov 5:12. https:// doi. org/ 10. 1186/ s40854- 019- 0138-0Zhong X, Enke D (2019b) Predicting the daily return direction of the stock market using hybrid machine learning algo-
rithms. Financ Innov 5:12. https:// doi. org/ 10. 1186/ s40854- 019- 0138-0
Publisher’s NoteSpringer Nature remains neutral with regard to jurisdictional claims in published maps and institutional affiliations.