Embed Size (px)
Citation preview

DAVIDE CAMPARI MILANO S.p.A.
Interim report on operations at 31 March 2015


TABLE OF CONTENTS
Highlights ........................................................................................................................................................... 5 Corporate officers .............................................................................................................................................. 7 Interim report on operations ............................................................................................................................ 9
Significant events during the period ............................................................................................................... 9 Sales performance ........................................................................................................................................ 10 Income statement ......................................................................................................................................... 16 Financial position .......................................................................................................................................... 18 Events taking place after the end of the period ........................................................................................... 20 Outlook ......................................................................................................................................................... 21 Information on the figures presented .......................................................................................................... 22 Alternative performance indicators .............................................................................................................. 22 Other information ......................................................................................................................................... 22
Disclaimer This document contains forward-looking statements relating to future events and the operating, economic and financial results of Gruppo Campari. These statements contain an element of risk and uncertainty since, by their very nature, they depend on future events and developments. Actual results may vary significantly from those forecast for a number of reasons, most of which are beyond the Group’s control.


Gruppo Campari - Interim report on operations at 31 March 2015
5
Highlights
31 March 2015 31 March 2014 change % change at
€ million € million %
constant exchange
rates
Net sales 327.4 288.7 13.4% 6.8%
Contribution margin 117.9 103.2 14.3% 8.3%
EBITDA before non-recurring items 56.2 47.1 19.4% 11.5%
EBITDA 60.1 46.1 30.5% 21.3%
Result from recurring activities 44.5 38.3 16.1% 8.7%
Operating result 48.4 37.3 29.8% 20.7%
Operating margin (operating result/net sales) 14.8% 12.9%
Profit before tax 35.9 20.8 72.6% Group profit before tax 35.8 20.7 72.8%
31 March 2015 31 December 2014
€ million € million
Net debt 1,004.4 978.5


Gruppo Campari - Interim report on operations at 31 March 2015
7
Corporate officers
Board of Directors(1)
Luca Garavoglia Chairman Robert Kunze-Concewitz Managing Director and Chief Executive Officer Paolo Marchesini Managing Director and Chief Financial Officer Stefano Saccardi Managing Director and General Counsel & Business Development Officer Eugenio Barcellona Director and member of the Control and Risks Committee
and the Remuneration and Appointments Committee (4)(5)
Camilla Cionini-Visani Director and member of the Control and Risks Committee
and the Remuneration and Appointments Committee(4)(5)(6)
Karen Guerra Director
(6)
Thomas Ingelfinger Director and member of the Control and Risks Committee and the Remuneration and Appointments Committee
(4)(5)(6)
Marco P. Perelli-Cippo Director Board of Statutory Auditors
(2)
Pellegrino Libroia Chairman Enrico Colombo Statutory Auditor Chiara Lazzarini Statutory Auditor Giovanni Bandera Alternate Auditor Graziano Gallo Alternate Auditor Piera Tula Alternate Auditor Independent auditors
(3)
PricewaterhouseCoopers S.p.A. (1) The nine members of the Board of Directors were appointed on 30 April 2013 by the shareholders’ meeting and will remain in office for the three-year period 2013-2015. At the same shareholders’ meeting, Luca Garavoglia was appointed Chairman and granted powers in accordance with the law and the Company’s articles of association. At a meeting held on the same date, the Board of Directors gave Managing Directors Robert Kunze-Concewitz, Paolo Marchesini and Stefano Saccardi
the following powers for three years, until approval of the 2015 financial statements:
individual signature: powers of ordinary representation and management, within the value or time limits established for each type of function; joint signature: powers of representation and management for specific types of function, within the value or time limits deemed to fall outside ordinary activities. (2) The Board of Statutory Auditors was appointed on 30 April 2013 by the shareholders’ meeting for the three-year period 2013-2015. (3) On 30 April 2010, the shareholders’ meeting appointed PricewaterhouseCoopers S.p.A. as its independent auditors for the nine-year period 2010-2018. (4)(5) The Control and Risks Committee and the Remuneration and Appointments Committee were appointed by the Board of Directors on 30 April 2013 for the three-year period 2013-2015. (6) Independent director.

Gruppo Campari - Interim report on operations at 31 March 2015
9
Interim report on operations
Significant events during the period
Acquisitions and sales of companies, brands and distribution rights Sale of non-core businesses in Jamaica On 31 March 2015, the Group completed the sale of the Federated Pharmaceutical Division to Kirk Distributors Limited, for which a sales agreement had been signed on 22 December 2014. The price of the transaction was € 13.0 million, which includes a total price of USD 14.4 million agreed at closing (€ 13.4 million at the exchange rate on the closing date) and post-closing contractual price adjustments of USD 0.4 million (€ 0.4 million). The sale of the business, whose net assets had already been classified as “assets available for sale” at 31 December 2014, generated a capital gain of € 5.0 million, which was classified as non-recurring income in the first quarter of 2015. Sale of non-strategic investment in Jamaica During the quarter, the stake of 33.33% in Jamaica Joint Venture Investment Co. Ltd. in Jamaica, and deemed non-strategic by the Group, was sold for USD 0.9 million. As the carrying amounts of the equity investment had already been aligned to this amount in the statement of financial position at 31 December 2014, no component was included in the Group’s results to 31 March 2015.
Innovation and new product launches Launch of new flavours of SKYY Infusions Two new versions of SKYY Infusions, Pacific Blueberry and Texas Grapefruit, were launched in the US market in the first quarter of 2015.
Other significant events Introduction of shares with increased voting rights (loyalty shares) On 28 January 2015, the extraordinary shareholders’ meeting of Davide Campari-Milano S.p.A. voted by a large majority to adopt the resolution proposing changes to the articles of association in order to introduce loyalty shares. The proposal was approved with a vote in favour of 76.1% of the share capital represented at the shareholders’ meeting, corresponding to 61.8% of the share capital of Davide Campari-Milano S.p.A. It is hoped that loyalty shares will create a more stable and loyal shareholder structure in view of changes introduced by Article 20 of Legislative Decree 91 of 24 June 2014. In accordance with the above-mentioned changes to the articles of association, shareholders who wish to exercise their option to purchase loyalty shares, which give their holders two votes for each share held, must request registration of the shares in the appropriate shareholder register of the Company for at least 24 months from the registration date, subject to compliance with the requirements of law and of the articles of association. The new Article 6 of the articles of association and the related regulation on the special list for double voting rights, approved by the Board of Directors, define the terms and conditions for registration on the list and for requesting removal from it. For more detailed information on this subject, see the report prepared by the Board of Directors, and the regulation on the special list for double voting rights, which is published on the Company's website (www.camparigroup.com/it/governance/loyalty-shares). Revolving credit facility On 27 February 2015, the Parent Company took advantage of favourable conditions on the financial markets to agree a five-year, € 450 million committed revolving credit facility with a pool of six leading banks. The Company may draw down on the credit line as required in order to fulfil any financial obligation that may arise. On 31 March 2015, the line had not yet been used.

Gruppo Campari - Interim report on operations at 31 March 2015
10
Purchase of own shares Between 1 January and 31 March 2015, the Group bought 3,490,418 own shares at an average price of € 5.83, and sold 3,659,086 shares after the exercise of stock options. At 31 March 2015, the Parent Company held 3,712,615 own shares, equivalent to 0.64% of the share capital.
Sales performance Foreword Starting from these interim financial statements, the Group considered it appropriate to change its segment reporting, based on IFRS 8 guidelines. Since 2012, the Group’s segment reporting has shown profitability by geographical regions, identified as operating segments. The previous breakdown (Italy, Rest of Europe, the Americas and Rest of the World) has now been adapted to fit the recent reorganisation of business units, based on the Group’s operating model and current way of working. In these interim financial statements, this information is provided for the Group’s net sales only, with the 2014 comparison figures appropriately reclassified. Information on the operating profitability of the new segments, with the appropriately reclassified 2014 comparison figures, will be provided in the half-year financial statements to 30 June 2015. The four operating segments identified are:
the Americas, which includes both direct markets, i.e. markets in which the Group operates through its own direct sales organisations (US, Canada, Mexico, Jamaica, Brazil and Argentina) and markets in which the Group operates through third-party distributors;
Southern Europe, Middle East and Africa, which includes both direct markets (Italy and Spain) and markets in which the Group operates through third-party distributors (such as France and other countries in southern Europe, the Middle East and Africa); this area also includes still wines and global travel retail (duty free) sales;
Northern, central and eastern Europe,which includes both direct markets (Germany, Austria, Switzerland, Benelux, UK, Russia and Ukraine) and markets in which the Group operates through third-party distributors (such as Ireland, Poland, Hungary, Czech Republic, Slovakia, Scandinavia, the Baltic countries and the Commonwealth of Independent States, or CIS);
Asia-Pacific, which includes both direct markets (Australia, New Zealand and China) and markets in which the Group operates through third-party distributors (other countries).
The product categories were also revised, making them more uniform in terms of strategic importance for the Group. The following categories were identified:
global priority brands, which include Campari, SKYY, Aperol, the Wild Turkey franchise (comprising Wild Turkey and American Honey) and the Jamaican rum portfolio (Appleton, J. Wray and Wray&Nephew Overproof);
regional priority brands, which include Cinzano sparkling wines and vermouths, Frangelico, Averna, Forty Creek, Espolon tequila, Carolans, GlenGrant, Cynar, Braulio, and Riccadonna and Mondoro sparkling wines;
local priority brands, which include CampariSoda, Crodino, Wild Turkey ready-to-drink, Ouzo 12, Cabo Wabo and Brazilian brands Dreher and Sagatiba;
the rest of the portfolio, which includes all the other brands, as well as sales relating to non-strategic assets.
Overall performance In the first quarter of 2015, the Group’s net sales totalled € 327.4 million, an overall 13.4% increase on the same period last year. The change by geographical region, broken down into organic, external and exchange rate components, is as follows:

Gruppo Campari - Interim report on operations at 31 March 2015
11
2015
2014
total change
organic change
perimeter effect
exchange rate effect
Americas 143.9 43.9%
120.5 41.7%
23.4 19.4%
5.8 4.8%
-0.6 -0.5%
18.2 15.1% Southern Europe,
Middle East and Africa 106.8 32.6%
94.6 32.8%
12.2 12.9%
5.7 6.0%
6.1 6.5%
0.4 0.4% Northern, central and eastern
Europe 53.3 16.3%
53.4 18.5%
-0.1 -0.1%
-0.8 -1.5%
1.9 3.6%
-1.2 -2.3% Asia-Pacific 23.4 7.1%
20.2 7.0%
3.2 15.9%
1.5 7.2%
0.0 0.0%
1.7 8.7%
Total 327.4 100.0% 288.7 100.0%
38.7 13.4%
12.1 4.2%
7.4 2.6%
19.2 6.6%
Organic change The first quarter of the year generated organic growth of 4.2%. It should be noted that the first quarter traditionally suffers from the variation in the timing of the Easter period, which in the least significant quarter of the year in terms of business seasonality, may lead to positive or negative percentage changes that will then be reabsorbed in the following quarters. - the Americas region closed the quarter with organic growth of 4.8%, driven by a good performance from nearly all the
countries in the region; the US, in particular, grew by 3.2% thanks to a healthy recovery in shipment volumes for the Group’s global priority brands, a trend that was already evident in the second half of 2014, confirming the ongoing positive depletion. Growth was also satisfactory in Jamaica and Argentina. In Jamaica, activities to reposition the portfolio and prices continued, while in Argentina, Campari kept up its good performance.
- the southern Europe, Middle East and Africa region recorded solid organic growth of 6% in the first quarter; in Italy, performance was positive (2%), with a good showing by Crodino and CampariSoda. In the other countries in the region, highlights include the recovery of the Spanish market, where the Group had launched direct distribution in 2014, and a good performance by the duty free market.
- the northern, central and eastern Europe region put in a negative performance (-1.5%), weighed down by the ongoing macroeconomic instability in Russia, which also had severe repercussions on its currency; competition was also high in Germany, the region’s other main market, where, despite a good start to the year, the Group’s prudent estimates for the current year were borne out.
- the Asia-Pacific region recorded growth of 7.2% thanks to the partial recovery of the Australian market, led by Wild Turkey, Campari and Aperol, and the other markets in the region, which were positive overall.
Perimeter effect External growth of 2.6% in the period was attributable to the net effect of acquisitions and disposals of companies or brands, and the launch or discontinuation of distribution agreements. As regards business acquisitions and sales, the first quarter of 2015 included the perimeter effect relating to Forty Creek Distillery Ltd. and Averna Group, the transactions of which were completed by the Group in June 2014. The main changes to distribution contracts were: the distribution of other third-party brands, including Molinari Sambuca from 1 April 2014 in Germany and other
selected markets; the termination of some distribution agreements during the year, including Flor de Caña and Suntory brand products
in the US, Kimberley Clark in Jamaica, Russian Standard vodka in Germany and Caffè Lavazza in Russia. The impact of these factors on sales in the period is analysed in the table below:
breakdown of the perimeter effect € million % change on 2014
acquisitions and sales of companies Averna Group 8.1 2.8%
Forty Creek Distillery Ltd. 5.4 1.9%
Other -0.5 -0.2%
total 13.0 4.5%
distribution contracts third-party brands distributed 1.5 0.5%
discontinued third-party brands -7.1 -2.4%
total -5.5 -1.9%
total perimeter effect 7.4 2.6%
Gruppo Campari - Interim report on operations at 31 March 2015
12
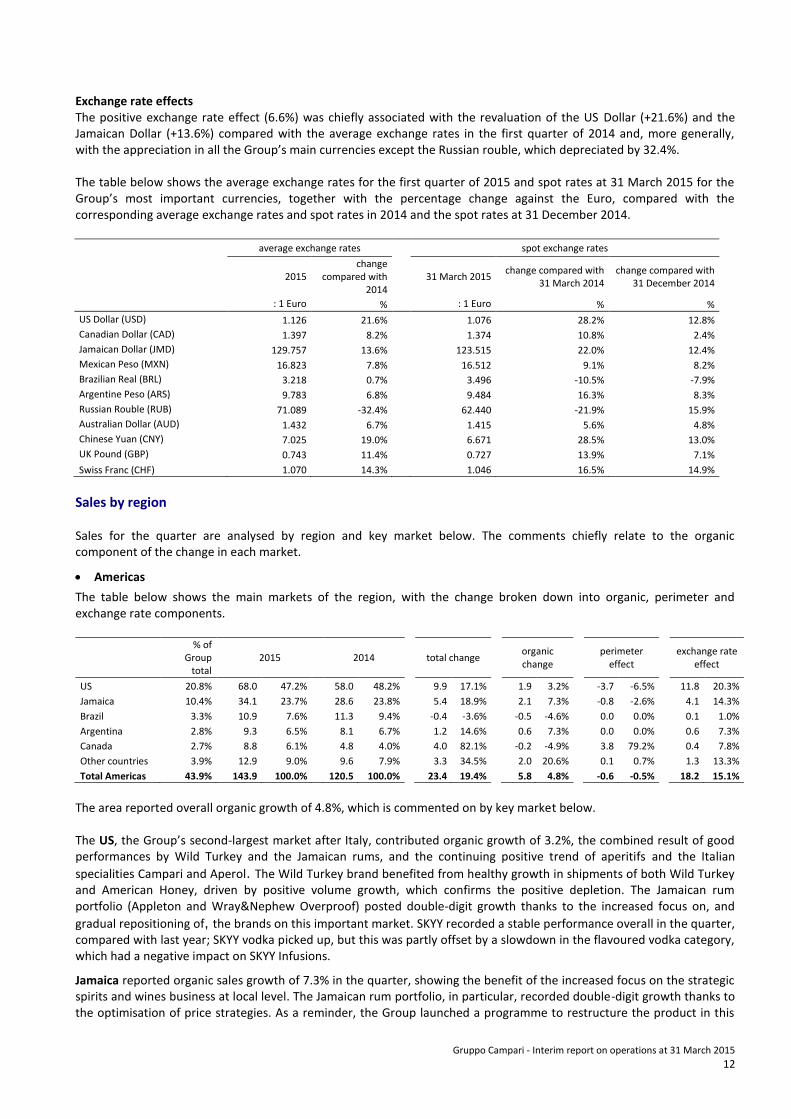
Exchange rate effects The positive exchange rate effect (6.6%) was chiefly associated with the revaluation of the US Dollar (+21.6%) and the Jamaican Dollar (+13.6%) compared with the average exchange rates in the first quarter of 2014 and, more generally, with the appreciation in all the Group’s main currencies except the Russian rouble, which depreciated by 32.4%. The table below shows the average exchange rates for the first quarter of 2015 and spot rates at 31 March 2015 for the Group’s most important currencies, together with the percentage change against the Euro, compared with the corresponding average exchange rates and spot rates in 2014 and the spot rates at 31 December 2014.
average exchange rates spot exchange rates
2015 change
compared with 2014
31 March 2015 change compared with
31 March 2014 change compared with
31 December 2014
: 1 Euro % : 1 Euro % %
US Dollar (USD) 1.126 21.6%
1.076 28.2% 12.8%
Canadian Dollar (CAD) 1.397 8.2%
1.374 10.8% 2.4%
Jamaican Dollar (JMD) 129.757 13.6%
123.515 22.0% 12.4%
Mexican Peso (MXN) 16.823 7.8%
16.512 9.1% 8.2%
Brazilian Real (BRL) 3.218 0.7%
3.496 -10.5% -7.9%
Argentine Peso (ARS) 9.783 6.8%
9.484 16.3% 8.3%
Russian Rouble (RUB) 71.089 -32.4%
62.440 -21.9% 15.9%
Australian Dollar (AUD) 1.432 6.7%
1.415 5.6% 4.8%
Chinese Yuan (CNY) 7.025 19.0%
6.671 28.5% 13.0%
UK Pound (GBP) 0.743 11.4%
0.727 13.9% 7.1%
Swiss Franc (CHF) 1.070 14.3% 1.046 16.5% 14.9%
Sales by region Sales for the quarter are analysed by region and key market below. The comments chiefly relate to the organic component of the change in each market.
Americas
The table below shows the main markets of the region, with the change broken down into organic, perimeter and exchange rate components.
% of Group
total 2015 2014
total change
organic change
perimeter effect
exchange rate effect
US 20.8% 68.0 47.2%
58.0 48.2%
9.9 17.1%
1.9 3.2%
-3.7 -6.5%
11.8 20.3%
Jamaica 10.4% 34.1 23.7%
28.6 23.8%
5.4 18.9%
2.1 7.3%
-0.8 -2.6%
4.1 14.3%
Brazil 3.3% 10.9 7.6%
11.3 9.4%
-0.4 -3.6%
-0.5 -4.6%
0.0 0.0%
0.1 1.0%
Argentina 2.8% 9.3 6.5%
8.1 6.7%
1.2 14.6%
0.6 7.3%
0.0 0.0%
0.6 7.3%
Canada 2.7% 8.8 6.1%
4.8 4.0%
4.0 82.1%
-0.2 -4.9%
3.8 79.2%
0.4 7.8%
Other countries 3.9% 12.9 9.0%
9.6 7.9%
3.3 34.5%
2.0 20.6%
0.1 0.7%
1.3 13.3%
Total Americas 43.9% 143.9 100.0% 120.5 100.0%
23.4 19.4%
5.8 4.8%
-0.6 -0.5%
18.2 15.1%
The area reported overall organic growth of 4.8%, which is commented on by key market below. The US, the Group’s second-largest market after Italy, contributed organic growth of 3.2%, the combined result of good performances by Wild Turkey and the Jamaican rums, and the continuing positive trend of aperitifs and the Italian
specialities Campari and Aperol. The Wild Turkey brand benefited from healthy growth in shipments of both Wild Turkey and American Honey, driven by positive volume growth, which confirms the positive depletion. The Jamaican rum portfolio (Appleton and Wray&Nephew Overproof) posted double-digit growth thanks to the increased focus on, and
gradual repositioning of, the brands on this important market. SKYY recorded a stable performance overall in the quarter, compared with last year; SKYY vodka picked up, but this was partly offset by a slowdown in the flavoured vodka category, which had a negative impact on SKYY Infusions.
Jamaica reported organic sales growth of 7.3% in the quarter, showing the benefit of the increased focus on the strategic spirits and wines business at local level. The Jamaican rum portfolio, in particular, recorded double-digit growth thanks to the optimisation of price strategies. As a reminder, the Group launched a programme to restructure the product in this

Gruppo Campari - Interim report on operations at 31 March 2015
13
market, which started in 2014 with the termination of distribution agreements relating to consumer products, and continued in 2015 with the sale of the non-core Federated Pharmaceutical business (completed on 2 April 2015).
In Brazil, sales in this quarter (generally a period of modest trading) suffered from the general market malaise, which affected both the local brands Dreher and Sagatiba, and Campari, leading to a temporary organic decline of 4.6%.
Argentina reported 7.3% growth thanks to a positive performance by the Group’s premium brands, driven by Campari and Cinzano vermouth.
Canada, on the other hand, declined by 4.9%, due to the change in the route-to-market (sales activities were transferred from the local distributor to the Group’s direct organisation) on 1 January 2015, which had an impact on Appleton and SKYY Vodka sales.
Southern Europe, Middle East and Africa
The region, which is broken down by main m arket in the table below, saw organic growth of 6.0%.
% of Group
total 2015 2014
total change
organic change
perimeter effect
exchange rate effect
Italy 25.7% 84.3 78.9%
78.6 83.1%
5.7 7.2%
1.6 2.0%
4.1 5.2%
0.0 0.0% Other countries in the region (*) 6.9% 22.5 21.1%
16.0 16.9%
6.5 40.4%
4.1 25.4%
2.0 12.6%
0.4 2.4%
Southern Europe, Middle East and Africa 32.6% 106.8 100.0% 94.6 100.0%
12.2 12.9%
5.7 6.0%
6.1 6.5%
0.4 0.4%
(*) includes the duty free channel
In Italy, the Group’s largest market, organic growth was 2.0% in the first quarter, driven by local brands Campari Soda and Crodino (comprising both Crodino and Crodino Twist), despite the highly unfavourable basis of comparison with last year. This positive performance, combined with the slight growth recorded by Aperol, enabled the region to offset the temporary decline in Campari and the Lemonsoda range.
The other countries in the region reported double-digit growth of 25.4%, thanks to the healthy performance of Spain and the duty free channel. In Spain, a market in which the Group had launched direct distribution in 2014, the recovery was led by Campari, Aperol, Frangelico and Cinzano.
Northern, central and eastern Europe
The region showed an organic decline of 1.5%, spread across main markets as follows:
% of Group
total 2015 2014
total change
organic change
perimeter effect
exchange rate effect
Germany 9.1% 29.7 55.6%
26.4 49.4%
3.3 12.4%
1.6 6.0%
1.7 6.3%
0.0 0.0%
Russia 1.2% 3.8 7.1%
7.1 13.4%
-3.4 -47.1%
-1.5 -21.5%
0.0 -0.2%
-1.8 -25.3% Other countries in the region 6.1% 19.9 37.3%
19.9 37.2%
0.0 0.1%
-0.9 -4.4%
0.3 1.4%
0.6 3.0%
Northern, central and eastern Europe 16.3% 53.3 100.0% 53.4 100.0%
-0.1 -0.1%
-0.8 -1.5%
1.9 3.6%
-1.2 -2.3%
Germany closed the first quarter, a period of typically low seasonality, up 6.0%, thanks partly to the effects of an earlier Easter than that of the previous year. This result was driven by good performances from both Cinzano and Ouzo 12. However, competition on the market remained fierce, which led to a decrease in Aperol sales in the first quarter. Turning to the perimeter effect, external growth was due to the acquisition of Averna, for which the distribution was brought in-
house, forming part of the Group’s sales structure since the start of the year.
In Russia, political turmoil and macroeconomic instability continued during the first quarter, with extremely adverse repercussions on the exchange rate. Moreover, there is fierce competition in this market too, which makes for poor visibility on the rest of the year. Sales declined by 21.5% in the first quarter - structurally the least important of the year - following the fall in the main brands, Cinzano sparkling wine, Riccadonna and Mondoro, which was only partly offset by the positive performances of Cinzano vermouth and Old Smuggler.
In the other countries in the region, sales declined by 4.4%, due both to seasonal phenomena and a high comparison basis with 2014 in some countries, although this is likely to be made up in the rest of the year.

Gruppo Campari - Interim report on operations at 31 March 2015
14
Asia-Pacific
The table below shows the region, broken down into Australia and other countries, with details of the changes during the period.
% of Group
total 2015 2014
total change
organic change
perimeter effect
exchange rate effect
Australia 4.8% 15.9 67.9%
14.6 72.2%
1.3 8.9%
0.3 2.1%
0.0 0.0%
1.0 6.8% Other countries in the region 2.3% 7.5 32.1%
5.6 27.8%
1.9 33.9%
1.1 20.5%
0.0 0.0%
0.8 13.5%
Total Asia-Pacific 7.1% 23.4 100.0% 20.2 100.0%
3.2 15.9%
1.5 7.2%
0.0 0.0%
1.7 8.7%
The good results in the first quarter, which closed with total organic growth of 7.2%, enabled the region to partly make up the ground lost in the slow periods in 2014. In Australia, organic growth of 2.1% was led by the recovery of Wild Turkey ready-to-drink and Frangelico, as well as the positive performances of Campari and Aperol. However, consumer confidence in the country is still very low, which calls for caution in our expectations for the rest of the year. In the other countries, which reported growth of 20.5%, good results were achieved in New Zealand, where growth was driven by Coruba, and in China, thanks especially to Campari and GlenGrant. These results were partly curbed by Japan’s negative performance, which included the effects of distribution changes.
Sales by major brands at consolidated level The following table summarises growth (organic and total) in the Group’s main brands in the first quarter of the year, broken down into the main categories identified by the Group based on the priority (global, regional, local and other) assigned to them.
percentage of Group sales percentage change in sales, of which
total organic perimeter exchange rate
Campari 9.6%
7.8% 3.7% - 4.0%
SKYY (1) 10.9%
18.3% 0.7% - 17.6%
Aperol 8.4%
2.2% 1.0% - 1.2%
Wild Turkey franchese (1)(2)
7.4%
29.2% 10.4% - 18.9%
Jamaican rum (3)
5.9%
35.3% 19.6% - 15.7%
global priority brands 42.2% 15.8% 5.3% - 10.5%
Cinzano 4.3%
-4.5% -1.4% - -3.1%
Frangelico 1.6%
27.0% 14.4% - 12.6%
Averna 1.0%
- - - -
Forty Creek 1.2%
- - - -
Espolon 0.9%
9.1% -3.7% - 12.8%
Other 5.1%
0.8% -7.8% 4.8% 3.8%
regional priority brands 14.0% 21.1% -2.6% 21.0% 2.7%
Campari Soda 4.8%
2.5% 2.4% - 0.1%
Crodino 4.4%
18.0% 17.6% - 0.3%
Wild Turkey ready-to-drink 2.2%
13.7% 6.6% - 7.2%
Brazilian brands Dreher and Sagatiba 1.3%
-9.2% -10.2% - 1.0%
Other 1.8%
25.4% 15.7% - 9.8%
local priority brands 14.6% 9.7% 7.3% - 2.4%
rest of the portfolio 29.2% 8.6% 4.1% -0.6% 5.2%
total 100.0% 13.4% 4.2% 2.6% 6.6% (1): excludes ready-to-drink (2): includes American Honey (3): includes Appleton, J.Wray and Wray&Nephew overproof rum

Gruppo Campari - Interim report on operations at 31 March 2015
15
The Group’s global priority brands, which represent, in total, around 40% of the sales, reported organic growth of 5.3%; exchange rate variations during the quarter made a substantial positive contribution to the result, enabling the region to generate a total increase of 15.8% in this category of sales. Campari generated organic growth of 3.7% during the period thanks to double-digit growth recorded in Argentina and
the US, and to the Spanish market’s recovery following the change in the route-to-market in 2014. These positive phenomena enabled the brand to make up the temporary falls in Italy and Brazil, in a quarter that typically records modest trading. SKYY closed the quarter with organic growth of 0.7% thanks to a broadly stable result in the US (+0.8%), where SKYY vodka’s good results counteracted the generalised decline in the flavoured vodka sector that had adversely affected SKYY Infusions. The other markets were overall in line with 2014 at the end of the first quarter. Aperol recorded organic growth of 1.0%, thanks to the solid progress of its sales in all the brand’s priority markets, including Italy, where it posted slight growth. Sales also rose in high-potential markets such as the US, and in many other countries where, given the low starting point, growth still has a limited impact. The positive performance achieved in many markets enabled the brand to fully offset the ongoing weakness in the German market, where, despite recovering in the off-trade channel, it fell by 13.2%, due entirely to the on-trade channel. The Wild Turkey portfolio, which includes American Honey, increased by 10.4% in the period, thanks to a satisfactory result in the US. In Australia, the franchise’s second largest core market, sales were in line with 2014, while Japan suffered a slight fall. It should be noted that the performance described above does not include the results of the Wild Turkey ready-to-drink portfolio. Since the business is exclusively domestic in the Australian market, it has been classified under local priority brands and is therefore commented on below. The Jamaican rum portfolio (Appleton Estate, J.Wray and Wray&Nephew Overproof) reported organic growth of 19.6% overall, thanks to the positive performances of its two main markets, the US and Jamaica. In the other core markets, Canada and the UK, the brand recorded a temporary decline, due to changes in distribution in these two markets in the first quarter of 2015. This temporary phenomenon was partly offset by the good performances of the duty free channel and, albeit to a lesser extent, various other markets. The regional priority brands, which represent around 14% of the Group’s sales, declined by 2.6% during the quarter. Overall, they increased by 21.1% due to the perimeter effect arising from the acquisitions of Averna and Forty Creek. The decline was largely due to the negative performance of Mondoro in Russia, which was only partially offset by Frangelico’s good performance in its main market, the US. The local priority brands, which represent around 15% of the Group’s portfolio, recorded healthy organic growth of 7.3% in the quarter. Specifically, the main brands in the category, Campari Soda, Crodino and Wild Turkey ready-to-drink, reported good results in their main markets, Italy and Australia. The Brazilian brands Dreher and Sagatiba recorded an organic decline of 10.2%. The rest of the portfolio, representing about one-third of the Group’s sales (including agency brands, which account for around 10% of the Group’s sales), reported organic growth of 4.1% in the period. In this category, we highlight the good performances of Skyy ready-to-drink in Mexico, Coruba in New Zealand, and, in general, the agency brands in Italy, Germany, Spain and the duty free channel.

Gruppo Campari - Interim report on operations at 31 March 2015
16
Income statement The income statement for the first quarter of 2015 showed sustained sales growth of 13.4% compared with 2014; this is also reflected in the contribution margin and the result from recurring activities, which increased by 14.3% and 16.1% respectively. Specifically, the first quarter of the year, which, due to the seasonality of the business, makes a smaller contribution to annual profitability, had an extremely positive start that led to an organic increase in sales of 4.2% and an operating result before non-recurring items of 7.3%. The quarter’s figures also reflect the positive impact of the exchange rate and perimeter effects on both sales (+6.6% and +2.6% respectively) and operating results (+7.4% and +1.4% respectively). Looking at the total, i.e. including the organic, external and exchange rate components, profit from recurring activities was, therefore, up on the first quarter of 2014 in both absolute terms (+16.1%) and as a percentage of sales (13.6% in 2015 compared with 13.3% in 2014). The table below shows the income statement for the first quarter of 2015 and a breakdown of the total change by organic growth, external growth and exchange rate effects.
31 March 2015 31 March 2014 change, of which
total organic perimeter exchange rate
€ million % € million % € million % € million % € million % € million %
Net sales 327.4 100.0 288.7 100.0 38.7 13.4% 12.1 4.2% 7.4 2.6% 19.2 6.6%
Cost of goods sold (161.2) -49.2 (143.7) -49.8 (17.4) 12.1% (5.2) 3.7% (2.2) 1.5% (10.0) 6.9%
Gross profit 166.2 50.8 145.0 50.2 21.3 14.7% 6.8 4.7% 5.3 3.6% 9.2 6.3%
Advertising and promotional costs (48.3) -14.8 (41.8) -14.5 (6.5) 15.5% (1.4) 3.3% (2.1) 5.1% (3.0) 7.1%
Contribution margin 117.9 36.0 103.2 35.7 14.8 14.3% 5.4 5.3% 3.1 3.0% 6.2 6.0%
Overheads (73.4) -22.4 (64.8) -22.5 (8.6) 13.3% (2.6) 4.1% (2.6) 4.0% (3.4) 5.2%
Result from recurring activities 44.5 13.6 38.3 13.3 6.2 16.1% 2.8 7.3% 0.5 1.4% 2.8 7.4%
Non-recurring income (charges) 3.9 1.2 (1.1) -0.4 4.9
Operating result 48.4 14.8 37.3 12.9 11.1 29.8%
Net financial income (charges) (12.5) -3.8 (16.5) -5.7 4.0 -24.2% - - - - - - Profit before tax and non-controlling interests 35.9 11.0 20.8 7.2 15.1 72.6% - - - - - -
Non-controlling interests (0.1) 0.0 (0.1) 0.0 (0.0) 35.5% - - - - - -
Group profit before tax 35.8 10.9 20.7 7.2 15.1 72.8% - - - - - -
Total depreciation and amortisation (11.7) -3.6 (8.8) -3.0 (2.9) 33.5% (1.6) 18.6% (0.4) 4.9% (0.9) 10.0% EBITDA before non-recurring income (charges) 56.2 17.2 47.1 16.3 9.1 19.4% 4.4 9.4% 1.0 2.1% 3.7 7.9%
EBITDA 60.1 18.4 46.1 16.0 14.1 30.5%
The resulting changes in the Group’s total and organic profitability, calculated in basis points, are as follows;
increase (dilution) in profitability calculated in basis points(*) total organic
Cost of goods sold after distribution costs 60 30
Gross profit 60 30
Advertising and promotional costs (30) 10
Contribution margin 30 40
Overheads - -
Result from recurring activities 30 40
(*) it should be noted that there could be rounding effects given that basis points have been rounded to the nearest ten basis points.
Net sales for the quarter totalled € 327.4 million, an increase of 13.4% on the first quarter of 2014. Organic growth had a positive impact of 4.2%, the perimeter effect was positive at 2.6%, and the exchange rate added 6.6%. For more details on these effects and on sales by region and business area, please refer to the section above. Gross margin was € 166.2 million, and in absolute terms, increased by 14.7% compared with the first quarter of 2014. As a percentage of sales, it rose from 50.2% in 2014 to 50.8% in 2015, with an increase of 60 basis points in profitability, due to both organic and external growth effects. Organic growth led to an increase in profitability of 30 basis points, attributable to various contrasting factors. Positive factors include the absence of costs associated with the start-up of the
Gruppo Campari - Interim report on operations at 31 March 2015
17
new factory in Kentucky in the second half of 2014, and a favourable geographical mix of sales. Specifically, the US and Italy achieved good organic growth in the first quarter, which more than offset the dilution arising from growth in less profitable countries such as Argentina. The quarter also benefited from the negative performance of less profitable countries such as Brazil and Russia. These positive effects were partly offset by the squeezed business margins of sugar in Jamaica, due to a reduction in sales prices and expected production yields. Traditionally, the first quarter of the year is the period where consumption of the Group’s products is at its lowest, which means that advertising and promotional costs as a percentage of sales are normally lower than the annual average (16.7% in the full year 2014): as a percentage of sales in the first quarter of 2015, these costs were 14.8% of sales, slightly up on the first quarter of the previous year, when the figure was 14.5%. The contribution margin for the quarter was € 117.9 million, an increase of 14.3% compared with last year, thanks to a combination of positive effects due mainly to organic growth of 5.3% and an exchange rate effect of 6.0%. Consequently, profitability as a percentage of sales increased by 30 basis points in total and 40 basis points at organic level. Overheads rose by a total of 13.3% in the quarter due to the combination of an unfavourable exchange rate effect of 5.2% and organic growth of 4.1%, mainly due to costs incurred by the Group for new sales structures, especially in the UK, Canada and Spain. Moreover, overheads as a percentage of sales remained stable (22.5% in 2014 versus 22.4% in 2015) compared with an overall 13.4% increase in sales in the two periods under comparison. The result from recurring activities was € 44.5 million, an increase of 16.1% compared with the same period of last year. As a percentage of sales, it came to 13.6% compared with 13.3% last year, leading to a 30-basis point improvement, including 40 basis points at organic level, attributable to:
an improvement in the gross margin, which at organic level led to a 30-basis point increase in profitability;
a reduction in advertising and promotional costs, as a result of which it fell by 10 basis points as a percentage of sales;
overheads as a percentage of sales were broadly unchanged. Of the 1.4% perimeter effect on the operating results, the change attributable to the acquisitions of Forty Creek Distillery Ltd and Averna Group was 2.7%. This increase was partly offset by the negative effect attributable to the termination of the distribution of some third-party brands. Non-recurring income and charges showed a net positive balance of € 3.9 million, compared with a net negative balance of € 1.1 million, arising from restructuring costs, in 2014. The sale of the Federated Pharmaceutical Division in Jamaica, which was completed on 31 March 2015, had a positive impact of € 5.0 million on the first-quarter results (for more details, see ‘Significant events during the period’). This was partly offset by charges relating to the restructuring processes in various Group companies and other charges of € 1.1 million. The operating result for the first quarter of 2015 was € 48.4 million, representing an overall increase of 29.8% compared with the first quarter of last year. Stripping out the exchange rate and perimeter effect, organic growth was 20.1%. The return on sales, i.e., the operating result expressed as a percentage of net sales was 14.8% (12.9% in 2014) as a direct result of non-recurring charges for the period. Depreciation and amortisation for the period totalled € 11.7 million, up by € 2.9 million from the first quarter of 2014. EBITDA before non-recurring income and charges increased by 19.4% (+9.4% on a same-structure basis and at constant exchange rates) to € 56.2 million. EBITDA came in at € 60.1 million, up 30.5%. In the first quarter of 2015, net financial expenses totalled € 12.5 million, a decrease of € 4.0 million over the corresponding period in 2014, when this figure was € 16.5 million. This reduction was mainly attributable to positive exchange rate differences due to the performance of certain currencies. Average net debt in the first quarter of 2015 (€ 1,004.1 million) was higher than the first quarter of 2014 (€ 842.2 million), as it includes the effect of the acquisitions of Forty Creek Distillery Ltd and Averna Group carried out in June 2014. Average borrowing costs, excluding the effects of exchange differences, totalled 5.7%. This figure is slightly lower than the previous year (6.1%) given that, against the interest paid on medium-/long-term debt, which was in line with the previous year, the negative carry on interest generated by cash and cash equivalents held had less of an impact.

Gruppo Campari - Interim report on operations at 31 March 2015
18
Group profit before tax was € 35.8 million in the first quarter of 2015, up 72.8% year-on-year.
Financial position
Breakdown of net debt
31 March 2015 31 December 2014 change
€ million € million € million
cash and cash equivalents 247.9 230.9 17.0
payables to banks (44.9) (36.7) (8.2)
real estate lease payables (0.1) (0.1) (0.0)
private placement and bonds (86.0) (86.0) -
other financial receivables and payables (21.5) (5.2) (16.3)
short-term net cash position 95.4 103.0 (7.6)
payables to banks (8.6) (9.0) 0.4
real estate lease payables (1.3) (1.3) 0.0
private placement and bonds (*) (1,116.8) (1,097.1) (19.7)
other financial receivables and payables 31.7 30.5 1.1
medium-/long-term net financial position (1,095.0) (1,076.9) (18.1)
debt relating to operating activities (999.6) (973.9) (25.7)
payables for put options and earn-out (4.8) (4.6) (0.2)
net financial position (1,004.4) (978.5) (25.9) (*) including the relevant derivatives
The Group’s net debt at 31 March 2015 was € 1,004.4 million, € 25.9 million higher than the figure of € 978.5 million reported at 31 December 2014. In terms of structure, the net financial position at 31 March 2015 continued to be marked by a positive split between short- and medium-/long-term debt. The short-term net cash position was € 95.4 million, consisting of cash and cash equivalents of € 247.9 million, offset by payables to banks totalling € 44.9 million. The short-term debt component includes the first tranche of the bond issued by the Parent Company in 2003 and maturing in July 2015 (€ 86.0 million). The remaining tranches of the Parent Company’s bonds and Campari America's private placement are all classified as medium-/long-term debt since they mature more than 12 months after the date of this Report. Medium-to-long-term debt of € 1,095.0 million, almost exclusively comprising existing bonds, increased due to changes in
the US Dollar exchange rate during the period, which added € 22.0 million to the debt figure. It should be noted that currency fluctuations between 31 March 2015 and 31 December 2014 led to a € 14.2 million increase in total net debt. Separately, the Group’s net debt included a financial payable of € 4.8 million, which was essentially unchanged from 31 December 2014, for the payment of the earn out on Sagatiba and the remaining debt for the repurchase of minority interests related to the Jamaican acquisition. Lastly, the agreements relating to Parent Company bond issues, the Parent Company’s revolving credit facility and the Campari America private placement include negative pledges and covenants. If the Group does not comply with the clauses described below, after an observation period in which any breach has not been rectified, it may be served with notice to repay the residual debt. The ratios are monitored constantly by the Group. The negative pledge clauses are intended to limit the Group’s ability to grant significant rights over the Group’s assets to third parties, in particular by establishing specific restrictions on selling or pledging assets.

Gruppo Campari - Interim report on operations at 31 March 2015
19
The covenants include the Group’s obligation to attain particular levels for certain financial indicators, most notably the ratio of net debt to EBITDA. Net debt is the Group’s net financial position calculated at average exchange rates for the previous 12 months; EBITDA is the Group’s operating result before depreciation, amortisation and non-controlling interests, pro-rated to take account of acquisitions in the past 12 months. At 31 March 2015, this multiple was 2.9, broadly unchanged from 31 December 2014.
Operating working capital
The breakdown of the total change compared with 31 December 2014 and 31 March 2014 is as follows:
31 March 2015 31 December 2014 change of which 31 March 2014 change
organic
€ million € million € million € million € million € million
receivables from customers 282.5 313.6 (31.1) (42.1) 221.1 61.3
inventories, of which:
- maturing inventory 272.4 243.5 29.0 1.3 210.3 62.1
- other inventory 273.2 237.7 35.5 25.0 270.6 2.6
total inventories 545.6 481.2 64.4 26.3 480.9 64.7
payables to suppliers (201.0) (223.2) 22.2 31.0 (181.2) (19.8)
operating working capital 627.1 571.5 55.5 15.2 520.9 106.2
sales in the previous 12 months 1,598.6 1,560.0 38.7
1,497.6 101.0 working capital as % of sales in the previous 12 months 39.2 36.6 34.8
Pro-forma operating working capital (*) as % of sales in the previous 12 months, adjusted for the perimeter effect (%) 35.7 35.7 36.1
(*) Working capital in currencies other than the Euro has been converted into Euro based on the weighted average of the exchange rates recorded in the last four consecutive quarters.
Operating working capital at 31 March 2015 was € 627.1 million, an increase of € 55.5 million on 31 December 2014. Net of the exchange rate effect attributable to the devaluation of several of the Group companies’ functional currencies, resulting in a € 40.3 million increase in working capital, this item showed an organic rise of € 15.2 million in the quarter. By comparison with 31 December, seasonal effects in the first quarter cause a sharp reduction in the value of trade receivables, which at 31 December traditionally show higher absolute values than during the rest of the year. This reduction is partly offset by an increase in inventories of finished goods in light of the seasonal peak in the second quarter of the year. In comparison with the same period of the previous year, operating working capital at 31 March 2015 was up by € 106.2 million. This change was primarily due to significant exchange rate effects between the two dates under comparison, which led to an increase in working capital of € 58.8 million. The resulting organic change was an increase of € 11.6 million. Operating working capital as a percentage of net sales in the last 12 months was 39.2% at 31 March 2015. It should be noted that as the acquisitions of Forty Creek Distillery Ltd. and Fratelli Averna S.p.A. took place in June 2014, the statement of financial position figures at 31 March 2015 include the working capital of the acquired companies, while the sales reported for the previous 12 months include sales from the acquired brands for the third quarter of 2014 only. However, if the statement of financial position and income statement figures are adjusted to take account of the consolidation of the acquired companies, and net working capital is valued at the average exchange rate of the previous 12 months, the figure as a percentage of net sales falls to 35.7%, unchanged from 31 December 2014, which compares with 36.1% in the same period of the previous year.

Gruppo Campari - Interim report on operations at 31 March 2015
20
Events taking place after the end of the period
Launch of new flavours of SKYY In April 2015, SKYY Barcraft, a new line of 60%-proof vodka, available in fresh watermelon, white sangria and margarita lime flavours, was launched on the US market. Launch of new packaging for Appleton Estate Jamaica Rum In April 2015, new names and packaging were unveiled for Appleton Estate premium rums, in order to better express the quality, care and passion that go into their production. The new products will initially be launched on the Canadian and Australian markets. The Appleton Estate V/X, Appleton Estate Reserve and Appleton Estate Extra 12 Year Old rums have been renamed Appleton Estate Signature Blend, Appleton Estate Reserve Blend and Appleton Estate Rare Blend 12 Year Old respectively. Launch of Ouzo 12 Hierbos In April 2015, Ouzo 12 Hierbos, a liqueur containing 12 types of herb, was launched, with the aim of expanding the Group’s portfolio of flavoured liqueurs.
Launch of the new Cinzano 1757 Vermouth: Bianco and Dry In April 2015, two new flavours of Cinzano 1757 positioned in the premium vermouth segment, a vermouth bianco and a dry were launched in Italy.
Ordinary shareholders’ meeting of the Parent Company On 30 April 2015, the ordinary shareholders’ meeting of Davide Campari-Milano S.p.A. approved the 2014 financial statements and agreed the distribution of a dividend of € 0.08 per share outstanding (unchanged from the dividend paid for 2013). The total dividend, calculated on the shares outstanding and excluding own shares (9,550,001 shares), was € 45,700,000. Extraordinary shareholders’ meeting of the Parent Company On 30 April 2015, the Extraordinary shareholders’ meeting approved an amendment to Article 5 of the Company’s articles of association to extend, for another five years, the Board of Directors’ powers to increase share capital and to issue convertible bonds or other financial instruments.

Gruppo Campari - Interim report on operations at 31 March 2015
21
Outlook
The Group recorded a positive start to the year in the first quarter of 2015. In terms of organic sales growth, performances by all the main combinations of products and markets were sustained and in line with expectations. Moreover, profitability indicators showed the first signs of improvement on the previous year, in line with first-quarter expectations. Looking at the year in progress, the Group is confident that it can achieve the expected positive business development. In particular, the Group believes that it can achieve a steady improvement in operating profitability throughout the year. The environment in which the Group operates is likely to be completely balanced in terms of risks and opportunities for the rest of the year.

Gruppo Campari - Interim report on operations at 31 March 2015
22
Information on the figures presented
For ease of reference, all figures in this interim report on operations are expressed in millions of Euro to one decimal place, whereas the original data is recorded and consolidated by the Group in thousands of Euro. Similarly, all percentages that relate to changes between two periods, rather than figures shown as a percentage of sales or other indicators, are always calculated on the basis of the original data in thousands of Euro. The use of values expressed in millions of Euros may therefore result in apparent discrepancies in both absolute values and percentage changes.
Alternative performance indicators This interim report on operations presents and comments upon certain financial indicators and reclassified financial statements that are not defined by IFRS. These indicators, which are defined as they were in the 2014 annual report, are used to analyse the Group’s performance in the ‘Highlights’ and ‘Interim Report on Operations’ sections.
Other information In accordance with Article 70, paragraph 8, and Article 71, paragraph 1-bis, of Consob’s Issuer Regulations, the Board of Directors has decided to take advantage of the option to derogate from the obligations to make available to the public the information documents prescribed in relation to significant mergers, spin-offs, capital increases through contributions in kind, acquisitions and disposals. Sesto San Giovanni (MI), Tuesday 12 May 2015 Chairman of the Board of Directors Luca Garavoglia Paolo Marchesini, the director responsible for preparing the company’s accounting statements, hereby declares that, pursuant to paragraph 2, Article 154-bis of the TUF, this interim report accurately represents the figures contained in the Group’s accounting records. Paolo Marchesini Chief Financial Officer

Davide Campari-Milano S.p.A.
Registered office: Via Franco Sacchetti 20, 20099 Sesto San Giovanni (MI) Share capital: € 58,080,000 fully paid in
Tax code and Milan company register no. 06672120158
Investor Relations Telephone: (39) 0262251
Fax: (39) 026225479 e-mail: [email protected]
Website www.camparigroup.com