Embed Size (px)
Citation preview
Annu. Rev. Neurosci. 2000. 23:441–471Copyright q 2000 by Annual Reviews. All rights reserved
0147–006X/00/0301–0441$12.00 441
NEURAL MECHANISMS OF ORIENTATION
SELECTIVITY IN THE VISUAL CORTEX
David Ferster1 and Kenneth D. Miller2
1Department of Neurobiology and Physiology, Northwestern University, Evanston,Illinois 60208; e-mail: [email protected] of Physiology and Otolaryngology, Keck Center for IntegrativeNeuroscience, Sloan Center for Theoretical Biology, University of California, SanFrancisco, California 94143–0444; e-mail: [email protected]
Key Words vision, simple cell
Abstract The origin of orientation selectivity in the responses of simple cellsin cat visual cortex serves as a model problem for understanding cortical circuitryand computation. The feed-forward model posits that this selectivity arises simplyfrom the arrangement of thalamic inputs to a simple cell. Much evidence, includinga number of recent intracellular studies, supports a primary role of the thalamic inputsin determining simple cell response properties, including orientation tuning. Thismechanism alone, however, cannot explain the invariance of orientation tuning tochanges in stimulus contrast. Simple cells receive push-pull inhibition: ON inhibitionin OFF subregions and vice versa. Addition of such inhibition to the feed-forwardmodel can account for this contrast invariance, provided the inhibition is sufficientlystrong. The predictions of “normalization” and “feedback” models are reviewed andcompared with the predictions of this modified feed-forward model and with exper-imental results. The modified feed-forward and the feedback models ascribe funda-mentally different functions to cortical processing.
INTRODUCTION
No other receptive-field property characterizes the neurons of the visual cortexlike orientation selectivity. The great majority of neurons in the primary visualcortex of many carnivores and primates are exquisitely sensitive to the orientationof a stimulus. Yet the relay cells of the lateral geniculate nucleus (LGN), whichprovide the cortex with most of its information about the visual image, respondequally well to a stimulus at any orientation. In at least some species, includingcats, this remarkable and quintessentially cortical property emerges fully formedat a single synapse, between thalamic axons and their targets in the cortical layers.
Because it is such a striking phenomenon, because it is relatively easy tomeasure, and because it is so strongly linked with the function of the visual cortex,orientation selectivity and the mechanisms that give rise to it have been subjected
Ann
u. R
ev. N
euro
sci.
2000
.23:
441-
471.
Dow
nloa
ded
from
arj
ourn
als.
annu
alre
view
s.or
gby
PA
LC
I on
09/
09/0
8. F
or p
erso
nal u
se o
nly.
442 FERSTER n MILLER
to intense study and debate. Much of the cerebral cortex performs tasks that aredauntingly complex, difficult to characterize, and only just becoming experimen-tally approachable. Although a complex spatial transformation, extracting theorientation of an image element is still relatively straightforward and tractable.No wonder orientation selectivity has become one of the standard models for howthe synaptic circuitry of the cortex performs a complex computation.
The roots of the long-standing controversy over the synaptic mechanismsunderlying orientation selectivity lie in the complexity of the cortical circuit. Itis easy to say that orientation selectivity in cats emerges at a single synapsebetween the terminals of geniculate relay cell axons and the cortical cells theyexcite. But these same cortical cells receive thousands of synapses altogether, andfrom many different sources. Determining which of these broad categories ofinputs—thalamic excitatory, intracortical excitatory, intracortical inhibitory, orsome combination of all three—gives rise to orientation selectivity and how theydo so has proven to be a surprisingly difficult task. At issue is not just which ofthe various pathways contribute, but also what the entire nature of the corticalcomputation is: whether orientation selectivity arises from a feed-forward filteringof the thalamic inputs to the cortex, or from a more dynamic, feedback processthat encompasses the entire cortical circuit.
We focus our discussion on cat V1, for two reasons. First, the vast majorityof cells in layer 4, the cortical layer that receives the dominant LGN input, areorientation selective in cats, although the same is not true in many other species,e.g. monkeys (Blasdel & Fitzpatrick 1984, Hawken & Parker 1984), ferrets(Chapman & Stryker 1993), and tree shrews (Humphrey & Norton 1980). Second,the synaptic physiology underlying orientation selectivity is by far best studiedin cats.
THE FEED-FORWARD MODEL
When Hubel & Wiesel (1962) first described orientation selectivity in the neuronsof the cat visual cortex, they proposed an elegantly direct model that remains atthe center of the debate. Their model represents the feed-forward model in itssimplest form, explaining orientation selectivity solely from the organization ofthe thalamic input to a simple cell in cortical layer 4.
Simple cells in cats are defined by the elongated ON and OFF subfields intowhich their receptive fields can be divided. These subfields are arranged side-by-side, with their long axes parallel to the axis of the preferred orientation of thecell. They are strongly reminiscent, in their width and sensitivity to light, of theON and OFF centers of the receptive fields of geniculate relay cells. Hubel &Wiesel proposed that they were derived directly from thalamic input. Accordingto their scheme, a cortical ON region arises from the excitatory input from severalON-center relay cells whose receptive-field centers lie along the axis of the sub-
Ann
u. R
ev. N
euro
sci.
2000
.23:
441-
471.
Dow
nloa
ded
from
arj
ourn
als.
annu
alre
view
s.or
gby
PA
LC
I on
09/
09/0
8. F
or p
erso
nal u
se o
nly.
ORIENTATION SELECTIVITY 443
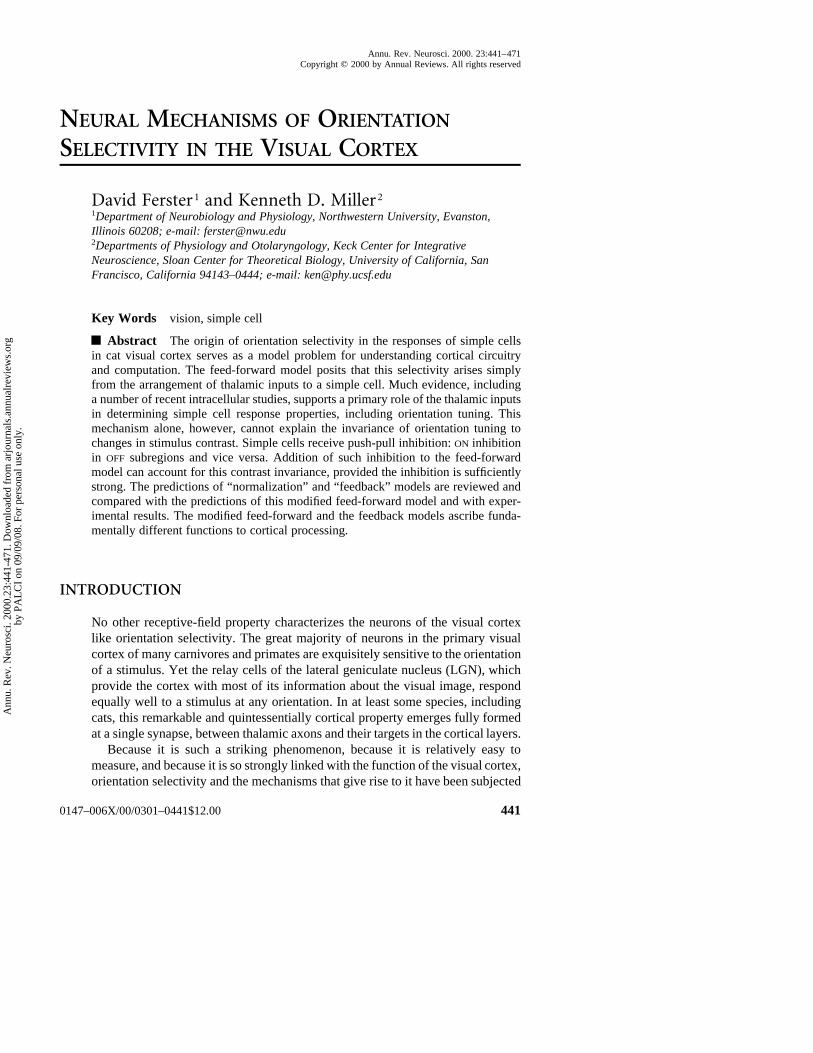
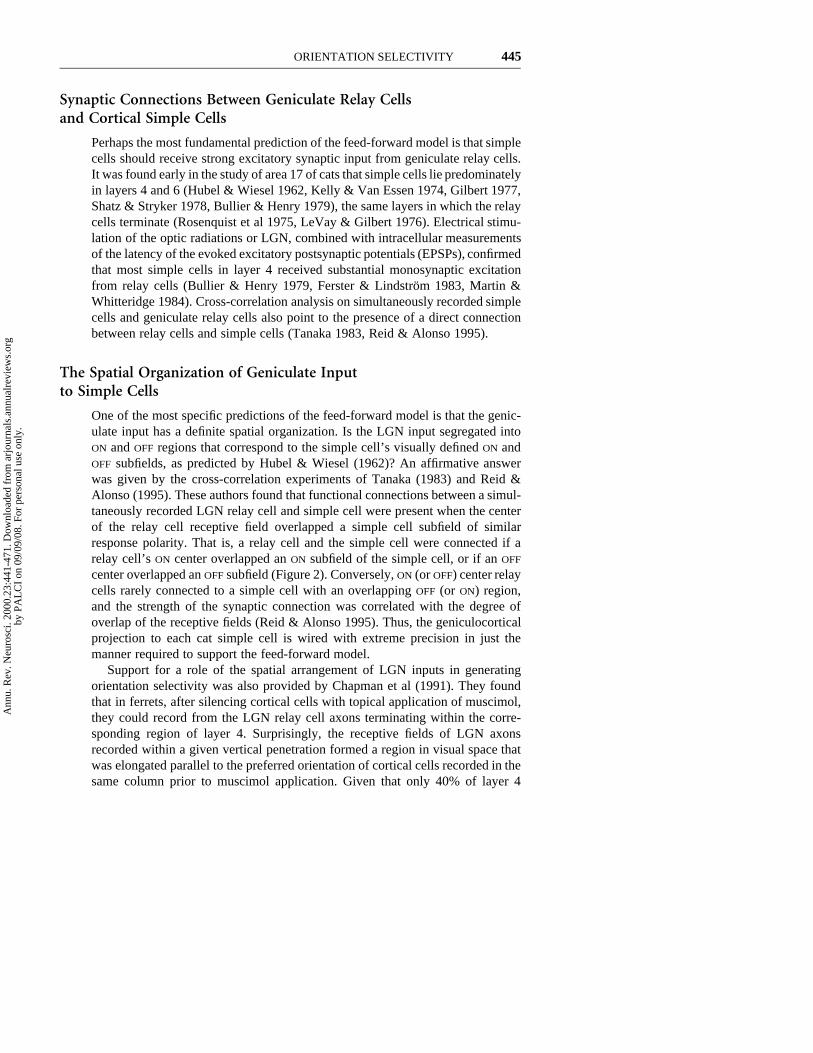
Figure 1 (Left) A map of the receptive field of a simple cell in the cat visual cortex. A lightflashed in the ON subregion (x) or turned off in an OFF region (triangles) excites the cell, whereasa light flashed in an OFF region or turned off in the ON region inhibits the cell. Other arrangementsof the subregions are possible, such as a central OFF region and flanking ON regions, or one ON
and one OFF region. (Right) The model of Hubel & Weisel (1962) for how the receptive field ofthe simple cell can be built from excitatory input from geniculate relay cells. The simple cell(bottom right) receives input from relay cells (top right) whose receptive-field centers are super-imposed on the simple cell’s central ON region. Not shown are OFF relay cells whose receptive-field centers would superimpose on the simple cell’s OFF regions.
field (Figure 1). Similarly, an OFF region would be derived from the input fromseveral OFF-center neurons.
Orientation selectivity emerges automatically from this simple arrangement.A bar of light at the orientation of an ON subfield that is moved or flashed withinthe subfield will simultaneously activate all of the presynaptic geniculate ON-center cells. The resulting barrage of synaptic excitation will depolarize the cor-tical cell and cause it to fire spikes. In contrast, a bar moved or flashed at rightangles to the subfield will only activate a small subset of the underlying geniculaterelay cells at one time. The resulting depolarization of the simple cell would betoo small to reach threshold, leaving the simple cell inactive. The essence of thefeed-forward model, then, is a linear summation stage, in which the input fromthe presynaptic geniculate neurons is summed on the membrane of the simplecell, followed by a nonlinear rectification stage, in which the action potentialthreshold filters out the small synaptic inputs that are evoked by improperly ori-ented stimuli.
EXPERIMENTAL SUPPORT FOR THEFEED-FORWARD MODEL
Receptive-Field Organization and OrientationTuning Width
If the excitatory input from geniculate relay cells is the dominant input to simplecells and defines their subfields, then many of the response properties of simplecells should resemble those of the relay cells. That both relay cell centers and
Ann
u. R
ev. N
euro
sci.
2000
.23:
441-
471.
Dow
nloa
ded
from
arj
ourn
als.
annu
alre
view
s.or
gby
PA
LC
I on
09/
09/0
8. F
or p
erso
nal u
se o
nly.
444 FERSTER n MILLER
simple cell subfields come in ON and OFF varieties is one of the resemblances thatled Hubel & Wiesel to propose their model, but it is only the most rudimentaryresemblance between the two receptive-field types. In addition, the widths ofsimple cell subfields are comparable to those of relay cell receptive-field centersat similar visual field eccentricities (Bullier et al 1982, Mullikin et al 1984, Reid& Alonso 1995). The resemblance extends to more subtle measures as well,including the dynamics of the responses to flashing bars (Mullikin et al 1984)and sinusoidally modulated bars (Saul & Humphrey 1992), and to the linearityof spatial summation as measured with sinusoidal gratings (Jagadeesh & Ferster1988). For each of these measures, simple cell responses fall naturally into thesame categories as relay cells, including X and Y, or lagged and nonlagged.
The feed-forward model makes an important prediction regarding the rela-tionship between the degree of orientation selectivity and the aspect ratio (length-to-width ratio) of a simple cell’s subfields. The longer the subfield in relation toits width, the greater the difference in the magnitude of the geniculate excitationevoked by an optimally oriented stimulus and by a stimulus at right angles. Fur-thermore, in cells with long narrow subfields, a relatively small shift in stimulusorientation will move a large proportion of the stimulus out of the subfield.Accordingly, the longer a simple cell’s subfields are in relation to their width, themore sharply orientation tuned the cell should be. To test these predictions of thefeed-forward model, Jones & Palmer (1987a,b) made high-resolution maps ofthe subfields of simple cells, applying their reverse correlation technique to theresponses to small dots flashed briefly throughout the receptive field. The averagemeasured subfield aspect ratio was approximately 5, with values as high as 12 insome cells. Similar values were obtained by Anzai et al (1999) (but see Pei et al1994). More critically, Jones & Palmer and Anzai et al measured orientationtuning in the cells whose receptive fields they had mapped and found a strongrelationship between orientation tuning width and receptive-field shape: As pre-dicted, the higher the aspect ratio of the subfield, the sharper the orientationtuning. The tuning, however, was sharper than that predicted by the simple feed-forward model, a finding that may be related to the effects of the spike threshold(see below).
The feed-forward model also predicts that orientation tuning width, when mea-sured with gratings1, should decrease with increasing stimulus spatial frequency(see Troyer et al 1998). Several studies have found this to be the case (Vidyasagar& Siguenza 1985, Webster & De Valois 1985, Jones et al 1987, Hammond &Pomfrett 1990).
1Here, a grating is a series of parallel bars drifting across the receptive field. The luminanceof the grating varies sinusoidally in the direction perpendicular to the bars, and spatialfrequency refers to the number of bars per degree of visual angle, which is inverselyproportional to the bar width.
Ann
u. R
ev. N
euro
sci.
2000
.23:
441-
471.
Dow
nloa
ded
from
arj
ourn
als.
annu
alre
view
s.or
gby
PA
LC
I on
09/
09/0
8. F
or p
erso
nal u
se o
nly.
ORIENTATION SELECTIVITY 445
Synaptic Connections Between Geniculate Relay Cellsand Cortical Simple Cells
Perhaps the most fundamental prediction of the feed-forward model is that simplecells should receive strong excitatory synaptic input from geniculate relay cells.It was found early in the study of area 17 of cats that simple cells lie predominatelyin layers 4 and 6 (Hubel & Wiesel 1962, Kelly & Van Essen 1974, Gilbert 1977,Shatz & Stryker 1978, Bullier & Henry 1979), the same layers in which the relaycells terminate (Rosenquist et al 1975, LeVay & Gilbert 1976). Electrical stimu-lation of the optic radiations or LGN, combined with intracellular measurementsof the latency of the evoked excitatory postsynaptic potentials (EPSPs), confirmedthat most simple cells in layer 4 received substantial monosynaptic excitationfrom relay cells (Bullier & Henry 1979, Ferster & Lindstrom 1983, Martin &Whitteridge 1984). Cross-correlation analysis on simultaneously recorded simplecells and geniculate relay cells also point to the presence of a direct connectionbetween relay cells and simple cells (Tanaka 1983, Reid & Alonso 1995).
The Spatial Organization of Geniculate Inputto Simple Cells
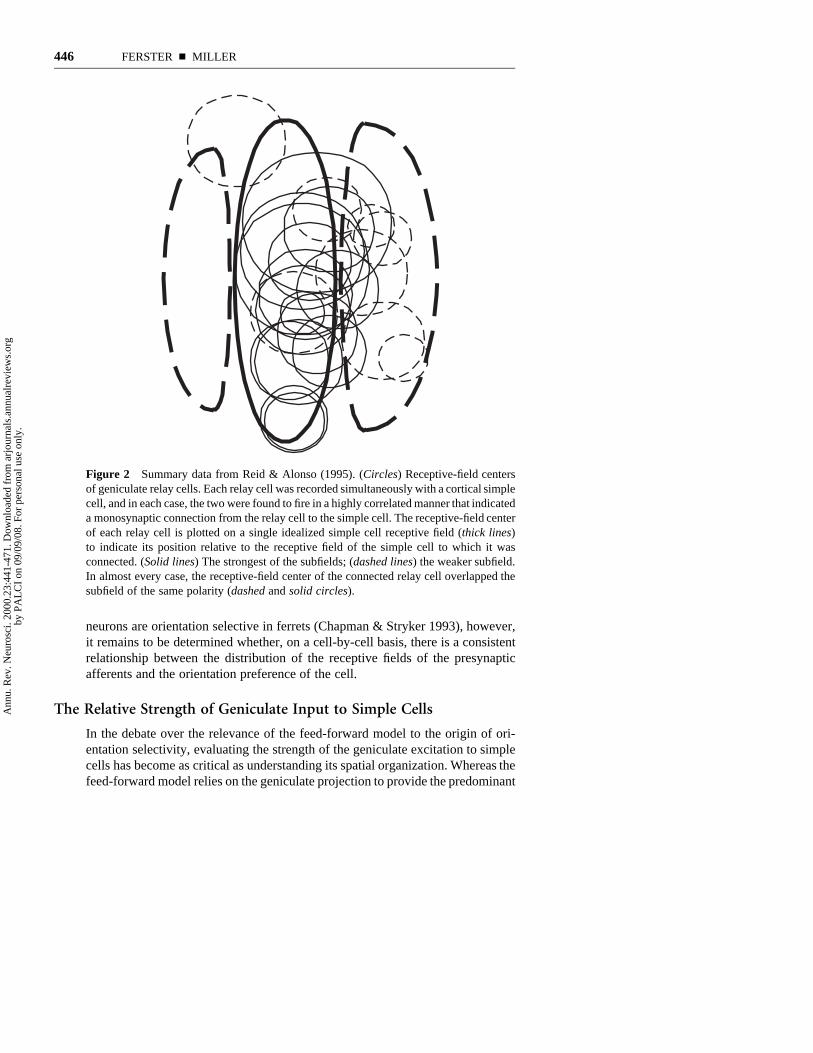
One of the most specific predictions of the feed-forward model is that the genic-ulate input has a definite spatial organization. Is the LGN input segregated intoON and OFF regions that correspond to the simple cell’s visually defined ON andOFF subfields, as predicted by Hubel & Wiesel (1962)? An affirmative answerwas given by the cross-correlation experiments of Tanaka (1983) and Reid &Alonso (1995). These authors found that functional connections between a simul-taneously recorded LGN relay cell and simple cell were present when the centerof the relay cell receptive field overlapped a simple cell subfield of similarresponse polarity. That is, a relay cell and the simple cell were connected if arelay cell’s ON center overlapped an ON subfield of the simple cell, or if an OFF
center overlapped an OFF subfield (Figure 2). Conversely, ON (or OFF) center relaycells rarely connected to a simple cell with an overlapping OFF (or ON) region,and the strength of the synaptic connection was correlated with the degree ofoverlap of the receptive fields (Reid & Alonso 1995). Thus, the geniculocorticalprojection to each cat simple cell is wired with extreme precision in just themanner required to support the feed-forward model.
Support for a role of the spatial arrangement of LGN inputs in generatingorientation selectivity was also provided by Chapman et al (1991). They foundthat in ferrets, after silencing cortical cells with topical application of muscimol,they could record from the LGN relay cell axons terminating within the corre-sponding region of layer 4. Surprisingly, the receptive fields of LGN axonsrecorded within a given vertical penetration formed a region in visual space thatwas elongated parallel to the preferred orientation of cortical cells recorded in thesame column prior to muscimol application. Given that only 40% of layer 4
Ann
u. R
ev. N
euro
sci.
2000
.23:
441-
471.
Dow
nloa
ded
from
arj
ourn
als.
annu
alre
view
s.or
gby
PA
LC
I on
09/
09/0
8. F
or p
erso
nal u
se o
nly.
446 FERSTER n MILLER
Figure 2 Summary data from Reid & Alonso (1995). (Circles) Receptive-field centersof geniculate relay cells. Each relay cell was recorded simultaneously with a cortical simplecell, and in each case, the two were found to fire in a highly correlated manner that indicateda monosynaptic connection from the relay cell to the simple cell. The receptive-field centerof each relay cell is plotted on a single idealized simple cell receptive field (thick lines)to indicate its position relative to the receptive field of the simple cell to which it wasconnected. (Solid lines) The strongest of the subfields; (dashed lines) the weaker subfield.In almost every case, the receptive-field center of the connected relay cell overlapped thesubfield of the same polarity (dashed and solid circles).
neurons are orientation selective in ferrets (Chapman & Stryker 1993), however,it remains to be determined whether, on a cell-by-cell basis, there is a consistentrelationship between the distribution of the receptive fields of the presynapticafferents and the orientation preference of the cell.
The Relative Strength of Geniculate Input to Simple Cells
In the debate over the relevance of the feed-forward model to the origin of ori-entation selectivity, evaluating the strength of the geniculate excitation to simplecells has become as critical as understanding its spatial organization. Whereas thefeed-forward model relies on the geniculate projection to provide the predominant
Ann
u. R
ev. N
euro
sci.
2000
.23:
441-
471.
Dow
nloa
ded
from
arj
ourn
als.
annu
alre
view
s.or
gby
PA
LC
I on
09/
09/0
8. F
or p
erso
nal u
se o
nly.
ORIENTATION SELECTIVITY 447
excitatory input to simple cells, alternative models, particularly excitatory feed-back models of orientation selectivity (see below), assume that the geniculateinput is relatively weak and poorly tuned for stimulus orientation compared withinputs from other cortical cells. Anatomical estimates vary widely for the pro-portion of the total excitatory input in layer 4 contributed by geniculate terminals.Peters & Payne (1993) calculated the proportion to be 5%, judging from theestimates of the density of cells found there, the total number of synapses percell, the total number of geniculate neurons, and the number of boutons formedby each geniculate arbor. Ahmed et al (1994) identified geniculate boutons in theelectron microscope by their size, after labeling a small sample of them andfinding that they were far larger than those originating from other sources. Fromtheir counts, they estimated that geniculocortical inputs made up 6% of the popu-lation in layer 4. LeVay & Gilbert (1976) and Einstein et al (1987) counted theproportion of excitatory terminals in layer 4 that were labeled autoradiographi-cally after radioactive tracer injections into the LGN. These counts of directlyidentified afferent terminals yield the highest numbers of all, between 22%and 26%.
More relevant to the debate than anatomical measures, however, are physio-logical measures of the relative strength of the geniculate input. Some types ofsynapses might generate synaptic drive disproportionate to their number, giventhat their neurons of origin might fire at greater rates than other types, that theymay simply release more transmitter, or that they may have more or larger post-synaptic channels or be located closer to the soma. In particular, thalamocorticalsynapses are large and specialized and, hence, likely to be particularly effectivephysiologically (Ahmed et al 1994). Gil et al (1999) recently found, in studies ofthalamocortical slices from rat somatosensory system, that thalamocortical syn-apses are about five times stronger physiologically than intracortical synapseswithin layer 4. Similar results were found in studies of cat visual cortical slices,in which putative geniculocortical synapses were identified in response to white-matter stimulation (Stratford et al 1996).
The first in vivo physiological estimates of the strength of the geniculate inputcame from cross-correlation studies. Tanaka (1983) and Reid & Alonso (1995)found that a single geniculate afferent could account for between 1% and 20%of the spikes in a simple cell, judging from the proportion of simple cell spikesthat were preceded at monosynaptic latencies by a spike in the relay cell. Giventhat each simple cell likely receives input from multiple relay cells, the total inputfrom all the presynaptic relay cells could be stronger still, even taking into accountthe spike correlations among relay cells (Alonso et al 1996).
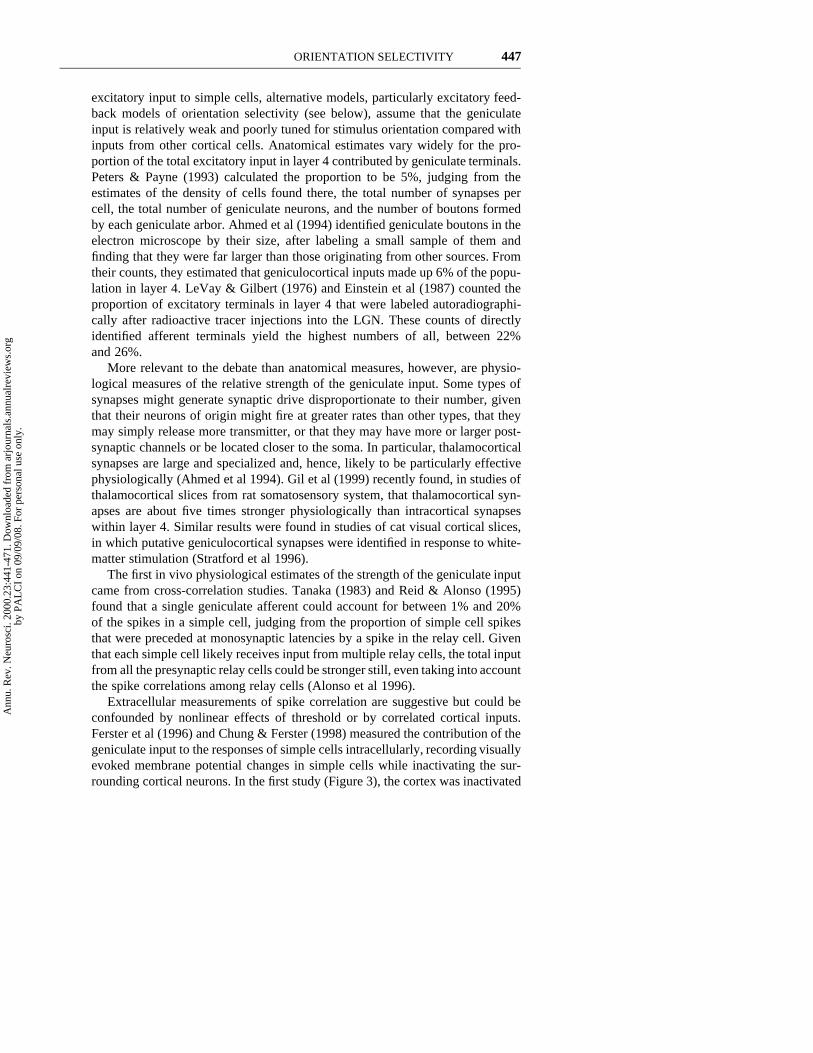
Extracellular measurements of spike correlation are suggestive but could beconfounded by nonlinear effects of threshold or by correlated cortical inputs.Ferster et al (1996) and Chung & Ferster (1998) measured the contribution of thegeniculate input to the responses of simple cells intracellularly, recording visuallyevoked membrane potential changes in simple cells while inactivating the sur-rounding cortical neurons. In the first study (Figure 3), the cortex was inactivated
Ann
u. R
ev. N
euro
sci.
2000
.23:
441-
471.
Dow
nloa
ded
from
arj
ourn
als.
annu
alre
view
s.or
gby
PA
LC
I on
09/
09/0
8. F
or p
erso
nal u
se o
nly.
448 FERSTER n MILLER
0
10
20
0
0.5
1.0
0° 180° 360°
38°C9°C
Am
plitude (mV
)
Orientation
5 ms
38°C
9°C
0°
90°
180°
270°
38°C 9°CA C
B
D
E
0.5 mV5 mV 200 ms
5 mV
1 mV
Figure 3 The effects of cooling on the visually and electrically evoked responses of a layer 4simple cell. (A) Response of a simple cell in layer 4 to electrical stimulation of the lateralgeniculate nucleus (LGN) (1 mA, 200 ls) recorded with the cortex at normal temperature. Theshort (1.8 ms) and stable latency indicates that this cell received monosynaptic excitation fromthe LGN. The monosynaptic excitatory postsynaptic potential (EPSP) was followed by a long-lasting (150 ms) inhibitory postsynaptic potential (IPSP) of disynaptic origin. (B) When thecooling plate temperature was lowered to 98C, the latency of the EPSP increased to 5 ms, its risetime was dramatically slowed, and its amplitude was reduced. The IPSP disappeared. (C) Thecell’s response to drifting gratings of 12 different orientations. Each trace is the averaged responseto 20 grating cycles. (D) Responses to the same visual stimuli as in C but with the cortex cooled.The responses are similar in shape to those in C but over 17 times smaller in amplitude (notedifferent vertical scales). (E) Orientation tuning curves constructed from the records of C and D.Each point indicates the peak-to-peak amplitude of the first harmonic (2 Hz) component of thecorresponding trace. (Again, note the different vertical scales for the two plots.)
by local cooling around the site of the intracellular recording. Control experimentsindicated that during cooling, cortical cells ceased to fire action potentials inresponse to drifting grating or bar stimuli, with the exception of a small fractionof the spikes deep within the cortex in layer 6. During cooling, therefore, thevisually evoked activity recorded intracellularly in simple cells was assumed tobe of geniculate origin. This remaining activity ranged in amplitude between 5%and 50% of the normal response to the same stimuli. After correcting for thedirect effects of cooling on the amplitude of synaptic potentials originating in thegeniculate terminals, these authors estimated that the geniculate input was respon-sible for generating approximately 35% of the visual responses. The remaining
Ann
u. R
ev. N
euro
sci.
2000
.23:
441-
471.
Dow
nloa
ded
from
arj
ourn
als.
annu
alre
view
s.or
gby
PA
LC
I on
09/
09/0
8. F
or p
erso
nal u
se o
nly.
ORIENTATION SELECTIVITY 449
65% of the responses must therefore originate from intracortical sources, whichgiven the nature of the measurements, could include both excitatory and inhibitoryinputs.2
In a second intracellular study of geniculate input (Chung & Ferster 1998), thecortex was inactivated by electrical stimulation. A single shock to the upper layersof the cortex was found to suppress the response of cortical cells throughout thelayers to a briefly flashed, optimally oriented grating. In an important controlexperiment, the shock also completely suppressed the flash-evoked EPSPs incortical cells whose input from the LGN was mediated entirely by other corticalcells, a further indication that almost all cortical cells had failed to respond to thevisual stimulus. Recordings were then made from simple cells that were known,by their short latency responses to electrical stimulation of the LGN, to receivedirect input from geniculate relay cells. Silencing the cortical circuit by localstimulation reduced the amplitude of the visually evoked EPSPs in these cells toan average of 46% of their normal size. The cooling experiment and the shock-inactivation experiment are therefore in approximate agreement, which suggeststhat roughly one third to one half of the excitatory input evoked in cortical cellsoriginates in the geniculate, with the remaining inputs arising from nearby corticalcells.
The Orientation Tuning of the Geniculate Inputto Simple Cells
Given the measured aspect ratio of the simple cell subfields (Jones & Palmer1987a,b) and the cross-correlation studies that suggest that the subfields arisefrom geniculate input (Tanaka 1983, Reid & Alonso 1995), it seemed likely thatthe relay cell input to a simple cell would by itself show significant orientationselectivity. To test this conjecture, in both of the cortical inactivation experiments(Ferster et al 1996, Chung & Ferster 1998), the orientation selectivity of themembrane potential fluctuations evoked by visual stimulation was measuredbefore and during cortical inactivation. Neither method of cortical inactivationsignificantly altered the width of orientation tuning of the visually evoked EPSPs[Ferster et al (1996) used drifting sinusoidal gratings as the stimulus, and onlythe tuning of the amplitude of temporal modulations of the voltage was measured;the mean voltage and its tuning were not measured]. Thus, the geniculate inputis well tuned for orientation, as is predicted by its spatial organization (Tanaka1983, Reid & Alonso 1995).
Note that these experiments also indicate that the orientation tuning of theinactivated intracortical input to these cells is similar to that of the thalamic input.
2The measure of visual response used was the amplitude of the temporal modulation ofintracellular voltage around its mean in response to drifting sinusoidal gratings of thepreferred orientation. Inhibition could contribute to the amplitude of the modulation byincreasing the size of its negative-going portion.
Ann
u. R
ev. N
euro
sci.
2000
.23:
441-
471.
Dow
nloa
ded
from
arj
ourn
als.
annu
alre
view
s.or
gby
PA
LC
I on
09/
09/0
8. F
or p
erso
nal u
se o
nly.
450 FERSTER n MILLER
This point lends additional support to the feed-forward model. The orientationtuning of the LGN input to a simple cell is not fixed; rather, it depends on thestimuli used. For example, gratings of increasing spatial frequency yield increas-ingly narrowly tuned LGN input (Troyer et al 1998). For the LGN input and thecortically induced input to have identical orientation tuning, the cortical inputmust follow the tuning of the LGN inputs, supporting the primacy of the LGNinput in determining orientation tuning.
Spike Threshold and Orientation Tuning
The original feed-forward model of Hubel & Wiesel (1962) implicitly consistsof two processing stages. The first, the linear summation of input from relay cellswhose receptive fields are arranged in rows, has been addressed by many of theexperiments discussed so far. The second stage is the nonlinear filtering of thesummed inputs by the spike threshold. Threshold is critical to the model in itssimplest form: Even when a stimulus is at right angles to the preferred orientation,it will activate a few geniculate neurons because they themselves are not orien-tation selective. Hubel & Wiesel, therefore, invoked threshold to prevent a simplecell from responding to these low-amplitude inputs (though other mechanisms,such as inhibition, could also contribute, as discussed below). Until recently, theexperiment that could directly test the effects of threshold on orientation selec-tivity, i.e. a comparison of the orientation tuning of the membrane potential withthe orientation tuning of spike responses in the same neurons, had not been per-formed. Doing so requires intracellular recordings that are stable and, more impor-tant, that perturb the relationship between spike frequency and membranepotential as little as possible. The advent of in vivo patch recording (Pei et al1991, Jagadeesh et al 1992) has made such recordings possible, even for the smallneurons of layer 4. In a recent experiment (Carandini & Ferster, 2000), it wasshown that the orientation tuning of the spike responses is significantly narrowedrelative to the tuning of the synaptic inputs. These authors found that the averagehalf-width at half height of the orientation tuning curve for membrane potentialin simple cells was 65% greater than that of the spikes (388 vs 238), which suggeststhat threshold plays a significant role in shaping the responses of the simple cells.
FAILURES OF THE FEED-FORWARD MODEL:CONTRAST INVARIANCE OF ORIENTATION TUNING
The above experiments together make a convincing case for the basic organizationof the simple cell receptive field—its subfields, its preferred orientation, and somemeasure of its orientation selectivity—being laid out by the spatial organizationof the geniculate input. Not all of the response properties of simple cells, however,can be successfully predicted from this simple scheme.
Ann
u. R
ev. N
euro
sci.
2000
.23:
441-
471.
Dow
nloa
ded
from
arj
ourn
als.
annu
alre
view
s.or
gby
PA
LC
I on
09/
09/0
8. F
or p
erso
nal u
se o
nly.
ORIENTATION SELECTIVITY 451
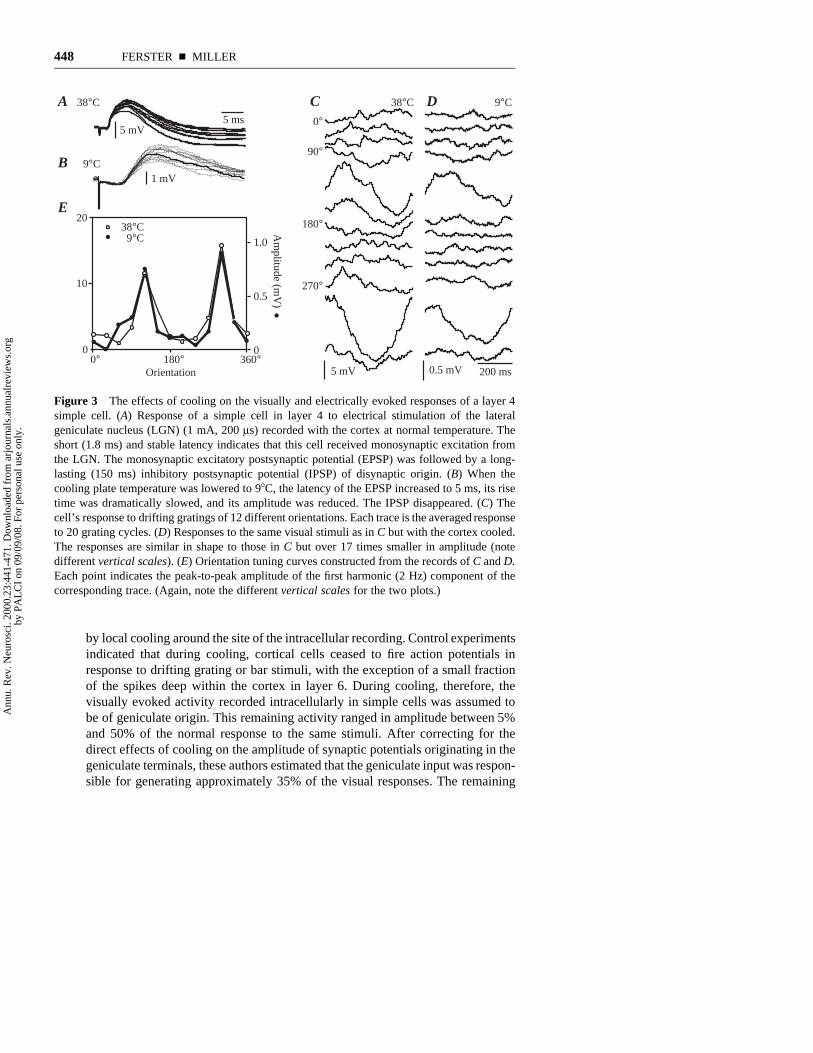
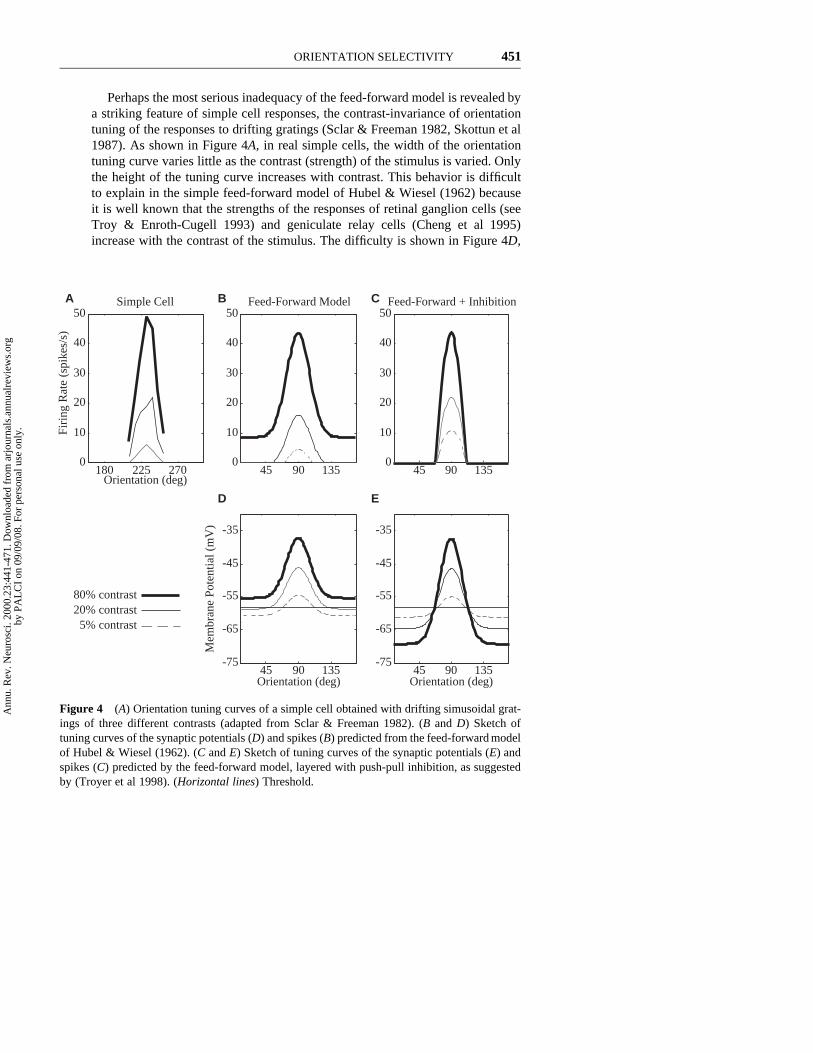
Perhaps the most serious inadequacy of the feed-forward model is revealed bya striking feature of simple cell responses, the contrast-invariance of orientationtuning of the responses to drifting gratings (Sclar & Freeman 1982, Skottun et al1987). As shown in Figure 4A, in real simple cells, the width of the orientationtuning curve varies little as the contrast (strength) of the stimulus is varied. Onlythe height of the tuning curve increases with contrast. This behavior is difficultto explain in the simple feed-forward model of Hubel & Wiesel (1962) becauseit is well known that the strengths of the responses of retinal ganglion cells (seeTroy & Enroth-Cugell 1993) and geniculate relay cells (Cheng et al 1995)increase with the contrast of the stimulus. The difficulty is shown in Figure 4D,
45 90 135-75
-65
-55
-45
-35
D
Orientation (deg)
Mem
bran
e Po
tent
ial (
mV
)
45 90 1350
10
20
30
40
50Feed-Forward ModelB
45 90 135-75
-65
-55
-45
-35
E
Orientation (deg)
45 90 1350
10
20
30
40
50Feed-Forward + InhibitionC
180 225 2700
10
20
30
40
50Simple Cell
Orientation (deg)
Firi
ng R
ate
(spi
kes/
s)
A
0.4
5% contrast20% contrast80% contrast
Figure 4 (A) Orientation tuning curves of a simple cell obtained with drifting simusoidal grat-ings of three different contrasts (adapted from Sclar & Freeman 1982). (B and D) Sketch oftuning curves of the synaptic potentials (D) and spikes (B) predicted from the feed-forward modelof Hubel & Wiesel (1962). (C and E) Sketch of tuning curves of the synaptic potentials (E) andspikes (C) predicted by the feed-forward model, layered with push-pull inhibition, as suggestedby (Troyer et al 1998). (Horizontal lines) Threshold.
Ann
u. R
ev. N
euro
sci.
2000
.23:
441-
471.
Dow
nloa
ded
from
arj
ourn
als.
annu
alre
view
s.or
gby
PA
LC
I on
09/
09/0
8. F
or p
erso
nal u
se o
nly.
452 FERSTER n MILLER
where the peak excitatory input that would arise from the geniculate input inresponse to drifting gratings is plotted as a function of orientation for differentcontrasts. A key feature of the model is that even at nonpreferred orientations,the depolarization at high contrast will be nonzero and will increase with contrast.
To understand this behavior, consider a grating at right angles to the cell’spreferred orientation. Where it crosses an ON region of the receptive field, thebright portion of the grating will activate the underlying ON-center geniculaterelay cells at rates as high as 100 spikes per second. At the same time, the brightportion of the grating will suppress OFF-center inputs where it crosses the OFF
region of the receptive field. But the reduction in the responses of the suppressedOFF-center cells saturates at zero spikes per second, and because the activity startsfrom a relatively low spontaneous rate of 10–15 spikes per second, the reductioncannot balance out the excitation of the ON-center cells. So stimuli of the non-preferred orientation above a certain contrast evoke a net excitation from the relaycells. Furthermore, the amplitude of these nonoptimal relay cell responses growswith contrast, because the responses of the relay cells themselves grow withcontrast. As a result (Figure 4D), the model predicts that the net excitation evokedby nonoptimal orientations at high contrasts can exceed that evoked by the pre-ferred orientation at low contrast.
Because both the baseline level of the predicted membrane potential tuningcurve and the size of its peak grow with stimulus contrast, the feed-forward modelbreaks down when an unvarying threshold is applied to derive the spike responsesof the cell (Figure 4B). No matter where the threshold is placed, the orientationtuning width of the resulting firing rate responses will show considerable broad-ening with increasing contrast, unlike the responses of real simple cells. This isthe “iceberg effect”—beneath the spiking threshold lies more broadly tuned excit-atory input, which would be revealed by increasing contrast in the feed-forwardmodel. Furthermore, if the threshold is too high, stimuli at low contrasts willevoke no spike responses at all, whereas with low thresholds, stimuli at suffi-ciently high contrast will evoke responses at all orientations. Yet few simple cellsshow these behaviors (Figure 4A).
The contrast-invariance of orientation tuning has not been studied for stimuliother than drifting gratings, but similar problems exist for any stimulus. For exam-ple, consider a drifting bar. Even a low-contrast bar evokes spikes at the preferredorientation, whereas even a high-contrast bar does not evoke spikes at the orthog-onal orientation. Yet the high-contrast bar will evoke net LGN excitation, becauseit will raise the firing rates of the LGN inputs it excites much more than it canlower the firing rates of the LGN inputs it suppresses. Because this net excitationincreases with contrast, a sufficiently low-contrast bar of the preferred orientationand a high-contrast orthogonally oriented bar will yield the same peak level ofLGN input, a level that must be suprathreshold given the spiking responsesevoked by the preferred-orientation stimulus. Thus, the feed-forward modelwould predict spiking responses at nonpreferred orientations to high-contrastdrifting bars.
Ann
u. R
ev. N
euro
sci.
2000
.23:
441-
471.
Dow
nloa
ded
from
arj
ourn
als.
annu
alre
view
s.or
gby
PA
LC
I on
09/
09/0
8. F
or p
erso
nal u
se o
nly.
ORIENTATION SELECTIVITY 453
In summary, if the signal underlying simple cell orientation tuning originatesin feed-forward LGN input, then to explain contrast-invariant tuning, some mech-anism must raise the amount of LGN input required to yield a spiking responseat higher stimulus contrasts.
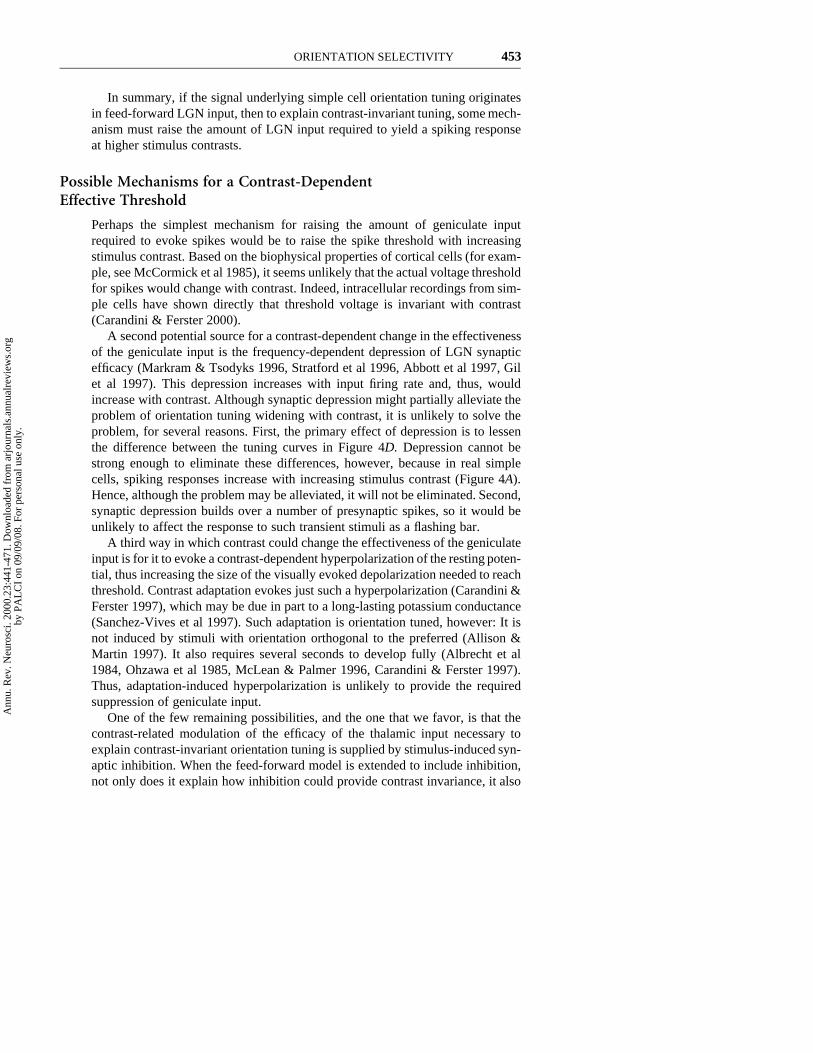
Possible Mechanisms for a Contrast-DependentEffective Threshold
Perhaps the simplest mechanism for raising the amount of geniculate inputrequired to evoke spikes would be to raise the spike threshold with increasingstimulus contrast. Based on the biophysical properties of cortical cells (for exam-ple, see McCormick et al 1985), it seems unlikely that the actual voltage thresholdfor spikes would change with contrast. Indeed, intracellular recordings from sim-ple cells have shown directly that threshold voltage is invariant with contrast(Carandini & Ferster 2000).
A second potential source for a contrast-dependent change in the effectivenessof the geniculate input is the frequency-dependent depression of LGN synapticefficacy (Markram & Tsodyks 1996, Stratford et al 1996, Abbott et al 1997, Gilet al 1997). This depression increases with input firing rate and, thus, wouldincrease with contrast. Although synaptic depression might partially alleviate theproblem of orientation tuning widening with contrast, it is unlikely to solve theproblem, for several reasons. First, the primary effect of depression is to lessenthe difference between the tuning curves in Figure 4D. Depression cannot bestrong enough to eliminate these differences, however, because in real simplecells, spiking responses increase with increasing stimulus contrast (Figure 4A).Hence, although the problem may be alleviated, it will not be eliminated. Second,synaptic depression builds over a number of presynaptic spikes, so it would beunlikely to affect the response to such transient stimuli as a flashing bar.
A third way in which contrast could change the effectiveness of the geniculateinput is for it to evoke a contrast-dependent hyperpolarization of the resting poten-tial, thus increasing the size of the visually evoked depolarization needed to reachthreshold. Contrast adaptation evokes just such a hyperpolarization (Carandini &Ferster 1997), which may be due in part to a long-lasting potassium conductance(Sanchez-Vives et al 1997). Such adaptation is orientation tuned, however: It isnot induced by stimuli with orientation orthogonal to the preferred (Allison &Martin 1997). It also requires several seconds to develop fully (Albrecht et al1984, Ohzawa et al 1985, McLean & Palmer 1996, Carandini & Ferster 1997).Thus, adaptation-induced hyperpolarization is unlikely to provide the requiredsuppression of geniculate input.
One of the few remaining possibilities, and the one that we favor, is that thecontrast-related modulation of the efficacy of the thalamic input necessary toexplain contrast-invariant orientation tuning is supplied by stimulus-induced syn-aptic inhibition. When the feed-forward model is extended to include inhibition,not only does it explain how inhibition could provide contrast invariance, it also
Ann
u. R
ev. N
euro
sci.
2000
.23:
441-
471.
Dow
nloa
ded
from
arj
ourn
als.
annu
alre
view
s.or
gby
PA
LC
I on
09/
09/0
8. F
or p
erso
nal u
se o
nly.
454 FERSTER n MILLER
accounts for some of the known receptive-field properties of inhibition in simplecells.
Strong Push-Pull Inhibition Can Solve the Problem ofContrast-Invariant Tuning
Consider layering an inhibitory input on top of the input from relay cells, an inputwith a receptive field identical to that of the excitatory input, but with oppositeresponse polarity (ON instead of OFF, and OFF instead of ON). Each ON regionwould then receive ON excitation and OFF inhibition, and each OFF region wouldreceive OFF excitation and ON inhibition. With these inhibitory inputs in place,the peak response to a bar or grating of the preferred orientation would be unaf-fected because the excitation and inhibition would occur out of phase with oneanother: Whenever the excitation was peaking, the inhibition would be at itsminimum, and vice versa. The response to orthogonally oriented bars, on theother hand, would be strongly affected. If the inhibition had the same contrastsensitivity and strength as the excitation, and if ON and OFF regions had equalstrength, an orthogonally oriented bar would activate ON inhibition from the OFF
region that exactly cancelled the ON excitation from the ON region, no matter whatthe contrast of the stimulus.
With excitation and inhibition of exactly equal strength, the baseline in thetuning curve of the synaptic input to a simple cell would be invariant with con-trast: At nonpreferred orientations, the excitation and inhibition would exactlycancel one another at all contrasts. But even if ON and OFF regions had equalstrengths, this antiphase inhibition would not entirely solve the problem ofcontrast-invariant tuning (Troyer et al 1998). The height of the curves would stillgrow in amplitude with contrast so the portion of the peak that reaches abovethreshold would still widen with contrast. The orientation tuning of the spikeresponses would then still not be completely contrast invariant.
A full solution can be found by assuming that the antiphase inhibition is suf-ficiently stronger than the relay-cell excitation (Troyer et al 1998). This has theeffect of actually pulling the baseline in Figure 4D down as contrast is increasedand the peak grows, so that the width of the peak at the point that it crossesthreshold remains constant (Figure 4E). In this way, the feed-forward model withadded inhibition can achieve contrast invariant orientation tuning. Furthermore,this mechanism is surprisingly insensitive to the strength of the inhibition: oncethe inhibition is sufficiently strong, increasing it further simply sharpens the ori-entation tuning, while maintaining the contrast invariance of the tuning (Troyeret al 1998).
Simple Cells Receive Strong Push-Pull Inhibition
Antiphase or push-pull inhibition was first proposed by Hubel & Wiesel (1962),though they did not discuss its importance for contrast invariance. There is nowample evidence both from extracellular (Heggelund 1981, Palmer & Davis 1981)
Ann
u. R
ev. N
euro
sci.
2000
.23:
441-
471.
Dow
nloa
ded
from
arj
ourn
als.
annu
alre
view
s.or
gby
PA
LC
I on
09/
09/0
8. F
or p
erso
nal u
se o
nly.
ORIENTATION SELECTIVITY 455
and intracellular (Ferster 1988, Borg-Graham et al 1998, Hirsch et al 1998; JSAnderson, M Carandini & D Ferster, submitted for publication) recordings thatsimple cells do, in fact, receive strong OFF inhibition in their ON subfields, andstrong ON inhibition in their OFF subfields. This push-pull inhibition is strongerthan relay-cell excitation, as required by Troyer et al’s model (1998). This wasdemonstrated in intracellular recordings by Hirsch et al (1998), who showed thatpush-pull inhibition can completely suppress the response of simple cells to excit-atory inputs. When a flashed spot of light that evoked a strong excitation fromone subregion was moved slightly to encroach on a neighboring subregion ofopposite polarity, the resulting push-pull inhibition overwhelmed the excitatoryresponse, instead yielding hyperpolarization.
The overall dominance of cortical inhibition over excitation is also suggestedby other experiments. Electrical stimulation of the LGN (Ferster 1986, Douglas& Martin 1991) or of the cortex (Hirsch & Gilbert 1991, Chung & Ferster 1998)evokes a brief excitation followed by a long lasting and often stronger inhibition.The same is often true of briefly flashed visual stimuli (Hirsch et al 1998). Mea-surements of excitatory and inhibitory conductances evoked by drifting gratingsshow that the latter can be 2–5 times as large as the former (JS Anderson, MCarandini & D Ferster, submitted for publication).
Push-pull inhibition is by far the dominant if not the sole form of inhibitionreceived by simple cells. Any inhibition that is not in a push-pull arrangement,e.g. ON inhibition in an ON subfield, must be far weaker. To see this, note that alight spot flashed in an ON subregion evokes a strong depolarizing response.Therefore any inhibition evoked by the spot must be much weaker than the evokedexcitation. Another important feature of the inhibition received by simple cells isits orientation tuning. Intracellular recordings show that this inhibition is maximalat the preferred orientation and falls off strongly away from the preferred. Theorientation tuning width of the inhibition received by a cell appears to be nearlyidentical to that of the cell’s excitatory inputs (Ferster 1986, Douglas et al 1991,Nelson et al 1994; JS Anderson, M Carandini & D Ferster, submitted forpublication).
What Is the Source of the Push-Pull Inhibition?
There are a number of possible sources for push-pull inhibition with the propertiespredicted by Troyer et al’s model (1998). One possible source is direct input frominhibitory geniculate relay cells (Carandini & Heeger 1994). The receptive fieldsof these relay cells would have the same arrangement into elongated rows as thatproposed by Hubel and Wiesel for the excitatory input. Were they to exist, theywould fit exactly the criteria of a contrast response function similar to that of therelay cells, and complementary spatial organization to the excitatory input. Unfor-tunately, no physiological evidence for direct inhibition from relay cells has beenfound (Ferster & Lindstrom 1983, Martin & Whitteridge 1984), though someanatomical evidence has been reported (Einstein et al 1987).
Ann
u. R
ev. N
euro
sci.
2000
.23:
441-
471.
Dow
nloa
ded
from
arj
ourn
als.
annu
alre
view
s.or
gby
PA
LC
I on
09/
09/0
8. F
or p
erso
nal u
se o
nly.
456 FERSTER n MILLER
Thus, it is more realistic to fashion push-pull inhibition out of input fromcortical inhibitory interneurons. An obvious problem, however, is that most cor-tical cells are strongly orientation selective. The inhibitory simple cells, if theywere like the cortical cells most often recorded, would not normally fire inresponse to an orthogonally oriented stimulus, and so they would fail to counteractthe nonzero baseline in the orientation tuning curves of Figure 4D.
One fix would be to arrange for each simple cell to receive inhibition from alarge pool of other simple cells of all preferred orientations. At the preferredorientation of the postsynaptic cell, the subfields of the inhibitory interneuronswould be aligned with those of the postsynaptic cell but have opposite responsepolarity, and so generate the observed push-pull arrangement. These interneuronswould provide strong inhibition. At nonpreferred orientations, many differentinterneurons with many different receptive-field locations would counterbalancethe relay cell input evoked by a bar of any orientation and location. [Note thatthis pool of inhibitory inputs would need to provide a signal that is subtractedfrom the feed-forward geniculate input, rather than dividing it, as in “normali-zation” models (Carandini & Heeger 1994) discussed below.] Compared with thepush-pull inhibition at the preferred orientation, which is known to be strong,these interneurons would provide only weak inhibition at the orthogonal orien-tation, in accordance with the inhibition observed in simple cells. The inhibitionwould only need to be strong enough to overcome the relatively small relay-cellexcitation predicted by the feed-forward model to come from the relay cells inresponse to orthogonal stimuli.
A second possibility has been proposed by Troyer et al (1998). In their model,the interneurons providing push-pull inhibition to simple cells all have preferredorientations similar to that of the postsynaptic cell (530 degrees), but theyrespond much like the uncompensated feed-forward input itself. These interneu-rons, unlike the classical simple cell, would respond much like the one depictedin Figure 4B and D. For stimuli of the preferred orientation, they would act likenormal simple cells, responding in the normal, position-sensitive way only whenbright stimuli were located in an ON region and/or dark stimuli were in an OFF
region. For stimuli of the nonpreferred orientation, these cells would show weakresponses that grow with contrast, much like the LGN input in Figure 4B and D.The orientation tuning of these inhibitory simple cells, then, would not be invar-iant with contrast. They would retain the properties of the pure feed-forward input.
Although these inhibitory interneurons are themselves not contrast invariantin orientation, they would be in a position to generate contrast invariance in theirneighbors. Consider a group of simple cells with a given preferred orientation. Ahigh-contrast stimulus orthogonal to this preferred orientation will provide LGNinput strong enough to evoke a response in simple cells unless the simple cellsare sufficiently inhibited. In the model, some of the simple cells in the group—the postulated interneurons—do respond, and they provide the inhibition thatprevents the remainder of the cells from firing.
A critical prediction of this model is the existence of inhibitory interneuronsin layer 4 with simple receptive fields that respond to stimuli of the nonpreferred
Ann
u. R
ev. N
euro
sci.
2000
.23:
441-
471.
Dow
nloa
ded
from
arj
ourn
als.
annu
alre
view
s.or
gby
PA
LC
I on
09/
09/0
8. F
or p
erso
nal u
se o
nly.
ORIENTATION SELECTIVITY 457
orientation in a manner that increases with increasing stimulus contrast. Theseinterneurons would respond more or less as predicted by the feed-forward modelin its simplest form (Hubel & Wiesel 1962). It is difficult, however, to assessfrom current data whether these neurons exist. A large number of simple cellshave been described in extracellular studies of the cortex. About 10–15% ofvisually responsive neurons in cat V1 are poorly tuned or nonselective for ori-entation (earlier work reviewed in Fregnac & Imbert 1984, Maldonado et al 1997).This percentage could easily include the postulated layer 4 interneurons, whichare probably underrepresented in the sample. Interneurons form only 15–20% ofcortical cells and, being small, are likely to have been recorded less frequentlythan excitatory cells. Nor is it often possible to identify interneurons from extra-cellular recordings. A few interneurons have been identified intracellularly andare reported to have simple receptive fields with orientation tuning, althoughdetails of tuning were not reported (Gilbert & Wiesel 1979). A recent such studyof eight identified interneurons found, suggestively, that all respond to orienta-tions orthogonal to their preferred (Azouz et al 1997). Unfortunately, no inter-neurons have yet been studied thoroughly enough to determine whether theypossess all the properties predicted by Troyer et al (1998). A search for the pro-posed interneurons remains a key experiment with which to test the model.
Development of the Contrast-Invariant Circuit
One of the questions most often asked about the feed-forward model of orientationselectivity is how the underlying circuitry develops. The question becomes par-ticularly puzzling in light of the observation that orientation selectivity developsin the absence of patterned visual input, e.g. before a kitten’s eyes open (Hubel& Wiesel 1970, Movshon & Van Sluyters 1981, Fregnac & Imbert 1984, Crairet al 1998) . Miller (1994) showed that the arrangement of ON and OFF inputs toa simple cell predicted by the feed-forward model can develop from activity-dependent rules of synaptic modification, provided that spontaneous LGN activitypatterns in the developing animal have certain simple structures. The developmentof intracortical connections can be explained by these same rules (Kayser & Miller1998; Miller et al 1999). Excitatory cells would develop connections to correlatedcells, whereas inhibitory cells would develop connections with anticorrelatedcells. These rules yield the required push-pull inhibition. In addition, they yieldexcitation among cells that have roughly superimposed ON regions and super-imposed OFF regions (same-phase excitation). The inhibition yields contrast-invariant tuning, as we have seen, whereas the excitation amplifies the tunedresponses (Ferster et al 1996, Chung & Ferster 1998, Troyer et al 1998).
Experimental Support for the Feed-Forward Model withPush-Pull Inhibition and Same-Phase Excitation
The feed-forward model with push-pull inhibition and same-phase excitation isconsistent with a number of observations obtained from intracellular recordingsof simple cells and described above. First, there is the motivating observation that
Ann
u. R
ev. N
euro
sci.
2000
.23:
441-
471.
Dow
nloa
ded
from
arj
ourn
als.
annu
alre
view
s.or
gby
PA
LC
I on
09/
09/0
8. F
or p
erso
nal u
se o
nly.
458 FERSTER n MILLER
excitation and inhibition are spatially opponent (push-pull inhibition). Second,the orientation tuning of inhibition to simple cells in the model is identical to thatof excitation: Both peak at the preferred orientation and fall off to small valuesat the orthogonal orientation, as observed in vivo. Third, the model is consistentwith the cortical inactivation experiments (Ferster et al 1996, Chung & Ferster1998), which show that the orientation tuning of visually evoked responses doesnot change when cortical cells are silenced, and which show additionally that thecortex amplifies responses to the LGN inputs two- to threefold. Fourth, the modelexplains why push-pull inhibition must be so strong relative to feed-forward exci-tation. The behavior of the model of Troyer et al (1998) conforms to that ofsimple cells in two other important ways. Iontophoresis of GABAA antagonistsinto the visual cortex has long been known to degrade or even abolish orientationselectivity (Sillito 1975, Tsumoto et al 1979), whereas intracellular blockade ofGABAA inhibition in a single cell has little effect on the cell’s orientation selec-tivity (Nelson et al 1994). The model closely mimics these behaviors. Because itis a variant of the feed-forward model and because it relies on the spatial orga-nization of the geniculate input for establishing orientation selectivity, the modelof Troyer et al also exhibits a decrease in orientation tuning width with increasingstimulus spatial frequency (Vidyasagar & Siguenza 1985, Webster & De Valois1985, Jones et al 1987, Hammond & Pomfrett 1990). Again, the existence ofinterneurons with the proposed response properties is a key test of the model.
NORMALIZATION AND THE FEED-FORWARD MODEL
In addition to the contrast invariance of orientation selectivity, there are severalother properties of simple cells that must be addressed by any model of corticalfunction. First, cortical responses saturate as the contrast of a stimulus increases.The responses, however, saturate not at a fixed firing rate determined by theelectrical properties of the cell but at a rate that changes with the stimulus (Maffeiet al 1973, Dean 1981, Albrecht & Hamilton 1982). Responses to stimuli ofnonoptimal orientation or spatial frequency saturate at lower firing rates than dothe responses to optimal stimuli. Second, as the contrast of a stimulus increases,the time course of the responses of simple cells changes. Specifically, the temporalphase (or latency) of the response to a sinusoidal grating advances in time (Dean& Tolhurst 1986, Albrecht 1995, Carandini et al 1997). Third, responses to grat-ings of high temporal frequency increase more with increasing contrast than doresponses to gratings of low temporal frequency. As a consequence, the temporalfrequency tuning of simple cells changes with contrast (Albrecht 1995). Finally,the response to a superposition of two stimuli is often less than the sum of theresponses to each stimulus alone, even when one of the component stimuli evokesno response at all. A prominent example of this effect is cross-orientation inhi-bition: Two gratings, one of the preferred-orientation and one of the orthogonalorientation, evoke a smaller response than does the preferred-orientation grating
Ann
u. R
ev. N
euro
sci.
2000
.23:
441-
471.
Dow
nloa
ded
from
arj
ourn
als.
annu
alre
view
s.or
gby
PA
LC
I on
09/
09/0
8. F
or p
erso
nal u
se o
nly.
ORIENTATION SELECTIVITY 459
alone (Morrone et al 1982, Bonds 1989, Bauman & Bonds 1991, DeAngelis etal 1992, Geisler & Albrecht 1992, Nelson 1991, Gulyas et al 1987, De Valois etal 1985, Hammond & MacKay 1981, Li & Creutzfeldt 1984, Bishop et al 1973,Ferster 1981).
The normalization models were proposed (Albrecht & Geisler 1991, Heeger1992) to explain some of these effects. In these models, the feed-forward genic-ulate input is assumed to grow linearly with stimulus contrast, but it is dividedor normalized just prior to threshold by an inhibitory input whose strength alsoincreases with contrast. The combination of the inhibition and excitation yieldsa sigmoidal, saturating function of contrast. Caradini & Heeger (1994) proposedthat the normalization signal would take the form of a shunting inhibition drivenby the pooled responses of surrounding neurons of many different preferred ori-entations and spatial frequencies. The shunting inhibition, which would thus beorientation independent but increase with stimulus contrast, would increase theconductance of a cell. This shunt would lower the membrane time constant ofthe cell, thereby lowering its integration time, with the resulting effect of advanc-ing the phase of responses to sinusoidal gratings and enhancing responses tohigher temporal frequencies (Carandini & Heeger 1994, Carandini et al 1997).Finally, a shunting inhibition at all orientations could explain cross-orientationinhibition.
Although the normalization models can be made to fit the spike responses ofsimple cells, two key predictions have not been borne out in intracellular exper-iments. First, the models require a large stimulus-evoked shunting conductancethat depends only on stimulus contrast and, hence, is independent of stimulusorientation. It now seems clear, despite initial indications to the contrary (Douglaset al 1988, Ferster & Jagadeesh 1992), that visual stimuli do indeed evoke largeincreases in the input conductance of simple cells (Borg-Graham et al 1998,Hirsch et al 1998; JS Anderson, M Carandini & D Ferster, submitted for publi-cation). The amplitudes of stimulus-induced conductance changes are stronglydependent on orientation, however, with a preferred orientation and tuning widthsimilar to that of the membrane potential responses (JS Anderson, M Carandini& D Ferster, submitted for publication). Second, the membrane time constantdoes not change sufficiently to explain contrast-dependent changes in temporalproperties. Normal resting time constants are in the range of 20 ms (Hirsch et al1998; JS Anderson, M Carandini & D Ferster, submitted for publication). Thenormalization model, however, requires decreases in time constant of 60 ms ormore, which is clearly impossible because time constants cannot go below zero.
How, then, can we explain the response properties that are described by thenormalization framework? It turns out that these properties can be explained inthe context of the feed-forward model with push-pull inhibition by a variety ofexisting nonlinearities in the electrical properties of cells and the temporal prop-erties of synaptic inputs (A Kayser, NJ Priebe & KD Miller, submitted for pub-lication). These include saturation- and contrast-dependent phase advance in theresponses of the LGN inputs themselves, frequency-dependent synaptic depres-
Ann
u. R
ev. N
euro
sci.
2000
.23:
441-
471.
Dow
nloa
ded
from
arj
ourn
als.
annu
alre
view
s.or
gby
PA
LC
I on
09/
09/0
8. F
or p
erso
nal u
se o
nly.
460 FERSTER n MILLER
sion, spike-rate adaptation, nonzero threshold, and small stimulus-inducedchanges in membrane time constant. Because LGN inputs saturate with contrast(Sclar 1987, Cheng et al 1995), we need only explain the difference betweenLGN and cortical saturating contrasts. This can be accounted for by synapticdepression (Stratford et al 1996, Markram & Tsodyks 1996), which causes thegeniculate synaptic input to saturate before presynaptic LGN firing rates saturate(Abbott et al 1997, Tsodyks & Markram 1997). Synaptic depression, togetherwith the other nonlinearities listed above, can also explain the difference betweenLGN and cortical phase advances (Chance et al 1998) and changes in temporalfrequency tuning with contrast. Synaptic depression and spike-rate adaptationact as contrast-dependent high-pass filters, allowing high-temporal-frequencyresponses to grow with contrast at a rate faster than low-temporal-frequencyresponses grow. Contrast-induced decrease in the membrane time constant alsocauses a relative enhancement of high-temporal-frequency responses withincreasing contrast. Finally, cross-orientation inhibition and other two-stimulussuppression effects can be accounted for, in part, by the push-pull inhibition inthe feed-forward model: The nonpreferred grating evokes strong push-pull inhi-bition, reducing responses to the preferred orientation (Krukowski et al 1998).
It should be noted that even if the feed-forward model with push-pull inhibitionand same-phase excitation were to prove largely correct, it is still at best incom-plete. A number of issues need to be addressed. The model does not currentlydeal with direction selectivity, for example, although it is likely that the additionof lagged and nonlagged input using the scheme proposed by Saul & Humphrey(1992) would fit well with the current model. The model also does not deal withthe diversity of cortical inhibitory interneurons. Studies in rat somatosensory thal-amocortical slices show two classes of inhibitory neurons in layer 4 (Gibson etal 1999): a feed-forward class receiving strong thalamic input, like the inhibitoryneurons of the model, and a feedback class receiving little or no thalamic input,which is not incorporated in the model. Furthermore, cells of each class showstrong gap junction coupling between cells of the same class. Intracellular studiesin cat V1 layer 4 have found some inhibitory neurons that respond primarily tostimulus contrast: They are complex cells (not selective for stimulus polarity) anduntuned or only weakly selective for stimulus orientation (J Hirsch, personalcommunication). Their role is unknown. Although the simplicity of the modelgives order to a wide variety of findings, the complexity of the cortical circuitshould not be underestimated.
FEEDBACK MODELS OF CORTICAL FUNCTION
So far we have focused on feed-forward models in which orientation selectivityis generated by the spatial organization of the receptive fields of presynapticgeniculate relay cells. In these models, intracortical connections serve to sharpenand render contrast invariant the orientation selectivity specified by the feed-
Ann
u. R
ev. N
euro
sci.
2000
.23:
441-
471.
Dow
nloa
ded
from
arj
ourn
als.
annu
alre
view
s.or
gby
PA
LC
I on
09/
09/0
8. F
or p
erso
nal u
se o
nly.
ORIENTATION SELECTIVITY 461
forward connections, and to amplify responses. In an alternative series of models,the cortical circuitry plays a much more central role in establishing orientationselectivity. These are the feedback models (Ben-Yishai et al 1995, Somers et al1995, Hansel & Sompolinsky 1996, Ben-Yishai et al 1997, Adorjan et al 1999),the first set of models developed to address the problem of contrast invariance oforientation selectivity (Figure 4) (for related models of other visual cortical phe-nomena, see Douglas & Martin 1991, Suarez et al 1995; see also Douglas et al1995).
In the feedback models, the geniculate input to simple cells is assumed to berelatively weak, compared with what is assumed by the feed-forward model and,more important, compared with the input from other cortical cells. The geniculateinput is typically also assumed to be poorly tuned for orientation, based on thoseexperiments that find small aspect ratios for the subfields of the simple cells (Peiet al 1994). Sharp orientation tuning arises instead from excitatory interconnec-tions among cortical cells with similar orientation preference and from inhibitoryinterconnections among cells with more wide-ranging orientation preferences. Inthis scheme, a plot of the strength and sign of connections between neuronsagainst the difference in their preferred orientations forms a Mexican hat function(Somers et al 1995, Sompolinsky & Shapley 1997): Cells with nearby preferredorientations have net excitatory connections, whereas cells with more disparatepreferred orientations have net inhibitory connections.
A key feature of the feedback models is that the mutually excitatory, or feed-back, connections among cells with similar preferred orientations dramaticallyamplify any suprathreshold input they receive from the LGN. A suprathresholdgeniculate input triggers a small amount of activity within the feedback loop,which is enhanced by reverberations within the loop. Key to the model is the factthat with sufficiently strong feedback, the cortex acquires its own intrinsic spatialpattern of response that is independent of the input. The only stable response isto have a “bubble” of cortical cells exciting one another while inhibiting thosecortical cells immediately outside the bubble. The geometry of the lateral excit-atory and inhibitory connections controls the size of the bubble, or region that isactivated, by a geniculate input. Here the region can be thought of either in spatialterms across the cortical surface or in terms of orientation. The two are almostequivalent, given the columnar organization of the cortical surface. The largerthe spread of excitatory connections and the stronger they are, the larger the lateralspread of activity; conversely, the stronger the lateral inhibitory connections, thesmaller the lateral spread of activity. The pattern of activity that develops in thecortex is therefore a uniquely cortical property, depending little on the pattern(orientation tuning width) of the initial, triggering input. A stimulus of higherstrength (contrast) will evoke stronger activity without changing the shape of theactivity bubble.
This last point means that any suprathreshold stimulus will evoke the appear-ance of a stereotypical pattern of activity in the cortex. The only aspects of thepattern that can change are its height (the strength of the activity) and its location
Ann
u. R
ev. N
euro
sci.
2000
.23:
441-
471.
Dow
nloa
ded
from
arj
ourn
als.
annu
alre
view
s.or
gby
PA
LC
I on
09/
09/0
8. F
or p
erso
nal u
se o
nly.
462 FERSTER n MILLER
on the surface of the cortex, which, by virtue of the columnar organization of thecortex, corresponds to its characteristic orientation. Both of these parameters areselected by the stimulus. The cortical circuit, in formal terms, forms a multistableattractor, in that there are many equally favored possible states of activity, in thiscase all of which are identical in shape. It is this property—and this is the pointof the model—that leads to the contrast invariance of the tuning width of indi-vidual cells. Tuning width is merely a function of the width of the activity patternin the orientation domain: The wider the pattern, the farther a stimulus can befrom the preferred orientation of a cell and still cause some activation in that cell.Because the width of the pattern of activity is a function of cortical connectivityalone and is therefore independent of the contrast (or any other attribute) of thestimulus, the orientation tuning width of the individual cells is independent ofcontrast and of other stimulus attributes.
It now becomes clear why the feedback models can tolerate broad orientationtuning of the geniculate input and still maintain sharp tuning in the cortical cells.Imagine that each simple cell receives geniculate input arranged in subfields, asoriginally suggested by Hubel & Wiesel (1962), but that these subfields havesmall aspect ratios. As a result, the orientation tuning of the thalamic input toeach simple cell will be broad. A large number of simple cells will receive sig-nificant excitation when an oriented stimulus is presented. But one set of cells,whose preferred orientations are the same as the orientation of the stimulus, willreceive slightly more excitation than all the rest. They will generate the strongestmutual excitation and the strongest inhibition of their neighbors. And when thecortical circuitry takes over, the stereotyped cortical activity pattern will formwith fixed width, centered on the orientation of those cells that received the stron-gest excitation. The winner takes all. In this way, the final pattern of corticalactivity can be much sharper in orientation than the geniculate input that trig-gered it.
Experimental Support for the Feedback Models
The feedback models can account for many experimental observations. (a) Themost prominent observation is of the contrast invariance of orientation selectivity(Sclar & Freeman 1982, Skottun et al 1987). (b) Feedback models explain anexperiment in which it was found that the orientation tuning of synaptic potentialsin some cortical cells sharpened over time (Pei et al 1994), presumably as thecortical circuitry took over and sharpened the input from the LGN. (Note, how-ever, that the feed-forward model with push-pull inhibition also predicts that LGNsynaptic potentials are sharpened by inhibition at high contrasts.) Other time-dependent changes in orientation preferences have been seen extracellularly inmonkey visual cortex, although these effects may in part involve input frombeyond the classical receptive field (Ringach et al 1997). (c) The feedback modelsare roughly consistent with the observed orientation tuning of excitatory andinhibitory inputs to simple cells (Ferster 1986, Douglas et al 1991, Nelson et al
Ann
u. R
ev. N
euro
sci.
2000
.23:
441-
471.
Dow
nloa
ded
from
arj
ourn
als.
annu
alre
view
s.or
gby
PA
LC
I on
09/
09/0
8. F
or p
erso
nal u
se o
nly.
ORIENTATION SELECTIVITY 463
1994; JS Anderson, M Carandini & D Ferster, submitted for publication). Stronginhibition at the preferred orientation is required to keep the excitatory feedbackunder control, whereas only weak inhibition at the orthogonal orientation isrequired to counteract weak excitation. However, the feedback models predictthat the inhibition received by a cell should have broader orientation tuning thanthe excitation it receives. Experimentally, excitation and inhibition appear to havesimilar orientation tuning, although small differences cannot be ruled out. (d)Local inactivation of the cortical circuit with injections of GABA can disruptorientation selectivity of cells hundreds of microns away (Eysel et al 1990, Crooket al 1995). This behavior is easily understood when it is the local cortical circuitrythat determines orientation selectivity, but it is less understood in the context ofthe feed-forward models, where the thalamic input is dominant. (e) Because intra-cortical inhibitory connections are critical to specifying orientation selectivity inthe feedback models, experiments in which GABA antagonists disrupt orientationselectivity are easily understood (Sillito 1975, Tsumoto et al 1979, Sillito et al1980, Bonds 1989, Pfluger & Bonds 1995). (f) The natural tendency of the cortexto amplify small inputs and converge to one of the stable attractors (the stereo-typed patterns of activity) brings to mind experiments by Arieli et al (1995), whofound that even in the absence of a stimulus, waves of activity appear and prop-agate across the cortical surface.
Contradictions of the Feedback Models
The experiments most difficult to reconcile with the feedback models are thecortical inactivation experiments of Ferster et al (1996) and Chung & Ferster(1998). In each of these experiments, cortical activity was severely disruptedthroughout the layers with one of two different methods. The amplitude of thespiking responses to visual and electrical stimuli was reduced by 90% or more(Figure 4), yet the width of orientation tuning of the EPSPs remaining in simplecells, assessed using two different types of visual stimuli, was unaffected. Theseresults strongly suggest that the cortical circuit does not actually sharpen orien-tation tuning beyond what is provided by the thalamic input, other than throughapplication of the spike threshold within individual simple cells (Carandini &Ferster 2000). In addition, the experiments suggest that the geniculate input tosimple cells constitutes a large fraction of the total input, 35–50%, so that thecortical inputs amplify the thalamic input only by a factor of two to three. Andthey do so in a manner that is independent of orientation.
These results do not rule out a strong role for feedback elsewhere in the visualcortex. The inactivation experiments were limited to simple cells in cat visualcortex. Some of the experimental evidence for feedback, however, comes fromother cell types and other species. Changes of orientation tuning over time, forexample, are best documented outside of layer 4 in monkey visual cortex (Ringachet al 1997). These layers in cat visual cortex have more-prominent lateral con-nections than layer 4 and so might be in a better position to participate in feedback
Ann
u. R
ev. N
euro
sci.
2000
.23:
441-
471.
Dow
nloa
ded
from
arj
ourn
als.
annu
alre
view
s.or
gby
PA
LC
I on
09/
09/0
8. F
or p
erso
nal u
se o
nly.
464 FERSTER n MILLER
circuitry. Feedback may contribute to responses in many ways without completelydetermining the structure of cortical activity patterns, as in the feedback modelsof orientation tuning.
These feedback models in their simplest form produce orientation tuning thatis independent of all other stimulus attributes. Yet orientation tuning width nar-rows with increasing spatial frequency (Vidyasagar & Siguenza 1985, Webster& De Valois 1985, Jones et al 1987, Hammond & Pomfrett 1990). To correct themodels, it is possible to separate the cortical circuit into subsets, each with itsown preferred spatial frequency and its own pattern of excitatory and inhibitoryconnections that determine its orientation tuning width. The question arises, how-ever, as to how many different stimulus parameters, and therefore how manydifferent circuits, must be built into the cortex to account completely for thevariability in cortical responses. A consequence of this limitation is explored indetail by Carandini & Ringach (1997), who show that the feedback models areunable to distinguish overlapping gratings of different orientations. Despite thepresence of two orientations in the stimulus, the models often converge on theirstandard pattern of activity within a single group of active cells with a singlerange of orientation preferences, again defined by the geometry of the excitatoryand inhibitory connections. Furthermore, adding noise to a stimulus of a singleorientation results in spurious responses in cells tuned to the orthogonal orien-tation. Such behaviors have not been reported in cortical cells. Rigorous tests forsuch behavior have yet to be carried out, however, and would form an extremelystrong test of the feedback models.
ORIENTATION SELECTIVITY AND CORTICALCOMPUTATION
At the outset of this review, we suggested that orientation selectivity serves as amodel system for understanding cortical computation. What conclusions can wedraw from our view of the function of the striate cortex? Our survey suggests aset of provocative, if frankly speculative, ideas.
The three salient features of the model of cat layer 4, for which there is strongexperimental evidence are orientation specific feed-forward excitation, strongpush-pull inhibition, and a weaker recurrent excitation to amplify responses. Theintracortical circuitry can be summarized as “correlation based”: Excitatory cellsconnect to cells that are well correlated in activity; inhibitory cells connect tocells that are anticorrelated, or minimally coactive. Furthermore, a subset of theinhibitory cells must be more directly responsive to the inputs, and thus havebroader tuning, than the excitatory cells. This suggests several candidate princi-ples for the layer 4 cortical circuit. First, the entire circuit, including both feed-forward and intracortical connections, can develop based on activity-dependentrules guided simply by the activity patterns of the feed-forward inputs. Second,
Ann
u. R
ev. N
euro
sci.
2000
.23:
441-
471.
Dow
nloa
ded
from
arj
ourn
als.
annu
alre
view
s.or
gby
PA
LC
I on
09/
09/0
8. F
or p
erso
nal u
se o
nly.
ORIENTATION SELECTIVITY 465
the circuit is very local: Cells need not integrate information even across an entirehypercolumn but may restrict interactions to only a local region, about one thirdof a hypercolumn, representing 5 308. Third, the pattern of activity is input-driven, e.g. inputs that stimulate cells with a broader or narrower range of pre-ferred orientations elicit correspondingly broader or narrower activity patterns inthe cortex. Fourth, the feed-forward inhibition, which is directly driven by theinput, is stronger than feed-forward excitation and responds more like this inputthan do other cells. Studies in the rat whisker barrel system also indicate that thelayer 4 computation is local, input driven, and dependent on inhibitory responsesthat more directly reflect the thalamic input than do excitatory responses (Simons& Carvell 1989, Brumberg et al 1996, Pinto et al 1996, Goldreich et al 1999). Itwill be of great interest to determine if an analogue of push-pull inhibition canbe found in layer 4 of this and other systems.
What computation might this circuit perform? It can allow layer 4 cells invisual cortex to recognize a given orientation independent of the stimulus contrast(Troyer et al 1998). But this specific task can be abstracted to encompass moregeneral rules of feature extraction, in particular the task of recognizing stimulusform independent of stimulus magnitude. Call the input set driving a given cellA, which for a simple cell is the activity generated in the relay cells by optimallyoriented light and dark bars in the ON and OFF subfields. Push-pull inhibitiongeneralizes to inhibitory input from pattern A, the set of inputs most anticorre-lated, or least coactive, with A. For a simple cell, A is the same as A except it isgenerated by stimuli with light and dark bars reversed. Finally, there is a largeset of patterns, B, that share some inputs with both A and A but that are uncor-related—only randomly coactive—with each. In simple cells, these patterns cor-respond to input activity generated by stimuli of the orthogonal orientation. Insimple cells receiving the input A alone (Figure 4D), we have seen that orientationselectivity becomes contrast dependent, because an input pattern B of sufficientlylarge amplitude (an orthogonal stimulus of high contrast) can activate the cell.Adding strong push-pull inhibition translates into making the cell selective forthe pattern A and not A. As a result, B of any strength, because it activates bothA and A to some degree, can no longer activate the cell when push-pull inhibitionis present. The cell becomes selective for pattern A, independent of stimulusmagnitude.
Thus, we postulate that layer 4 locally divides its inputs into opposing pairsof correlated input structures such that a cell responds only when one is presentwithout the other. Layer 4, in turn, projects to layers 2/3, where in cat V1 we findcomplex cells that respond to a given stimulus orientation independent of itspolarity. That is, whereas layer 4 cells seem to respond to A and not A, layer 2/3cells respond to something more like A or A, extracting the element that the twoopposites have in common (orientation) while discarding the elements that dis-tinguish them (polarity). These ideas of opposition followed by synthesis as pos-sible roots of mental processing are reminiscent both of many eastern philosophiesand of “dialectical” western philosophies (e.g. Merleau-Ponty 1962).
Ann
u. R
ev. N
euro
sci.
2000
.23:
441-
471.
Dow
nloa
ded
from
arj
ourn
als.
annu
alre
view
s.or
gby
PA
LC
I on
09/
09/0
8. F
or p
erso
nal u
se o
nly.
466 FERSTER n MILLER
The feedback models, in contrast, incorporate a completely different philos-ophy of cortical processing. In these models, the cortex converges on stereotypicalpatterns of activity in response to a variety of stimuli. The architecture of thecortical circuit determines in advance how many different modes of response,and therefore how many different stimuli, can be encoded by the cortex. Thosestimuli that do not conform to the predefined patterns will be represented as thenearest such pattern, and two or more patterns cannot easily be simultaneouslyrepresented. In the feed-forward model with strong push-pull inhibition, the cor-tex is more flexible in its response to the visual image. Different stimuli thatevoke sufficiently different patterns of thalamic input will almost invariably evokedifferent patterns of cortical activity. Given the fundamental differences betweenthe two models, determining which mode of operation the cortex uses (if indeedit uses either one) becomes all the more interesting.
ACKNOWLEDGMENTS
The authors would like to thank Todd Troyer for useful discussions and commentson the manuscript. KM was supported by an Alfred P Sloan Foundation Fellow-ship and NIH grant EY11001. DF was supported by NIH grant EY04726.
Visit the Annual Reviews home page at www.AnnualReviews.org.
LITERATURE CITED
Abbott LF, Varela JA, Sen K, Nelson SB.1997. Synaptic depression and cortical gaincontrol. Science 275:220–24
Adorjan P, Levitt JB, Lund JS, Obermayer K.1999. A model for the intracortical originof orientation preference and tuning inmacaque striate cortex. Vis. Neurosci. 16:303–18
Ahmed B, Anderson JC, Douglas RJ, MartinKA, Nelson JC. 1994. Polyneuronal inner-vation of spiny stellate neurons in cat visualcortex. J. Comp. Neurol. 341:39–49
Albrecht DG. 1995. Visual cortex neurons inmonkey and cat: effect of contrast on thespatial and temporal phase transfer func-tions. Vis. Neurosci. 12:1191–210
Albrecht DG, Farrar SB, Hamilton DB. 1984.Spatial contrast adaptation characteristicsof neurones recorded in the cat’s visual cor-tex. J. Physiol. 347:713–39
Albrecht DG, Geisler WS. 1991. Motion selec-tivity and the contrast-response function of
simple cells in the visual cortex. Vis. Neu-rosci. 7:531–46
Albrecht DG, Hamilton DB. 1982. Striate cor-tex of monkey and cat: contrast responsefunction. J. Neurophysiol. 48:217–37
Allison JD, Martin KAC. 1997. Contrast adap-tation produced by null direction and crossorientation stimulation of neurons in catvisual cortex. Soc. Neurosci. Abstr. 23:454
Alonso JM, Usrey WM, Reid RC. 1996. Pre-cisely correlated firing in cells of the lateralgeniculate nucleus. Nature 383:815–19
Arieli A, Shoham D, Hildesheim R, GrinvaldA. 1995. Coherent spatiotemporal patternsof ongoing activity revealed by real-timeoptical imaging coupled with single-unitrecording in the cat visual cortex. J. Neu-rophysiol. 73:2072–93
Azouz R, Gray C, Nowak LG, McCormickDA. 1997. Physiological properties of iden-tified inhibitory interneurons in cat striatecortex. Cereb. Cortex 7:534–45
Ann
u. R
ev. N
euro
sci.
2000
.23:
441-
471.
Dow
nloa
ded
from
arj
ourn
als.
annu
alre
view
s.or
gby
PA
LC
I on
09/
09/0
8. F
or p
erso
nal u
se o
nly.
ORIENTATION SELECTIVITY 467
Bauman LA, Bonds AB. 1991. Inhibitoryrefinement of spatial frequency selectivityin single cells of the cat striate cortex. Vis.Res. 31:933–44
Ben-Yishai R, Bar-Or RL, Sompolinsky H.1995. Theory of orientation tuning in visualcortex. Proc. Natl. Acad. Sci. USA 92:3844–48
Ben-Yishai R, Hansel D, Sompolinsky H.1997. Traveling waves and the processingof weakly tuned inputs in a cortical networkmodule. J. Comput. Neurosci. 4:57–77
Bishop PO, Coombs JS, Henry GH. 1973.Receptive fields of simple cells in the catstriate cortex. J. Physiol. 231:31–60
Blasdel GG, Fitzpatrick D. 1984. Physiologicalorganization of layer 4 in macaque striatecortex. J. Neurosci. 4:880–95
Bonds AB. 1989. The role of inhibition in thespecification of orientation selectivity ofcells in the cat striate cortex. Vis. Neurosci.2:41–55
Borg-Graham LJ, Monier C, Fregnac Y. 1998.Visual input evokes transient and strongshunting inhibition in visual cortical neu-rons. Nature 393:369–73
Brumberg JC, Pinto DJ, Simons DJ. 1996. Spa-tial gradients and inhibitory summation inthe rat whisker barrel system. J. Neurophy-siol. 76:130–40
Bullier J, Henry GH. 1979. Laminar distribu-tion of first-order neurons and afferent ter-minals in cat striate cortex. J. Neurophysiol.42:1271–81
Bullier J, Mustari MJ, Henry GH. 1982. Recep-tive-field transformations between LGNneurons and S-cells of cat-striate cortex. J.Neurophysiol. 47:417–38
Carandini M, Ferster D. 1997. A tonic hyper-polarization underlying contrast adaptationin cat visual cortex. Science 276:949–52
Carandini M, Ferster D. 2000. Orientation tun-ing of membrane potential and firing rateresponses in cat primary visual cortex. J.Neurosci. In press
Carandini M, Heeger DJ. 1994. Summationand division by neurons in primate visualcortex. Science 264:1333–36
Carandini M, Heeger DJ, Movshon JA. 1997.Linearity and normalization in simple cellsof the macaque primary visual cortex. J.Neurosci. 17:8621–44
Carandini M, Ringach DL. 1997. Predictionsof a recurrent model of orientation selectiv-ity. Vis. Res. 37:3061–71
Chance FS, Nelson SB, Abbott LF. 1998. Syn-aptic depression and the temporal responsecharacteristics of V1 cells. J. Neurosci.18:4785–99
Chapman B, Stryker MP. 1993. Developmentof orientation selectivity in ferret visualcortex and effects of deprivation. J. Neu-rosci. 13:5251–62
Chapman B, Zahs KR, Stryker MP. 1991.Relation of cortical cell orientation selectiv-ity to alignment of receptive fields of thegeniculocortical afferents that arborizewithin a single orientation column in ferretvisual cortex. J. Neurosci. 11:1347–58
Cheng H, Chino YM, Smith EL III, HamamotoJ, Yoshida K. 1995. Transfer characteristicsof lateral geniculate nucleus X neurons inthe cat: effects of spatial frequency and con-trast. J. Neurophysiol. 74:2548–57
Chung S, Ferster D. 1998. Strength and ori-entation tuning of the thalamic input to sim-ple cells revealed by electrically evokedcortical suppression. Neuron 20:1177–89
Crair MC, Gillespie DC, Stryker MP. 1998.The role of visual experience in the devel-opment of columns in cat visual cortex. Sci-ence 279:566–70
Crook JM, Kisvardy ZF, Eysel UT. 1995.GABA induced inactivation of functionallycharacterized sites in cat striate cortex:effects on orientation and direction selectiv-ity. Vis. Neurosci. 14:141–58
Dean AF. 1981. The relationship betweenresponse amplitude and contrast for catstriate cortical neurons. J. Physiol. 318:413–27
Dean AF, Tolhurst DJ. 1986. Factors influenc-ing the temporal phase of response to barand grating stimuli for simple cells inthe cat striate cortex. Exp. Brain Res. 62:143–51
Ann
u. R
ev. N
euro
sci.
2000
.23:
441-
471.
Dow
nloa
ded
from
arj
ourn
als.
annu
alre
view
s.or
gby
PA
LC
I on
09/
09/0
8. F
or p
erso
nal u
se o
nly.
468 FERSTER n MILLER
DeAngelis GC, Robson JG, Ohzawa I, Free-man RD. 1992. Organization of supressionin receptive fields of neurons in cat visualcortex. J. Neurophysiol. 68:144–63
De Valois RL, Thorell LG, Albrecht DG. 1985.Periodicity of striate-cortex-cell receptivefields. J. Optic. Soc. Am. A 2:1115–23
Douglas RJ, Koch C, Mahowald M, MartinKAC, Suarez HH. 1995. Recurrent excita-tion in neocortical circuits. Science269:981–85
Douglas RJ, Martin KAC. 1991. A functionalmicrocircuit for cat visual cortex. J. Phys-iol. 440:735–69
Douglas RJ, Martin KAC, Whitteridge D.1988. Selective responses of visual corticalcells do not depend on shunting inhibition.Nature 332:642–44
Douglas RJ, Martin KAC, Whitteridge D.1991. An intracellular analysis of the visualresponses of neurones in cat visual cortex.J. Physiol. 440:659–96
Einstein G, Davis TL, Sterling P. 1987. Ultra-structure of synapses from the A-laminae ofthe lateral geniculate nucleus in layer IV ofthe cat striate cortex. J. Comp. Neurol.260:63–75
Eysel UT, Crook JM, Machemer HF. 1990.GABA-induced remote inactivation revealscross-orientation inhibition in the cat striatecortex. Exp. Brain Res. 80:626–30
Ferster D. 1981. A comparison of binoculardepth mechanisms in areas 17 and 18 of thecat visual cortex. J. Physiol. 311:623–55
Ferster D. 1986. Orientation selectivity of syn-aptic potentials in neurons of cat primaryvisual cortex. J. Neurosci. 6:1284–301
Ferster D. 1988. Spatially opponent excitationand inhibition in simple cells of the catvisual cortex. J. Neurosci. 8:1172–80
Ferster D, Chung S, Wheat H. 1996. Orienta-tion selectivity of thalamic input to simplecells of cat visual cortex. Nature 380:249–52
Ferster D, Jagadeesh B. 1991. Nonlinearity ofspatial summation in simple cells of areas17 and 18 of cat visual cortex. J. Neuro-physiol. 66:1667–79
Ferster D, Jagadeesh B. 1992. EPSP-IPSPinteractions in cat visual cortex studied within vivo whole-cell patch recording. J. Neu-rosci. 12:1262–74
Ferster D, Lindstrom S. 1983. An intracellularanalysis of geniculocortical connectivity inarea 17 of the cat. J. Physiol. 342:181–215
Fregnac Y, Imbert M. 1984. Development ofneuronal selectivity in primary visual cor-tex of cat. Physiol. Rev. 64:325–434
Gardner JL, Anzai A, Ohzawa I, Freeman RD.1999. Linear and nonlinear contributions toorientation tuning of simple cells in thecat’s striate cortex. Vis. Neurosci. In press
Geisler WS, Albrecht DG. 1992. Cortical neu-rons: isolation of contrast gain control. Vis.Res. 32:1409–10
Gibson JR, Beierlen M, Connors BW. 1999.Two networks of electrically coupled neu-rons in neocortex. Nature. In press
Gil Z, Connors BW, Amitai Y. 1997. Differ-ential regulation of neocortical synapses byneuromodulators and activity. Neuron19:679–86
Gil Z, Connors BW, Amitai Y. 1999. Efficacyof thalamocortical and intracortical synap-tic connections: quanta, innervation, andreliability. Neuron. 23:385–97
Gilbert CD. 1977. Laminar differences inreceptive field properties of cells in cat pri-mary visual cortex. J. Physiol. 268:391–421
Gilbert CD, Wiesel TN. 1979. Morphology andintracortical projections of functionallycharacterized neurons in the cat visual cor-tex. Nature 280:120–25
Goldreich D, Kyriazi HT, Simons DJ. 1999.Functional independence of layer IV barrelsin rodent somatosensory cortex. J. Neuro-physiol. 82:1311–16
Gulyas B, Orban GA, Duysens J, Maes H.1987. The suppressive influence of movingtextured backgrounds on responses of catstriate neurons to moving bars. J. Neuro-physiol. 57:1767–91
Hammond P, MacKay DM. 1981. Modulatoryinfluences of moving textured backgrounds
Ann
u. R
ev. N
euro
sci.
2000
.23:
441-
471.
Dow
nloa
ded
from
arj
ourn
als.
annu
alre
view
s.or
gby
PA
LC
I on
09/
09/0
8. F
or p
erso
nal u
se o
nly.
ORIENTATION SELECTIVITY 469
on responsiveness of simple cells in felinestriate cortex. J. Physiol. 319:431–42
Hammond P, Pomfrett CJ. 1990. Influence ofspatial frequency on tuning and bias for ori-entation and direction in the cat’s striatecortex. Vis. Res. 30:359–69
Hansel D, Sompolinsky H. 1996. Chaos andsynchrony in a model of a hypercolumn invisual cortex. J. Comput. Neurosci. 3:7–34
Hawken M, Parker AJ. 1984. Contrast sensi-tivity and orientation selectivity in laminaIV of the striate cortex of old world mon-keys. Exp. Brain Res. 54:367–72
Heeger DJ. 1992. Normalization of cellresponses in cat striate cortex. Vis. Neu-rosci. 9:181–97
Heggelund P. 1981. Receptive field organiza-tion of simple cells in cat striate cortex.Exp. Brain Res. 42:89–98
Hirsch JA, Alonso JM, Reid RC, Martinez LM.1998. Synaptic integration in striate corticalsimple cells. J. Neurosci. 18:9517–28
Hirsch JA, Gilbert CD. 1991. Synaptic physi-ology of horizontal connections in the cat’svisual cortex. J. Neurosci. 11:1800–9
Hubel DH, Wiesel TN. 1962. Receptive fields,binocular interaction and functional archi-tecture in the cat’s visual cortex. J. Physiol.160:106–54
Hubel DH, Wiesel TN. 1970. The period ofsusceptibility to the physiological effects ofunilateral eye closure in kittens. J. Physiol.206:419–36
Humphrey AL, Norton TT. 1980. Topographicorganization of the orientation column sys-tem in the striate cortex of the tree shrew(Tupaia glis). I. Microelectrode recording.J. Comp. Neurol. 192:531–47
Jagadeesh B, Gray CM, Ferster D. 1992. Visu-ally evoked oscillations of membranepotential in cells of cat visual cortex. Sci-ence 257:552–54
Jones JP, Palmer LA. 1987a. An evaluation ofthe two-dimensional Gabor filter model ofsimple receptive fields in cat striate cortex.J. Neurophysiol. 58:1233–58
Jones JP, Palmer LA. 1987b. The two-dimen-sional spatial structure of simple receptive
fields in cat striate cortex. J. Neurophysiol.58:1187–211
Jones JP, Stepnoski A, Palmer LA. 1987. Thetwo-dimensional spectral structure of sim-ple receptive fields in cat striate cortex. J.Neurophysiol. 58:1212–32
Kayser AS, Miller KD. 1998. The developmentof the cat layer 4 orientation circuit: originsof columnar organization and contrastinvariance. Soc. Neurosci. Abstr. 24:261
Kelly JP, Van Essen DC. 1974. Cell structureand function in the visual cortex of the cat.J. Physiol. 238:515–47
Krukowski AE, Hoffman A, Miller KD. 1998.Correlation-based intracortical connectivityin striate cortex can account for temporalfrequency tuning and “cross-orientation”inhibition. Soc. Neurosci. Abstr. 24:261
LeVay S, Gilbert CD. 1976. Laminar patternsof geniculocortical projection in the cat.Brain Res. 113:1–19
Li CY, Creutzfeldt O. 1984. The representationof contrast and other stimulus parametersby single neurons in area 17 of the cat.Pflugers. Arch. 401:304–14
Maffei L, Fiorentini A, Bisti S. 1973. Neuralcorrelate of perceptual adaptation to grat-ings. Science 182:1036–38
Maldonado PE, Godecke I, Gray CM, Bon-hoeffer T. 1997. Orientation selectivity inpinwheel centers in cat striate cortex. Sci-ence 276:1551–55
Markram H, Tsodyks M. 1996. Redistributionof synaptic efficacy between neocorticalpyramidal neurons. Nature 382:807–10
Martin KA, Whitteridge D. 1984. Form, func-tion and intracortical projections of spinyneurones in the striate visual cortex of thecat. J. Physiol. 353:463–504
McCormick DA, Connors BW, Lighthall JW,Prince DA. 1985. Comparitive electrophy-siology of pyramidal and sparsely spinystellate neurons of the neocortex. J. Neu-rophysiol. 54:782–806
McLean J, Palmer LA. 1996. Contrast adap-tation and excitatory amino acid receptorsin cat striate cortex. Vis. Neurosci. 13:1069–87
Ann
u. R
ev. N
euro
sci.
2000
.23:
441-
471.
Dow
nloa
ded
from
arj
ourn
als.
annu
alre
view
s.or
gby
PA
LC
I on
09/
09/0
8. F
or p
erso
nal u
se o
nly.
470 FERSTER n MILLER
Merleau-Ponty M. 1962. Phenomenology ofPerception. New York: Humanities
Miller KD. 1994. A model for the developmentof simple cell receptive fields and theordered arrangement of orientation columnsthrough activity-dependent competitionbetween ON-and OFF-center inputs. J.Neurosci. 14:409–41
Miller KD, Erwin E, Keyser A. 1999. Is thedevelopment of orientation selectivityinstructed by activity? J. Neurobiol. Inpress
Morrone MC, Burr DC, Maffei L. 1982. Func-tional implications of cross-orientationinhibition of cortical visual cells. I. Neu-rophysiological evidence. Proc. R. Soc.London Ser. B 216:335–54
Movshon JA, Van Sluyters RC. 1981. Visualneural development. Annu. Rev. Psychol.32:477–522
Mullikin WH, Jones JP, Palmer LA. 1984.Receptive-field properties and laminar dis-tribution of x-like and y-like simple cells incat area 17. J. Neurophysiol. 52:350–71
Nelson S, Toth L, Sheth B, Sur M. 1994. Ori-entation selectivity of cortical neurons dur-ing intracellular blockade of inhibition.Science 265:774–77
Nelson SB. 1991. Temporal interactions in thecat visual system. I. Orientation-selectivesuppression in the visual cortex. J. Neu-rosci. 11:344–56
Ohzawa I, Sclar G, Freeman RD. 1985. Con-trast gain control in the cat’s visual system.J. Neurophysiol. 54:651–67
Palmer LA, Davis TL. 1981. Receptive-fieldstructure in cat striate cortex. J. Neurophy-siol. 46:260–76
Pei X, Vidyasagar TR, Volgushev M, Creutz-feldt OD. 1994. Receptive field analysisand orientation selectivity of postsynapticpotentials of simple cells in cat visual cor-tex. J. Neurosci. 14:7130–40
Pei X, Volgushev M, Vidyasagar TR, Creutz-feldt OD. 1991. Whole cell recording andconductance measurements in cat visualcortex in vivo. NeuroReport 2:485–88
Peters A, Payne BR. 1993. Numerical relation-ships between geniculocortical afferentsand pyramidal cell modules in cat primaryvisual cortex. Cereb. Cortex 3:69–78
Pfluger B, Bonds AB. 1995. Dynamic differ-entiation of GABAA-sensitive influences onorientation selectivity of complex cells inthe cat visual cortex. Exp. Brain Res.104:81–88
Pinto DJ, Brumberg JC, Simons DJ, Ermen-trout GB. 1996. A quantitative populationmodel of whisker barrels: re-examining theWilson-Cowan equations. J. Comput. Neu-rosci. 3:247–64
Reid RC, Alonso JM. 1995. Specificity ofmonosynaptic connections from thalamusto visual cortex. Nature 378:281–84
Ringach DL, Hawken MJ, Shapley R. 1997.Dynamics of orientation tuning in macaqueprimary visual cortex. Nature 387:281–84
Rosenquist AC, Edwards SB, Palmer LA.1975. An autoradiographic study of the pro-jections of the dorsal lateral geniculatenucleus and the posterior nucleus in the cat.Brain Res. 80:71–93
Sanchez-Vives MV, Nowak LG, McCormickDA. 1997. Cellular and network mecha-nisms generating adaptation to contrast inthe visual cortex: an in vivo and in vitrostudy. Soc. Neurosci. Abstr. 23:1944
Saul AB, Humphrey AL. 1992. Evidence ofinput from lagged cells in the lateral genic-ulate nucleus to simple cells in cortical area17 of the cat. J. Neurophysiol. 68:1190–208
Sclar G. 1987. Expression of “retinal” contrastgain control by neurons of the cat’s lateralgeniculate nucleus. Exp. Brain Res. 66:589–96
Sclar G, Freeman RD. 1982. Orientation selec-tivity in the cat’s striate cortex is invariantwith stimulus contrast. Exp. Brain Res.46:457–61
Shatz CJ, Stryker MP. 1978. Ocular dominancein layer IV of the cat’s visual cortex and theeffects of monocular deprivation. J. Phys-iol. 281:267–83
Sillito AM. 1975. The contribution of inhibi-tory mechanisms to the receptive field prop-
Ann
u. R
ev. N
euro
sci.
2000
.23:
441-
471.
Dow
nloa
ded
from
arj
ourn
als.
annu
alre
view
s.or
gby
PA
LC
I on
09/
09/0
8. F
or p
erso
nal u
se o
nly.
ORIENTATION SELECTIVITY 471
erties of neurones in the striate cortex of thecat. J. Physiol. 250:305–29
Sillito AM, Kemp JA, Milson JA, Berardi N.1980. A re-evaluation of the mechanismsunderlying simple cell orientation selectiv-ity. Brain Res. 194:517–20
Simons DJ, Carvell GE. 1989. Thalamocorticalresponse transformation in the rat vibrissa/barrel system. J. Neurophysiol. 61:311–30
Skottun BC, Bradley A, Sclar G, Ohzawa I,Freeman R. 1987. The effects of contrast onvisual orientation and spatial frequency dis-crimination: a comparison of single cellsand behavior. J. Neurophysiol. 57:773–86
Somers DC, Nelson SB, Sur M. 1995. Anemergent model of orientation selectivity incat visual cortical simple cells. J. Neurosci.15:5448–65
Sompolinsky H, Shapley R. 1997. New per-spectives on the mechanisms for orientationselectivity. Curr. Opin. Neurobiol. 7:514–22
Stratford KJ, Tarczy HK, Martin KA, Bannis-ter NJ, Jack JJ. 1996. Excitatory synapticinputs to spiny stellate cells in cat visualcortex. Nature 382:258–61
Suarez H, Koch C, Douglas R. 1995. Modelingdirection selectivity of simple cells in stri-ate visual cortex within the framework ofthe canonical microcircuit. J. Neurosci.15:6700–19
Tanaka K. 1983. Cross-correlation analysis ofgeniculostriate neuronal relationships incats. J. Neurophysiol. 49:1303–18
Troy JB, Enroth-Cugell C. 1993. X and Y gan-glion cells inform the cat’s brain about con-trast in the retinal image. Exp. Brain Res.93:383–90
Troyer TW, Krukowski AE, Priebe NJ, MillerKD. 1998. Contrast-invariant orientationtuning in cat visual cortex: thalamocorticalinput tuning and correlation-based intra-cortical connectivity. J. Neurosci. 18:5908–27
Tsodyks MV, Markram H. 1997. The neuralcode between neocortical pyramidal neu-rons depends on neurotransmitter releaseprobability. Proc. Natl. Acad. Sci. USA94:719–23; Erratum. 1997. Proc. Natl.Acad. Sci. USA 94:5495
Tsumoto T, Eckart W, Creutzfeldt OD. 1979.Modification of orientation sensitivity ofcat visual cortex neurons by removal ofGABA-mediated inhibition. Exp. BrainRes. 34:351–63
Vidyasagar TR, Siguenza JA. 1985. Relation-ship between orientation tuning and spatialfrequency in neurones of cat area 17. Exp.Brain Res. 57:628–31
Webster MA, De Valois RL. 1985. Relation-ship between spatial-frequency and orien-tation tuning of striate-cortex cells. J. Optic.Soc. Am. A 2:1124–32
Ann
u. R
ev. N
euro
sci.
2000
.23:
441-
471.
Dow
nloa
ded
from
arj
ourn
als.
annu
alre
view
s.or
gby
PA
LC
I on
09/
09/0
8. F
or p
erso
nal u
se o
nly.
Ann
u. R
ev. N
euro
sci.
2000
.23:
441-
471.
Dow
nloa
ded
from
arj
ourn
als.
annu
alre
view
s.or
gby
PA
LC
I on
09/
09/0
8. F
or p
erso
nal u
se o
nly.
Annual Review of Neuroscience Volume 23, 2000
CONTENTSCortical and Subcortical Contributions to Activity-Dependent Plasticity in Primate Somatosensory Cortex, Edward G. Jones 1Microtubule-Based Transport Systems in Neurons: The Roles of Kinesins and Dyneins, Lawrence S. B. Goldstein, Zhaohuai Yang 39Apoptosis in Neural Development and Disease, Deepak Nijhawan, Narimon Honarpour, Xiaodong Wang 73Gain of Function Mutants: Ion Channels and G Protein-Coupled Receptors, Henry A. Lester, Andreas Karschin 89The Koniocellular Pathway in Primate Vision, Stewart H. C. Hendry, R. Clay Reid 127Emotion Circuits in the Brain, Joseph E. LeDoux 155Dopaminergic Modulation of Neuronal Excitability in the Striatum and Nucleus Accumbens, Saleem M. Nicola, D. James Surmeier, Robert C. Malenka 185Glutamine Repeats and Neurodegeneration, Huda Y. Zoghbi, Harry T. Orr 217Confronting Complexity: Strategies for Understanding the Microcircuitry of the Retina, Richard H. Masland , Elio Raviola 249Adaptation in Hair Cells, Ruth Anne Eatock 285Mechanisms of Visual Attention in the Human Cortex, Sabine Kastner and Leslie G. Ungerleider 315The Emergence of Modern Neuroscience: Some Implications for Neurology and Psychiatry, W. Maxwell Cowan, Donald H. Harter, Eric R. Kandel 343Plasticity and Primary Motor Cortex, Jerome N. Sanes, John P. Donoghue 393Guanylyl Cyclases as a Family of Putative Odorant Receptors, Angelia D. Gibson, David L. Garbers 417Neural Mechanisms of Orientation Selectivity in the Visual Cortex, David Ferster, Kenneth D. Miller 441Neuronal Coding of Prediction Errors, Wolfram Schultz, Anthony Dickinson 473Modular Organization of Frequency Integration in Primary Auditory Cortex, Christoph E. Schreiner, Heather L. Read, Mitchell L. Sutter 501Control of Cell Divisions in the Nervous System: Symmetry and Asymmetry, Bingwei Lu, Lily Jan, Yuh-Nung Jan 531Consciousness, John R. Searle 557The Relationship between Neuronal Survival and Regeneration, Jeffrey L. Goldberg, Ben A. Barres 579Neural Representation and the Cortical Code, R. Christopher deCharms, Anthony Zador 613Synaptic Plasticity and Memory: An Evaluation of the Hypothesis, S. J. Martin, P. D. Grimwood, R. G. M. Morris 649Molecular Genetics of Circadian Rhythms in Mammals, David P. King, Joseph S. Takahashi 713Parallel Pathways for Spectral Coding in Primate Retina, Dennis M. Dacey 743Pain Genes?: Natural Variation and Transgenic Mutants, Jeffrey S. Mogil, Lei Yu, Allan I. Basbaum 777
Ann
u. R
ev. N
euro
sci.
2000
.23:
441-
471.
Dow
nloa
ded
from
arj
ourn
als.
annu
alre
view
s.or
gby
PA
LC
I on
09/
09/0
8. F
or p
erso
nal u
se o
nly.