Embed Size (px)
Citation preview
1
The Impact of Local Climate Change on Drinking Water Quality in a Distribution System 1
2
David Eugene Kimbrough1,*, 3
1City of Pasadena, Water & Power Department, 150 S. Robles Ave., Suite 200, Pasadena, CA, 91101, 4
USA, 5
*Corresponding author 7
Abstract: In this study, air temperatures were collected between 1985 and 2016 and compared to water 8
temperatures in four locations in the distribution system of Pasadena Water & Power (PWP) that 9
received imported surface water between 2001 and 2016 and from the purveyor of imported water. The 10
concentration of chloramine residual and nitrite concentrations were collected between 2001 and 2016 11
these five locations. The results indicate that the median nighttime temperature of the period 2009 - 12
2016 was 1.6 oC warmer than the period of 1985 - 2000 and 0.5 oC warmer than the period 2001 - 2008. 13
The median water temperature in the four distribution system samples increased by 0.8 oC to 1.4 oC 14
depending on the location over the study period (p<0.001). The median chloramine concentration fell 15
significantly (p<0.001) at three distribution system locations and the nitrite concentrations increased 16
significantly at all four distribution system locations. 17
Keywords: Local Climate Change, Nitrification, Monochloramine, Temperature 18
1. Introduction 19
Research the impact of Anthropogenic Climate Change (ACC) on drinking water has 20
focused entirely upon changes in water temperature, microbiology, and chemistry in source 21
waters (Delpha et al 2009). There has been no research to date on the impact of ACC on treated 22
drinking water in the distribution system of a water purveyor. In the previous research, it has been 23
Preprints (www.preprints.org) | NOT PEER-REVIEWED | Posted: 11 September 2018 doi:10.20944/preprints201809.0180.v1
© 2018 by the author(s). Distributed under a Creative Commons CC BY license.

2
shown that ACC has been occurring in the City of Pasadena. Records showed that air temperatures had 24
increased on average 2.8 oC in the daytime between the decades of 1911-1920 and 2011-2016 and 6.1 oC 25
in the nighttime. The daytime temperatures increased the most in January and the least in June while the 26
nighttime temperatures increased uniformly all year around. This change in air temperatures has been 27
shown to affect stream flow (Kimbrough 2017) and thus water supply (Kimbrough 2018). This general 28
rise in air temperatures can have a variety of impacts on drinking water utilities, including water 29
resources. Changing rainfall patterns, evapotranspiration rates, and customers’ demand, could be 30
influenced by changing water temperatures (Miello et al. 2014). However, it is not unreasonable to 31
imagine that water temperature in all parts of the distribution system would increase as atmospheric 32
temperatures increase. This could have a number of important water quality implications. At higher 33
water temperatures, disinfectant residuals decay more rapidly and bacteria growth is enhanced 34
(Ndiongue, et al. 2002, Michalak 2016). The purpose of this study is to determine if the increases in 35
atmospheric temperatures are in fact affecting water temperatures and microbiological stability in 36
the distribution system of Pasadena’s Water & Power Department (PWP). 37
38
2. Pasadena Water and Power 39
The City of Pasadena, incorporated in 1886, has owned and operated a public water system 40
(PWS) since 1914 after purchasing a number of privately held water companies. PWP operates a 41
number of wells and has not used local surface water directly for the last 30 years, although it does 42
divert local stream flow into percolation basins for groundwater recharge (Kimbrough 2017 a). PWP 43
also receives imported surface water from both the Colorado River Aqueduct (CRA) and the California 44
State Water Project (SWP) after it is treated by the Metropolitan Water District of Southern California 45
(MWDSC). The SWP is a system of dams, conveyances, and pumping stations spanning 1,000 km (600 46
Preprints (www.preprints.org) | NOT PEER-REVIEWED | Posted: 11 September 2018 doi:10.20944/preprints201809.0180.v1

3
miles) stretching almost the entire length of California from Lake Shasta in the north to Lake 47
Silverwood in the south. The CRA takes water from Lake Havasu and moves it 389 km (242 miles) to 48
Lake Matthews and then an additional 44 km (30 miles) to the F. E. Weymouth Treatment Plant (WTP). 49
There the plant may blend the CRA and SWP water or treat 100% of either and then deliver the effluent 50
to PWP and other agencies. 51
Imported surface water purchased from WTP must first enter the PWP system through one of three 52
reservoirs, Sunset, Jones, or Eagle Rock. Sunset Reservoir has a capacity of 57 million liters (ML - 15 53
million gallons (MG)) and consists of a blend of WTP water and local well water. Jones Reservoir has a 54
capacity of 189 ML (50 MG) and during the study period only held WTP water until late 2015 when 55
some local well water was introduced and blended. Eagle Rock is considerably smaller at a volume of 56
3.6 ML (0.95 MG) and only uses WTP water. The WTP is 40 km (25 miles) from the Sunset Reservoir 57
with a detention time of one to two days depending the on the time of year. Jones Reservoir is 5 km (3 58
miles) closer to the WTP than is Sunset and Eagle Rock Reservoir is about 5 km further away. These 59
reservoirs are made primarily of concrete and steel with the water in contact with concrete walls. The 60
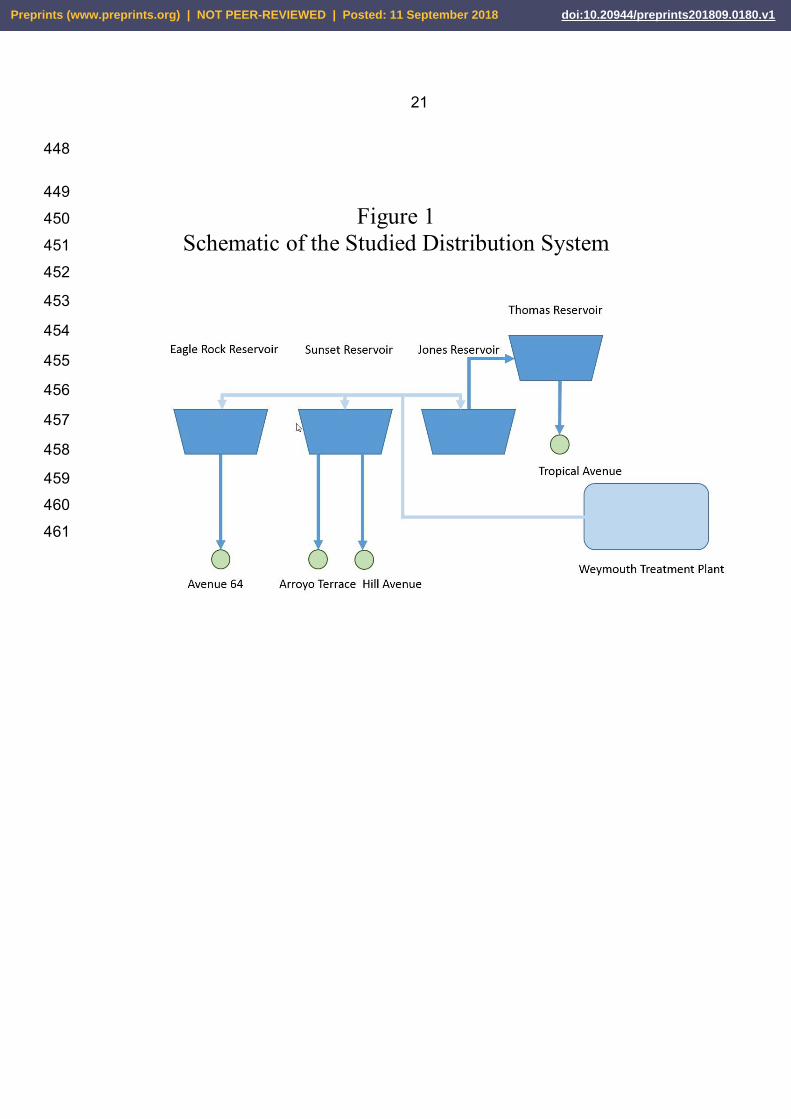
distribution system is summarized in Figure 1. 61
All of the water purchased from MWDSC by PWP contains monochloramines so the Division of 62
Drinking Water (DDW) of the State Water Resources Control Board (SWRCB) has required PWP to 63
routinely sample different parts of its distribution system as part of a nitrification control plan for water 64
temperature, total chlorine residual, and nitrite since 2001. The “Nitrification Monitory and Action 65
Plan” (NMAP) dictates where PWP tests for indicators of nitrification and what PWP must do when 66
those indicators are present. As a result, the PWP database consist of thousands of water temperature 67
data points from several locations between 2001 and 2016. 68
69
Preprints (www.preprints.org) | NOT PEER-REVIEWED | Posted: 11 September 2018 doi:10.20944/preprints201809.0180.v1

4
3. Hypothesis 70
The hypothesis of this study was that the temperature of the water in PWPs distribution 71
system has been increasing due to increasing atmospheric temperatures during the study period. 72
This has resulted the gradual decrease of monochloramine residual and an increase in bacterial 73
nitrification where residence times are longest. 74
3.1 Proposed Mechanism 75
The three reservoirs identified above where WTP water enters PWP’s distribution system are made 76
primarily of concrete and steel which can absorb heat by direct absorption of sunlight and through 77
conduction of heat from the air to the outside surfaces. This in turn can heat the water in the reservoirs 78
before it leaves. Pipes in the distribution system can likewise warm as the surrounding ground is 79
warmed in the same fashion that the reservoirs warm. As the temperature of the air increases over the 80
years, the temperature of the water in reservoirs, pipes, and water would warm as well. Moreover, the 81
further that the water has to move from the point of entry to the reservoirs, the more the temperature will 82
increase. 83
3.2 Nitrification 84
The decay of monochloramines releases ammonia, which can be consumed by Ammonia Oxidizing 85
Bacteria (AOB) which releases nitrite (NO2) and Utilization Associated Products – (UAP). AOBs can 86
also co-metabolize monochloramines which also produce NO2 UAP. UAP can react with chloramines 87
outside the cell wall, which reduces the concentration of chloramines. This process of nitrification can 88
result in the complete loss of chloramine residual, which can allow pathogenic and non-pathogenic 89
bacteria to grow. Thus, nitrification is process water purveyors must work hard to prevent. 90
3.3 Expected Results 91
Preprints (www.preprints.org) | NOT PEER-REVIEWED | Posted: 11 September 2018 doi:10.20944/preprints201809.0180.v1
5
If ACC is in fact warming both the local air temperature and the water temperatures in the 92
distribution system of PWP, two parallel trends should be observed; 93
3.3.1 As temperatures in the water distribution system increase over time the concentration of 94
monochloramine should decrease and nitrite concentrations should increase. 95
3.3.2 The above pattern should be more visible in the parts of the distribution furthest from the 96
entry point into the distribution and less visible in the nearer points. 97
There is an important caveat to this hypothesis and expected results. During the study period, 98
PWP staff was actively and vigorously trying to keep monochloramine concentrations high and 99
nitrite concentrations low. According to the NMAP PWP must flush water from locations when 100
nitrite concentrations exceed 25 g/L and / or add chlorine. Additionally for compliance with the 101
Total Coliform Rule (TCR) and Surface Water Treatment Rule (SWTR) a positive chlorine 102
residual is equired. As a result, many parts of the distribution system may be flushed when 103
chlorine residuals are low and / or chlorine may be added. These operational requirements and 104
regulatory mandates influence the nature of he results seen in his study. 105
4. Study Locations 106
To test the above hypothesis, five sample locations were selected. Four sample locations in PWP’s 107
distribution system and one from MWDSC’s distribution system. All four of PWP’s locations were 108
routinely tested for water temperature and were fed from one of the three reservoirs mentioned above 109
during the study period. Two of the locations are close to the reservoir influent and will be referred to as 110
the proximal locations and two locations were farther away from the reservoir influents and will be 111
referred to as the distal locations. The sample locations are described as follows: 112
Preprints (www.preprints.org) | NOT PEER-REVIEWED | Posted: 11 September 2018 doi:10.20944/preprints201809.0180.v1
6
4.1 Arroyo Terrace (272 m (897 ft) above mean sea level (AMSL)), which is fed from the Sunset 113
Reservoir (383 m (1,264 ft) AMSL), and has a 4:1 blend of WTP water and local well water 114
(which has no chlorine added) and is located in the western edge of the Sheldon Zone. The 115
sample location is 2.3 km (1.4 miles) from the outlet of the Sunset Reservoir through several 116
different mains ranging from 20 to 30 cm (8 to 12 inches). Most of these mains are cast iron 117
installed in or around 1930, although some of the older segments of main are ductile steel. The 118
final segment of main where the sample point is located is 340 m (1200 ft) of 15 cm (6 inch) 119
ductile iron with only seven service connections, all 5 cm (2 inch) in diameter or smaller. The 120
Arroyo Terrace main is a low demand area on a dead-end loop. This is a proximal sample 121
location. 122
4.2 Avenue 64 is in the Eagle Rock pressure zone, which is fed exclusively from the Eagle Rock 123
Reservoir and uses only WTP water. The Eagle Rock Reservoir is 346 m (1,141 ft) AMSL and 124
gravity feeds the entire Eagle Rock pressure zone. The distance from the outlet of the reservoir to 125
the sample point at Avenue 64 (253 m (835 ft) AMSL) is 1.85 km (1.2 miles) through a 30 cm 126
(12 inch) cast iron main that was installed in 1965. The sample location on Avenue 64 is at a 127
point with significant flow and it is not a dead-end. The final segment of main where the sample 128
point is located is 143 m (470 ft) of 15 cm (6 inch) cast iron with 10 service connections, all 2.5 129
cm (1 inch) in diameter or larger. This is a proximal sample location. 130
4.3 Hill Avenue has an elevation of 227 m (749 ft) AMSL), which is also fed from Sunset Reservoir. 131
The sample location is 5.8 km (3.6 miles) from the Sunset Reservoir and the last few kilometers 132
are made of 15 cm (6 inch) cast iron that was installed in 1917. This is a high demand area and 133
is not a dead-end. The final segment of main where the sample point is located is 162 m (532 ft) 134
of 15 cm (6 inch) cast iron with 11 service connections, all 2.5 cm (1 inch) in diameter but it is 135
Preprints (www.preprints.org) | NOT PEER-REVIEWED | Posted: 11 September 2018 doi:10.20944/preprints201809.0180.v1

7
also only 178 meters from a large 20 cm (8 inch) commercial service connection. This is a distal 136
sample location. 137
4.4 Tropical Avenue, which like Avenue 64, received 100% WTP water but it comes out of Jones 138
Reservoir (280 m (924 ft) AMSL)) which was then pumped up to a second reservoir, Thomas 139
Reservoir (5.3 ML (1.4 MG)), at a higher elevation (367 m (1,211 ft) AMSL), and then gravity 140
fed into the Don Benito Reduced Pressure Zone. Tropical Avenue (326 m (1076 ft) AMSL) is a 141
moderate demand area and has a 10 cm (4 inch) dead end cast iron main that was installed in 142
1951. The final segment of main where the sample point is located is 176 m (576 ft) of 10 cm (4 143
inch) cast iron with 20 service connections, all 1.9 cm (0.75 inch) in diameter. Therefore, while 144
the linear distance from the outlet of Jones Reservoir to the Tropical Avenue sample point is only 145
2.1 km (1.3 miles), the detention time is significantly longer than any of the other samples points, 146
particularly in the two reservoirs with a combined volume of 190 mL (55 MG). . This is a distal 147
sample location. Figure 1 presents a schematic diagram of the WTP, the four reservoirs, and the 148
four sample locations. 149
4.5 Additionally, water temperatures, pH, and chlorine residual of the plant effluent of MWDSC’s 150
WTP (330 m (1,089 ft) AMSL) were also obtained for the study period. For nitrite, results were 151
obtained from a service location nearest Pasadena designated FM-1 that delivers water from the 152
WTP. 153
In summary, there are two pairs of sample locations, one pair that received 100% WTP water and 154
one pair that received an 80% blend. Each pair has a proximal sampling location and a distal. 155
5. Analytical Methods for Water 156
Preprints (www.preprints.org) | NOT PEER-REVIEWED | Posted: 11 September 2018 doi:10.20944/preprints201809.0180.v1
8
5.1 Water Temperature – The water temperature was measured using an electronic thermometer 157
using Standard Methods 2550 B [6]. 158
5.2 Monochloramines – The concentration of total chlorine was determined by using a Hach field 159
colorimeter using Method 4500-CI G N,N Diethyl-1,4 Phenylenediamine Sulfate (DPD) 160
Colorimetric Method [6]. 161
5.3 Nitrite (NO2) - The concentration of nitrite was determined by using a Hach field colorimeter 162
using Standard Method 4500-NO2 B Diazotization Method Colorimetric Method [6]. This test 163
was not performed in the field but in PWP’s laboratory. A Hach 850 was used in the beginning 164
of the study a Hach 890 in the latter part. 165
5.4 Water pH – The pH of the WTP water was determined using Standard Methods 4500-H+ 166
[6]. 167
6. Air Temperatures 168
Air temperatures for the 1985 – 2016 study period were obtained from the National Oceanographic 169
and Atmospheric Administration’s National Climatic Data Center (NCDC). A database of the daily 170
maximum air temperatures (all maximum temperatures occurred during the daylight hours temperature 171
so to avoid confusion are referred to as “daytime temperatures” here), minimum air temperatures 172
(referred to as “nighttime temperature”), were created and checked for accuracy against written records. 173
For this study, only the nighttime air temperatures were used. Nighttime air temperatures were used 174
because they are a more sensitive measure of climatic change than daytime temperatures. The air 175
temperature was collected at Pasadena’s City Hall located at the longitude and latitude +34.15, -118.14. 176
177
Preprints (www.preprints.org) | NOT PEER-REVIEWED | Posted: 11 September 2018 doi:10.20944/preprints201809.0180.v1
9
7. Statistical Procedures 178
7.1 The distribution of each data set was assessed using the Shapiro-Wilk Test and the skewness and 179
kurtosis were assessed. Data was considered non-normally distributed if the probability was less 180
than 5% (p<0.05). All data in this study was non-normally distributed [7] for either skewness of 181
kurtosis. 182
7.2 There were 16 data sets, nighttime air temperature, the water temperature, total chlorine 183
concentration, and nitrite concentration at the five locations covering the period of 2001 - 2016. 184
Each database was divided in half, with approximately equal numbers of results covering the 185
periods of 2001 – 2008 and 2009 – 2016. Each pair of sub-populations were compared using the 186
Mann-Whitney Rank Sum Test (MWRST), the non-parametric equivalent to the Student’s t-test 187
for non-normally distributed data. Differences with a 5% or less level of significance ( < 0.05) 188
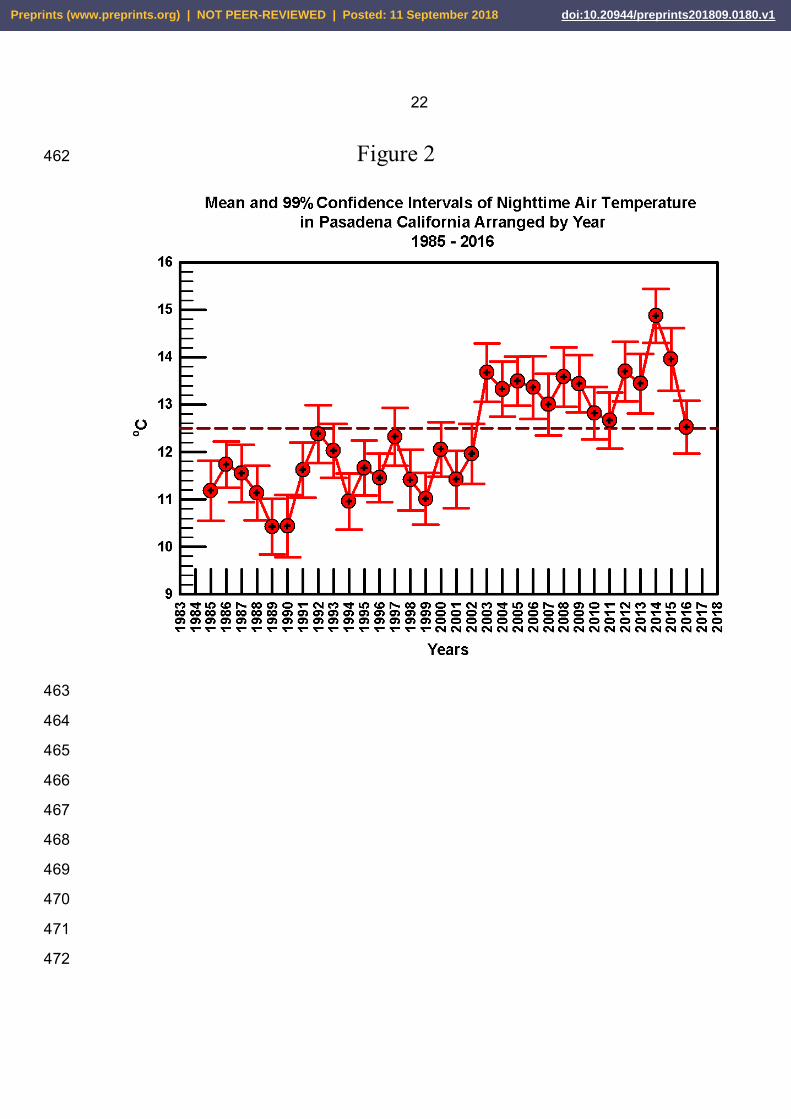
were considered significant. The two sub-groups were 2001 – 2008 and 2009 – 2016. For the 189
air temperatures, a wider study period was used, 1985 – 2016 and there were three study periods, 190
1985 – 2000, 2001- 2008, and 2009 – 2016. The test period of 2009 – 2016 was compared to 191
both the 1985 – 2000 period and the 2001 – 2008 periods by MWRST (de Muth 2014). 192
7.3 The three air temperature populations were also compared to each other using the Kruskal-Wallis 193
One Way Analysis of Variance on Ranks (KW). The KW test produces the Kruskal-Wallis 194
Statistic (H). The threshold for significance was 5% ( = 0.05) [7]. 195
7.4 When different data sets collected over time were compared to determine they tended to follow 196
correlated patterns, the Spearman Rank Order Correlation (SROC) test was used, which is the 197
non-parametric equivalent of the Pearson Product Moment Correlation. For the water data, the 198
temperature, chlorine residual, and nitrite concentrations were compared [7]. 199
Preprints (www.preprints.org) | NOT PEER-REVIEWED | Posted: 11 September 2018 doi:10.20944/preprints201809.0180.v1
10
7.5 Nitrite results were no censored for this study but used as generated by the instrument. When the 200
instrument generated a value of zero, a value of zero was used for statistical analysis. 201
8. Results 202
8.1 Distribution of Data 203
The distribution of all 16 data sets were tested for normality using the Shapiro-Wilk Test and all had 204
a non-normal distribution (p<0.001). 205
8.2 Air Temperatures 206
The mean, standard deviation, 25th, 50th, and 75th percentile results for the entire study population 207
(1985 – 2016) and each of the three sub-populations are shown in Table 1. The data on a yearly mean 208
basis including the 99% confidence intervals are shown in Figure 2. The median air temperatures 209
increased through the study period, both between the three sub-groups as seen in Table 1 but even on 210
year to year basis as seen in Figure 2. The median nighttime air temperature of the 2009 – 2016 period 211
was 1.6 oC higher than the 1985 – 2000 period and 0.5 oC higher than the 2001 – 2008 period. The mean 212
air temperature before 2003 was never higher than 12.5 oC but after 2003, it was never lower than 12.5 213
oC (the same was true for the median results except for 1992). In fact, 2016 was the coolest year since 214
2003 but it was still warmer than all years preceding 2003. These differences in the median air 215
temperature were of a statistically significant nature with the MWRST having a probability of <0.05. 216
8.3 Water Temperatures 217
The mean, standard deviation, 25th, 50th, and 75th percentile results for the entire study population 218
(2001 – 2016) and each of the two sub-populations (2001 – 2008 and 2009 – 2016) for all five locations 219
are shown in Table 2. The WTP shows no change in median water temperatures when the two sub-220
Preprints (www.preprints.org) | NOT PEER-REVIEWED | Posted: 11 September 2018 doi:10.20944/preprints201809.0180.v1

11
populations are compared by MWRST with the median water temperature actually 0.9o C lower. 221
However, all four locations in the distribution show statistically significant increases in water 222
temperature. The median temperatures increased at Avenue 64 by 1.0o C, Tropical Avenue by 1.4 oC, at 223
Arroyo Terrace by 0.9o C, and at Hill Avenue by 0.7 oC. These increases parallel the increase in 224
nighttime air temperature, which was 0.5 oC. To better assess the relationships between air and water 225
temperature, the monthly median water temperatures of each of the five locations was plotted on a 226
monthly basis which is summarized in Figure 3. 227
228
8.4 Chloramine Residual 229
The chlorine residual is shown in Table 3 including the mean, standard deviation, 25th, 50th, and 230
75th percentile results for the entire study population (2001 – 2016) and each of the two sub-populations 231
(2001 – 2008 and 2009 – 2016) for all five locations . The WTP showed a slight increase in residual 232
when the two sub-populations are compared by MWRST by 0.05 mg/L. This was due to an operational 233
target concentration of chlorine dosing at the WTP. However, some locations in PWP’s distribution 234
show statistically significant decreases in residual concentration. The median chlorine residuals 235
decreased at Avenue 64 by 0.03 mg/L, Tropical Avenue by 0.27 mg/L, at Arroyo Terrace by 0.51 mg/L, 236
but at Hill Avenue showed a slight increase in residual concentration of 0.07 mg/L but this was not 237
statistically significant. 238
239
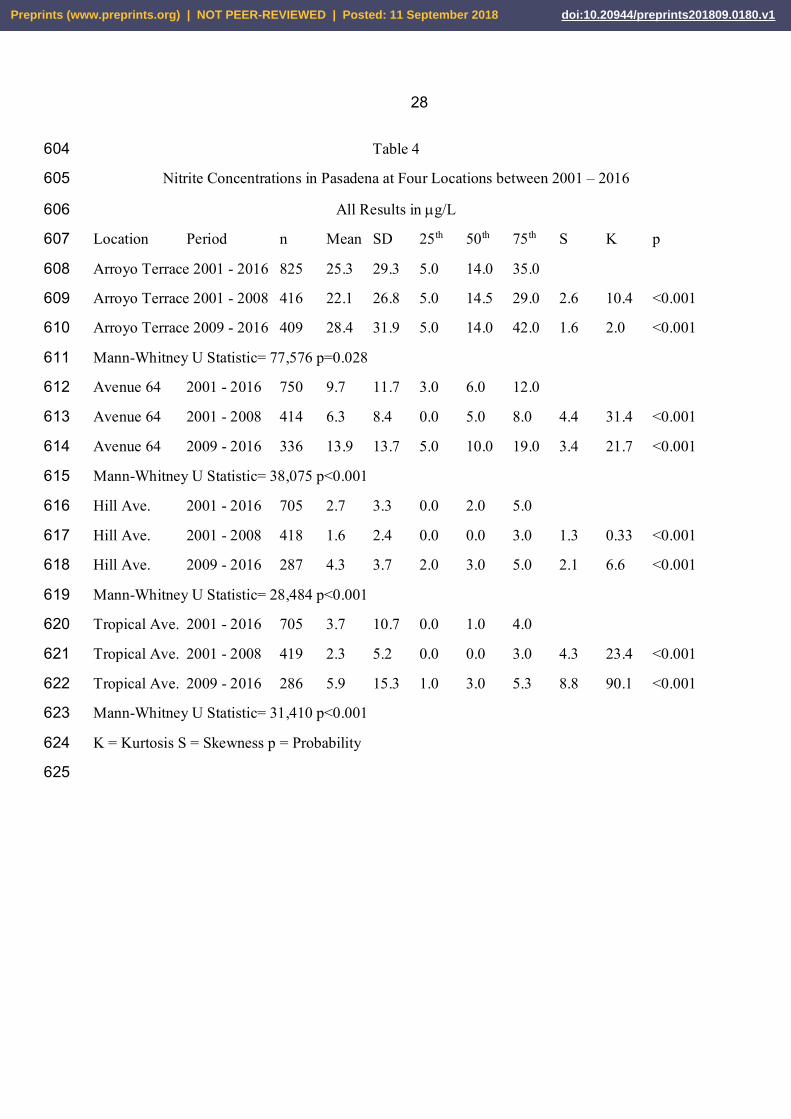
8.5 Nitrite Concentration 240
The nitrite measured in g/L is shown in Table 4 including the mean, standard deviation, 25th, 50th, 241
and 75th percentile results for the entire study population (2001 – 2016) and each of the two sub-242
populations (2001 – 2008 and 2009 – 2016) for all five locations. Three of the distribution system 243
Preprints (www.preprints.org) | NOT PEER-REVIEWED | Posted: 11 September 2018 doi:10.20944/preprints201809.0180.v1

12
samples showed significant increases in the median concentration of nitrite. At Avenue 64 the median 244
concentration of nitrite doubled from 5.0 to 10.0 g/L and the mean concentrations showed a parallel 245
increase. At the Tropical Avenue location, the median concentration increased from zero to 3.0 g/L 246
while the mean concentration more than doubled from 2.3 to 5.9 g/L. The Hill Avenue location the 247
median concentration increased from zero to 3.0 g/L while the mean concentration almost tripled from 248
1.6 to 4.3 g/L. The Arroyo Terrace data are more complicated. The median concentration of nitrite 249
decreased slightly, from 14.5 to 14.0 g/L while the 25th percentile remained constant. However, the 250
mean increased from 22.1 g/L to 28.4 g/L and the 75th percentile increased from 29.0 g/L to 42.0 251
g/L. So the concentration increased overall but the alpha value was only 0.028, which is statistically 252
significant but much less so as compared to the other locations. Arroyo Terrace also had a considerably 253
higher median and mean concentration of nitrite as compared to the other sites. No nitrite was ever 254
detected at the WTP effluent but at the FM-1 distribution location there were 798 samples collected but 255
only 21 had nitrite at a concentration of greater than 5 g/L and only seven of those were 6 g/L or 256
greater and the highest value was 9 g/L. With so few quantifiable results, which are all quite low, there 257
is no evidence that the rate of nitrification increased between the two study periods (although 13 of the 258
measurable nitrite results occurred in 2016). A number of the nitrite results were reported at the lower 259
end of the linear dynamic range for this method, which might increase the uncertainty in the data. 260
However, over 700 data points were collected over a 15-year period, which significantly increased the 261
robustness of the statistical analysis. 262
8.6 pH 263
The pH of WTP water during this study ranged 8.0 to 8.1. The pH was controlled through the 264
addition of sodium hydroxide. 265
Preprints (www.preprints.org) | NOT PEER-REVIEWED | Posted: 11 September 2018 doi:10.20944/preprints201809.0180.v1

13
8.7 Correlation 266
If the hypothesis is correct, as air temperatures increase, water temperatures should also increase 267
which should cause the concentration of chlorine residuals to decrease and nitrite concentrations to 268
increase. In other words there ought to be a negative or inverse correlation between water temperature 269
and chlorine concentration and a positive correlation with nitrite. Additionally there ought to be an 270
inverse relationship between chlorine concentration and nitrite concentration. To test this, the data from 271
the five water locations were analyzed using the SROC. The correlation coefficient and probability for 272
each paired set of data are shown on Table 5. No correlation was observed in the data from the WTP, 273
which is not surprising since the concentrations of chlorine residual are high and there is little 274
opportunity for the chlorine to decay. Given the fact that there was very little evidence of nitrification, 275
no attempt to correlate nitrite concentrations with either water temperature or chlorine residual. At 276
Avenue 64, Tropical Avenue, and Arroyo Terrace, there was similarly no correlation between water 277
temperature and chlorine residual. Hill Avenue however showed a weak but statistically significant 278
negative correlation between water temperature and chlorine residual concentration. In contrast, Avenue 279
64, Tropical Avenue, and Arroyo Terrace, there was a correlation between water temperature and nitrite 280
concentration, which ranged from weak to moderate but all of it was significant. The Hill Avenue 281
sample location showed no pattern with no measurable correlation between water temperature and nitrite 282
concentration. The relationship between chlorine residual concentration and nitrite concentration is 283
more complex. The sample location on Avenue 64 did indeed produce the expected negative 284
correlation, which, while not strong at -0.20 was statistically significant. Tropical Avenue had similar 285
results but with a slightly weaker correlation coefficient. On the other hand, the Arroyo Terrace sample 286
location did not show a statically significant correlation between chlorine residual and nitrite 287
Preprints (www.preprints.org) | NOT PEER-REVIEWED | Posted: 11 September 2018 doi:10.20944/preprints201809.0180.v1

14
concentration while the Hill Avenue location showed a weak but positive and statistically significant 288
correlation. 289
290
9. Discussion 291
The air in Pasadena have been warming significantly since 1985 as can be seen in Figure 2 and 292
Table 1. In parallel with the increasing air temperature, water temperatures in PWP’s distribution 293
system have increased as well. While the median air temperature in Pasadena increased by 0.5 oC in the 294
period of 2009 – 2016 as compared to 2001 – 2008, when comparing the two periods, the median water 295
temperature at the WTP changed by -1.1 oC, although this was not statistically significant. This is also a 296
bit misleading as the 75th percentile of the water temperature was actually higher in the second period 297
than that in the first period by 0.6 oC and the 25th percentile only decreased by 0.1 oC while the mean is 298
0.5 oC lower. Obviously, the water temperatures are distributed in a complex fashion that is not easily 299
captured in a single measure of the central tendency. Suffice it to say, there is no evidence that the water 300
temperate of the effluent of the WTP has increased between the two study periods. 301
In contrast, the median water temperature at Arroyo Terrace increased by 0.9 oC, Avenue 64 by 1.0 302
oC, Hill Avenue by 0.8 oC, and at Tropical Avenue by 1.4 oC. These were all statistically significant 303
increases. That the water temperature should increase more than the air temperature is not necessarily 304
surprising, as the heat capacity of water is five times higher from that of air and can thus retain more 305
heat much longer than air. It is also not surprising is the fact that the water at Tropical Avenue showed a 306
larger median increase in water temperature as compared to the other three sites. This is because as the 307
water first enters PWP’s distribution system through Jones Reservoir (by far the largest of PWP’s 308
reservoirs) from which it is pumped up to Thomas Reservoir before reaching the sample tap. As a 309
result, the detention time is considerably longer and much of that detention time is in above grade 310
Preprints (www.preprints.org) | NOT PEER-REVIEWED | Posted: 11 September 2018 doi:10.20944/preprints201809.0180.v1

15
reservoirs as opposed to the other three distribution system sample locations where the water, once it 311
leaves the smaller reservoirs, travels through mains so detention times are considerable shorter. 312
The vast majority of the warming is occurring in the distribution system itself. The influent water 313
from the WTP showed no increase in water temperature during the study period and no loss of chlorine 314
residual (although 2014 and 2016 were the two warmest years in the study period). However, what is 315
clear is that as the water moves further from the reservoirs where the water is taken from WTP, the 316
water temperatures changes. In winter, the WTP water comes in cold and is warmed as it passes through 317
the distribution system. In the summer, the exact opposite is observed at most locations; the WTP enters 318
the system and is slightly cooled, except for Tropical Avenue where it warms very slightly. The two 319
distal locations showed this pattern more than the two proximal locations as can be seen in Figure 3. 320
In examining the monthly data pattern emerges. The month of December had the lowest mean air 321
temperature, 8.3 oC, while August had the highest, 18.3 oC, a range of 10 oC. The mean temperature of 322
the effluent of the WTP ranged from a low in January of 13.1 oC to 26.2 oC. a 13.0 oC difference. 323
Arroyo Terrace showed a range of monthly averages of 10.9 oC, 14.4oC in January and 25.3 oC in 324
August. Avenue 64 presesnted a range of monthly averages of 11.3 oC, 14.4oC in January and 25.7 oC 325
in August. Hill Avenue had a range of monthly averages of only 7.7 oC, 17.8 oC in February and 25.5 326
oC in August. Tropical Avenue had a range of monthly averages of only 8.8 oC, 18.6 oC in December 327
and 27.4 oC in August. The two distal sample locations showed a range of mean temperatures that were 328
very similar to the changes in local air temperature. The WTP and the two proximal sample locations 329
showed a wider range of mean monthly temperatures. The two proximal locations were more influenced 330
by changes in water temperature from the WTP while the two distal locations were more influenced by 331
changes in local air temperature. There is only small differences between the maximum mean water 332
Preprints (www.preprints.org) | NOT PEER-REVIEWED | Posted: 11 September 2018 doi:10.20944/preprints201809.0180.v1
16
temperature, the differences in the range of monthly averages is almost entirely due to differences in the 333
minimum monthly temperatures. 334
Changes in concentration of chlorine residuals were largely parallel to that seen in water 335
temperatures. There was no decrease in median concentration of chlorine in the effluent of WTP during 336
the study period. Avenue 64 showed a small decrease while Arroyo Terrace and Hill Avenue both 337
showed larger decreases. Arroyo Terrace and Hill Avenue have longer detention times than Avenue 64 338
so this is not unexpected. In addition, the Arroyo Terrace sample tap is on a dead end loop and has 339
tuberculation so this site could be expected to show the greatest median chlorine loss. The Tropical 340
Avenue sample location however showed the least chlorine loss, which would seem counterintuitive 341
given the fact that that location showed the greatest water temperature increase. However, at both Jones 342
and Thomas Reservoirs, chlorine gas is routinely fed during the warmer months of the year. At no point 343
was enough chlorine gas added to break over the water to free chlorine. As seen in Figure 4, the median 344
chlorine concentrations at each of the five locations arranged by month. As can be seen the chlorine 345
concentration increases significantly at Tropical Avenue in the summer months while the pattern does 346
not hold at any other location. 347
The nitrite results are also informative. The FM-1 water no significant increase in nitrite 348
concentration while all four PWP distribution system sample locations showed significant increases in 349
the median concentration of nitrite. Both Hill Avenue and Tropical Avenue had almost no nitrification 350
prior to 2009 but afterwards showed a very noticeable and statistically significant increase. Both 351
showed an increase of ~3 g/L in both the mean and median concentrations. This is not a large increase 352
in absolute value but it does represent a dramatic shift the water quality of these two locations. What this 353
means is that nitrification had not been occurring before but was later. Avenue 64 likewise showed a 354
definite increase in median nitrite concentration. The mean and median concentrations both double in 355
Preprints (www.preprints.org) | NOT PEER-REVIEWED | Posted: 11 September 2018 doi:10.20944/preprints201809.0180.v1

17
value, from 5.0 to 10.0 g/L and 6.3 to 13.9 g/L respectively. Arroyo Terrace actually showed a slight 356
decrease in the median concentration of nitrite from 14.5 mg/L to 14.0 g/L but the mean increased by 357
6.3 g/L and a 13 g/L increase in the 75th percentile concentration. The absolute difference in the 358
means and medians was generally 3 to 6 g/L. 359
The hypothesis is that as water temperatures rise, the concentration of chlorine should fall and if 360
this is the case, there ought to be a negative correlation between these two variables. 361
However, no such correlation is observed for four of the locations. At Hill Avenue though the 362
correlation, while significant, is not strong (R = -0.22). For WTP this is not surprising since there has 363
been no increase in water temperature or loss of chlorine residual. Similarly, Tropical Avenue is feed by 364
two reservoirs in tandem where chlorine is added so the lack of correlation is not surprising. Avenue 64 365
showed only a minor loss of chlorine so like the WTP, a lack of correlation might be expected. 366
Nonetheless, Arroyo Terrace showed considerable chlorine so a lack of correlations is unexpected. 367
On the other hand, Arroyo Terrace, Avenue 64, and Tropical Avenue all showed significant 368
positive correlations between water temperature and nitrite concentration. Generally, as water 369
temperatures rose nitrite concentrations rose at these three locations. Why Hill Avenue should show no 370
correlation between nitrite concentrations and water temperature but show the expected negative 371
correlation between chlorine residual and water temperature is not clear. 372
Finally, both Avenue 64 and Tropical Avenue showed the expected negative correlation between 373
chlorine residual concentration and nitrite concentration while Arroyo Terrace showed no correlation 374
and Hill Avenue actually showed a weak but significant positive correlation, the opposite of what would 375
be expected. Of 13 possible correlations among the variables in the water samples, seven were 376
statistically significant and six were of the expected direction. So the data generally supports the 377
hypothesis, increasing air and water temperatures are impacting the quality of water in the form of 378
Preprints (www.preprints.org) | NOT PEER-REVIEWED | Posted: 11 September 2018 doi:10.20944/preprints201809.0180.v1

18
decreasing monochloramine concentrations and increasing nitrite concentrations. The pattern is not 379
entirely consistent with the hypothesis but as was noted above, operational practices may have 380
influenced the association between water temperature and distribution water quality. The data was 381
gathered from two working distribution systems (WTP and PWP) where staff were working diligently 382
and vigorously to prevent the loss of monochloramine residual and the increase in nitrite concentrations. 383
Without the addition of chlorine gas at Jones and Thomas Reservoirs and a very active program of 384
flushing numerous parts of the distributions system, a much greater impact and clearer correlations 385
would no doubt have been observed. 386
It is important to note that during part of the study period California suffered a period of intense 387
drought (Kimbrough 2017, Kimbrough 2018). This resulted in unprecedented reductions in water 388
demand and water age. This may well have exaggerated the impact of increasing air temperatures on 389
water temperatures. 390
10. Summary and Conclusions 391
Local climatic change has resulted in significant and measurable increases in the temperature of 392
the nighttime air in Pasadena, which in turn has increased the water temperature in the distribution 393
system of PWP. This has caused increased rates of chlorine decay and increased rates of nitrification. 394
395
Acknowledgements: The author would like to thank Tae Yun and JR Rhoads of the 396
Metropolitan Water District of Southern California’s Water Quality Section. 397
References 398
399
Preprints (www.preprints.org) | NOT PEER-REVIEWED | Posted: 11 September 2018 doi:10.20944/preprints201809.0180.v1

19
Delpla, I., Jung, A.-V., Baures, E., Clement, M., Thomas, O.” Impacts of climate change on 400
surface water quality in relation to drinking water production”, Environment International, 35 401
(2009) 1225–1233 402
De Muth, J.E., “Basic Statistics and Pharmaceutical Statistical Applications, Third Edition”, April 28, 403
2014 by Chapman and Hall/CRC, pg 242 – 244, ISBN 9781466596733 404
405 Kimbrough, D.E., Local Climate Change in Pasadena, Calif., and the Impact on Streamflow, Water and 406
Climate Change, Journal of the American Water Works Association, 2 – 13, 109:10, October 2017 407
https://doi.org/10.5942/jawwa.2017.109.0114 408
409
Kimbrough, D.E., Changes in Temperature and Rainfall as a Result of Local Climate Change in 410
Pasadena, California, Hydrology, March 21, 2018, Hydrology 2018, 5(2), 411
25; https://doi.org/10.3390/hydrology5020025 412
413
Melillo, J. M., Richmond, T.C., Yohe, G.W. Eds., 2014: Climate Change Impacts in the United 414
States: The Third National Climate Assessment . U.S. Global Change Research Program, 841 pp. 415
doi:10.7930/J0Z31WJ2 416
417
Michalak, A. M.; “Study role of climate change in extreme threats to water quality”, Nature 535, 418
349–350 (21 July 2016) doi:10.1038/535349a 419
420
Ndiongue, S., Huck, P.M., Slawson, R.M,; “Effects of temperature and biodegradable organic matter on 421
control of biofilms by free chlorine in a model drinking water distribution system”, Water Research, 422
Volume 39, Issue 6, March 2005, Pages 953–964 423
Preprints (www.preprints.org) | NOT PEER-REVIEWED | Posted: 11 September 2018 doi:10.20944/preprints201809.0180.v1

20
424
Standard Methods for the Analysis of Water and Waste Water, 21th Ed., Ed. A.D. Eaton, L.S. Clesceri, 425
A.E. Greenberg, American Public Health Association, Washington D.C., 2005 426
427
428
429 430
431
432
433
434 435
436
437
438
439
440
441
442
443
444
445
446
447
Preprints (www.preprints.org) | NOT PEER-REVIEWED | Posted: 11 September 2018 doi:10.20944/preprints201809.0180.v1
21
448
449
Figure 1 450
Schematic of the Studied Distribution System 451
452
453
454
455
456
457
458
459
460
461
Preprints (www.preprints.org) | NOT PEER-REVIEWED | Posted: 11 September 2018 doi:10.20944/preprints201809.0180.v1
22
Figure 2 462
463
464
465
466
467
468
469
470
471
472
Preprints (www.preprints.org) | NOT PEER-REVIEWED | Posted: 11 September 2018 doi:10.20944/preprints201809.0180.v1

23
473
Figure 3 474
475
476
477
478
479
480
481
482
483
484
485
486
487
488
489
490
491
492
493
494
495
496
497
498
499
500
Preprints (www.preprints.org) | NOT PEER-REVIEWED | Posted: 11 September 2018 doi:10.20944/preprints201809.0180.v1

24
501
Figure 4 502 503
504
505
506
507
508
509
510
511
512
513
514
515
516
517
518
519
520
521
522
523
524
Preprints (www.preprints.org) | NOT PEER-REVIEWED | Posted: 11 September 2018 doi:10.20944/preprints201809.0180.v1

25
Table 1 525
Nighttime Air Temperatures in Pasadena between 1985 – 2016 526
All Results in oC 527
528
Period n Mean SD 25th 50th 75th Skewness Kurtosis p 529
530
1985 - 2016 11,531 12.3 4.5 8.9 12.2 15.6 0.008 -0.34 <0.001 531
532
1985 - 2000 5,832 11.5 4.4 8.3 11.7 14.4 -0.04 -0.42 <0.001 533
534
2001 - 2008 2,810 13.0 4.5 10.0 12.8 16.1 0.007 -0.48 <0.001 535
536
2009 - 2016 2,889 13.4 4.5 10.6 13.3 16.7 0.04 -0.28 <0.001 537
538
Kruskal-Wallis One Way Analysis of Variance on Ranks H = 389, p <0.001 539
540
541
542
543
544
545
546
547
Preprints (www.preprints.org) | NOT PEER-REVIEWED | Posted: 11 September 2018 doi:10.20944/preprints201809.0180.v1

26
Table 2 548
Water Temperatures in Pasadena at Five Locations between 2001 – 2016 549
All Results in oC 550
Location Period n Mean SD 25th 50th 75th S K p 551
Arroyo Terrace 2001 - 2016 830 19.9 4.2 16.2 20.0 23.7 552
Arroyo Terrace 2001 - 2008 417 19.4 4.1 15.8 19.5 23.3 -0.03 -1.2 <0.001 553
Arroyo Terrace 2009 - 2016 413 20.4 4.2 16.7 20.4 24.2 -0.03 -1.1 <0.001 554
Mann-Whitney U Statistic= 74,811 p=0.001 555
Avenue 64 2001 - 2016 832 19.9 4.3 16.0 20.0 24.0 556
Avenue 64 2001 - 2008 414 19.3 4.3 15.2 19.3 23.4 0.04 -1.3 <0.001 557
Avenue 64 2009 - 2016 418 20.6 4.3 16.9 20.3 24.4 0.04 -1.2 <0.001 558
Mann-Whitney U Statistic= 71,496 p<0.001 559
Hill Ave. 2001 - 2016 832 21.8 3.3 19.6 22.0 24.3 560
Hill Ave. 2001 - 2008 418 21.1 3.2 19.0 21.7 23.8 -0.54 -0.4 <0.001 561
Hill Ave. 2009 - 2016 414 22.4 3.2 20.0 22.5 25.2 0.08 0.2 <0.001 562
Mann-Whitney U Statistic= 69,260 p<0.001 563
Tropical Ave. 2001 - 2016 832 21.8 3.9 18.8 21.4 24.8 564
Tropical Ave. 2001 - 2008 419 21.0 3.6 18.1 20.8 24.0 0.01 -0.7 <0.001 565
Tropical Ave. 2009 - 2016 413 22.6 4.1 19.6 22.2 25.0 0.40 -0.4 <0.001 566
Mann-Whitney U Statistic= 67,706 p<0.001 567
WTP 2001 - 2016 2,548 20.1 4.8 15.8 20.1 24.6 568
WTP 2001 - 2008 1,206 19.9 4.9 15.4 20.6 24.4 -0.19 -1.25 <0.001 569
WTP 2009 - 2016 1,342 19.4 5.9 15.3 19.5 25.0 -0.76 0.67 <0.001 570
Mann-Whitney U Statistic= 782,378 p=0.15 571
572
573
574
575
Preprints (www.preprints.org) | NOT PEER-REVIEWED | Posted: 11 September 2018 doi:10.20944/preprints201809.0180.v1

27
Table 3 576
Total Chlorine Residuals in Pasadena at Five Locations between 2001 – 2016 577
All Results in mg/L 578
Location Period n Mean SD 25th 50th 75th S K p 579
Arroyo Terrace 2001 - 2016 830 0.82 0.57 0.35 0.73 1.20 580
Arroyo Terrace 2001 - 2008 417 1.06 0.57 0.60 1.00 1.40 0.5 -0.3 <0.001 581
Arroyo Terrace 2009 - 2016 413 0.58 0.46 0.20 0.49 0.85 1.0 0.6 <0.001 582
Mann-Whitney U Statistic= 74,811 p=0.001 583
Avenue 64 2001 - 2016 832 2.03 0.38 1.90 2.09 2.20 584
Avenue 64 2001 - 2008 414 2.09 0.40 1.82 2.10 2.30 -0.5 1.2 <0.001 585
Avenue 64 2009 - 2016 418 1.97 0.35 1.92 2.07 2.19 -2.9 9.9 <0.001 586
Mann-Whitney U Statistic= 72,211 p<0.001 587
Hill Ave. 2001 - 2016 832 0.86 0.5 0.50 0.74 1.02 588
Hill Ave. 2001 - 2008 418 0.83 0.48 0.50 0.70 1.00 2.0 5.2 <0.001 589
Hill Ave. 2009 - 2016 414 0.90 0.53 0.50 0.77 1.20 0.7 -0.4 <0.001 590
Mann-Whitney U Statistic= 81,953 p=0.19 591
Tropical Ave. 2001 - 2016 832 1.07 0.62 0.52 1.04 1.50 592
Tropical Ave. 2001 - 2008 419 1.22 0.63 0.70 1.20 1.70 0.2 -0.8 <0.001 593
Tropical Ave. 2009 - 2016 413 0.92 0.58 0.40 0.93 1.38 0.2 -0.7 <0.001 594
Mann-Whitney U Statistic= 63,310 p<0.001 595
WTP 2001 - 2016 2,548 2.60 0.09 2.55 2.60 2.65 596
WTP 2001 - 2008 1,206 2.58 0.09 2.51 2.57 2.62 1.7 8.9 <0.001 597
WTP 2009 - 2016 1,342 2.63 0.07 2.60 2.62 2.67 4.7 21 <0.001 598
Mann-Whitney U Statistic= 474,479 p<0.001 599
600
601
602
603
Preprints (www.preprints.org) | NOT PEER-REVIEWED | Posted: 11 September 2018 doi:10.20944/preprints201809.0180.v1
28
Table 4 604
Nitrite Concentrations in Pasadena at Four Locations between 2001 – 2016 605
All Results in g/L 606
Location Period n Mean SD 25th 50th 75th S K p 607
Arroyo Terrace 2001 - 2016 825 25.3 29.3 5.0 14.0 35.0 608
Arroyo Terrace 2001 - 2008 416 22.1 26.8 5.0 14.5 29.0 2.6 10.4 <0.001 609
Arroyo Terrace 2009 - 2016 409 28.4 31.9 5.0 14.0 42.0 1.6 2.0 <0.001 610
Mann-Whitney U Statistic= 77,576 p=0.028 611
Avenue 64 2001 - 2016 750 9.7 11.7 3.0 6.0 12.0 612
Avenue 64 2001 - 2008 414 6.3 8.4 0.0 5.0 8.0 4.4 31.4 <0.001 613
Avenue 64 2009 - 2016 336 13.9 13.7 5.0 10.0 19.0 3.4 21.7 <0.001 614
Mann-Whitney U Statistic= 38,075 p<0.001 615
Hill Ave. 2001 - 2016 705 2.7 3.3 0.0 2.0 5.0 616
Hill Ave. 2001 - 2008 418 1.6 2.4 0.0 0.0 3.0 1.3 0.33 <0.001 617
Hill Ave. 2009 - 2016 287 4.3 3.7 2.0 3.0 5.0 2.1 6.6 <0.001 618
Mann-Whitney U Statistic= 28,484 p<0.001 619
Tropical Ave. 2001 - 2016 705 3.7 10.7 0.0 1.0 4.0 620
Tropical Ave. 2001 - 2008 419 2.3 5.2 0.0 0.0 3.0 4.3 23.4 <0.001 621
Tropical Ave. 2009 - 2016 286 5.9 15.3 1.0 3.0 5.3 8.8 90.1 <0.001 622
Mann-Whitney U Statistic= 31,410 p<0.001 623
K = Kurtosis S = Skewness p = Probability 624
625
Preprints (www.preprints.org) | NOT PEER-REVIEWED | Posted: 11 September 2018 doi:10.20944/preprints201809.0180.v1