Embed Size (px)
Citation preview
Inclusive Leadership: Exploration of Individual and Situational Antecedents
David Benjamin Mendelsohn
Submitted in partial fulfillment of the
requirements for the degree of
Doctor of Philosophy
under the Executive Committee
of the Graduate School of Arts and Sciences
COLUMBIA UNIVERSITY
2021

© 2021
David Benjamin Mendelsohn
All Rights Reserved
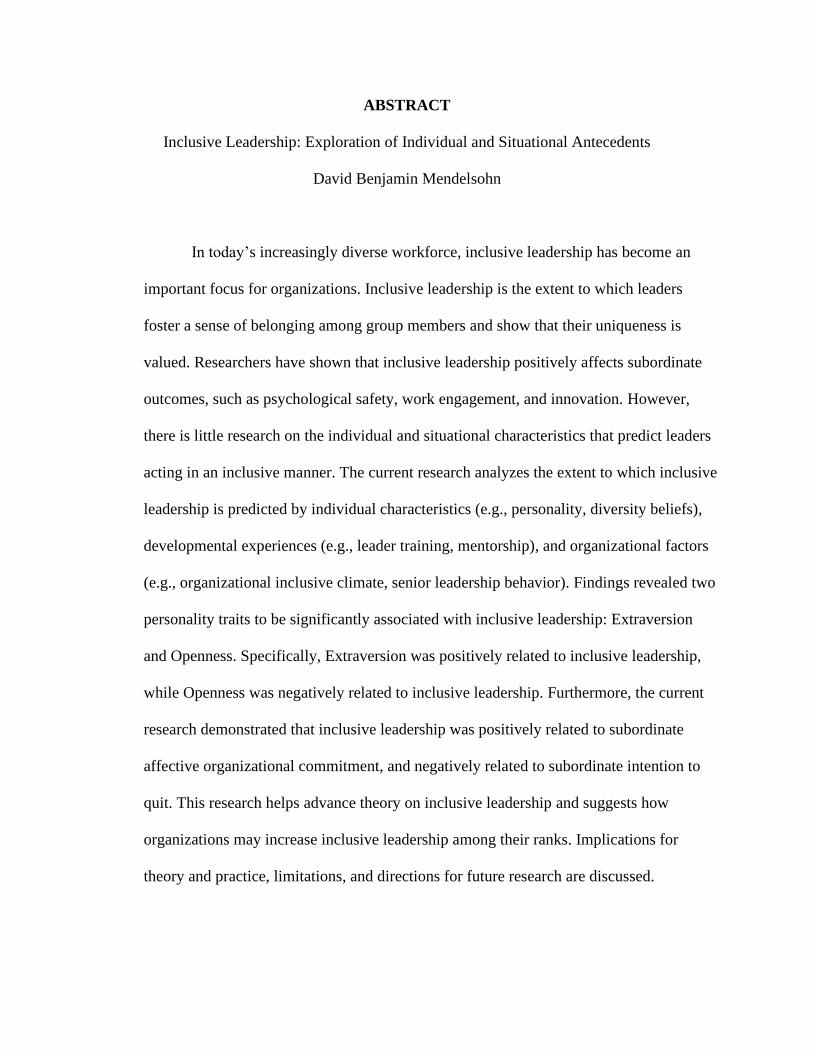
ABSTRACT
Inclusive Leadership: Exploration of Individual and Situational Antecedents
David Benjamin Mendelsohn
In today’s increasingly diverse workforce, inclusive leadership has become an
important focus for organizations. Inclusive leadership is the extent to which leaders
foster a sense of belonging among group members and show that their uniqueness is
valued. Researchers have shown that inclusive leadership positively affects subordinate
outcomes, such as psychological safety, work engagement, and innovation. However,
there is little research on the individual and situational characteristics that predict leaders
acting in an inclusive manner. The current research analyzes the extent to which inclusive
leadership is predicted by individual characteristics (e.g., personality, diversity beliefs),
developmental experiences (e.g., leader training, mentorship), and organizational factors
(e.g., organizational inclusive climate, senior leadership behavior). Findings revealed two
personality traits to be significantly associated with inclusive leadership: Extraversion
and Openness. Specifically, Extraversion was positively related to inclusive leadership,
while Openness was negatively related to inclusive leadership. Furthermore, the current
research demonstrated that inclusive leadership was positively related to subordinate
affective organizational commitment, and negatively related to subordinate intention to
quit. This research helps advance theory on inclusive leadership and suggests how
organizations may increase inclusive leadership among their ranks. Implications for
theory and practice, limitations, and directions for future research are discussed.
i
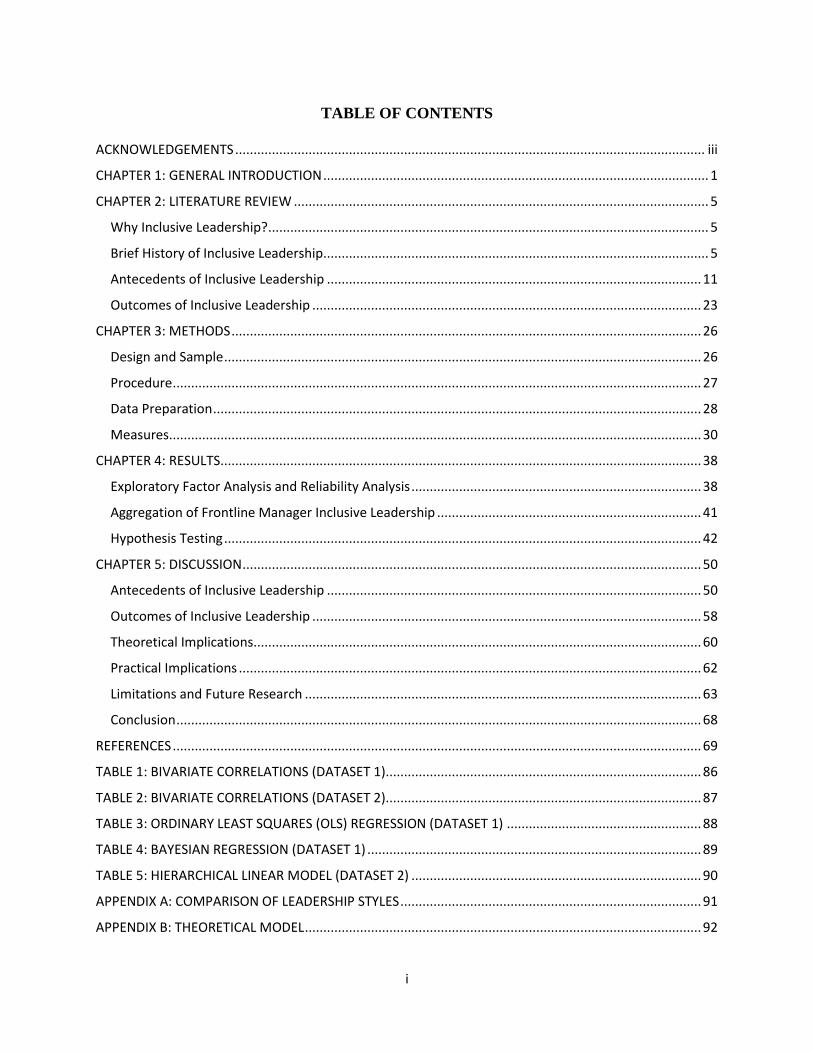
TABLE OF CONTENTS
ACKNOWLEDGEMENTS ................................................................................................................................ iii
CHAPTER 1: GENERAL INTRODUCTION ......................................................................................................... 1
CHAPTER 2: LITERATURE REVIEW ................................................................................................................. 5
Why Inclusive Leadership? ........................................................................................................................ 5
Brief History of Inclusive Leadership......................................................................................................... 5
Antecedents of Inclusive Leadership ...................................................................................................... 11
Outcomes of Inclusive Leadership .......................................................................................................... 23
CHAPTER 3: METHODS ................................................................................................................................ 26
Design and Sample .................................................................................................................................. 26
Procedure ................................................................................................................................................ 27
Data Preparation ..................................................................................................................................... 28
Measures ................................................................................................................................................. 30
CHAPTER 4: RESULTS ................................................................................................................................... 38
Exploratory Factor Analysis and Reliability Analysis ............................................................................... 38
Aggregation of Frontline Manager Inclusive Leadership ........................................................................ 41
Hypothesis Testing .................................................................................................................................. 42
CHAPTER 5: DISCUSSION ............................................................................................................................. 50
Antecedents of Inclusive Leadership ...................................................................................................... 50
Outcomes of Inclusive Leadership .......................................................................................................... 58
Theoretical Implications .......................................................................................................................... 60
Practical Implications .............................................................................................................................. 62
Limitations and Future Research ............................................................................................................ 63
Conclusion ............................................................................................................................................... 68
REFERENCES ................................................................................................................................................ 69
TABLE 1: BIVARIATE CORRELATIONS (DATASET 1)...................................................................................... 86
TABLE 2: BIVARIATE CORRELATIONS (DATASET 2)...................................................................................... 87
TABLE 3: ORDINARY LEAST SQUARES (OLS) REGRESSION (DATASET 1) ..................................................... 88
TABLE 4: BAYESIAN REGRESSION (DATASET 1) ........................................................................................... 89
TABLE 5: HIERARCHICAL LINEAR MODEL (DATASET 2) ............................................................................... 90
APPENDIX A: COMPARISON OF LEADERSHIP STYLES .................................................................................. 91
APPENDIX B: THEORETICAL MODEL ............................................................................................................ 92

ii
APPENDIX C: A PRIORI POWER ANALYSIS ................................................................................................... 93
APPENDIX D: MEASURES ............................................................................................................................. 94
iii
ACKNOWLEDGEMENTS
I owe the completion of the dissertation and Ph.D. journey to the many incredible people I
have had the privilege to work with over the past seven years. First, my disseration sponsor and
advisor, Elissa Perry, has helped me every step of the way, from my first day at Teachers College
to the dissertation defense. In your workgroup and demography seminar I learned how to
critically review research, develop my own novel ideas, and seek out the methodological tools I
need to test my hypotheses. Thank you so much for advising me in all of my independent work –
I cannot say how much I appreciate and hope to emulate your dedication to scientific rigor and
high standards. To my dissertation committee chair, Caryn Block, thank you for taking a chance
on me when I applied to the Ph.D. program. I had little research experience, but desperately
wanted to make an impact on organizations through research. Seeing that, you brought me into
the program and nurtured my development – and for that I will forever be grateful.
I would like to thank my dissertation committee members, who generously offerred their
time to provide guidance and feedback on my research. Thank you, Debra Noumair, for sharing
your deep expertise on personality, which shaped my approach to measuring and thinking about
this construct. Thank you to Frank Golom for your astute observations and advice for improving
the manuscript. And thank you, Terry Maltbia, for your thought partnership on the complexities
of inclusive leadership and other leadership styles.
I am extremely gratefully for the unique opportunity to study with the faculty in the Social-
Organizational Psychology program. Bill Pasmore, your practicum is unparalleled – it gives its
students a “superpower” to understand and consult to groups that I previously never knew
existed. Thank you, Sarah Brazatis, for your insights on group dynamics and for convincing me
to attend the group relations conference! Warner Burke, it was wonderful taking your class and
iv
I’m privileged to have co-authored an article with you. And thank you Peter Coleman and
Loriann Roberson for your courses and thoughtful feedback on my work.
Being alone in a cohort could have felt very isolating, but thankfully I was surounded by
kind and brillant Ph.D. students in other cohorts who gave me sense of community and
belonging. Thank you Asha Gipson, Lauren Catenacci, DeMarcus Pegues, Joe Dillard, Ariel
Bernstein, Danielle Pfaff, and Ginevra Drinkra for showing me the ropes and serving as
wonderful role models. Thank you Stephanie von Numers, Dahee Shon, Josh Elmore, and Jean
Sohn for being research partners and expanding my thinking during workgroup. A special thanks
to Aimee Lace, Shana Yearwood, Allegra Chen-Carrel, Aitong Li, Abby Johnson, and everyone
else who met for weekly virtual “writing group sessions” throughout the pandemic. I owe my
completion of the dissertation to your constant encouragement and enthusiasm, and I promise
your time will come very soon! And of course, thank you John Handel, Ambar Urena, and Lebab
Fallin – you are the glue that holds the program together. Thank you so much for helping me
navigate the doctoral journey.
I’d like to thank my work colleagues who have been an invaluable source of support and
inspiration. In particular, I’m very lucky to have Randy Lim as a friend and manager. I can’t
imagine getting to this point without your encouragement, understanding, and kindness. Laura
Pineault, thank you so much for your advice regarding both theory and methodology – I’m truly
in awe of your breadth and depth of knowledge.
To my parents, who instilled in me the value of education from a (very) young age, thank
you! I could not have gotten this far without the love of learning that I learned from you. Thank
you for your unconditional support throughout the circuitous route I have taken to get here. To
my siblings, thank you for reminding me not to take myself too seriously and that it is important

v
to disconnect from work every once in a while. To Christina’s parents, thank you for expressing
interest in my studies and for your words of encouragement that have sustained me throughout
the Ph.D. journey.
Christina, these past seven years have not been easy. As we’ve pursued our respective
doctoral degress, we have endured years of uncertainty and stress. Between our coursework,
papers, and jobs, opportunities for us to unplug have been few and far between. I cannot express
how much admiration I have for your ability to not only be wildly successful yourself, but to
support me along the way. I would not have made it to this point without your patience, wisdom,
and care. I’m incredibly excited for the next chapter in our lives together. I love you.
D.B.M.

1
CHAPTER 1: GENERAL INTRODUCTION
In organizations around the world, increasing demographic diversity has become an
opportunity and potential challenge to be addressed (Shore et al., 2018; Toossi, 2015). However,
despite enthusiasm for the “business case” for diversity, empirical evidence of a direct positive
relationship between organizational diversity and organizational outcomes is mixed (Eagly,
2016; Kulik, 2014). This mixed effect has led to the common refrain of the “double-edged
sword” of diversity in organizations – the idea that diversity can positively affect group
functioning by enhancing creativity and innovation or have a negative effect in the form of
relationship conflict and reduced social cohesion (Carter & Phillips, 2017; van Knippenberg et
al., 2004). Numerous researchers argue that the extent to which these positive or negative effects
occur largely depends on situational factors such as an organizations’ leadership, climate, and
diversity management practices (Avery & McKay, 2010; Boehm & Dwertmann, 2015). Scholars
and practitioners argue that organizations using effective diversity management practices are the
most likely to unlock the potential benefits of their diverse workforce (Kulik, 2014).
In recent years, researchers have paid more attention to the factors that may enhance the
positive effects of diversity while mitigating the negative effects. One such factor is inclusive
leadership, which is conceptualized as a set of leader behaviors that are focused on facilitating
group members’ feelings of belonging while retaining their sense of uniqueness (Randel et al.,
2018). Inclusive leadership is increasingly seen as distinct from other leadership styles (e.g.,
transformational leadership, servant leadership), in part, because of its particular focus on power
differentials in groups. As a result, it is argued to be especially important for the functioning of
diverse groups because it focuses on incorporating all members within the group and promoting
their diverse contributions and abilities (Randel et al., 2018). Research has found inclusive
2
leadership to be positively associated with numerous individual-level outcomes, such as
psychological safety, work engagement, and innovation behaviors (e.g., Carmeli et al., 2010;
Choi et al., 2017; Choi et al., 2015; Javed et al., 2017). In addition, inclusive leadership has been
linked with group-level, often performance-related, outcomes (e.g., Hirak et al., 2012; Mitchell
et al., 2015; Nembhard & Edmondson, 2006). This has led researchers to propose that inclusive
leaders may help resolve the double-edged sword of diversity by accentuating the positive
aspects of diverse groups (e.g., by promoting diverse perspectives), while mitigating the negative
effects (e.g., by fostering a sense of belonging to reduce intragroup conflict and enhance
communication).
While researchers have argued that inclusive leadership is important in today’s increasingly
diverse organizations, few have researched what makes leaders inclusive. Researchers of
inclusive leadership have suggested several individual-level factors (e.g., diversity beliefs,
humility, and cognitive complexity) that may be associated with inclusive leadership behavior
(Randel et at., 2018). Although leadership research has found that certain individual-level
constructs such as personality are related to leader behavior and performance (e.g., Day et al.,
2014; Judge et al., 2002; Strang & Kuhnert, 2009), these attributes are relatively enduring
dispositional tendencies. As such, proposing only these traits as potential antecedents concedes
that inclusive leadership is an inherently personal quality that cannot be developed. This
approach ignores important situational factors related to leadership behavior (Zaccaro et al.,
2018) and contradicts theory on leader development, which suggests that personality, skills,
experience, and social context are all related to leader effectiveness (Day et al., 2014). Therefore,
it is important to understand how both individual as well as situational factors such as
developmental experiences, organizational climate, and senior leadership contribute to inclusive

3
leadership behavior. This has implications for how organizations approach inclusive leadership.
For example, if individual traits are the primary antecedent of inclusive leadership, then
organizations who want more inclusive leaders should focus on recruiting and selecting
individuals based on traits that predict inclusive leadership. However, if environmental factors
are the primary antecedent, then organizations should focus on the roles that professional
development, organizational climate, and senior leaders play in fostering inclusive leadership.
The purpose of the current research is twofold. First, I propose and test a model of inclusive
leadership that accounts for the role of both individual and situational factors in inclusive
leadership behavior. Despite advancements in recent years, few studies in the leadership
literature test the intricate relationships between leader traits, situational characteristics, and
leader behavior (Zaccaro et al., 2018). This research helps determine the extent to which leaders
behave inclusively as a result of their individual traits compared to their developmental
experiences (mentoring, training) and/or the climate in which they work. This understanding, in
turn, can help organizations strategically focus attention and resources on the most promising
approaches (e.g., selection systems compared to developmental opportunities) to enhance
inclusive leadership. Second, I analyze the impact of inclusive leadership on subordinate
outcomes. Although there is a growing body of research showing that inclusive leadership is
related to subordinate outcomes (e.g., Choi et al., 2017; Randel et al., 2018; Mitchell et al.,
2015), relatively few studies (e.g., Ashikali et al., 2020; Qi & Liu, 2017) measure inclusive
leadership using a consensus of subordinates’ perceptions. Instead, most studies relate
individual-level perceptions of inclusive leader behavior to individual outcomes. In contrast, this
study measures inclusive leadership by aggregating subordinate perceptions to the manager level.

4
This constitutes a more robust measure of inclusive leadership since each leader is rated by
multiple subordinates.

5
CHAPTER 2: LITERATURE REVIEW
Why Inclusive Leadership?
In recent decades, leadership research has focused on established leadership styles such as
transformational leadership, as well as emerging styles such as authentic and ethical leadership
(Dinh et al., 2014). Despite the value of these leadership styles in the workplace, none directly
address the complex dynamics that play out in diverse groups, nor do they focus on minimizing
unequal power dynamics between group members. Inclusive leadership is increasingly seen as a
leadership style critical to establishing an inclusive climate and managing a diverse set of
employees (Shore et al., 2018; Perry et al., 2020). Inclusive leaders may enhance the positive
effects of group diversity by valuing the uniqueness of each individual, thereby increasing
participation in problem-solving and decision-making – especially among group members of
social categories that are typically excluded. Inclusive leaders may also help minimize the
negative effects of group diversity by creating a space in which all group members feel they
belong, thereby reducing perceived status differences and enhancing social cohesion (Mitchell et
al., 2015; Randel et al., 2018). Therefore, scholars have argued that it is important to
conceptualize and study inclusive leadership, a leadership style that is uniquely positioned to
help individuals fully contribute in diverse workgroups.
Brief History of Inclusive Leadership
Early Conceptualization and Research
The construct of inclusive leadership began to appear in the academic literature in the mid-
2000s. Early research was grounded in the idea that inclusive leadership might operate as a
moderator that helped attenuate the potential negative impact of diversity or unequal status in
workgroups (Nembhard et al., 2006; Nishii et al., 2009). Nembhard and colleagues (2006) found

6
that the negative effect of having lower status on perceived psychological safety was reduced in
teams that had more inclusive leaders. Similarly, Nishii et al. (2009) found that the negative
relationship between group diversity and retention was mitigated in departments with more
inclusive leaders. During this time, researchers also began showing that inclusive leadership had
a direct positive impact on employee outcomes. For example, Carmeli et al. (2010) found that
inclusive leadership was positively related to employee involvement in creative work tasks via
the mediating effect of psychological safety. Many of these and related studies used one of two
newly developed inclusive leadership measures. Nembhard et al. (2006) developed a 3-item
measure to assess the “extent to which NICU leaders’ words and deeds indicated an invitation
and appreciation for others as contributing members in a team endeavor.” The items were framed
around physician leadership since that was the focal population of their study. Carmeli et al.
(2010) created a 9-item measure designed to assess what they conceived to be the three
dimensions of inclusive leadership: openness, availability, and accessibility. The two measures
created by Nembhard et al. (2006) and Carmeli et al. (2010) were among the most frequently
used for research on inclusive leadership in subsequent years.
Expansion of Research
The next phase of research on inclusive leadership, which occurred during the early to mid-
2010s, expanded the breadth of outcomes associated with inclusive leadership and identified
several processes and boundary conditions of its impact on these outcomes. Based on prior work,
researchers hypothesized and found evidence of relationships between inclusive leadership and
subordinate psychological outcomes, behavior, and performance. Multiple studies substantiated
the link between inclusive leadership and subordinate psychological outcomes including
psychological safety (Appelbaum et al., 2016; Hirak et al., 2012; Javed et al., 2017), work
7
engagement (Choi et al., 2015), and well-being (Choi et al., 2017). Researchers also investigated
how inclusive leadership related to subordinate work behaviors. Research found that inclusive
leadership was positively associated with subordinate behaviors related to innovation (Choi et
al., 2017; Javed et al., 2018; Javed et al., 2017), helping (Randel et al., 2016), learning (Hirak et
al., 2012; Ye et al., 2018), procrastination (Lin, 2018), voice (Li et al., 2017; Qi et al., 2017;
Weiss et al., 2018) and reporting adverse events (Appelbaum et al., 2016). Finally, research
expanded into the domain of subordinate performance with multiple studies reporting positive
effects of inclusive leadership on subordinate performance at the individual and team levels
(Hirak et al., 2012; Jin et al., 2017; Lin et al., 2016; Mitchell et al., 2015; Qi & Liu, 2017; Xiang
et al., 2017; Zheng et al., 2018).
Researchers also uncovered several mediators and moderators of the relationship between
inclusive leadership and subordinate outcomes. Mediating mechanisms included constructs such
as person-job fit (Choi et al., 2017), perceived status differences (Michell et al., 2015), team
identity (Michell et al., 2015) and Leader-Member Exchange (LMX; Javed et al., 2018).
Researchers also continued to find that perceptions of psychological safety mediated the link
between inclusive leadership and employee outcomes (Appelbaum et al., 2016; Javed et al.,
2017). Noteworthy moderators studied during this time were employee demographics and team
diversity. Randel et al. (2016) found that inclusive leadership had a stronger impact on helping
behaviors for racioethnic minorities and women compared to racioethnic majority members and
men. Researchers also began to study the value of inclusive leadership at the group level. For
example, Mitchell et al. (2015) found that the relationship between inclusive leadership and team
performance (as mediated by perceived status difference) was moderated by professional
diversity, such that inclusive leadership had a more positive effect in teams that were more
8
professionally diverse. Together, these results indicate that inclusive leadership is especially
beneficial for individuals who are women and minorities and in teams that are demographically
and professionally diverse.
Theory Advancements and Reconceptualization
Research in the late 2010s focused on advancing theory on inclusive leadership by building a
more comprehensive and fine-grained understanding of the construct. At this time, Randel et al.
(2018) created a model of inclusive leadership based on Shore et al.’s (2011) definition of
organizational inclusion. This model used Optimal Distinctiveness Theory (Brewer, 1991, 2012)
to argue that individuals simultaneously feel the need to be both similar to and different from
others. Having a feeling of belonging, but not uniqueness, is a state that Shore and colleagues
(2018) labeled “assimilation.” While assimilated individuals may be treated as insiders with
valuable knowledge, they may also hide personal characteristics that do not conform to the rest
of the group, which can lead to negative outcomes such as emotional exhaustion (Hewlin, 2009).
Conversely, having a feeling of uniqueness, but not belonging, is a state that Shore and
colleagues (2011) labeled “differentiation,” which describes a situation in which an individual
“is not treated as an organizational insider in the work group but their unique characteristics are
seen as valuable and required for group/organization success” (Shore et al., 2011, p. 1266). The
authors relate this to Ely and Thomas’s (2001) “access-and-legitimacy” paradigm. Under this
paradigm, diverse employees are valued because they can successfully interact with similarly
diverse customers, but as a consequence can be pigeonholed for roles that require this type of
interaction. This can lead to stereotyping based on the characteristics that make the individual
unique, such as race (Ely & Thomas, 2001). By contrast, inclusion is the product of individuals’
feeling that they both belong to the workgroup and are valued for their uniqueness. Workgroups

9
and organizations that adopt an integration-and-learning perspective simultaneously value
uniqueness (viewing diversity as a resource) and foster a sense of belonging (through members
feeling valued and respected; Ely & Thomas, 2001; Shore et al., 2011).
Based on these two core dimensions of inclusion (facilitating belongingness and valuing
uniqueness) Randel and colleagues (2018) proposed a set of inclusive leadership behaviors
corresponding to each dimension. The authors claimed that inclusive leaders facilitate
belongingness by supporting group members, ensuring justice and equity, and sharing decision-
making. Supporting individuals as group members enhances their feelings of being part of the
group (Turner et al., 1987). Ensuring justice and equity communicates respect based on the
group-value model of procedural justice (Lind & Tyler, 1988). Sharing decision making
increases a sense of psychological ownership (Liu et al., 2012; Van et al., 2004). Randel et al.
(2018) also stated that inclusive leaders show that they value uniqueness of their team members
by encouraging diverse contributions and helping group members fully contribute. Encouraging
discussion of diverse viewpoints enhances team members’ perceptions that unique perspectives
are welcome (Kearney & Gebert, 2009) and helps group members fully contribute. This ensures
that the group benefits from the viewpoints of individuals who otherwise might not feel that their
contributions are welcome (Roberson, 2006). Finally, other authors have suggested that inclusive
leaders prevent exclusion by ensuring compliance with discrimination laws and confronting
microaggressions when they occur in the workplace (Perry et al., 2020).
Inclusive leadership vs. Other leadership Styles
More recently, scholars have begun to articulate how inclusive leadership is distinct from
other leadership styles and approaches (e.g., transformational, empowering, servant, authentic
leadership, LMX). Although inclusive leadership and other leadership styles have overlapping
10
qualities, they are different in important ways. In particular, other leadership styles do not
prioritize belongingness and uniqueness and do not focus on minimizing power dynamics in
groups. For example, transformational leaders use their vision to enhance individuals’
commitment to shared organizational goals (Bass, 1990), but this vision does not necessarily
involve making team members feel like they belong or that their uniqueness is valued. Similarly,
empowering leadership is defined as leaders sharing power by facilitating employees’ control
over their own decisions and goals (Srivastava et al., 2006). However, this style does necessarily
foster a sense of belonging in the workgroup. Servant leadership is characterized by
deemphasizing the self-interests of the leader and setting up others for success by developing and
providing opportunities for members (Liden et al., 2008). Although servant leadership, like
inclusive leadership, emphasizes the importance of supporting team members, servant leaders do
not necessarily show that members’ uniqueness is valued. Thus, strong servant leadership may
exist in an organization that promotes assimilation rather than inclusion. Authentic leadership is
defined by leaders being authentic to who they are in their interactions with others in order to
foster trust and transparency (Walumbwa et al., 2008). However, this approach is focused on the
leaders’ own authenticity rather than valuing uniqueness in team members. Finally, some have
suggested that inclusive leadership is reflected in the positive relationship between a leader and
each of his or her employees which has been captured by the concept of LMX in previous
research (Nishii & Mayer, 2009). However, LMX is based on the idea that leaders form dyadic
relationships that vary in quality with each team member (Liden et al., 2006). In contrast,
inclusive leadership focuses on the extent to which members feel that they belong and that their
unique contributions are valued in relation to the work group as a whole. Importantly, while
these leadership styles address concepts that are similar to inclusive leaders’ focus on

11
belongingness, they generally do not focus on the leaders’ role in ensuring justice and equity or
valuing workgroup members’ uniqueness in their teams. Overall, researchers have argued that
the differences between inclusive leadership and other leadership styles justifies exploring
inclusive leadership as a distinct leadership style (Li, 2021; Randel et al., 2018). See Appendix A
for a comparison of these leadership styles.
Antecedents of Inclusive Leadership
Despite the abundance of research on the outcomes of inclusive leadership, we know little
about its antecedents. Randel, et al. (2018) offer a conceptual model in which they propose three
potential individual difference factors (pro-diversity beliefs, humility, and cognitive complexity)
that should increase the likelihood that individuals will engage in inclusive leadership. While the
authors make sound arguments for each factor, there are several theoretical issues with the set of
antecedents that they propose. First, these potential antecedents are entirely focused on the
individual and neglect the role of the situation in influencing leader behavior. For example, it is
possible that developmental experiences, organizational climate, and senior leaders have an
equivalent or even greater impact on leader inclusive behavior compared to the leader’s
individual traits. However, the model offered by Randel et al. (2018) does not recognize these
potential situational effects. Second, the authors do not contextualize their predictions about the
relationship between individual characteristics and inclusive leadership in the broader context of
personality and leadership, despite the sizable body of research in this area. For example,
research has found evidence of a relationship between the Big Five personality traits and
transformational leadership (Judge et al., 2002; Bono & Judge, 2004; Tuncdogan et al., 2017), as
well as other leadership styles such as servant and charismatic leadership (De Hoogh et al., 2005;
Washington et al., 2006). Given this relationship between the Big Five and multiple leadership
12
styles and the fact that inclusive leadership and these other styles (e.g., transformational
leadership) have some overlapping qualities (e.g., fostering a sense of belonging), it is surprising
that Randel et al. (2018) do not consider the Big Five personality traits as potential antecedents
to inclusive leadership. This would allow us to broaden our understanding of the relationship
between personality and inclusive leadership. Finally, Randel et al. (2018) propose diversity
beliefs as a potential antecedent of inclusive leadership based on research indicating that leaders
with pro-diversity beliefs are more likely to see the potential benefits of workgroup diversity
and, as a result, demonstrate a greater appreciation for the unique contributions derived from
group members’ diverse backgrounds and identities (Homan et al., 2007). However, Randel et
al.’s (2018) conceptualization of “pro-diversity beliefs” is vague and does not acknowledge the
potentially multidimensional nature of diversity beliefs. Some researchers argue that individuals
can hold multiple and potentially contradictory diversity beliefs. For example, an employee
might feel that diversity has a positive effect on their team’s performance but perceive it to have
a negative impact on their own career (De Meuse & Hostager, 2001). Different diversity beliefs
may have different implications for diversity management and therefore require a greater level of
scrutiny.
In response to these limitations in the inclusive leadership literature, the goal of this study is
to assess the extent to which individual and situational characteristics predict inclusive leadership
behavior. These findings can be used to inform recommendations for organizations that wish to
have more inclusive leaders. In determining the relative strength of these factors, I aim to help
organizations understand the extent to which attaining inclusive leaders is a matter of selection,
development, organizational climate, or organizational senior leadership. Although inclusive
leadership is conceptually distinct from other leadership styles such as transformational or
13
authentic leadership (Randel et al., 2018), the exploration of potential antecedents of inclusive
leadership can benefit from research that has been conducted on these other leadership styles.
The following section will review research that has identified various individual (e.g.,
personality traits, diversity beliefs) and situational (e.g., training, mentorship, organizational
climate, senior leadership) antecedents to leadership behavior and describe how each may relate
to inclusive leadership. This review informs study hypotheses regarding the antecedents of
inclusive leadership, depicted in the theoretical model in Appendix B.
Individual Characteristics
Individual characteristics are defined as personal attributes that vary across people and are
not explained by unit- or organizational-level factors. Individual characteristics are the traits and
beliefs that people “show up with.” There are two types of individual characteristics that are
important potential antecedents of inclusive leadership: personality and diversity beliefs. These
potential antecedents are prioritized in this study because together they account for a broad set of
individual attributes that can be feasibly measured with the current research design. Although
Randel et al. (2018) also proposed cognitive complexity as a potential antecedent of inclusive
leadership, it was determined that measuring this attribute would greatly complicate data
collection and was therefore omitted.
Personality Traits. Personality has long been studied as an antecedent of leadership style.
Personality appears to predict variance in leadership emergence, style, and behavior (Bono &
Judge, 2004; Judge et al., 2002; Tuncdogan et al., 2017). Researchers have found that certain
personality traits such as Extraversion are linked to transformational leadership behaviors (Bono
& Judge, 2004; Reichard et al., 2011), while Agreeableness predicts servant leadership behavior
(Washington et al., 2006) and Conscientiousness predicts leader and follower productivity

14
(Colbert & Witt, 2009). Personality traits are stable over time (Cobb-Clark & Schurer, 2012),
consistent across organizational contexts (Fleeson & Gallagher, 2009; Staw & Ross, 1985), and
partially heritable (Li et al., 2012, Ilies et al., 2004). In all, previous research has demonstrated
that personality is a stable individual attribute that predicts various leadership styles.
Given the link between personality and other leadership styles, personality is likely to be
linked to inclusive leadership. Specifically, leader Agreeableness may have the strongest positive
association with inclusive leadership, while leader Neuroticism may have the strongest negative
association with inclusive leadership. Agreeable individuals are described as sensitive,
sympathetic, trustworthy, kind, gentle, and warm (Costa & McCrae, 1992). As a result, agreeable
leaders are more likely to be interpersonally oriented, focused on the unique needs of their team
members, and committed to making all individuals feel that they belong to the group. For
example, when managing a diverse team, a leader who is high in Agreeableness is more likely
than a leader low in Agreeableness to try to understand the perspective of team members who
hold opposing opinions and include them in the decision-making process rather than sidelining
them. Previous research has found that agreeable leaders contribute to positive procedural,
interpersonal, and informational justice climates in their teams (Mayer et al., 2007). Justice
climate indicates the extent to which group members feel they are treated fairly, while
interpersonal justice refers to individuals’ perceptions that they are treated with dignity and
respect (Greenberg, 1993; Roberson & Colquitt, 2005). These climate measures are consistent
with researchers’ arguments that inclusive leaders foster a sense of belonging and treat work unit
members with fairness, equality, and respect (Li, 2021; Randel et al., 2018). As such, it is
reasonable to hypothesize that Agreeableness will be positively related to inclusive leadership.
15
On the other hand, leader Neuroticism should have a strong negative relationship with
inclusive leadership. Neurotic individuals are described as anxious, fearful, depressed, irritable,
stressed, and moody (Costa & McCrae, 1992). They tend to react more negatively to events in
the workplace and take longer to recover from setbacks. Bono and Judge (2004) hypothesized
and found a negative relationship between Neuroticism and transformational leadership
behavior, noting that neurotic individuals likely lack the self-confidence and stability required to
lead their teams and involve themselves in their teammates’ efforts. Similarly, Mayer et al.
(2007) found leader Neuroticism to be negatively associated with positive procedural,
interpersonal, and informational justice climates in their teams. Leaders who are high in
Neuroticism may be too overwhelmed by their own concerns to focus on the needs of their
teammates, which may hinder their ability to create a space in which people feel that they belong
and their uniqueness is valued.
H1: Frontline manager Agreeableness will be positively associated with inclusive leadership.
H2: Frontline manager Neuroticism will be negatively associated with inclusive leadership.
Diversity Beliefs. Diversity beliefs refer to an individual’s views about the benefits and
drawbacks of diversity in work groups (van Knippenberg & Haslam, 2003). Individuals hold
positive diversity beliefs when they believe that diversity is associated with a larger pool of
knowledge and perspectives that are beneficial for team functioning. Negative diversity beliefs
indicate that individuals prefer to work in teams that are less diverse (van Knippenberg et al.,
2007). Randel et al. (2018) suggested that leaders who hold positive diversity beliefs are more
likely to demonstrate inclusive leadership behaviors. They argued that leaders with positive
diversity beliefs are more likely to have a mental openness that enables them to create a greater
sense of belonging to the work group and incorporate the group members’ unique perspectives
16
into the group’s work. Moreover, leaders with positive diversity beliefs “encourage interactions
and the exchange of information between members of different subgroups, and thus support the
convergence of mental models” (Schölmerich et al., 2016, p. 185), while those with negative
diversity beliefs may treat subgroups unequally and thus elicit perceptions of identity threat.
Unequal treatment across subgroups caused by negative diversity beliefs is likely antithetical to
the concept of inclusion which includes “equitable employment practices” as an important
dimension (Nishii, 2013).
There is empirical research linking leader diversity beliefs to individual and team outcomes
(Greer et al., 2012; Schölmerich et al., 2016). Several researchers have found that leader
diversity beliefs moderate the relationship between various measures of unit diversity and unit
outcomes. For example, Schölmerich et al. (2016) found leader diversity beliefs attenuated the
detrimental effect of demographic faultlines on team cohesion and social loafing. Researchers
have also found that diverse units have better communication and financial performance when
their leaders display visionary behavior and do not show social categorization tendencies, which
are consistent with positive diversity beliefs (Greer et al., 2012). There also appears to be a
positive relationship between employee perceptions of a leader’s diversity beliefs and that
leader’s own supervisor’s rating of his/her performance (Weber et al., 2018). This research used
archival data from a sample of 33,976 leaders from 36 different countries to show that leaders
who are perceived by their subordinates as respecting varying backgrounds and perspectives and
valuing cultural differences are more likely to receive higher performance ratings from their own
supervisors.
Diversity beliefs are complex and multidimensional. DeMeuse and Hostager (2001) proposed
a framework to measure diversity beliefs that is based on a conceptualization of diversity beliefs
17
as having a number of dimensions: emotional reactions (i.e., initial, visceral reactions to
workplace diversity), judgments (i.e., beliefs about diversity in principle), behavioral reactions
(i.e., planned verbal and nonverbal actions in response to diversity), personal consequences (i.e.,
views on how diversity affects oneself), and organizational outcomes (i.e., views on how
diversity affects the organization as a whole). Additionally, Nakui et al. (2011) measured
employee attitudes towards workplace diversity along two dimensions: productive (i.e., beliefs
about the efficacy of diverse workgroups) and affective (i.e., social aspects of diversity). Finally
Hofhuis et al. (2015) proposed a model that measures multiple perceived benefits of diversity
including understanding of groups in society, creative potential, image of social responsibility,
job market, and social environment, as well as perceived threats of diversity including realistic
threat, symbolic threat, intergroup anxiety, and productivity loss. Positive diversity beliefs, such
as the belief that diversity aids the creative potential of teams, may be especially predictive of
inclusive leadership. This belief is defined as “the notion that cultural diversity leads to more
effective idea generation, increasing learning opportunities, and problem-solving potential of
team” (Hofhuis et al., 2015, p. 195). Leaders with this positive belief are likely to value the
uniqueness of group members because of the new ideas that they can bring to the team. On the
other hand, negative diversity beliefs are likely to be negatively associated with inclusive
leadership. For example, the negative belief of intergroup anxiety, defined as “a sense of fear or
insecurity resulting from (anticipated) interaction with members of different culture, potentially
leading to miscommunication, embarrassment, or conflict” (Hofhuis et al., 2015, p. 197) may
cause leaders to be more hesitant and less open with dissimilar group members, thus making
these group members feel like “others” and thereby reducing their sense of belonging in the
18
group. Given the exploratory nature of this research, this study only hypothesizes about the broad
positive and negative diversity belief factors, rather than the more granular sub-factors.
H3: Frontline managers’ positive diversity beliefs will be positively associated with inclusive
leadership.
H4: Frontline managers’ negative diversity beliefs will be negatively associated with
inclusive leadership.
Situational Characteristics
Situational characteristics act upon leaders to influence their behavior. These are not intrinsic
attributes of the person, but characteristics of the situation that may cause leaders to behave
inclusively. Studying situational antecedents to inclusive leadership seems crucial given that
leadership research and theory suggest that “the influence of leader traits and capacities on
leadership behaviors and outcomes depends heavily upon situational characteristics” (Zaccaro et
al., 2018, p. 29). These characteristics may include the set of developmental experiences to
which the leader has been exposed, including leadership training and mentorship. They may also
include organizational factors such as the inclusive behaviors of senior leadership and the extent
to which the organization has an inclusive climate. These factors serve as cues that inclusive
leadership is appropriate and necessary in the leader’s organization.
Developmental Experiences. Individuals may be predisposed to display certain types of
leadership behaviors based on their personality traits and beliefs. However over time,
individuals’ behavior can shift as a result of specific developmental experiences they obtain in
their organizations (Day & Dragoni, 2015). Leadership scholars typically distinguish between
leader development and leadership development although these terms are often used
interchangeably (Lacerenza et al., 2017). Leader development focuses on building individuals’
19
knowledge, skills, and abilities, often through formal leader training (Day, 2000; Subramony et
al., 2018). Leadership development focuses on developing group-level capabilities “by helping
people understand how to relate to others, coordinate their efforts, build commitments, and
develop extended social networks” (Day, 2000, p. 586) through feedback, coaching, mentoring,
network events, stretch assignments, and job rotations (Day, 2000; Subramony et al., 2018). The
current research focuses on aspects of both leader development and leadership development in
the forms of leader training and mentoring, respectively.
Leader Training. Leader training involves programs that have been systematically
designed to enhance leader knowledge, skills, and abilities (Day, 2000; Lacerenza et at., 2017).
Leader training programs are likely to convey explicit knowledge to leaders about how to behave
and the expectations for their role. These programs usually include interpersonal competencies
such as building relationships, active listening, and communication (Hogan & Warrenfeltz, 2003;
Lacerenza et al., 2017), and may comprise inclusion-related competencies such as conflict
resolution, sexual harassment management, addressing unconscious bias, managing diverse
teams, and diversity and inclusion (Bezrukova et al., 2012; Bezrukova et al., 2016; Kulik &
Roberson, 2008). Training in these competencies is likely to promote inclusive leadership.
Multiple meta-analyses provide evidence that leader training is moderately effective across
numerous criteria including leader reactions, learning, transfer to real work, and results (Burke &
Day, 1986; Collins & Holton, 2004; Kirkpatrick, 1959; Lacerenza et al., 2017). Recent research
shows that the content of the training program is an important moderator of the relationship
between leader training and a leader’s ability to deliver results (e.g., lower turnover, absenteeism,
goal-achievement, and performance). Specifically, there is evidence that programs that teach
“soft skills” such as interpersonal, intrapersonal, and leadership skills improve organizational
20
and individual outcomes more than programs that primarily teach “hard skills” or business
competencies such as problem-solving or data-analysis (Lacerenza et al., 2017). Furthermore,
quasi-experimental field research provides evidence that leader training can increase the
frequency of transformational leadership behaviors (Parry & Sinha, 2005).
Together, this research suggests that leader training shapes how leaders behave and how they
and their subordinates perform. Although there is little research demonstrating an explicit link
between leader training and inclusive leadership, I hypothesize that this link exists based on the
relationship between leader training and transformational leadership behavior and between the
typical content of leader training programs and the competencies required for inclusive
leadership. Both transformational and inclusive leadership contain strong interpersonal elements.
Therefore it seems reasonable to expect that leader training could also influence inclusive
leadership behaviors. Furthermore, the connection between leader training and inclusive
leadership behavior is likely to be even stronger when the content of the leader training focuses
on competencies inclusive leaders are likely to demonstrate including interpersonal skills,
conflict resolution, sexual harassment management, addressing unconscious bias, managing
diverse teams, and diversity and inclusion (Bezrukova et al., 2012; Bezrukova et al., 2016; Kulik
& Roberson, 2008).
H5: Receiving interpersonal and inclusion-related leader training will be positively
associated with inclusive leadership.
Mentorship. Workplace mentorship is associated with numerous benefits for the protégé and
organization (Allen et al., 2006; Allen et al., 2004). Mentors serve two major functions: career-
related support and psychosocial support (Kram, 1985). Career-related support involves
sponsorship, exposure and visibility, coaching, protection, and challenging assignments, all of

21
which help protégés advance in the organization. Psychosocial support refers to “those aspects of
a relationship that enhance an individual’s sense of competence, identity, and effectiveness in a
professional role” (Kram, 1985, p. 32) and include role modeling, acceptance and confirmation,
counseling, and friendship. This classification of mentor functions has been supported by
numerous studies using factor analysis of mentoring behaviors (e.g., Ensher & Murphy, 1997;
Tepper, Shaffer, & Tepper, 1996).
Research supports the idea that mentorship affects leadership behavior and effectiveness.
Leaders who have mentors who model effective leadership behavior demonstrate more trust in
their subordinates (Ladegard & Gjerde, 2014), allocate more time towards leading others
(Dragoni et al., 2014), receive higher subordinate ratings of ethical leadership (Brown &
Treviño, 2014), and are rated as more effective leaders overall (Lester et al., 2011; Seibert et al.,
2017). Given this research, it seems reasonable to expect that frontline managers who have
inclusive mentors will themselves become more inclusive leaders. Mentors who advise their
mentees on interpersonal and inclusion-related topics may influence the inclusive leadership of
their proteges either directly by communicating the benefits of inclusive leadership behaviors, or
indirectly through the inclusive behaviors they role model. Therefore, it is expected that leaders
whose mentors advise them on interpersonal and inclusion related topics will be more inclusive
than leaders with mentors who advise them on other topics, such as business skills.
H6: Receiving interpersonal and inclusion-related mentoring will be positively associated
with inclusive leadership.
Organizational Factors. Despite the likely importance of individual characteristics and
leader development, numerous scholars argue that organizational factors such as organizational
climate and senior leader behavior have an outsized impact on leader behavior (Boekhorst, 2015;

22
Kulik, 2014). The role of the organization in shaping leader behavior is a core component of
several influential theories, including contingency theory (Yukl, 2011) and upper echelons
theory (Hambrick & Mason, 1984). Researchers such as Davis-Blake and Pfeffer (1989) argue
that organizations are strong situations with structural factors (e.g., compensation) that have a
profound influence on individuals’ behavior. Shivers-Blackwell (2004) argues that leaders
behave according to their interpretation of the organization’s structure (organic versus
bureaucratic), culture (transformational versus transactional), and role expectations
(transformational versus transactional).
Inclusive Senior Leader Behavior. According to social learning theory (Bandura & Walters,
1977), individuals learn behavior by observing and emulating role models. In organizations,
individuals often identify their leaders as role models due to their status, perceived competence,
and power (Brown & Treviño, 2014). Consistent with this theory, evidence suggests that senior
leaders (e.g., directors, partners, department leaders) can influence the behavior of lower-level
leaders (Arthur & Boyles, 2007). Scholars studying transformational leadership have
substantiated this pattern. For example, research has found that in hierarchical organizations,
leadership has a “falling dominoes” effect by which transformational leaders increase
transformational behaviors among their direct and indirect followers (Bass et al., 1987;
Yammarino, 1994). Empirical research has indeed found that frontline managers emulate the
transformational leadership behaviors of their own superiors, especially when there is less social
distance between the frontline manager and his or her superior (Cole et al., 2009). Although there
is little direct research evidence of a link between senior inclusive leadership behaviors and the
inclusive leadership behaviors of the frontline supervisors they supervise (Perry & Li, 2019), I
suggest such a relationship is likely based on research on transformational leadership and theory.
23
H7: Perceived inclusive behavior of senior leaders will be positively associated with inclusive
behavior of frontline managers.
Organizational Inclusive Climate. While senior leaders may directly influence the frontline
managers they supervise through the behavior they role model, their influence may also be
indirect through the climates they foster. Many studies demonstrate evidence of a link between
organizational climate and leadership behavior (e.g., Koene et al., 2002). Climate for inclusion
may be an antecedent or outcome of inclusive leadership, depending on the level of the leader
(Li & Perry, 2020). Inclusive organizational climates may influence frontline managers’
behavior in part through organizational socialization processes (Van Maanen & Schein, 1979;
Bauer et al., 1996). Organizational socialization is the process by which individuals learn about
and adjust to the knowledge, skills, attitudes, expectations, and behaviors needed for a new or
changing role in an organization (Cooper-Thomas & Anderson, 2006). One element of this
process involves learning and adapting to the organization’s goals and values espoused by more
powerful organization members (Chao et al., 1994; Fisher, 1986). For organizations that espouse
inclusive values through an inclusive organizational climate, frontline managers are likely to
emulate these values in an attempt to become insiders in their role (Cooper-Thomas & Anderson,
2006). Therefore, it is hypothesized that inclusive organizational climates will be associated with
inclusive leadership of frontline managers.
H8: Perceived organizational inclusive climate will be positively associated with inclusive
leadership.
Outcomes of Inclusive Leadership
Research has shown that inclusive leadership is associated with several important
subordinate outcomes. Although the primary purpose of this research is to explore the
24
antecedents of inclusive leadership, I also test the extent to which inclusive leadership relates to
various subordinate outcomes. To date, studies have indicated a direct or indirect link between
inclusive leadership and subordinate psychological safety (Appelbaum et al., 2016; Carmeli et
al., 2010; Hirak et al., 2012; Javed et al., 2017; Nembhard & Edmondson, 2006), voice behaviors
(Li & Hang, 2017; Qi & Liu, 2017; Weiss et al., 2018), creativity (Carmeli et al., 2010; Choi et
al., 2015), engagement (Choi et al., 2015; Nembhard & Edmondson, 2006; Xiang et al., 2017),
positive LMX (Javed et al., 2018; Li & Hang, 2017), innovative behavior (Choi et al., 2017;
Javed et al., 2017; Javed et al., 2018; Qi et al., 2019; Xiang et al., 2017, and performance (Hirak
et al., 2012; Jin et al., 2017; Lin et al., 2016; Mitchell et al., 2015; Qi & Liu, 2017; Xiang et al.,
2017; Zheng et al., 2018). Together, this research offers support for the claim that inclusive
leadership is an important driver of subordinate outcomes. This study focuses on the relationship
between inclusive leadership and three subordinate global job attitudes: affective organizational
commitment, job satisfaction, and intention to quit. Since these attitudes are central to
employees’ overall experience at work as well as performance (Judge & Kammeyer-Mueller,
2012), findings of a relationship between inclusive leadership and these job attitudes would have
major practical implications for organizations, emphasizing the importance of promoting
inclusive leadership among frontline managers. Additionally, this paper predicts that the
relationship between inclusive leadership and subordinate job attitudes will be stronger for
women and racioethnic minorities. This prediction is based on theory suggesting that “perceived
low status minorities” (e.g., women and racioethnic minorities) are more affected by experiences
of injustice in their organizations due to their lived experience with bias, discrimination, and
unfair treatment (Mamman et al., 2012). These experiences can lead perceived low status
minorities to receive greater benefit from supportive organizational policies and leadership
25
behaviors. Accordingly, research has found that subordinates who are women and/or minorities
receive more benefit from inclusive leadership (Randel et al., 2016) and positive diversity
climate (Gonzalez & DeNisi, 2009).
H9: Frontline manager inclusive leadership will be positively associated with subordinate
outcomes such as affective organizational commitment, job satisfaction, and intention to quit.
H10: The relationship between frontline manager inclusive leadership and subordinate
outcomes will be stronger for subordinates who are nonwhite and/or women.
26
CHAPTER 3: METHODS
Design and Sample
The design of this study is a correlational field study using a sample of managers and their
employees from a private radiology practice in the United States. The main business of the
practice is medical imaging and diagnosis, including MRI, CT, and X-ray. The organization has
roughly 1,500 employees and more than 30 offices in both urban and suburban areas. There are
approximately 20 departments, including radiology, radiologic technology, information
technology, nursing, marketing, front desk, scheduling, and billing. Each department comprises
one senior leader, several frontline managers, and several dozen subordinates, though this
number varies between departments. Radiology is a healthcare specialty that relies on employees
with a high degree of knowledge and expertise, and in which innovation is critical to
organizational performance (European Society of Radiology, 2009). As such, radiology is a
healthcare specialty that would benefit from the synergies that can result from diversity in terms
of complex decision-making and innovation (Dwertmann et al., 2016). Despite this, radiology
appears to lag behind in diversity management practices (Norbash & Kadom, 2020), making this
study important for both research on inclusive leadership generally and the practice of radiology
in particular.
All employees in the organization were invited to participate in the study, with the goal of
collecting as many responses as possible from frontline managers and their subordinates across
all departments. Although only employees from a single organization were surveyed, sufficient
variance in perceptions of climate and senior leadership behavior was expected because the
organization’s departments vary in terms of their departmental leadership structure. Furthermore,
it was reasoned that the geographical dispersion of the offices likely contributed to variance in

27
perceptions. This variance would allow perceptions of inclusive climate and senior leadership
behavior to be used as predictor variables.
To determine the required sample size for this study (i.e., number of frontline managers), I
conducted an a priori power analysis using G*Power3 (Faul et al., 2007). Results showed that a
sample of 187 frontline managers would be required to achieve a power of .80. The output from
this analysis can be found in Appendix C.
Leaders and subordinates received different versions of the survey. The version for leaders
included questions about antecedents to inclusive leadership behavior (i.e., personality, diversity
beliefs, mentoring experiences, training experiences, senior inclusive leadership, organizational
inclusive climate) and their own demographics. The version for subordinates included questions
about their leaders’ inclusive behavior, their own work attitudes (i.e., job satisfaction,
organizational commitment, and intention to quit), and their own demographics (e.g., race and
gender).
Procedure
Employees were initially informed about the study and the opportunity to participate via an
email from the CHRO of the organization. The emailed stated that participation was voluntary,
responses would be confidential, and that the data would be used to help the organization
improve employee experience. Invitations to participate in the survey were sent directly to
managers and subordinates through the Qualtrics email distribution system. Respondents took
the survey online through desktop or mobile devices. Reminders to participate were sent
approximately once per week for about two months. In the final weeks of data collection, the
CEO sent follow-up emails to frontline managers asking them to participate.
28
Sixty-three out of 96 (66%) managers in the organization completed the survey, and 203 out
of 884 (23%) of subordinates completed the survey. The population of 96 managers in the
organization was substantially lower than the expected ~200 managers. Though it is unclear why
the population of managers was lower than expected, COVID-related furloughs may have been a
factor. Of the 63 managers who completed the survey, 40 received ratings of their inclusive
leadership from at least one subordinate. Each manager received an average of 4.5 subordinate
ratings (SD = 4.6). Therefore, data from 40 out of 96 (42%) of the managers in the organization
could be used in the analysis. This sample of frontline managers was relatively diverse in terms
of gender (67.5% female), age (mean = 41.1 years, SD = 10.9 years), and education (25% with
no college degree, 37.5% with an associate’s degree, 37.5% with a bachelor’s degree or higher).
However, the vast majority (82.5%) of managers were white. The sample of subordinates was
majority (78.4%) female, diverse in terms of age (mean = 39.0 years, SD = 11.8 years), and
education (20.1% with no college degree, 34.2% with associate degree, 45.7% a bachelor’s
degree or higher) and somewhat diverse in terms of race (72.9% white, 10.6% Hispanic, 5.0%
Asian, 4.5% Black, 7.0% other). Although demographic data for the population of the
organization was not available, comparison of the subordinate sample to census data showed that
this sample was roughly representative in terms of race / ethnicity of the U.S. state in which the
organization operates (U.S. Census Bureau, 2019).
Data Preparation
To conduct the analyses, two datasets were prepared. The first dataset was used to test
hypotheses about the antecedents of inclusive leadership, and the second dataset was used to test
hypotheses about outcomes of inclusive leadership. For both datasets, frontline manager and
subordinate responses were linked by asking subordinates to select the name of their manager
29
from a dropdown list of managers in the organization. After manager and subordinate data were
linked, all personally-identifiable information was replaced with non-identifiable codes to
maintain confidentiality.
Dataset 1
The first dataset was used to analyze the antecedents of inclusive leadership of frontline
managers (hypotheses 1 – 8). It contained all antecedent variables (manager personality,
diversity beliefs, training, mentorship, perception of inclusive climate, perception of senior
inclusive leadership), which were obtained from the frontline managers’ responses to the survey,
and manager inclusive leadership (the outcome variable), which was provided by these
managers’ subordinates. This dataset had 40 observations, since there were 40 managers who
completed the survey and received ratings of their inclusive leadership from at least one
subordinate.
Dataset 2
The second dataset was used to analyze the impact of frontline managers’ inclusive
leadership (hypotheses 9 and 10) on their subordinates’ outcomes. This was a multilevel dataset
– the primary unit of analysis was the subordinate, nested within managers. Variables included
manager inclusive leadership (treated as a predictor in this dataset, as opposed to an outcome as
in Dataset 1), subordinate outcomes (job satisfaction, affective organizational commitment, and
intention to quit) and subordinate gender and race. This dataset had 203 observations, since there
were 203 subordinates who participated in the study. These subordinates were nested in the same
40 frontline managers as in Dataset 1.
30
Measures
This section describes the instruments used in this study. Frontline managers were
administered a version of the survey with items measuring their personality, diversity beliefs,
training, mentorship, perception of inclusive climate, and perception of senior inclusive
leadership. In addition, this survey included questions measuring control variables related to the
managers’ own demographics, leadership experience, job attitudes and team characteristics.
Subordinates were administered an alternate version of the survey with items measuring their
managers’ inclusive leadership and the subordinates’ own job attitudes and demographics.
Appendix D contains the full list of measures and indicates which measures were administered to
managers, subordinates, or both.
Manager Inclusive Leadership
Subordinates assessed the inclusive leadership of their frontline managers using the Inclusive
Leadership Questionnaire (ILQ; Li, 2021). This instrument measures a broad inclusive
leadership construct (α = .97) as well as three sub-factors: treating all work unit members with
fairness, equality, and respect (α = .94); encouraging integration of and synergy among all work
unit members (α = .96); and implementing organizational diversity and inclusion related policies
in the work unit (α = .88). Two items associated with the third subscale were not administered in
this study in order to shorten the overall survey administered to subordinates. Sample items
include, “My manager conducts fair performance reviews of work unit members” (factor 1), “My
manager seeks members’ input when pursuing work unit goals” (factor 2), and “My manager
manages biases toward marginalized group members on the team” (factor 3). The ILQ uses a 5-
point Likert scale with anchors ranging from “Strongly disagree” to “Strongly agree.”
Antecedents of Manager Inclusive Leadership
31
Frontline managers answered survey questions measuring their personality traits, diversity
beliefs, and developmental experiences (related to mentorship and training) hypothesized to
predict inclusive leadership. Items measuring organizational factors (i.e., perceived inclusive
leadership of senior leaders and perceived inclusive climate) referred to the respondents’ own
supervisors and the department in which the frontline managers work.
Personality. Personality was measured using the 44-item Big Five Inventory (BFI; John &
Srivastava, 1999). This assessment is significantly shorter than the 240-item NEO-PI-R and its
variants (Costa & McCrae, 1992), thereby reducing the likelihood of survey fatigue. At the same
time, the BFI maintains good content coverage and favorable psychometric properties.
Reliabilities across dimensions range from .79 to .88. The BFI measures the Big Five personality
traits, but not their sub-facets. Sample items include “[I see myself as someone who] likes to
cooperate with others” (Agreeableness) and “[I see myself as someone who] worries a lot”
(Neuroticism). Although the current research makes explicit hypotheses involving only two
personality dimensions, Agreeableness and Neuroticism, all five personality traits (i.e.,
Agreeableness, Conscientiousness, Extraversion, Neuroticism, and Openness) were measured to
account for unexpected relationships between personality traits and inclusive leadership. The BFI
uses a 5-point Likert scale with anchors ranging from “Strongly disagree” to “Strongly agree.”
Diversity beliefs. Diversity beliefs were measured using the 36-item Benefits and Threats of
Diversity Scale (BTDS) developed by Hofhuis et al. (2015). This instrument measures the
perceived positive and negative effects of diversity using two independent scales. Sample items
from the positive beliefs scale include, “Workplace diversity makes us better at solving complex
problems,” and “Workplace diversity is necessary for recruiting enough new personnel.” Sample
items from the negative beliefs scale include, “Workplace diversity leads to fewer career
32
opportunities for majority members,” and “Workplace diversity leads to uncomfortable
situations.” Reliability data on the overall positive and negative scales are not available since
Hofhuis et al. (2015) only reported reliabilities for more granular subscales. The reliabilities for
these subscales ranged from .77 to .89. The BTDS uses a 5-point Likert scale with anchors
ranging from “Strongly disagree” to “Strongly agree.”
Leader training. This study measured the extent to which frontline managers have received
training relevant to being an inclusive leader. First, respondents answered a preliminary question,
“Within the past year, have you received any type of training or developmental opportunities
while employed at [the organization]?” The survey referred to “training” broadly instead of
“leader training” because leader training programs may or may not market themselves as such to
employees; referring simply to “training” was less likely to cause confusion. If the answer to this
question was “yes,” the respondent then received an additional set of training related questions.
Respondents were provided with a list of 17 training topics that corresponded to
intrapersonal, interpersonal, leadership, business, and inclusion-related skills and were asked to
indicate which (if any) of these topics the training they received at the organization addressed.
Intrapersonal skills included coping with stress, setting goals, and time management.
Interpersonal skills included building relationships, active listening, and communication.
Leadership skills included team-building and influencing others. Business skills included
technical skills, financial skills, decision-making, and strategic thinking (Hogan & Warrenfeltz,
2003; Lacerenza et al., 2017). Inclusion-related skills included conflict resolution, sexual
harassment management, addressing unconscious bias, managing diverse teams, and diversity
and inclusion (Bezrukova et al., 2012; Bezrukova et al., 2016; Kulik & Roberson, 2008). For
each topic the respondent selected, they were asked to indicate, “How well did your training help

33
you learn about this topic?” on a 5-point scale from “Not well at all” to “Extremely well.” This
additional question provided supplemental data on the respondents’ perceived effectiveness of
the training for each of the topics they selected. Inclusive leadership training was operationalized
as the number of interpersonal and inclusion-related training topics respondents indicated they
received out of a total of eight options provided. For example, a respondent who indicated that
they received training in active listening, conflict resolution, and addressing unconscious bias
would receive a score of “3,” since they indicated that they received training on three (out of a
maximum of eight) interpersonal or inclusion-related topics. Respondents who selected none of
the interpersonal or inclusion-related training topics, or who indicated that they had not received
any training at the organization, received a score of zero. An alternative operationalization was
calculated by weighting this count by the perceived effectiveness for each topic, but this yielded
similar results so it was dropped from the analysis.
Mentorship. This study measured how frequently frontline managers’ mentors advised them
on various competencies related to being an inclusive leader. These competencies were the same
topics as those included in the training measure: intrapersonal, interpersonal, leadership,
business, and inclusion-related skills. First, respondents received a preliminary question asking,
“Have you had at least one mentor while working at [the organization]?” If they responded “yes’,
the respondent received the full set of mentorship questions. Respondents were prompted to
think about the mentor that has had the greatest impact on them and then indicate how frequently
that mentor advised them on each competency. Mentorship was operationalized as the frequency
with which respondents reported that their mentor advises them on interpersonal / inclusion-
related topics on a 5-point Likert scale from “Almost never” to “Very frequently.” Responses
were averaged across topics to arrive at a score for mentoring. Respondents who reported not
34
having a mentor received a score of zero, based on the logic that they did not receive any
mentoring on these topics.
Inclusive leadership of senior leaders. Perceived inclusive leadership of frontline
managers’ senior leaders was measured using the same instrument that was used to measure
frontline managers’ inclusive leadership (i.e., ILQ, Li, 2021). However, instead of asking
subordinates to rate the inclusive leadership of their managers, managers were asked to rate
inclusive leadership of their senior leaders.
Perception of inclusive climate. Frontline managers’ perception of inclusive climate was
measured using Nishii’s (2013) 15-item climate for inclusion instrument with subscales
measuring equitable employment practices (α = .93), integration of differences (α = .94), and
inclusion in decision making (α = .97). When responding to these items, managers were asked to
reflect on the climate of their department (e.g., nursing, radiologic technology), rather than the
overall organization, because the majority of employees’ interpersonal interactions in this
organization occur in the department in which they work. As such, managers’ departments were
likely more proximal referents for climate than the overall organization. Sample items include
“This department has a fair promotion process” and “In this department, everyone’s ideas for
how to do things better are given serious consideration.” These items use a 5-point Likert scale
with anchors ranging from “Strongly disagree” to “Strongly agree.”
Manager Control Variables
Manager Demographics. Managers were asked a set of demographic questions related to
their gender, race / ethnicity, age, and education level. Response options for gender and race /
ethnicity were categorical, based on a list of demographic options (e.g., male, female, White or
Caucasian, Black or African American, etc.). For analysis, gender was dummy coded as “0” for
35
male and “1” for female. Race was dummy coded as “0” for white and “1” for person of color.
For age, respondents entered their year of birth, from which age was calculated and treated as a
continuous variable. For educational background, respondents indicated the highest level of
school they completed with options ranging from “Less than a high school diploma” to
“Doctorate (e.g., PhD, EdD).” This was treated as a continuous variable, with the lowest level of
education given a score of “1” and the highest given a score of “8.”
Leadership Experience. Another control variable included leadership experience, which
was controlled due to the possibility that amount of leadership experience may relate to how
leaders interact with their subordinates and therefore affect subordinates’ perceptions of leaders’
inclusive behaviors. Three questions asked about leadership experience. The first two questions
asked how long the respondent had been a leader in the organization and how long they had been
a leader in their team, respectively. Response options ranged from “Less than one year” to “More
than 5 years.” These questions were treated as continuous variables with the least leadership
experience given a score of “1” and the most given a score of “6.” Another question asked how
much experience the respondent had working in diverse teams. Response options ranged from
“Almost no experience” to “A lot of experience.”. This question was also treated as a continuous
variable, with the least experience working in diverse teams given a score of “1” and the most
given a score of “4.”
Team Size. Team size was controlled with a question asking how many employees the
frontline manager oversees, with response options ranging from “1 – 3 employees” to “10 or
more employees.” Team size was controlled because managers with more subordinates may have
fewer opportunities to demonstrate inclusive behaviors with each team member, leading
36
subordinates to perceive the frontline manager as less inclusive. This was treated as a continuous
variable with the smallest team size given a score of “1” and the largest given a score of “5.”
Manager Job Attitudes. Manager job attitudes were statistically controlled because the
theory of planned behavior suggests that employees’ attitudes towards their job and organization
lead them to act in ways that support the organization (Ajzen, 1991; Judge & Kammeyer-
Mueller, 2012; Judge et al., 2021; Lee et al., 2015). One of the ways leaders support the
organization is by creating conditions in which their subordinates can contribute more fully to
the organization. For example, a manager who is very committed to the organization may be
more motivated to listen to viewpoints from all team members so that the organization can
benefit from this synergy of ideas. Therefore, it is possible that leaders with more positive
attitudes about their job and organization will demonstrate more inclusive leadership.
Affective Organizational Commitment. Affective organizational commitment was measured
using the 8-item affective subscale of an organizational commitment instrument (Allen & Meyer,
1990; α = .87). Sample items include, “I would be very happy to spend the rest of my career with
this organization” and “I really feel as if this organization’s problems are my own.” All items
used a 5-point Likert scale with anchors ranging from “Strongly disagree” to “Strongly agree.”
Job Satisfaction. Job satisfaction was measured using a 4-item affective job satisfaction
scale (Thompson & Phua, 2012; α = .85). Sample items include, “I find real enjoyment in my
job” and “Most days I am enthusiastic about my job.” All items used a 5-point Likert scale with
anchors ranging from “Strongly disagree” to “Strongly agree.”
Intention to Quit. Intention to quit was measured using a 2-item turnover intention scale
(Bentein et al., 2005). The first item, “I often think about quitting this organization,” measures
cognition about quitting. The second item, “I intend to search for a position with another
37
employer within the next year,” measures planned behavior. Reliability estimates for this scale
from previous studies are not available. Both items used a 5-point Likert scale with anchors
ranging from “Strongly disagree” to “Strongly agree.” Unlike other scales, higher scores for
intent to quit are less desirable.
Subordinate Outcomes of Frontline Manager Inclusive Leadership
Three measures of subordinate job attitudes were used as outcomes of frontline manager
inclusive leadership: affective organizational commitment, job satisfaction, and intention to quit.
These were measured by administering to subordinates the same job attitude scales that were
administered to managers (described above).
Subordinate Moderator Variables
Subordinate gender and race / ethnicity were used as moderator variables in this study.
Questions measuring subordinate gender and race / ethnicity were the same as the demographic
questions asked of frontline managers described above.
Impact of the COVID-19 pandemic
Both managers and subordinates were asked several questions about how the COVID-19
pandemic had affected their work experience. Questions asked about the extent to which the
pandemic affected various work relationships and experience at work on 5-point Likert scales
with response options ranging from “Extremely negatively” to “Extremely positively.”
Additional questions asked how frequently respondents worked from home before the pandemic
and currently on a 4-point Likert scale ranging from “Never or almost never” to “4-5 days per
week.” Responses to these questions were used for exploratory purposes to better contextualize
the main results.
38
CHAPTER 4: RESULTS
Exploratory Factor Analysis and Reliability Analysis
Exploratory factor analyses (EFA) and reliability analyses were conducted on the inclusive
leadership antecedent measures: personality (Agreeableness, Conscientiousness, Extraversion,
Neuroticism, and Openness), diversity beliefs (both positive and negative scales), inclusive
climate, and senior leader inclusiveness. They were also conducted on the inclusive leadership
measure (overall scale and each of the three subscales) and employee outcome measures:
organizational commitment, job satisfaction, and intention to quit. Research shows that EFA can
be conducted on small samples (n < 50) when there are relatively few factors, factor loadings are
high, and there many items per factor (de Winter et al., 2009). These conditions were met in the
EFAs conducted in this study. Multiple methods were used to determine the number of factors to
extract, including Kaiser’s rule (i.e., retain factors with eigenvalues > 1.0), parallel analysis, and
optimal coordinates analysis. Although Kaiser’s rule is frequently used in organizational
research, the methodology has been critiqued for being arbitrary and often leading to substantial
over-factoring (Fabrigar et al., 1999). Therefore, Kaiser’s rule was supplemented with more
sophisticated techniques developed to overcome this limitation, such as parallel analysis (Horn,
1965) and optimal coordinates analysis (Ruscio & Roche, 2012). Oblique (promax) rotations
were used due to the correlated nature of the factors within a given measure. Finally, Cronbach’s
alpha was computed to determine the internal consistency of the measures. For scales that were
administered to both frontline managers and subordinates (i.e., inclusive leadership, affective
organizational commitment, job satisfaction), internal consistency was computed on the separate
and combined samples. Only the Cronbach’s alphas for the combined sample are reported here
given the similar pattern of findings across the two samples. Analyses assessing the effect of

39
personality, diversity beliefs, training, mentorship, senior inclusive leadership, and perceived
inclusive climate on frontline managers’ inclusive leadership were conducted using Dataset 1 (N
= 40 managers). Analyses assessing the relationship between frontline manager’s inclusive
leadership and their subordinates’ affective organizational commitment, job satisfaction, and
intention to quit were conducted using Dataset 2 (N = 203 subordinates).
Personality
An exploratory factor analysis of the personality items provided support for five factors
based on parallel analysis and optimal coordinates analysis, although Kaiser’s rule indicated as
many as 13 factors. When five factors were extracted, most items (38 out of 44) loaded on the
expected factors. While some personality traits were reliable (Agreeableness α = .70;
Extraversion α = .78; Neuroticism α = .79), others fell below conventional standards for
reliability (Conscientiousness α = .60; Openness α = .65). For Conscientiousness, removing
items with lower EFA loadings did not improve reliability. However, removing three items with
lower EFA loadings did somewhat improve reliability of the Openness measure (α = .74).
Despite this improvement, the full, original scale was retained because it has been validated in
the literature with larger samples (John & Srivastava, 1999). Based on this analysis, five
personality scales were computed using the average of all items from each factor.
Diversity Beliefs
An exploratory factor analysis of the diversity belief items provided support for three factors
based on parallel analysis and optimal coordinates analysis, although Kaiser’s rule indicated up
to eight factors. When two factors where forced, most items (30 out of 36) loaded on the
expected factors (i.e., positive or negative diversity beliefs). Both the positive and negative belief
40
scales were reliable (α = .94; α = .80). Based on this analysis, one positive and one negative
diversity beliefs scale was created by averaging all items from each factor.
Inclusive Climate
An exploratory factor analysis of the inclusive climate measure provided support for a single
factor based on parallel analysis and optimal coordinates analysis, although Kaiser’s rule
indicated up to three factors. When a single factor was extracted, all 15 items loaded highly and
scale reliability was good (α = .93). Therefore, a single scale was computed by averaging all 15
items.
Inclusive Leadership
An exploratory factor analysis of the inclusive climate measure provided support for two
factors based on parallel analysis, optimal coordinates analysis, and Kaiser’s rule. This is
contrary to the three-factor structure suggested by Li (2021). When three factors were forced,
items from hypothesized factor 1 (fairness, equality, and respect) loaded on the expected factor,
while items from factors 2 (integration and synergy) and factor 3 (translating D&I policies)
loaded together. This is likely because two out of the four items associated with factor 3 were not
administered to respondents, so factor 3 did not emerge as a unique construct in this sample.
Despite the suboptimal EFA factor loadings, the reliabilities for overall inclusive leadership (α =
.98) and each of the three factors (α = .95; α = .98; α = .79) were all acceptable. Since the
construct of interest was overall inclusive leadership, a single scale was computed by averaging
all 23 ILQ items administered in the survey. The role of the ILQ subscales were assessed in an
exploratory fashion.
Affective Organizational Commitment
41
An exploratory factor analysis of the affective organizational commitment measure provided
support for a single factor based on parallel analysis, optimal coordinates analysis, and Kaiser’s
rule. When one factor was extracted, all items loaded on that factor. Reliability for the scale was
good (α = .86).
Job Satisfaction
An exploratory factor analysis of the job satisfaction measure provided support for a single
factor based on parallel analysis, optimal coordinates analysis, and Kaiser’s rule. When one
factor was extracted, all items loaded on that factor. Reliability for the scale was good (α = .92).
Intention to Quit
Exploratory factor analysis was not conducted because this analysis is not appropriate for a
2-item scale. Reliability for the scale was good (α = .88). The standardized Cronbach’s α is
reported here because it is a more appropriate reliability measure for two-item scales (Eisinga et
al., 2013).
Aggregation of Frontline Manager Inclusive Leadership
Frontline manager inclusive leadership was measured by asking subordinates to rate their
managers’ inclusive leadership behavior. In cases where multiple subordinates rated a single
manager, those ratings were averaged across subordinates. There was sufficient within-group
interrater agreement (rwg = .87) and between-group variability [ICC(1) = .20, ICC(2) = .54] to
justify aggregating subordinate ratings to the manager level (Bliese, 2000; LeBrenton & Senter,
2008). The ICC(2) value may be lower than the .70 rule-of-thumb because of the small number
of raters for each manager (Woehr et al., 2015). Given that measures of both interrater agreement
(rwg) and interrater reliability (ICC[1]) appear high and achieving a high value for ICC(2) was
not feasible given the small sample, responses were considered acceptable for aggregation.
42
Hypothesis Testing
Antecedents of Inclusive Leadership
To test hypotheses about the antecedents of frontline manager inclusive leadership, Dataset 1
was used. Given the relatively small sample of managers (N = 40) available for analysis, the
proposed antecedents of inclusive leadership (hypotheses 1 – 8) were tested using a convergence
of evidence. Evidence for these hypotheses was based on: 1) bivariate correlations between
proposed antecedents and inclusive leadership, 2) ordinary least squares (OLS) regression, and 3)
Bayesian regression. Bayesian methods are increasingly recommended by methodologists (e.g.,
Kruschke et al., 2012), particularly when analyzing data from small samples (McNeish, 2016).
Bivariate Correlations. Of the proposed antecedents, only Extraversion has a significant
and positive bivariate correlation with inclusive leadership (r = 0.38, p < .05). Conscientiousness
was marginally significant (r = 0.31, p <.10) and all other proposed antecedents were non-
significant. This suggests that some personality traits may be related to inclusive leadership. See
Table 1 for the bivariate correlations.
OLS Regression Analysis. In order to test hypotheses 1 – 8, a two-step linear regression
analysis was conducted in which frontline manager inclusive leadership was regressed on
antecedents (personality, diversity beliefs, training, mentorship, perceived inclusive climate, and
perceived inclusive leadership of senior leaders). In light of the small sample size, several steps
were taken to maximize power and minimize the possibility of over-fitting. To maximize power,
three of the original 11 measured control variables were dropped from the analysis to increase
degrees of freedom. These control variables were dropped because they had a low bivariate
correlation with inclusive leadership (r < .10) or a high correlation and conceptual similarity with
another control variable (and were therefore redundant). The remaining eight control variables

43
(manager gender, race, age, education level, leadership experience in the organization, job
satisfaction, intention to quit, and team size) were retained in the regression analysis. To
minimize the possibility of over-fitting, the adjusted model R-squared values, which apply a
downward adjustment based on sample size and number of parameters in the model (Miles,
2014), are reported. This aids in selecting appropriate models when the sample size is small.
Regression analyses were performed using a series of models designed to determine the
unique variance explained by each proposed antecedent. The outcome variable, inclusive
leadership as measured by the ILQ (based on ratings of managers’ subordinates), was regressed
on predictor variables in a series of models. Model 1 included only control variables. Each of the
following models included the control variables in the first step and an antecedent variable (or
related set of antecedent variables) in a second step. Model 2 added personality traits
hypothesized to relate to inclusive leadership (i.e., Agreeableness and Neuroticism). Model 3
included all of the personality traits in a second step (adding Conscientiousness, Extraversion,
and Openness). Model 4 included positive and negative diversity beliefs in the second step. The
sub-facets of positive and negative diversity beliefs were also tested as a supplemental analysis
with similar results, so only the results for positive and negative facets are reported here. Model
5 included diversity beliefs and personality variables in the second step (i.e., all five personality
traits and positive / negative diversity beliefs). The next set of models explored the role of the
situational antecedents. Model 6 included training experience, Model 7 mentorship, Model 8
perception of inclusive climate, and Model 9 perception of senior inclusive leadership. Model 10
included all situational factors in the second step (i.e., training, mentorship, inclusive climate,
and senior inclusive leadership). Finally, Model 11 included all individual and situational factors
in the second step. The same pattern of results was found when each of the three ILQ subscales
44
was used as the outcome measure in these analyses. As a result, only findings for the overall ILQ
are reported here.
The adjusted R-squared values of each model were compared to that of the control model
(Model 1). Higher adjusted R-squared values (with a significant model comparison F-test)
indicate the model predicts more variance in inclusive leadership than the control model. The
adjusted R-squared value for the control model was .09. Of all models tested, only the model
including all personality traits (Model 3) had a higher adjusted R-squared value (.33) with a
significant model comparison F-test (F = 3.20, p < .05). The models that did not include
personality traits as predictors (i.e., models 4, 6 – 10) had lower adjusted R-squared models than
the control model. Thus, there is evidence that personality relates to inclusive leadership, and
there is little evidence from the current data that the other hypothesized antecedents are related to
inclusive leadership. The coefficients from Model 3 reveal that among the personality traits,
Extraversion was positively and significantly related to inclusive leadership (β = 0.56, p < .05)
and Openness was negatively and significantly related to inclusive leadership (β = -0.89, p <
.01). The relationship between Conscientiousness and inclusive leadership was marginally
significant and positive (β = 0.82, p < .10). In addition, two control variables measuring
managers’ job attitudes, job satisfaction (β = 0.77, p < .05), and intention to quit (β = 0.83, p <
.05), were positively associated with inclusive leadership. See Table 3 for the OLS regression
results.
Supplemental OLS Regression. In light of the findings, additional regression analyses were
conducted to determine whether manager personality or job attitudes were relatively more
predictive of inclusive leadership. First, an incremental regression analysis was conducted
entering the control variables (frontline managers’ gender, race, age, education, leadership
45
experience, and team size) in Model 1, job satisfaction and intention to quit in Model 2, and all
five personality variables in Model 3. In Model 2, job satisfaction and intention to quit were not
significant, but these variables became significant when personality variables were added in
Model 3. Next, another incremental regression analysis was conducted entering the same control
variables in Model 1, but this time the personality variables were entered in Model 2, and the job
satisfaction and intention to quit variables were entered in Model 3. In this analysis, Extraversion
and Openness were significant in both Model 2 and in Model 3 when job satisfaction and
intention to quit were added. Taken together, these analyses indicate that personality is
significantly related to inclusive leadership whether or not job attitudes are statistically
controlled. However, job attitudes are only significantly related to inclusive leadership when
personality variables are statistically controlled. Furthermore, the adjusted R-squared value of
the model including controls and personality (when job attitudes were not controlled) was .21,
while that of the model including controls and job attitudes (when personality was not
controlled) was .09, indicating that personality predicts more variance in inclusive leadership
than job attitudes.
Bayesian Regression Analysis. Bayesian regression analysis was performed primarily to
quantify the evidence for or against the hypotheses. Bayesian regression is better equipped to do
this than OLS regression because instead of determining a point estimate of model parameters, it
generates a probability distribution of model parameters given the observed data (Kruschke,
2018). Bayesian analysis is gaining popularity due to its flexibility, better accuracy with noisy
data and small samples, lower proneness to Type I errors, ability to introduce prior knowledge
into the analysis, and straightforward interpretation of results (Makowski et al., 2019). It is
particularly recommended as method to address the issue of small samples rather than post hoc

46
power analysis, which statisticians argue is logically invalid and misleading methodologically
(Dziak et al., 2020; Zhang et al., 2019).
In this analysis, the Bayes factor (BF) statistic was used to describe support for or against
each of the proposed hypotheses. The Bayes factor is a likelihood ratio of the marginal likelihood
of two competing hypotheses (i.e., the null and alternate hypotheses). A Bayes factor of 1.0
indicates that the null and alternate hypotheses are equally likely given the data. A Bayes factor
below 1.0 indicates that the null hypothesis is more likely than the alternate hypothesis. A Bayes
factor between 1.0 and 3.0 indicates that there is weak evidence for the alternate hypothesis,
while a Bayes factor between 3.0 and 10.0 indicates moderate support and a Bayes factor greater
than 10 indicates strong support (Jeffreys, 1961; Kass & Raftery, 1995; van Doorn et al., 2020).
All 11 models described above for the OLS regression analyses were conducted using
Bayesian regression, and the Bayes factor for each proposed antecedent is reported. Results from
the Bayesian regression analyses largely confirm those of the OLS regression analyses. Among
the proposed antecedents, only Extraversion (BF = 1.18) and Openness (BF = 2.34) have Bayes
factors greater than 1.0. Since these Bayes factors are less than 3.0, they are considered weak
evidence in favor of the alternate hypothesis. This implies that although there is some evidence
linking Extraversion and Openness to inclusive leadership, these findings should be treated as
preliminary until substantiated with more conclusive data. See Table 4 for the Bayesian
regression results.
Summary of Antecedents Results. The analyses described above tested the hypotheses that
various individual and situational factors are related to inclusive leadership. The results indicate
little support for hypotheses 1 – 8. However, there is some evidence that frontline manager’s
level of Extraversion is positively related to their employees’ perceptions of their inclusive
47
leadership, based on a significant bivariate correlation (r = .38, p < .05), significant OLS
regression coefficient (β = 0.56, p <.05) and Bayes factor greater than 1 (BF = 1.18). There is
also evidence of a negative relationship between Openness and inclusive leadership, based on a
significant OLS regression coefficient (β = -0.89, p <.01) and Bayes factor greater than 1 (BF =
2.34).
Outcomes of Inclusive Leadership
Dataset 2 (N = 203 subordinates, nested in 40 managers) was used to test the hypotheses
pertaining to the effect of frontline managers’ inclusive leadership on subordinates’ outcomes.
Specifically, hypothesis 9 suggested that inclusive leadership will be positively associated with
subordinates’ affective organizational commitment, job satisfaction, and intention to quit.
Hypothesis 10 suggested that these relationships would be stronger for subordinates who are
nonwhite and/or women.
Hierarchical linear modeling (HLM) was performed to test these hypotheses due to the
nested nature of the data (i.e., subordinates nested in managers). Level 1 variables included
subordinate outcomes (organizational commitment, job satisfaction, intention to quit) and
subordinate race and gender. Manager inclusive leadership was a Level 2 variable. Five models
were specified for each outcome variable (i.e., subordinate organizational commitment, job
satisfaction, intention to quit). Model 1 was an intercept-only model to determine the percent of
variance in the dependent variables that exists at the manager rather than subordinate level. A
higher percent of variance at the manager level, represented by the intraclass correlation (ICC),
provides support for conducting HLM as opposed to OLS (Woltman et al., 2012). Model 2 added
subordinate gender and race as Level 1 control variables. Model 3 added frontline manager
inclusive leadership as a Level 2 predictor. Next, the interaction effects for race and gender were
48
tested independently in separate models. Model 4 added the cross-level interaction of
subordinate gender and manager inclusive leadership. Model 5 added the cross-level interaction
of subordinate race and manager inclusive leadership. All predictor variables were grand-mean
centered.
Across the three outcomes, there was support for conducting HLM based on the ICC
calculated from the intercept-only model (Model 1). For organizational commitment, job
satisfaction, and intention to quit, the intercept-only model revealed ICC values of .24, .16, and
.20, respectively, indicating that between 16% and 24% of variance in these outcomes is
between-managers. These values are considered modestly high (Bliese, 1998; Walumbwa et al.,
2009), necessitating the use of HLM to reduce the chance of Type I error (Musca et al., 2011).
Model 3 revealed a significant positive relationship between inclusive leadership and
subordinates’ organizational commitment (β = 0.29, p < .001) and a significant negative
relationship between inclusive leadership and subordinates’ intention to quit (β = -0.23, p < .01).
However, the relationship between inclusive leadership and subordinates’ job satisfaction was
not significant (β = 0.11, p > .10). Furthermore, none of the interaction effects between inclusive
leadership and subordinate gender (organizational commitment β = 0.15, p > .05; job satisfaction
β = 0.26, p > .05; intention to quit β = -0.30, p > .05) or race (organizational commitment β =
0.11, p > .05; job satisfaction β = 0.18, p > .05; intention to quit β = -0.03, p > .05) were
significant for any of the three outcomes. See Table 2 for the bivariate correlations between all
variables used in this analysis, and Table 5 for the HLM results.
In sum, results provide support for the relationship between frontline managers’ inclusive
leadership and some of their employees’ outcomes (i.e., affective organizational commitment;

49
intention to turnover). However, there was little support that the effect of inclusive leadership on
subordinate outcomes was moderated by subordinate gender or race.
50
CHAPTER 5: DISCUSSION
The current study explored the antecedents and outcomes of inclusive leadership behavior in
a sample of 40 frontline managers and 203 subordinates in a single organization. The first set of
hypotheses explored relationships between person-related factors of the leaders (their personality
traits and diversity beliefs) and the extent to which they engaged in inclusive leadership. A
second set of hypotheses explored the relationship between situational factors (training and
mentorship experiences, perceptions about the inclusiveness of their work climate, and
perceptions about the inclusiveness of their senior leaders) and the extent to which they engaged
in inclusive leadership. The final set of hypotheses explored the extent to which leaders’
inclusive leadership behavior impacted their subordinates’ job satisfaction, organizational
commitment, and intention to quit. It was also hypothesized that the relationship between
inclusive leadership and subordinate outcomes would be moderated by subordinate gender and
race.
Results revealed modest support for the hypothesized relationships between individual
factors and inclusive leadership and no support for the relationship between situational factors
and inclusive leadership. Additionally, there was evidence that leaders’ inclusive leadership was
related to subordinates’ outcomes (i.e., organizational commitment, intention to quit). However,
there was little evidence that this relationship was moderated by subordinates’ gender or race.
The following sections describe the results in detail and discuss the limitations and the practical
and research implications of the study results.
Antecedents of Inclusive Leadership
Hypothesis 1 suggested there would be a positive relationship between leader Agreeableness
and inclusive leadership. Agreeableness was proposed as a positive antecedent because agreeable
51
individuals are characterized as sensitive, sympathetic, trustworthy, kind, gentle, and warm
(Costa & McCrae, 1992), which may lead them to be more interpersonally oriented.
Furthermore, one component of Agreeableness is “humility,” a construct which Randel and
colleagues (2018) proposed as an antecedent of inclusive leadership. However, results failed to
show evidence of a significant relationship between Agreeableness and inclusive leadership. One
potential explanation is that another component of Agreeableness is “compliance.” Compliant
individuals are meek and mild in the face of conflict (Costa et al., 1991). Researchers have
argued that the ability to manage conflict is an important aspect of inclusive leaders (Randel et
al., 2018), especially because diverse teams are more likely to experience relationship conflict
(Jehn et al., 1999). However, one can argue that compliant leaders are likely to avoid rather than
actively manage conflicts that arise on their teams. Therefore, Agreeable leaders may be
perceived by followers as less inclusive because they are less likely to actively manage conflict
between team members due to their mild and non-confrontational nature. The fact that different
components of Agreeableness may have influenced inclusive leadership in different directions
may account for the lack of effect for this variable.
Hypothesis 2 suggested there would be a negative relationship between leader Neuroticism
and inclusive leadership. Neurotic individuals tend to feel anxious, nervous, sad, tense,
demonstrate poor coping skills, and be “thin-skinned and hostile towards others” (Brown &
Treviño, 2006, p. 603; John et al., 2008). Researchers have noted that leaders high on
Neuroticism lack the self-confidence and stability required to lead their teams and involve
themselves in the efforts of their employees (Bono & Judge, 2004). In contrast, inclusive leaders
create a space where all group members feel they belong, which seems antithetical to the
definition of Neuroticism. However, results failed to show a significant negative relationship

52
between Neuroticism and inclusive leadership. Although it is unclear why this relationship was
non-significant, one explanation may be that the negative effect of Neuroticism on inclusive
leadership is small and could not be detected in this study given the small sample size of
managers (N = 40). Consistent with expectations, the bivariate correlation (r = -.09) and OLS
regression coefficient (-.05) for Neuroticism were negative but non-significant. Therefore,
research employing a larger sample may be better able to detect this negative relationship if it
exists.
While this study did not find support for the two personality traits hypothesized to be related
to inclusive leadership (i.e., Agreeableness and Neuroticism), it did find that Extraversion was
significantly positively related to inclusive leadership, and Openness was significantly negatively
related to inclusive leadership. Although neither of these relationships was expected, they are
consistent with theory and research on personality and leadership. Traits used to describe
extraverts may be consistent with some inclusive leadership behaviors. Core components of
Extraversion include affiliation (having and valuing warm personal relationships), agency (being
socially dominant, assertive, and influential), and positive emotionality (experiencing and
expressing positive emotions; Depue & Collins, 1999; Watson & Clark, 1997). It could be
argued that some of these attributes (e.g., affiliation, positive emotionality) are important for
exhibiting inclusive leadership because they relate to a leader’s ability to build robust
interpersonal relationships among team members. Furthermore, previous research has found a
positive relationship between Extraversion and other leadership styles that have overlapping
characteristics with inclusive leadership. One example is transformational leadership, which
includes the component “individualized consideration,” indicating leaders’ tendency to support,
empower, develop, and build trust among employees (Bono & Judge, 2004; Rafferty & Griffin,

53
2006; Reichard et al., 2011). This component of transformational leadership is consistent with
aspects of the operationalization of inclusive leadership used in the current study. For example,
ILQ items, “My manager seeks members’ input when pursuing team goals” and “My manager
encourages everyone in the team to participate in decision making,” appear conceptually related
to employee empowerment captured in transformational leadership. Similarly, the ILQ items,
“My manager listens to all team members with respect” and “My manager communicates openly
with all team members,” can be linked to building trust, another aspect of transformational
leadership. Therefore, the relationship between Extraversion and inclusive leadership found in
the current study is consistent with the relationship between Extraversion and transformational
leadership found in past research given the points of overlap between the two leadership styles.
The current study finding that Openness was negatively related to inclusive leadership
appears at first to contradict theory that suggests that inclusive leaders are open to new ideas and
display low self-focus, thereby promoting a diversity of ideas in their work units (Carmeli et al.,
2010; Hirak et al., 2012; Mitchell et al., 2015; Randel et al., 2018). This apparent contradiction
may, however, be due to the various ways in which this personality trait has been conceptualized
and operationalized across different literatures. McCrae and Costa (1997) point out that there has
not been widespread agreement on how to label what some refer to as the Openness trait. Others
refer to the same trait as Intellect (Goldberg, 1981; Digman & Inouye, 1986; Donnellan et al.,
2006), Imagination (Saucier, 1994) or Culture (Norman, 1963). A closer examination of the
definition of Openness as it is used in the Five-Factor Model of personality employed in the
current study shows that it is distinct from the concept of openness used by inclusion researchers.
Openness in the Big Five “describes the breadth, depth, originality, and complexity of an
individual’s mental and experiential life” (John et al., 2008, p. 120). Individuals high in

54
Openness tend to be creative, introspective, imaginative, resourceful, and insightful (John &
Srivistava, 1999). Behaviorally, individuals high in Openness are likely to learn something
simply for the joy of learning, watch documentaries or educational TV, come up with novel
setups of their living space, and look for stimulating activities that break up their routine (John et
al., 2008). Overall, Openness is a personality trait that appears to typify artists or intellectuals
(McCrae & Costa, 1997). Notably, Openness in these conceptualizations does not refer to
listening to others’ perspectives or appreciating diversity. In fact, individuals high on Openness
appear to prefer activities that are done on one’s own, which may make them reluctant to involve
others, an essential component of inclusive leadership behavior. As a result, leaders high in
Openness may be less likely to be perceived as inclusive by their subordinates.
Hypothesis 3 suggested that there would be a positive relationship between positive diversity
beliefs and inclusive leadership, and hypothesis 4 suggested that there would be a negative
relationship between negative diversity beliefs and inclusive leadership. Results did not support
either hypothesis. The failure to find support for these relationships may be due to low statistical
power or the possibility that positive diversity beliefs are not a prerequisite for inclusive
leadership. In other words, leaders may engage in inclusive leadership behaviors whether or not
they explicitly believe that diversity offers benefits (e.g., enhances problem-solving, better serves
customers) for their organization. It is possible that leaders who engage in inclusive leadership
behaviors do so because they believe that these behaviors constitute good leadership regardless
of their ideological beliefs about diversity.
Hypothesis 5 suggested that interpersonal and inclusion-related leader training would be
positively associated with inclusive leadership. In other words, leaders who indicated that they
received training in interpersonal and inclusion-related leader competencies were expected to be
55
perceived as more inclusive than leaders who indicated that they received training in fewer of
these competencies. This hypothesis was informed by research showing that training programs
are moderately effective at developing leaders and improving their interpersonal skills (Burke &
Day, 1986; Collins & Holton, 2004; Lacerenza et al., 2017). However, the current research
showed little evidence for a relationship between interpersonal and inclusion-related leader
training and inclusive leadership. Again, one possibility for the lack of result, may simply be a
function of low statistical power. However, it is also possible that the training that managers
received was of poor quality, reducing its positive impact on inclusive leadership. To explore this
possibility, I looked at frontline manager’s responses to the supplemental question about the
perceived effectiveness of the training they received. Leaders indicated generally positive
responses to this question (mean = 4.1, SD = 0.8), suggesting that perceived training
effectiveness is an unlikely explanation for the lack of current study results related to training.
Another more likely explanation is based on Kirkpatrick’s (1959) popular model of evaluating
training effectiveness. According to this model, training outcomes can be categorized into four
criteria: reactions (i.e., learner satisfaction with training), learning (i.e., knowledge gained from
training), transfer (i.e., behavior change due to training), and results (i.e., impact on business
outcomes). It is possible that training received in this organization translated into positive
reactions (leading to high perceptions of training effectiveness among managers in the current
study) but not necessarily learning or actual inclusive behaviors. This would explain the lack of
relationship between training received and inclusive leadership in the current study.
Hypothesis 6 suggested that interpersonal and inclusion-related mentoring would be
positively associated with inclusive leadership. In other words, it was expected that frontline
managers who indicated that their mentors frequently mentored them on interpersonal and
56
inclusion-related topics would be perceived by their subordinates as more inclusive compared to
managers who indicated that they were less frequently mentored on these topics. This hypothesis
was informed by research indicating that leaders with mentors are more likely to exhibit several
positive leadership behaviors (Brown & Treviño, 2014; Dragoni et al., 2014; Ladegard & Gjerde,
2014) and be rated as more effective leaders overall (Lester et al., 2011; Seibert et al., 2017).
However, this study’s results did not support the proposed relationship between frequency of
interpersonal and inclusion-related mentoring and inclusive leadership. In addition to a lack of
power, variability in quality of mentoring relationships may also explain the current lack of
support for this hypothesis. Research finds that mentoring relationships can vary in quality, and
protégés with high-quality mentoring relationships report more positive outcomes than protégés
with moderate- or low-quality mentoring relationships. Mentoring quality rather than its
existence has the greatest impact on subordinate outcomes but was not measured in this research
(Ragins et al., 2000). It is possible that low or variable overall mentorship quality contributed to
the lack of relationship found between mentoring and inclusive leadership in the current study.
Hypothesis 7 suggested that perceived inclusive behavior of senior leaders would be
positively associated with frontline manager inclusive behavior. This hypothesis was based on
theory suggesting that senior leaders can influence the behavior of lower-level leaders (Arthur &
Boyles, 2007; Bass et al., 1987; Yammarino, 1994), creating a cascade effect in the organization.
However, results failed to support this hypothesis. One explanation is suggested by research
indicating that that social distance is an important moderator of the effect of senior leader
behavior on lower-level leader behavior (Cole et al., 2009). Social distance is defined as
“differences in status, rank, authority, social standing and power, which affect the degree of
social intimacy and social contact that develops between followers and their leaders” (Antonakis
57
& Atwater, 2002, p. 682). Research indicates that high social distance can reduce or “neutralize”
the effect of senior leadership behavior on follower leadership behavior because of the reduced
likelihood of followers identifying with and emulating senior leaders (Cole et al., 2009). Such a
phenomenon may have occurred in this study. Anecdotal evidence from employees indicates
that, while frontline managers and subordinates typically have close relationships, there are
fewer interactions between frontline managers and senior leadership. This is driven in part by
rapid organizational growth in recent years, in which the number of frontline managers has
increased while the number of senior leaders has stayed constant, and numerous offices have
opened in geographically dispersed locations. Therefore, it is feasible that high social distance
between frontline managers and senior leaders in this organization may have limited the impact
of senior leader inclusive behavior on frontline manager inclusive leadership.
Hypothesis 8 suggested that perceived organizational inclusive climate would be positively
associated with frontline manager inclusive leadership. This hypothesis was based on research
linking organizational climate, organizational socialization, and leadership behavior (Bauer et al.,
1996; Koene et al., 2002; Van Maanen & Schein, 1979). Managers are more likely to act
inclusively when their organization espouses inclusive values, because this inclusive climate
communicates expectations about the behaviors that are needed for leaders to be successful.
However, results did not show a significant relationship between perceived inclusive climate and
inclusive leadership. One reason for this lack of relationship may be due to the fact that
departmental climates were not clearly differentiated within this organization. Climate items
referred to the frontline managers’ department of which there were approximately 20 in the
organization. Low variation in inclusive climate at the departmental level would limit the impact
of this variable on frontline manager’s inclusive leadership. Given the small number of frontline
58
managers, it was not possible to measure aggregated departmental level climate and explore the
extent to which it differed across departments.
Outcomes of Inclusive Leadership
Hypothesis 9 suggested that inclusive leadership would be positively associated with
subordinate outcomes. The subordinate outcomes analyzed in this study included affective
organizational commitment, job satisfaction, and intention to quit. As hypothesized, findings
revealed manager inclusive leadership to be significantly positively related to subordinates’
affective organizational commitment and negatively related to subordinates’ intention to quit.
This is consistent with previous research indicating that inclusive leadership is related to higher
affective organizational commitment at the individual level (Choi et al., 2015) and lower
turnover at the organizational level (Nishii & Mayer, 2009). It is also consistent with research
showing a link between inclusive leadership and a broader set of individual-level outcomes
(Carmeli et al., 2010; Choi et al., 2017; Nembhard & Ebmondson, 2006; Mitchell et al., 2015).
However, the relationship between manager inclusive leadership and subordinates’ job
satisfaction was not significant. This is contrary to previous research indicating a positive
relationship between inclusive leadership and similar constructs such as work engagement (Choi
et al., 2015). While at first glance the significant finding for affective organizational commitment
but not for job satisfaction may appear inconsistent, affective organizational commitment refers
to the emotional attachment an individual feels towards their organization (Allen & Meyer,
1990). It was measured in this study with items such as, “This organization has a great deal of
personal meaning for me” and “I really feel as if this organization's problems are my own.” In
contrast, job satisfaction is a measure of individuals’ contentedness with their specific job, which
can include evaluations of cognitive factors such as benefits, nature of work, personal growth,

59
and promotion opportunities (Spector, 1997). It was measured in this study with items such as, “I
feel fairly well satisfied in my job” and “I find real enjoyment in my job” (Thompson & Phua,
2012). It is possible that in this organization, inclusive leaders enhance subordinates’ attitudes
towards the organization but not towards their specific jobs. In other words, a subordinate with
an inclusive leader is more likely to respond favorably to affective organizational commitment
items such as, “This organization has a great deal of personal meaning for me” due to the
positive relationships they have built with the leader and others in the organization. In contrast, a
subordinate with an inclusive leader may not be more likely to respond favorably to job
satisfaction items such as, “I feel fairly well satisfied in my job,” because inclusive leaders are
unlikely to be able to impact the cognitive evaluations (e.g., pay, job responsibilities, and content
of the work) that contribute to employees’ job satisfaction. This may explain the limited
evidence for the relationship between inclusive leadership and job satisfaction.
Finally, hypothesis 10 suggested the relationship between frontline manager inclusive
leadership and subordinate outcomes would be moderated by subordinate race and/or gender.
Specifically, the positive effect of inclusive leadership on subordinate outcomes was
hypothesized to be stronger for subordinates who are nonwhite and/or women. This hypothesis
was based on theory suggesting that “perceived low status minorities” (e.g., women and
racioethnic subgroup members) respond differently to situations in which diversity is relevant
due to historical experiences of discrimination (Mamman et al., 2012). These experiences can
lead women and racioethnic minorities to perceive and realize more benefit from policies and
practices that support diversity, compared to majority group members (Randel et al., 2016).
Consistent with this, research has shown that the relationship between diversity climate and
individual organizational commitment is stronger for women and racioethnic minorities relative
60
to men and racioethnic majority members (Gonzalez & DeNisi, 2009; McKay et al., 2007).
However, study results did not support this hypothesis.
Contrary to theory, the results of this study suggest that inclusive leadership has a similarly
positive effect for both men / racioethnic majority members and women / racioethnic minority
members. One explanation may be that inclusive leadership is a “best practice” leadership style
that positively impacts all employees, whether or not they belong to a demographic group with a
history of marginalization. Inclusive leaders fulfill their subordinates’ basic needs for respect
(e.g., “My manager listens to all team members with respect”) and voice (e.g., “My manager
seeks members’ input when pursuing team goals”). These needs may not vary in importance
across employees with different demographic backgrounds. It is also important to note that two
ILQ items were not administered in this study: “My manager implements organizational
diversity and inclusion programs in the work unit” and “My manager implements organizational
diversity and inclusion initiatives in the work unit.” Since these items refer more explicitly to
diversity and inclusion, retaining them in the ILQ would have provided a fairer test of the
expected moderation effect (i.e., a more positive effect of inclusive leadership for women /
racioethnic minorities).
Theoretical Implications
The current research contributes to the literature on inclusive leadership by exploring the
antecedents and outcomes of inclusive leadership. Although previous research (e.g., Randel et
al., 2018) theorized about possible antecedents of inclusive leadership, the current research is one
of the first studies to empirically assess the extent to which various individual and situational
characteristics are related to inclusive leadership. The finding that Extraversion and Openness
were significantly related to inclusive leadership suggests that frontline managers’ personality
61
may play an important role in how and whether they lead inclusively. However, it is unclear
whether specific sub-facets of these personality traits account for the relationship between these
traits and inclusive leadership. Furthermore, the mechanisms (i.e., mediators) by which frontline
managers’ Extraversion and Openness lead their followers to perceive them as more inclusive
have not yet been explored.
Interestingly, current results found that control variables measuring managers’ job attitudes,
job satisfaction and intention to quit, were significantly related to inclusive leadership. It is
possible that certain characteristics of jobs and organizations may have an indirect effect on
inclusive leadership through their effect on job attitudes. For example, job characteristics such as
autonomy and feedback have been shown to be positively related to job satisfaction and
negatively related to turnover intentions (Blau, 1999; Ellickson, 2002; Hackman & Oldham,
1976; Kim & Stoner, 2008; Pettijohn, Pettijohn, Taylor, & Keillor, 2001; Pettijohn, Pettijohn, &
d’Amico, 2001; Spector, 1987). Similarly, research shows that organizational characteristics
such as perceived organizational support are positively related to job satisfaction and affective
organizational commitment and are negatively related to turnover intentions (Allen et al., 2003).
To the extent that job attitudes are at least in part influenced by job and organizational factors,
this suggests that inclusive leadership too is at least indirectly influenced by situational factors
other than those anticipated in this study (i.e., training, mentorship, inclusive climate, inclusive
senior leadership). Future research is necessary to understand which situational variables impact
inclusive leadership through the job attitudes they influence.
Additionally, the current study is one of the only studies to measure inclusive leadership by
aggregating subordinates’ perceptions of their leaders. Though there are some exceptions (e.g.,
Ashikali et al., 2020; Qi & Liu, 2017), most researchers (e.g., Choi et al., 2015) use subordinate-
62
level perceptions as a proxy for inclusive leadership and then relate those perceptions to
subordinate outcomes. This can introduce a form of levels-based misspecification, when an
observed relationship is wrongly attributed to a level other than the one represented (Arthur &
Boyles, 2007; Hitt et al., 2007). The nature of leadership is such that multiple subordinates report
to a leader (i.e., subordinates are nested under leaders), so best methodological practice suggests
that subordinate perceptions of inclusive leadership should be aggregated for use in analyses.
Therefore, this study contributes to the literature by appropriately aggregating perceptions of
inclusive leadership and then performing hierarchical linear modeling (HLM) to analyze its
impact on subordinates’ outcomes.
Practical Implications
Perhaps the clearest takeaway from this research for practitioners is that inclusive leadership
is important to maintain a workforce that is committed to the organization. This commitment
translates into lower intentions to turnover, which helps preserve institutional knowledge and
potentially improve long-term organizational performance. Therefore, organizations should
strive for their managers to enact inclusive behaviors within their teams. Unfortunately, the
current research provides less clarity on how to hire or develop inclusive leaders. Although
certain personality traits (i.e., Extraversion and Openness) were found to be related to inclusive
leadership, these results should be treated as preliminary due to the small sample of managers
employed in this research (N = 40). Additional research with larger samples across multiple
organizations is needed to substantiate these findings before applied in practice. If additional
research supports the relationship between personality and inclusive leadership, organizations
may wish to use personality assessments as part of their selection process. Organizations could
also consider using personality assessments to identify and provide coaching to individuals who
63
are low in traits that are needed for inclusive leadership (e.g., Extraversion). Results also
revealed that managers act more inclusively when they are more satisfied with their jobs. This
suggests that inclusive leadership may be facilitated by focusing on job-related (e.g., autonomy,
feedback) and organization-related (e.g., perceived organizational support) characteristics likely
to impact frontline managers’ own job satisfaction (Blau, 1999; Ellickson, 2002; Hackman &
Oldham, 1976; Kim & Stoner, 2008; Pettijohn et al., 2001a; Pettijohn, et al., 2001b; Spector,
1987).
Limitations and Future Research
There were numerous strengths to this research. First, data were collected from a sample of
employed frontline managers and their subordinates in an organization. This enhances the
external validity of the research due to the increased likelihood that the results can be generalized
to managers and subordinates working in organizations. Second, this research collected and
analyzed data from multiple sources, reducing the likelihood of common-method variance
(Podsakoff et al., 2003). Common method variance refers to “systematic error variance shared
among variables measured with and introduced as a function of the same method and/or source”
(Richardson et al., 2009). Common method variance is problematic because it can produce a
divergence between true and observed relationships (Ostroff et al., 2002). In this research,
manager inclusive leadership data were collected from one source (subordinates) and antecedents
to inclusive leadership from another (managers), thereby reducing the likelihood that results can
be attributed to collecting data from a common source.
Despite the strengths of this research, there are several limitations. First, the sample size of
frontline managers was quite small (N = 40). This may have contributed to the low power of the
study, making it more challenging to find significant effects. Although the effects of
64
Extraversion and Openness were statistically significant (p < .05), Bayesian analysis indicated
that there was only weak evidence for these effects (i.e., Bayes factors for these effects were less
than 3.0). Future research should utilize larger samples of managers to achieve higher statistical
power. Second, the sample was obtained from a single organization, which may limit the
external validity of results due to sampling bias. It is unlikely that frontline managers in the
current study are representative of most frontline managers. Future research on the antecedents
of inclusive leadership should strive to obtain larger and more representative samples of
managers across multiple organizations to increase the generalizability of results.
Another potential limitation relates to the timing of data collection. Surveys were
administered from August to October 2020 at the height of the COVID-19 pandemic. As
discussed earlier, this may have impacted the study sample size. It also may have affected the
relationship between variables in an unpredictable manner. For example, the fact that more
employees were working from home may have reduced the effect of situational factors such as
senior leadership and inclusive climate on frontline inclusive leadership due to reduced social
contact. However, one can only speculate about the extent to which the pandemic had an impact
on results because the data was only collected during the pandemic. Therefore, it is important for
future research to replicate and extend the findings of the current research in more “normal” (i.e.,
non-pandemic) conditions.
Additional limitations stem from the design of the current research. The correlational
research design used in the current study involved measuring inclusive leadership and its
proposed antecedents at the same point in time and then using various statistical techniques (e.g.,
bivariate correlation, OLS regression, Bayesian regression) to determine the relationship between
the variables of interest. A weakness of this approach is that it is limited in its ability to make
65
inferences about causality because it is difficult to determine the direction of the relationships.
This presents a particular problem for testing hypotheses related to the effects of manager
training and mentorship on inclusive leadership, as it is unclear whether training and mentorship
cause leaders to be more inclusive or whether inclusive leaders are more likely to seek out these
developmental opportunities. Future research on the efficacy of leader training and mentorship in
developing inclusive leaders should use randomized controlled trials (RCTs). RCTs can include
conditions in which one group of leaders participates in a developmental program designed
specifically to enhance inclusive leadership and another group of leaders participates in a control
program (e.g., related to technical competencies). This would constitute a more robust test of the
effect of leader development on inclusive leadership, thus enabling organizations to weigh the
benefits and costs of such a program.
Another set of limitations stem from the measures used in the study. In this study the Big
Five Inventory (BFI; John & Srivastava, 1999) was used to measure personality. A major
advantage of this measure was its condensed length (44 items). However, one disadvantage with
the BFI is that it measures the five major personality traits but not their sub-facets. As a result,
the current study could not assess the effects of the personality sub-facets on inclusive
leadership. For example, according to the NEO PI-R (Costa & McCrae, 1992), Extraversion
comprises the sub-facets: Warmth/Kindness, Gregariousness, Assertiveness, Activity Level,
Excitement-Seeking, and Positive Emotion. It is conceivable that some sub-facets (e.g.,
Warmth/Kindness) are more strongly related to inclusive leadership than others (e.g.,
Assertiveness). Similarly, Openness comprises the sub-facets: Fantasy, Aesthetics, Feelings,
Actions, Ideas, and Values. Perhaps particular sub-facets (e.g., Ideas) are negatively associated
with inclusive leadership, but not others (e.g., Values). Future research exploring the relationship
66
between personality and inclusive leadership should use personality measures that capture
personality sub-facets to better understand the nuanced relationships between personality and
inclusive leadership. In particular, researchers should consider measuring personality with the
Hogan Personality Inventory (HPI; Hogan & Hogan, 2002) because it measures personality sub-
facets and is used to provide more behaviorally-based recommendations to employees. This
would enable future findings about the relationship between personality and inclusive leadership
to be more practically meaningful.
This study attempted to assess leader training by asking managers whether they received
training in various topics related to inclusion. This measure was developed for the current
research and as a result, its validity is unclear. Additionally, due to the nature of the scale (i.e., a
count of training topics received), and the cross-sectional nature of the current research, the
psychometric properties and quality of this instrument are relatively unknown and may be a
limitation. The training questions in this study measured whether training occurred and the extent
to which they impacted learner reactions (Kirkpatrick, 1959). However, this study did not
evaluate other criteria of training effectiveness, such as learning (i.e., knowledge gained from
training). Future research should attempt to measure what managers learned as a result of their
training, not just whether the training occurred. For example, researchers could test managers’
knowledge about inclusive behavior before and after participating in an inclusive leadership
training program. This would give researchers a more valid measure of inclusion training
effectiveness and provide a better test of the relationship between training and inclusive
leadership.
This study measured mentoring by asking managers about the frequency with which their
mentor advises them on inclusion-related topics. Similar to the training measure, this instrument

67
has not been previously validated. Notably, this study did not measure the quality of the
relationship between managers and their mentors. Given research suggesting the importance of
the quality of the relationship between mentors and their protégés (e.g., Ragins et al., 2000),
future research should measure the quality of the mentoring relationship, along with the
frequency of mentoring in various topics. This would enable researchers to determine the extent
to which relationship quality plays a role in the association between mentorship and inclusive
leadership.
While the ILQ is an evidence-based and comprehensive measure of inclusive leadership, it is
relatively newly developed and has some limitations. Although this paper and others (e.g., Li,
2021; Randel et al., 2018) argue that inclusive leadership is conceptually distinct from other
leadership styles (e.g., transformational leadership, servant leadership), there is little research
that has demonstrated through discriminant analysis that the ILQ is empirically distinct from
measures of other leadership styles. Since establishing discriminant validity is a critical stage of
the scale validation process (Hinkin, 1998), future research should directly compare the ILQ
against measures of other leadership styles. If research demonstrates that the ILQ is distinct from
other leadership styles, then the lack of moderation effects found in this study may indicate that
inclusive leadership is equally important to all employees regardless of their gender or race.
However if the ILQ is similar to other leadership styles, then this lack of moderation may
indicate that the ILQ has failed to capture dimensions that are important to marginalized
individuals in organizations, suggesting that the measure can be improved in the future.
Finally, there are other potential antecedents of inclusive leadership that remain unexplored
in the current study. One example includes leaders’ prior experience as an outsider or having
lower status than others in groups. Leaders who have previous experience as outsiders may better

68
understand the perspectives and challenges facing minority group members and may therefore
act more inclusively. Although this study measured leader demographics (e.g., gender, race, age)
and experience working in diverse teams, these are crude indicators of individuals’ prior
experiences of being marginalized (i.e., they are proxies for experience with marginalization,
rather than direct measures). Future research should consider asking leaders directly about their
prior experiences with marginalization.
Conclusion
Inclusive leadership has gained popularity among researchers and practitioners in recent
years as organizations acknowledge that both diversity and inclusion are imperative for business
outcomes. Previous research on inclusive leadership has shown that it has a positive relationship
with numerous subordinate outcomes (e.g., Choi et al., 2017; Randel et al., 2018; Mitchell et al.,
2015). Current research sheds light on the antecedents of inclusive leadership, suggesting that
personality traits such as Extraversion may be positively related and Openness may be negatively
related to inclusive leadership. Furthermore, frontline manager job attitudes such as job
satisfaction and intention to quit were related to inclusive leadership, suggesting that inclusive
leadership can be increased by enhancing frontline managers’ own experience at work. Finally,
the current research uses a multilevel design to add evidence that inclusive leadership is
positively related to subordinate affective organizational commitment and negatively related to
their intention to quit. These findings can inform future research by providing preliminary
evidence for several antecedents of inclusive leadership and by adding to the body of research
demonstrating its effects on subordinates’ outcomes.
69
REFERENCES
Allen, T. D., Eby, L. T., & Lentz, E. (2006). Mentorship behaviors and mentorship quality
associated with formal mentoring programs: Closing the gap between research and
practice. Journal of Applied Psychology, 91(3), 567.
Allen, T. D., Eby, L. T., Poteet, M. L., Lentz, E., & Lima, L. (2004). Career benefits associated
with mentoring for protégés: A meta-analysis. Journal of Applied Psychology, 89(1), 127-
136.
Allen, N. J., & Meyer, J. P. (1990). The measurement and antecedents of affective, continuance
and normative commitment to the organization. Journal of Occupational Psychology, 63(1),
1-18.
Allen, D. G., Shore, L. M., & Griffeth, R. W. (2003). The role of perceived organizational
support and supportive human resource practices in the turnover process. Journal of
Management, 29(1), 99-118.
Antonakis, J., & Atwater, L. (2002). Leader distance: A review and a proposed theory. The
Leadership Quarterly, 13(6), 673-704.
Appelbaum, N. P., Dow, A., Mazmanian, P. E., Jundt, D. K., & Appelbaum, E. N. (2016). The
effects of power, leadership and psychological safety on resident event reporting. Medical
Education, 50(3), 343-350.
Arthur, J. B., & Boyles, T. (2007). Validating the human resource system structure: A levels-
based strategic HRM approach. Human Resource Management Review, 17(1), 77-92.
Ashford, S. J., & Tsui, A. S. (1991). Self-regulation for managerial effectiveness: The role of
active feedback seeking. Academy of Management Journal, 34(2), 251-280.
Ashford, S. J. (1986). Feedback-seeking in individual adaptation: A resource perspective.
Academy of Management Journal, 29(3), 465-487.
Ashford, S. J., Blatt, R., & VandeWalle, D. (2003). Reflections on the looking glass: A review of
research on feedback-seeking behavior in organizations. Journal of Management, 29(6), 773-
799.
Ashikali, T., Groeneveld, S., & Kuipers, B. (2020). The role of inclusive leadership in supporting
an inclusive climate in diverse public sector teams. Review of Public Personnel
Administration, 27(1), 1-23.
Avery, D. R., & McKay, P. F. (2010). Doing diversity right: An empirically based approach to
effective diversity management. In G. Hodgkinson & J. K. Ford (Eds.). International review
of industrial and organizational psychology (pp. 227–252). London, UK: Wiley.

70
Bass, B. M. (1990). From transactional to transformational leadership: Learning to share the
vision. Organizational Dynamics, 18(3), 19-31.
Bandura, A., & Walters, R. H. (1977). Social learning theory (Vol. 1). Englewood Cliffs, NJ:
Prentice-Hall.
Bass, B. M., Waldman, D. A., Avolio, B. J., & Bebb, M. (1987). Transformational leadership
and the falling dominoes effect. Group & Organization Studies, 12(1), 73-87.
Bauer, T. N., Morrison, E. W., & Callister, R. R. (1996). Organizational socialization. APA
Handbook of I/O Psychology, 3, 51-64.
Bentein, K., Vandenberghe, C., Vandenberg, R., & Stinglhamber, F. (2005). The role of change
in the relationship between commitment and turnover: A latent growth modeling approach.
Journal of Applied Psychology, 90(3), 468.
Bezrukova, K., Jehn, K. A., & Spell, C. S. (2012). Reviewing diversity training: Where we have
been and where we should go. Academy of Management Learning & Education, 11(2), 207-
227.
Bezrukova, K., Spell, C. S., Perry, J. L., & Jehn, K. A. (2016). A meta-analytical integration of
over 40 years of research on diversity training evaluation. Psychological Bulletin, 142(11),
1227.
Blau, P. (1977). Inequality and heterogeneity. New York: Free Press.
Blau, G. (1999). Testing the longitudinal impact of work variables and performance appraisal
satisfaction on subsequent overall job satisfaction. Human Relations, 52(8), 1099-1113.
Bliese, P. D. (1998). Group size, ICC values, and group-level correlations: A simulation.
Organizational Research Methods, 1(4), 355-373.
Bliese, P. D. (2000). Within-group agreement, non-independence, and reliability: Implications
for data aggregation and analysis. In K. J. Klein & S. W. J. Kozlowski (Eds.), Multilevel
theory, research, and methods in organizations: Foundations, extensions, and new
directions. San Francisco, CA: Jossey-Bass.
Boehm, S. A., & Dwertmann, D. J. (2015). Forging a single-edged sword: Facilitating positive
age and disability diversity effects in the workplace through leadership, positive climates,
and HR practices. Work, Aging and Retirement, 1(1), 41-63.
Boekhorst, J. A. (2015). The role of authentic leadership in fostering workplace inclusion: A
social information processing perspective. Human Resource Management, 54(2), 241-264.
71
Bono, J. E., & Judge, T. A. (2004). Personality and transformational and transactional
leadership: a meta-analysis. Journal of Applied Psychology, 89(5), 901-910.
Brewer, M. B. (1991). The social self: On being the same and different at the same time.
Personality and Social Psychology Bulletin, 17, 475-482.
Brewer, M. B. (2012). Optimal distinctiveness theory: Its history and development. In P. A. M.
Van Lange, A. W. Kruglanski, & E. T. Higgins (Eds.), Handbook of theories of social
psychology (pp. 81–98). Thousand Oaks, CA: Sage Publications.
Brown, M. E., & Treviño, L. K. (2006). Ethical leadership: A review and future directions. The
Leadership Quarterly, 17(6), 595-616.
Brown, M. E., & Treviño, L. K. (2014). Do role models matter? An investigation of role
modeling as an antecedent of perceived ethical leadership. Journal of Business Ethics,
122(4), 587-598.
Burke, M. J., & Day, R. R. (1986). A cumulative study of the effectiveness of managerial
training. Journal of Applied Psychology, 71(2), 232-245.
Burke, M. J., Finkelstein, L. M., & Dusig, M. S. (1999). On average deviation indices for
estimating interrater agreement. Organizational Research Methods, 2(1): 49-68.
Carmeli, A., Reiter-Palmon, R., & Ziv, E. (2010). Inclusive leadership and employee
involvement in creative tasks in the workplace: The mediating role of psychological safety.
Creativity Research Journal, 22(3), 250-260.
Carter, A. B., & Phillips, K. W. (2017). The double-edged sword of diversity: Toward a dual
pathway model. Social and Personality Psychology Compass, 11(5), e12313.
Carver, C. S., & Scheier, M, F. (1981). Attention and self regulation: A control theory to human
behavior. New York: Springer-Verlag.
Center for Workforce Development. (1998). The teaching firm: Where productive work and
learning converge. Newton, MA: Education Development Center.
Chang, E. (2005). Employees’ overall perception of HRM effectiveness. Human Relations,
58(4), 523-544.
Chao, G. T., O'Leary-Kelly, A. M., Wolf, S., Klein, H. J., & Gardner, P. D. (1994).
Organizational socialization: Its content and consequences. Journal of Applied
Psychology, 79(5), 730.
Choi, S. B., Tran, T. B. H., & Kang, S. W. (2017). Inclusive leadership and employee well-
being: The mediating role of person-job fit. Journal of Happiness Studies, 18(6), 1877-1901.

72
Choi, S. B., Tran, T. B. H., & Park, B. I. (2015). Inclusive leadership and work engagement:
Mediating roles of affective organizational commitment and creativity. Social Behavior and
Personality: an international journal, 43(6), 931-943.
Cobb-Clark, D. A., & Schurer, S. (2012). The stability of big-five personality traits. Economics
Letters, 115(1), 11-15.
Colbert, A. E., & Witt, L. A. (2009). The role of goal-focused leadership in enabling the
expression of conscientiousness. Journal of Applied Psychology, 94(3), 790-796.
Cole, M. S., Bruch, H., & Shamir, B. (2009). Social distance as a moderator of the effects of
transformational leadership: Both neutralizer and enhancer. Human Relations, 62(11), 1697-
1733.
Collins, D. B., & Holton III, E. F. (2004). The effectiveness of managerial leadership
development programs: A meta-analysis of studies from 1982 to 2001. Human Resource
Development Quarterly, 15(2), 217-248.
Cooper-Thomas, H. D. & Anderson, N. (2006). Organizational socialization: a new theoretical
model and recommendations for future research in HRM practices in organizations.
Journal of Managerial Psychology, 21(5), 492-516.
Costa, P. T., & McCrae, R. R. (1992). Normal personality assessment in clinical practice: The
NEO Personality Inventory. Psychological Assessment, 4(1), 5-13.
Costa, P. T., McCrae, R. R., & Dye, D. A. (1991). Facet scales for agreeableness and
conscientiousness: A revision of the NEO Personality Inventory. Personality and Individual
Differences, 12(9), 887-898.
Day, D. V. (2000). Leadership development: A review in context. The Leadership Quarterly,
11(4), 581-613.
Day, D. V., & Dragoni, L. (2015). Leadership development: An outcome-oriented review based
on time and levels of analyses. Annual Review of Organizational Psychology and
Organizational Behavior, 2(1), 133-156.
Day, D. V., Fleenor, J. W., Atwater, L. E., Sturm, R. E., & McKee, R. A. (2014). Advances in
leader and leadership development: A review of 25 years of research and theory. The
Leadership Quarterly, 25(1), 63-82.
De Meuse, K. P., & Hostager, T. J. (2001). Developing an instrument for measuring attitudes
toward and perceptions of workplace diversity: An initial report. Human Resource
Development Quarterly, 12(1), 33-51.
73
de Winter, J. C., Dodou, & Wieringa, P. A. (2009). Exploratory factor analysis with small
sample sizes. Multivariate Behavioral Research, 44(2), 147-181.
Deci, E. L., & Ryan, R. M. (2012). Motivation, personality, and development within embedded
social contexts: An overview of self-determination theory. The Oxford Handbook of Human
Motivation, 85-107.
Depue, R. A., & Collins, P. F. (1999). Neurobiology of the structure of personality: Dopamine,
facilitation of incentive motivation, and extraversion. Behavioral & Brain Sciences, 22, 491–
569.
DeRue, D. S., & Wellman, N. (2009). Developing leaders via experience: the role of
developmental challenge, learning orientation, and feedback availability. Journal of Applied
Psychology, 94(4), 859-875.
Digman, J. M., & Inouye, J. (1986). Further specification of the five robust factors of
personality. Journal of Personality and Social Psychology, 50(1), 116.
Donnellan, M. B., Oswald, F. L., Baird, B. M., & Lucas, R. E. (2006). The mini-IPIP scales:
tiny-yet-effective measures of the Big Five factors of personality. Psychological
Assessment, 18(2), 192.
Dragoni, L., Park, H., Soltis, J., & Forte-Trammell, S. (2014). Show and tell: How supervisors
facilitate leader development among transitioning leaders. Journal of Applied Psychology,
99(1), 66-86.
Dwertmann, D. J., Nishii, L. H., & Van Knippenberg, D. (2016). Disentangling the fairness &
discrimination and synergy perspectives on diversity climate: Moving the field forward.
Journal of Management, 42(5), 1136-1168.
Dziak, J. J., Dierker, L. C., & Abar, B. (2020). The interpretation of statistical power after the
data have been gathered. Current Psychology, 39(3), 870-877.
Eagly, A. H. (2016). When passionate advocates meet research on diversity, does the honest
broker stand a chance? Journal of Social Issues, 72(1), 199-222.
Eisinga, R., Grotenhuis, M., & Pelzer, B. (2013). The reliability of a two-item scale: Pearson,
Cronbach, or Spearman-Brown? International Journal of Public Health, 58, 637–642.
Ellickson, M. C., & Logsdon, K. (2002). Determinants of job satisfaction of municipal
government employees. Public Personnel Management, 31(3), 343-358.
Ely, R. J., & Thomas, D. A. (2001). Cultural diversity at work: The effects of diversity
perspectives on work group processes and outcomes. Administrative Science Quarterly,
46(2), 229-273.
74
Ensher, E. A., & Murphy, S. E. (1997). Effects of race, gender, perceived similarity, and contact
on mentor relationships. Journal of Vocational Behavior, 50, 460–481.
Fabrigar, L. R., Wegener, D. T., MacCallum, R. C., & Strahan, E. J. (1999). Evaluating the use
of exploratory factor analysis in psychological research. Psychological Methods, 4(3), 272.
Faul, F., Erdfelder, E., Lang, A.-G., & Buchner, A. (2007). G*Power 3: A flexible statistical
power analysis program for the social, behavioral, and biomedical sciences. Behavior
Research Methods, 39, 175-191.
Fisher, C.D. (1986), “Organizational socialization: an integrative review”, in Roland, K. and
Ferris, G.R. (Eds), Research in Personnel and Human Resources Management (Vol. 4), JAI
Press, Greenwich, CT.
Fleeson, W., & Gallagher, P. (2009). The implications of Big Five standing for the distribution
of trait manifestation in behavior: Fifteen experience-sampling studies and a meta-analysis.
Journal of Personality and Social Psychology, 97(6), 1097-1114.
Goldberg, L. R. (1981). Language and individual differences: The search for universals in
personality lexicons. Review of Personality and Social Psychology, 2(1), 141-165.
Gonzalez, J. A. & DeNisi, A. S. (2009). Cross-level effects of demography and diversity climate
on organizational attachment and firm effectiveness. Journal of Organizational Behavior,
30(1), 21-40.
Greenberg, J. (1993). The social side of fairness: Interpersonal and informational classes of
organizational justice. In Cropanzano R (Ed.), Justice in the workplace: Approaching
fairness in human resource management (pp. 79–103). Hillsdale, NJ: Erlbaum.
Greer, L. L., Homan, A. C., De Hoogh, A. H., & Den Hartog, D. N. (2012). Tainted visions: The
effect of visionary leader behaviors and leader categorization tendencies on the financial
performance of ethnically diverse teams. Journal of Applied Psychology, 97(1), 203-213.
Hackman, J. R., & Oldham, G. R. (1976). Motivation through the design of work: Test of a
theory. Organizational Behavior and Human Performance, 16(2), 250-279.
Heslin, P. A., & Latham, G. P. (2004). The effect of upward feedback on managerial
behavior. Applied Psychology, 53(1), 23-37.
Hewlin, P. F. (2009). Wearing the cloak: antecedents and consequences of creating facades of
conformity. Journal of Applied Psychology, 94(3), 727-741.
Hinkin, T. R. (1998). A brief tutorial on the development of measures for use in survey
questionnaires. Organizational Research Methods, 1(1), 104-121.
75
Hirak, R., Peng, A. C., Carmeli, A., & Schaubroeck, J. M. (2012). Linking leader inclusiveness
to work unit performance: The importance of psychological safety and learning from failures.
The Leadership Quarterly, 23(1), 107-117.
Hitt, M. A., Beamish, P. W., Jackson, S. E., & Mathieu, J. E. (2007). Building theoretical and
empirical bridges across levels: Multilevel research in management. Academy of
Management Journal, 50(6), 1385-1399.
Hofhuis, J., van der Zee, K. I., & Otten, S. (2015). Measuring employee perception on the effects
of cultural diversity at work: Development of the Benefits and Threats of Diversity Scale.
Quality & Quantity, 49(1), 177-201.
Hogan, R., & Hogan, J. (2002). The Hogan Personality Inventory. In B. De Raad & M. Perugini
(Eds.), Big Five assessment (pp. 329–346). Ashland, OH: Hogrefe & Huber.
Hogan, R., & Warrenfeltz, R. (2003). Educating the modern manager. Academy of Management
Learning & Education, 2(1), 74-84.
Homan, A. C., Van Knippenberg, D., Van Kleef, G. A., & De Dreu, C. K. (2007). Bridging
faultlines by valuing diversity: diversity beliefs, information elaboration, and performance in
diverse work groups. Journal of Applied Psychology, 92(5), 1189-1199.
Horn, J. L. (1965). A rationale and test for the number of factors in factor analysis.
Psychometrika, 30(2), 179-185.
Ilies, R., Gerhardt, M. W., & Le, H. (2004). Individual differences in leadership emergence:
Integrating meta‐analytic findings and behavioral genetics estimates. International Journal of
Selection and Assessment, 12(3), 207-219.
James, L. R., Demaree, R. G., & Wolf, G. (1984). Estimating within-group interrater reliability
with and without response bias. Journal of Applied Psychology, 69(1): 85-98.
Javed, B., Khan, A. K., & Quratulain, S. (2018). Inclusive Leadership and Innovative Work
Behavior: Examination of LMX Perspective in Small Capitalized Textile Firms. The
Journal of Psychology, 152(8), 594-612.
Javed, B., Naqvi, S. M. M. R., Khan, A. K., Arjoon, S., & Tayyeb, H. H. (2019). Impact of
inclusive leadership on innovative work behavior: The role of psychological safety. Journal
of Management & Organization, 25(1), 117-136.
Jeffreys, H. (1961). Theory of probability. Oxford, UK: Oxford University Press.
Jehn, K. A., Northcraft, G. B., & Neale, M. A. (1999). Why differences make a difference: A
field study of diversity, conflict and performance in workgroups. Administrative Science
Quarterly, 44(4), 741-763.
76
Jin, M., Lee, J., & Lee, M. (2017). Does leadership matter in diversity management?
Assessing the relative impact of diversity policy and inclusive leadership in the public sector.
Leadership & Organization Development Journal, 38(2), 303-319.
John, O. P., Naumann, L. P., & Soto, C. J. (2008). Paradigm shift to the integrative Big Five trait
taxonomy: History, measurement, and conceptual issues. In O.P. John, R.W. Robins, & L.A.
Pervin (Eds.), Handbook of personality: Theory and research (pp. 114–158). New York:
Guilford.
John, O. P., & Srivastava, S. (1999). The big five trait taxonomy: History, measurement, and
theoretical perspectives. In L. A. Pervin, & O. P. John (Eds.), Handbook of personality:
Theory and research (pp. 102-138). New York: Guilford Press.
Judge, T. A., Bono, J. E., Ilies, R., & Gerhardt, M. W. (2002). Personality and leadership: a
qualitative and quantitative review. Journal of Applied Psychology, 87(4), 765-780.
Judge, T. A., Bono, J. E., & Locke, E. A. (2000). Personality and job satisfaction: The mediating
role of job characteristics. Journal of Applied Psychology, 85(2), 237.
Judge, T. A., & Kammeyer-Mueller, J. D. (2012). Job attitudes. Annual Review of
Psychology, 63, 341-367.
Judge, T. A., Zhang, S. C., & Glerum, D. R. (2021). Job satisfaction. In V.I. Sessa & N.A.
Bowling (Eds.), Essentials of Job Attitudes and Other Workplace Psychological Constructs
(pp. 207-241). Routledge.
Kass, R. E., & Raftery, A. E. (1995). Bayes factors. Journal of the American Statistical
Association, 90, 773–795.
Kearney, E., & Gebert, D. (2009). Managing diversity and enhancing team outcomes: the
promise of transformational leadership. Journal of Applied Psychology, 94(1), 77-89.
Kelloway, E. K., Barling, J., & Helleur, J. (2000). Enhancing transformational leadership: The
roles of training and feedback. Leadership & Organization Development Journal, 21(3),
145-149.
Kim, H., & Stoner, M. (2008). Burnout and turnover intention among social workers: Effects of
role stress, job autonomy and social support. Administration in Social Work, 32(3), 5-25.
Kirkpatrick, D. (1959). Techniques for evaluating training programs. Journal of the American
Society for Training and Development, 13, 3-9.
Kluger, A. N., & DeNisi, A. (1996). The effects of feedback interventions on performance: A
historical review, a meta-analysis, and a preliminary feedback intervention theory.
Psychological Bulletin, 119(2), 254.

77
Koene, B. A., Vogelaar, A. L., & Soeters, J. L. (2002). Leadership effects on organizational
climate and financial performance: Local leadership effect in chain organizations. The
Leadership Quarterly, 13(3), 193-215.
Kram, K. E. (1985). Mentoring at work: Developmental relationships in organizational life.
Glenview, IL: Scott Foresman.
Kruschke, J. K. (2018). Rejecting or accepting parameter values in Bayesian estimation.
Advances in Methods and Practices in Psychological Science, 1(2), 270-280.
Kruschke, J. K., Aguinis, H., & Joo, H. (2012). The time has come: Bayesian methods for data
analysis in the organizational sciences. Organizational Research Methods, 15(4), 722-752.
Kulik, C. T. (2014). Working below and above the line: the research–practice gap in diversity
management. Human Resource Management Journal, 24(2), 129-144.
Kulik, C. T., & Roberson, L. (2008). Diversity initiative effectiveness: What organizations can
(and cannot) expect from diversity recruitment, diversity training, and formal mentoring
programs. In A. P. Brief (Ed.), Diversity at work (pp. 265–317). Cambridge: Cambridge
University Press.
Lacerenza, C. N., Reyes, D. L., Marlow, S. L., Joseph, D. L., & Salas, E. (2017). Leadership
training design, delivery, and implementation: A meta-analysis. Journal of Applied
Psychology, 102(12), 1686-1718.
Ladegard, G., & Gjerde, S. (2014). Leadership coaching, leader role-efficacy, and trust in
subordinates. A mixed methods study assessing leadership coaching as a leadership
development tool. The Leadership Quarterly, 25(4), 631-646.
LeBrenton, J. M., & Senter, J. L. (2008). Answers to twenty questions about interrater reliability
and interrater agreement. Organizational Research Methods, 11(4): 815–852.
Lee, E. S., Park, T. Y., & Koo, B. (2015). Identifying organizational identification as a basis for
attitudes and behaviors: A meta-analytic review. Psychological Bulletin, 141(5), 1049–1080.
Lester, P. B., Hannah, S. T., Harms, P. D., Vogelgesang, G. R., & Avolio, B. J. (2011).
Mentoring impact on leader efficacy development: A field experiment. Academy of
Management Learning & Education, 10(3), 409-429.
Li, H., & Hang, Y. (2017, December). A Study of the Influence of Inclusive Leadership on
Employee Voice Behaviors: the Mediating Effect of LMX. In 2017 2nd International
Conference on Education, Management Science and Economics (ICEMSE 2017). Atlantis
Press.
78
Li, W. D., Arvey, R. D., Zhang, Z., & Song, Z. (2012). Do leadership role occupancy and
transformational leadership share the same genetic and environmental influences?. The
Leadership Quarterly, 23(2), 233-243.
Li, A., & Perry, E. (2020, April). The inclusive leadership questionnaire – Development of a
theory-based measure. Society for Industrial and Organizational Psychology Annual
Conference, Austin, TX.
Liden, R. C., Erdogan, B., Wayne, S. J., & Sparrowe, R. T. (2006). Leader-member exchange,
differentiation, and task interdependence: implications for individual and group performance.
Journal of Organizational Behavior: The International Journal of Industrial, Occupational
and Organizational Psychology and Behavior, 27(6), 723-746.
Liden, R. C., Wayne, S. J., Zhao, H., & Henderson, D. (2008). Servant leadership: Development
of a multidimensional measure and multi-level assessment. The Leadership Quarterly, 19(2),
161-177.
Lin, C. P., Tsai, Y. H., & Liu, M. L. (2016). Something good and something bad in R&D teams:
Effects of social identification and dysfunctional behavior. Technological Forecasting and
Social Change, 104, 191-199.
Lind, E. A., & Tyler, T. R. (1988). The social psychology of procedural justice. New York:
Plenum.
Liu, J., Wang, H., Hui, C., & Lee, C. (2012). Psychological ownership: How having control
matters. Journal of Management Studies, 49(5), 869-895.
Locke, E. A., & Latham, G. P. (1990). A theory of goal setting & task performance. Prentice-
Hall, Inc.
Makowski, D., Ben-Shachar, M. S., Chen, S. H., & Lüdecke, D. (2019). Indices of effect
existence and significance in the Bayesian framework. Frontiers in Psychology, 10, 2767.
Mamman, A., Kamoche, K., & Bakuwa, R. (2012). Diversity, organizational commitment, and
organizational citizenship behavior: an organizing framework. Human Resource
Management Review, 22(4), 285-302.
Mayer, D., Nishii, L., Schneider, B., & Goldstein, H. (2007). The precursors and products of
justice climates: Group leader antecedents and employee attitudinal consequences. Personnel
Psychology, 60(4), 929-963.
McCrae, R. R., & Costa, P. T. (1997). Conceptions and correlates of Openness to Experience.
In R. Hogan, J. A. Johnson, & S. R. Briggs (Eds.), Handbook of personality psychology (pp.
269–290). Academic Press.
79
McKay, P. F., Avery, D. R., & Morris, M. A. (2008). Mean racial-ethnic differences in employee
sales performance: The moderating role of diversity climate. Personnel Psychology, 61(2),
349-374.
McKay, P. F., Avery, D. R., Tonidandel, S., Morris, M. A., Hernandez, M., & Hebl, M. R.
(2007). Racial differences in employee retention: are diversity climate perceptions the key?
Personnel Psychology, 60(1), pp. 35-62.
McNeish, D. (2016). On using Bayesian methods to address small sample problems. Structural
Equation Modeling: A Multidisciplinary Journal, 23(5), 750-773.
Miles, J. (2014). R squared, adjusted R squared. Wiley StatsRef: Statistics Reference Online.
Mitchell, R., Boyle, B., Parker, V., Giles, M., Chiang, V., & Joyce, P. (2015). Managing
inclusiveness and diversity in teams: How leader inclusiveness affects performance through
status and team identity. Human Resource Management, 54(2), 217-239.
Mor Barak, M. E., Lizano, E. L., Kim, A., Duan, L., Rhee, M. K., Hsiao, H. Y., & Brimhall, K.
C. (2016). The promise of diversity management for climate of inclusion: A state-of-the-art
review and meta-analysis. Human Service Organizations: Management, Leadership &
Governance, 40(4), 305-333.
Mulder, R. H., & Ellinger, A. D. (2013). Perceptions of quality of feedback in organizations:
Characteristics, determinants, outcomes of feedback, and possibilities for improvement:
Introduction to a special issue. European Journal of Training and Development, 37(1), 4-23.
Musca, S. C., Kamiejski, R., Nugier, A., Méot, A., Er-Rafiy, A., & Brauer, M. (2011). Data with
hierarchical structure: impact of intraclass correlation and sample size on type-I error.
Frontiers in Psychology, 2.
Nakui, T., Paulus, P. B., & Van der Zee, K. I. (2011). The role of attitudes in reactions toward
diversity in workgroups. Journal of Applied Social Psychology, 41(10), 2327-2351.
Nembhard, I. M., & Edmondson, A. C. (2006). Making it safe: The effects of leader
inclusiveness and professional status on psychological safety and improvement efforts in
health care teams. Journal of Organizational Behavior: The International Journal of
Industrial, Occupational and Organizational Psychology and Behavior, 27(7), 941-966.
Neuman, G. A., Edwards, J. E., & Raju, N. S. (1989). Organizational development interventions:
A meta‐analysis of their effects on satisfaction and other attitudes. Personnel Psychology,
42(3), 461-489.
Nishii, L. H. (2013). The benefits of climate for inclusion for gender-diverse groups. Academy of
Management Journal, 56(6), 1754-1774.
80
Nishii, L. H., & Mayer, D. M. (2009). Do inclusive leaders help to reduce turnover in diverse
groups? The moderating role of leader–member exchange in the diversity to turnover
relationship. Journal of Applied Psychology, 94(6), 1412-1426.
Norbash, A., & Kadom, N. (2020). The Business Case for Diversity and Inclusion. Journal of the
American College of Radiology.
Norman, W. T. (1963). Toward an adequate taxonomy of personality attributes: Replicated factor
structure in peer nomination personality ratings. The Journal of Abnormal and Social
Psychology, 66(6), 574.
Oc, B., Bashshur, M. R., & Moore, C. (2015). Speaking truth to power: The effect of candid
feedback on how individuals with power allocate resources. Journal of Applied Psychology,
100(2), 450-463.
Ostroff, C., Kinicki, A. J., & Clark, M. A. (2002). Substantive and operational issues of response
bias across levels of analysis: An example of climate-satisfaction relationships. Journal of
Applied Psychology, 87, 355-368.
Parry, K. W., & Sinha, P. N. (2005). Researching the trainability of transformational
organizational leadership. Human Resource Development International, 8(2), 165-183.
Perry, E. L., Block, C. J., & Noumair, D. A. (2020). Leading in: inclusive leadership, inclusive
climates and sexual harassment. Equality, Diversity and Inclusion: An International Journal.
Perry, E. L., & Li, A. (2019b, August). Leadership for inclusion “above” and “below” the line. In
K. P. Weeks, I. Metz, & S. Perrera (Chairs), Crossing the Line: Examining "Above" and
"Below" the Line Diversity Activities in Organizations, Academy of Management Annual
Conference, Boston, MA.
Pettijohn, C., Pettijohn, L. S., Taylor, A. J., & Keillor, B. D. (2001). Are Performance Appraisals
a Bureaucratic Exercise or Can they be Used to Enhance Sales-Force Satisfaction and
Commitment? Psychology and Marketing, 18, 337–64.
Pettijohn, C.E., Pettijohn, L.S., & d’Amico, M. (2001). Characteristics of Performance
Appraisals and their Impact on Sales Force Satisfaction. Human Resource Development
Quarterly, 12, 127–46.
Pless, N., & Maak, T. (2004). Building an inclusive diversity culture: Principles, processes and
practice. Journal of Business Ethics, 54(2), 129-147.
Qi, L., & Liu, B. (2017). Effects of inclusive leadership on employee voice behavior and team
performance: the mediating role of caring ethical climate. Frontiers in Communication, 2.
Qi, L., Liu, B., Wei, X., & Hu, Y. (2019). Impact of inclusive leadership on employee innovative
behavior: Perceived organizational support as a mediator. PloS ONE, 14(2).
81
Rafferty, A. E., & Griffin, M. A. (2006). Refining individualized consideration: Distinguishing
developmental leadership and supportive leadership. Journal of Occupational and
Organizational Psychology, 79(1), 37-61.
Randel, A. E., Galvin, B. M., Shore, L. M., Ehrhart, K. H., Chung, B. G., Dean, M. A., &
Kedharnath, U. (2018). Inclusive leadership: Realizing positive outcomes through
belongingness and being valued for uniqueness. Human Resource Management Review,
28(2), 190-203.
Randel, A. E., Dean, M. A., Ehrhart, K. H., Chung, B., & Shore, L. (2016). Leader inclusiveness,
psychological diversity climate, and helping behaviors. Journal of Managerial Psychology,
31(1), 216-234.
Ragins, B. R., Cotton, J. L., & Miller, J. S. (2000). Marginal mentoring: The effects of type of
mentor, quality of relationship, and program design on work and career attitudes. Academy of
Management Journal, 43(6), 1177-1194.
Reichard, R. J., Riggio, R. E., Guerin, D. W., Oliver, P. H., Gottfried, A. W., & Gottfried, A. E.
(2011). A longitudinal analysis of relationships between adolescent personality and
intelligence with adult leader emergence and transformational leadership. The Leadership
Quarterly, 22(3), 471-481.
Richardson, H. A., Simmering, M. J., & Sturman, M. C. (2009). A Tale of Three Perspectives.
Organizational Research Methods, 12(4), 762–800.
Roberson, Q. M. (2006). Disentangling the meanings of diversity and inclusion in organizations.
Group & Organization Management, 31(2), 212-236.
Roberson Q. M, & Colquitt J. A. (2005). Shared and configural justice: A social network model
of justice in teams. Academy of Management Review, 30, 595–607.
Ruscio, J., & Roche, B. (2012). Determining the number of factors to retain in an exploratory
factor analysis using comparison data of known factorial structure. Psychological
Assessment, 24(2), 282.
Saucier, G. (1994). Mini-Markers: A Brief Version of Goldberg’s Unipolar Big-Five Markers.
Journal of Personality Assessment, 63(3), 506–516.
Schölmerich, F., Schermuly, C. C., & Deller, J. (2016). How leaders’ diversity beliefs alter the
impact of faultlines on team functioning. Small Group Research, 47(2), 177-206.
Seibert, S. E., Sargent, L. D., Kraimer, M. L., & Kiazad, K. (2017). Linking developmental
experiences to leader effectiveness and promotability: The mediating role of leadership
self-efficacy and mentor network. Personnel Psychology, 70(2), 357-397.
82
Seifert, C. F., & Yukl, G. (2010). Effects of repeated multi-source feedback on the influence
behavior and effectiveness of managers: A field experiment. The Leadership Quarterly,
21(5), 856-866.
Shore, L. M., Randel, A. E., Chung, B. G., Dean, M. A., Holcombe Ehrhart, K., & Singh, G.
(2011). Inclusion and diversity in work groups: A review and model for future research.
Journal of Management, 37(4), 1262-1289.
Shore, L. M., Cleveland, J. N., & Sanchez, D. (2018). Inclusive workplaces: A review and
model. Human Resource Management Review, 28(2), 176-189.
Spector, P. E. (1986). Perceived control by employees: A meta-analysis of studies concerning
autonomy and participation at work. Human Relations, 39(11), 1005-1016.
Spector, P.E. (1997). Job satisfaction: Application, assessment, causes and consequences.
Thousand Oaks, CA: SAGE.
Srivastava, A., Bartol, K. M., & Locke, E. A. (2006). Empowering leadership in management
teams: Effects on knowledge sharing, efficacy, and performance. Academy of
Management Journal, 49(6), 1239-1251.
Staw, B. M., & Ross, J. (1985). Stability in the midst of change: A dispositional approach to job
attitudes. Journal of Applied Psychology, 70(3), 469-480.
Steelman, L. A., Levy, P. E., & Snell, A. F. (2004). The feedback environment scale: Construct
definition, measurement, and validation. Educational and Psychological Measurement,
64(1), 165-184.
Strang, S. E., & Kuhnert, K. W. (2009). Personality and leadership developmental levels as
predictors of leader performance. The Leadership Quarterly, 20(3), 421-433.
Subramony, M., Segers, J., Chadwick, C., & Shyamsunder, A. (2018). Leadership development
practice bundles and organizational performance: The mediating role of human capital and
social capital. Journal of Business Research, 83, 120-129.
Tannenbaum, S. I. (1997). Enhancing continuous learning: Diagnostic findings from multiple
companies. Human Resource Management, 36, 437–452.
Tepper, B. J., Brown, S. J., & Hunt, M. D. (1993). Strength of subordinates’ upward influence
tactics and gender congruency effects. Journal of Applied Social Psychology, 23(22), 1903-
1919.
Thach, E. C. (2002). The impact of executive coaching and 360 feedback on leadership
effectiveness. Leadership & Organization Development Journal, 23(4), 205-214.
83
Thompson, E. R., & Phua, F. T. (2012). A brief index of affective job satisfaction. Group &
Organization Management, 37(3), 275-307.
Toossi, M. (2015). Labor force projections to 2024: The labor force is growing, but slowly.
Monthly Labor Review, 138, 1.
Tuncdogan, A., Acar, O. A., & Stam, D. (2017). Individual differences as antecedents of leader
behavior: Towards an understanding of multi-level outcomes. The Leadership Quarterly,
28(1), 40-64.
Turner, J. C., Hogg, M. A., Oakes, P. J., Reicher, S. D., & Wetherell, M. S. (1987).
Rediscovering the social group: A self-categorization theory. Cambridge: Basil Blackwell,
Inc.
U.S. Census Bureau (2019). QuickFacts New York. Retrieved from
https://www.census.gov/quickfacts/NY.
van Dierendonck, D., Haynes, C., Borrill, C., & Stride, C. (2007). Effects of upward feedback on
leadership behaviour toward subordinates. Journal of Management Development, 26(3), 228-
238.
van Doorn, J., van den Bergh, D., Böhm, U., Dablander, F., Derks, K., Draws, T., ... &
Wagenmakers, E. J. (2020). The JASP guidelines for conducting and reporting a Bayesian
analysis. Psychonomic Bulletin & Review, 1-14.
Van Dyne, L., & Pierce, J. L. (2004). Psychological ownership and feelings of possession: Three
field studies predicting employee attitudes and organizational citizenship behavior. Journal
of Organizational Behavior: The International Journal of Industrial, Occupational and
Organizational Psychology and Behavior, 25(4), 439-459.
van Knippenberg, D., De Dreu, C. K., & Homan, A. C. (2004). Work group diversity and group
performance: an integrative model and research agenda. Journal of Applied Psychology,
89(6), 1008.
van Knippenberg, D., & Haslam, S. A. (2003). Realizing the diversity dividend: Exploring the
subtle interplay between identity, ideology, and reality. In S. A. Haslam, D. van
Knippenberg, M. J. Platow, & N. Ellemers (Eds.), Social Identity at work: Developing
theory for organizational practice (pp. 61–77). New York: Psychology Press.
van Knippenberg, D., Haslam, S. A., & Platow, M. J. (2007). Unity through diversity: Value-in-
diversity beliefs, work group diversity, and group identification. Group Dynamics: Theory,
Research, and Practice, 11(3), 207-222.
van Knippenberg, D., & Schippers, M. C. (2007). Work group diversity. Annual Review of
Psychology, 58, 515-541.
84
Van Maanen, J., & Schein, E. H. (1979). Toward a theory of organizational socialization. In B.
M. Staw (Ed.), Research in organizational behavior (vol. 1). Greenwich, CT: JAI Press.
Walumbwa, F. O., Avolio, B. J., Gardner, W. L., Wernsing, T. S., & Peterson, S. J. (2008).
Authentic leadership: Development and validation of a theory-based measure. Journal of
Management, 34(1), 89-126.
Walumbwa, F. O., Cropanzano, R., & Hartnell, C. A. (2009). Organizational justice, voluntary
learning behavior, and job performance: A test of the mediating effects of identification and
leader-member exchange. Journal of Organizational Behavior, 30(8), 1103-1126.
Washington, R. R., Sutton, C. D., & Feild, H. S. (2006). Individual differences in servant
leadership: The roles of values and personality. Leadership & Organization Development
Journal, 27(8), 700-716.
Watson, D., & Clark, L. A. (1997). Extraversion and its positive emotional core. In R. Hogan, J.
A. Johnson, & S. R. Briggs (Eds.), Handbook of Personality Psychology (pp. 767–793).
Academic Press.
Weber, T. J., Sadri, G., & Gentry, W. A. (2018). Examining diversity beliefs and leader
performance across cultures. Cross Cultural & Strategic Management, 25(3), 382-400.
Weiss, M., Kolbe, M., Grote, G., Spahn, D. R., & Grande, B. (2018). We can do it! Inclusive
leader language promotes voice behavior in multi-professional teams. The Leadership
Quarterly, 29(3), 389-402.
Woltman, H., Feldstain, A., MacKay, J. C., & Rocchi, M. (2012). An introduction to hierarchical
linear modeling. Tutorials in Quantitative Methods for Psychology, 8(1), 52-69.
Xiang, H., Yun, C., & Fuqiang, Z. (2017, July). Inclusive Leadership, Perceived Organizational
Support, and Work Engagement: The Moderating Role of Leadership-Member Exchange
Relationship. In 2017 7th International Conference on Social Network, Communication and
Education (SNCE 2017). Atlantis Press. 82, 239-243.
Xiang, H., Chen, Y., & Zhao, F. (2017). Inclusive Leadership, Psychological Capital, and
Employee Innovation Performance: The Moderating Role of Leader-Member Exchange.
DEStech Transactions on Social Science, Education and Human Science.
Yammarino, F. J. (1994). Indirect leadership: Transformational leadership at a distance. In B. M.
Bass & B. J. Avolio (Eds.), Improving organizational effectiveness through transformational
leadership (pp. 26-47). Thousand Oaks, GA: Sage.
Zaccaro, S. J., Green, J. P., Dubrow, S., & Kolze, M. (2018). Leader individual differences,
situational parameters, and leadership outcomes: A comprehensive review and integration.
The Leadership Quarterly, 29(1), 2-43.

85
Zhang, Y., Hedo, R., Rivera, A., Rull, R., Richardson, S., & Tu, X. M. (2019). Post hoc power
analysis: is it an informative and meaningful analysis? General Psychiatry, 32(4).
Zheng, X., Yang, X., Diaz, I., & Yu, M. (2018). Is too much inclusive leadership a good thing?
An examination of curvilinear relationship between inclusive leadership and employees’ task
performance. International Journal of Manpower, 39(7), 882-895.
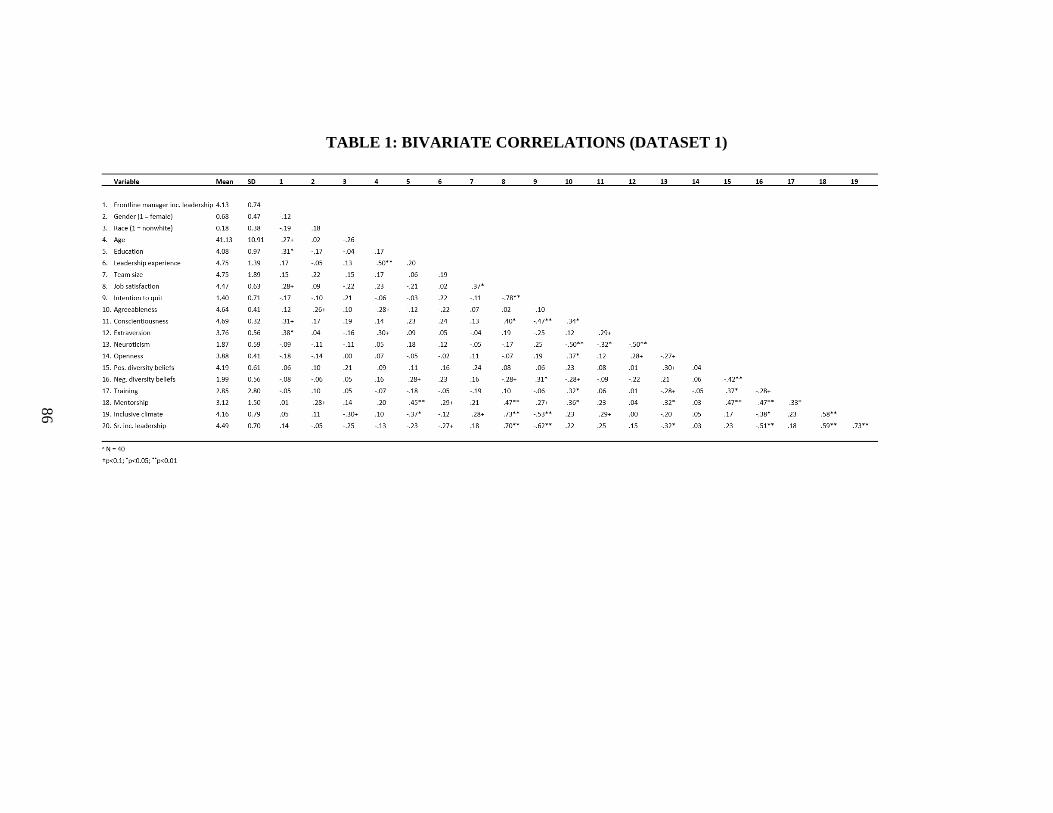
86
TABLE 1: BIVARIATE CORRELATIONS (DATASET 1)
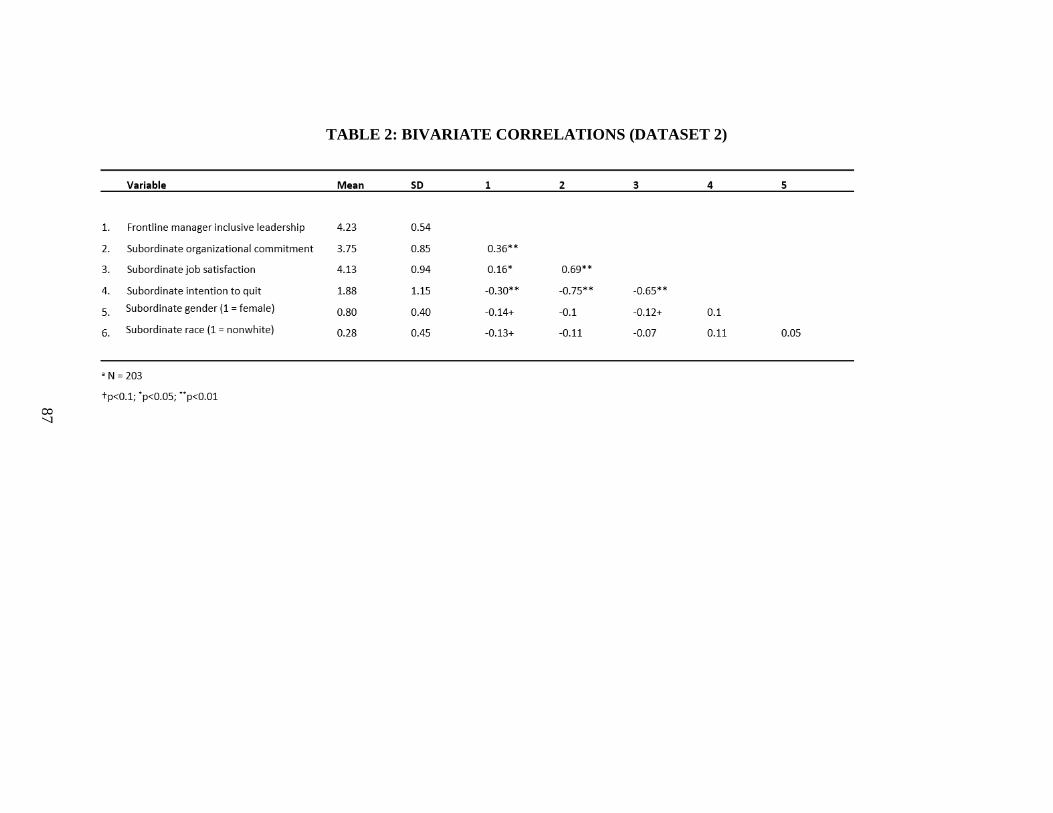
87
TABLE 2: BIVARIATE CORRELATIONS (DATASET 2)
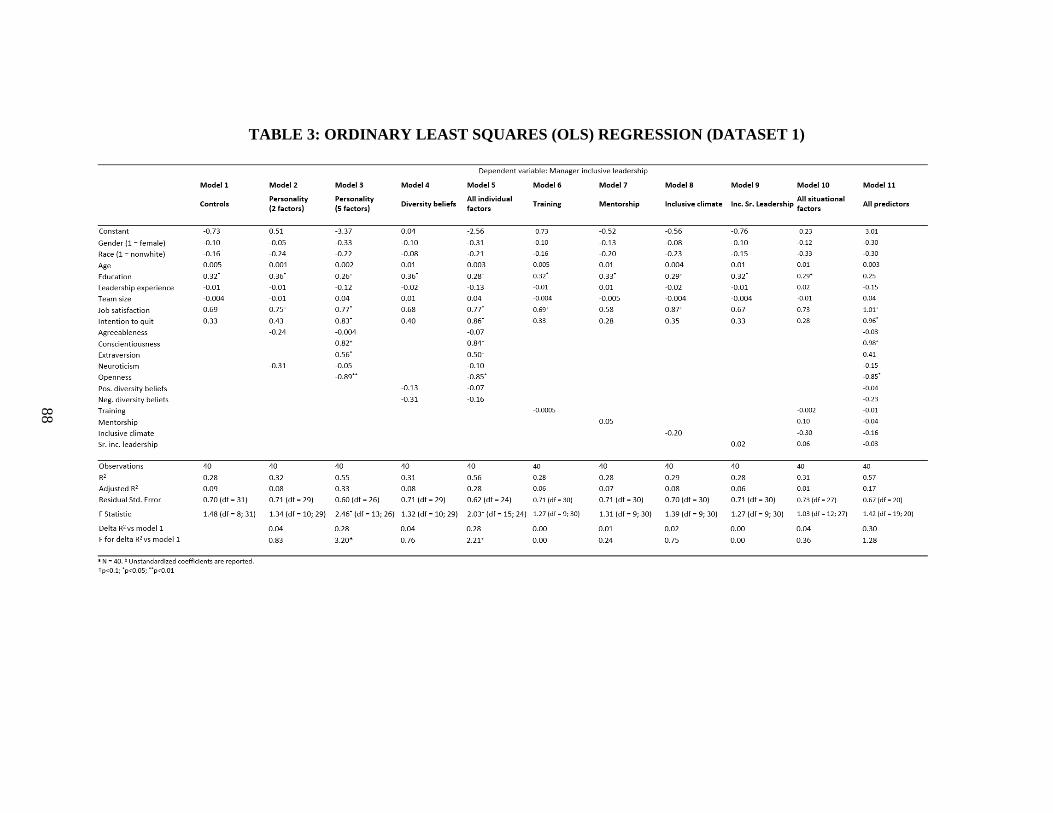
88
TABLE 3: ORDINARY LEAST SQUARES (OLS) REGRESSION (DATASET 1)
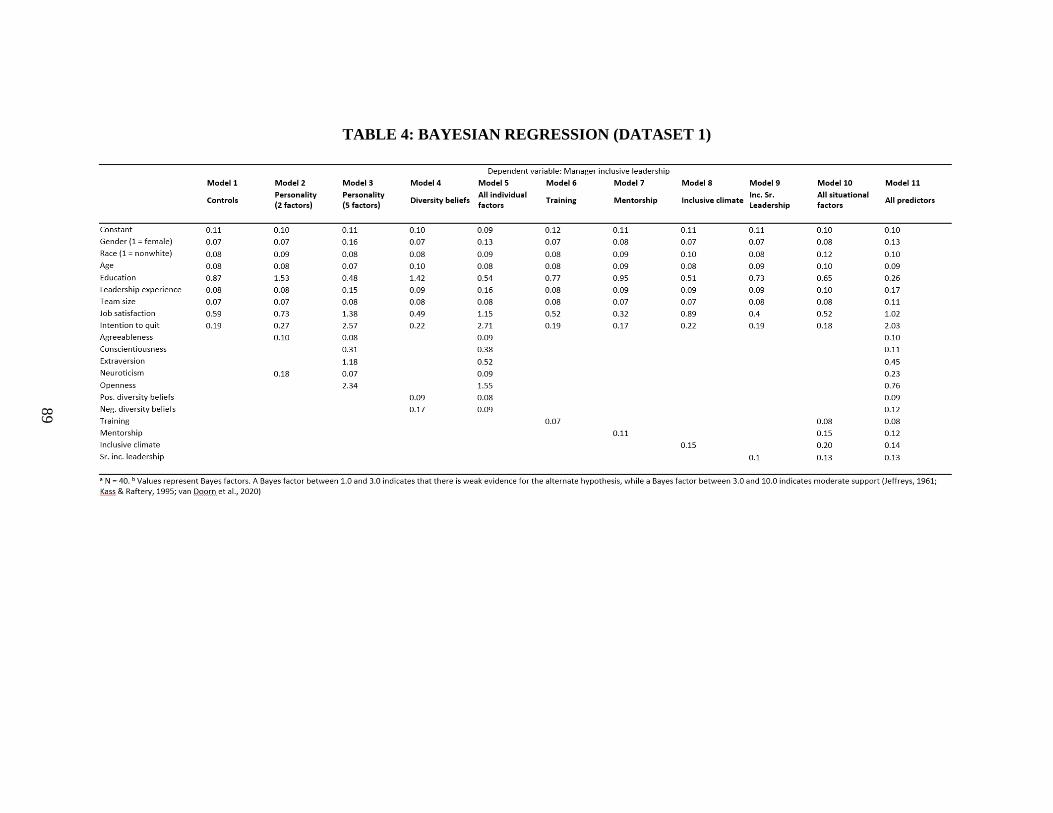
89
TABLE 4: BAYESIAN REGRESSION (DATASET 1)
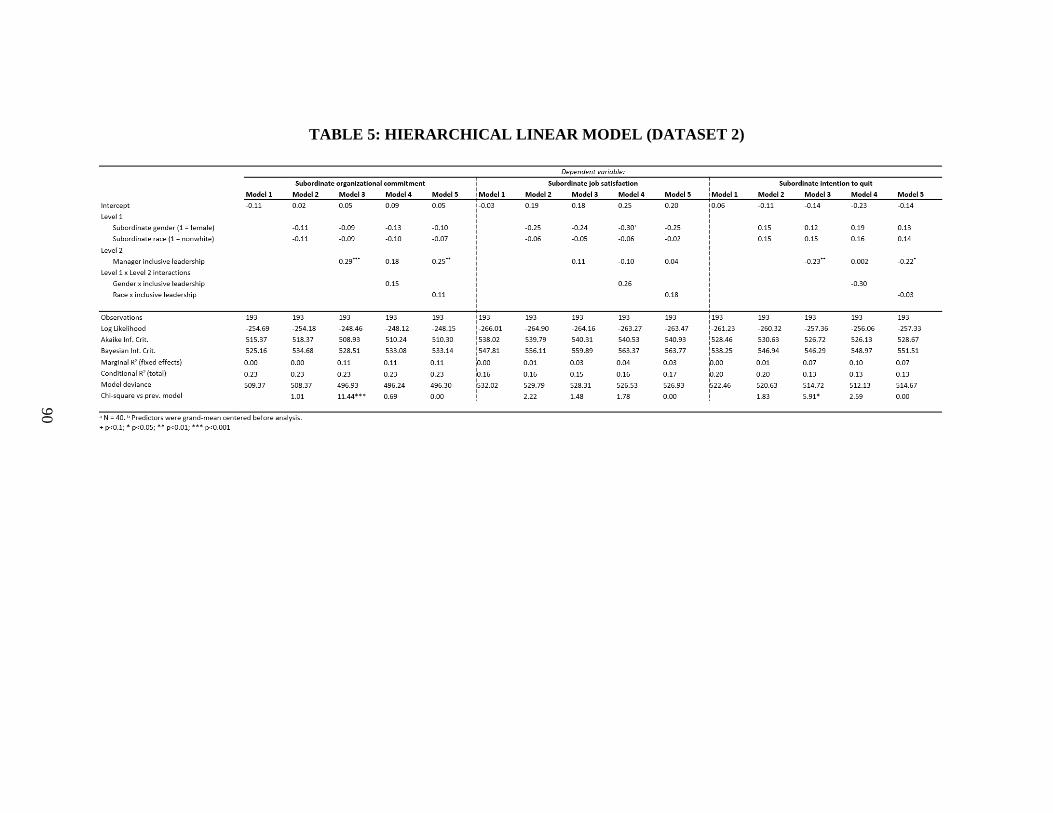
90
TABLE 5: HIERARCHICAL LINEAR MODEL (DATASET 2)
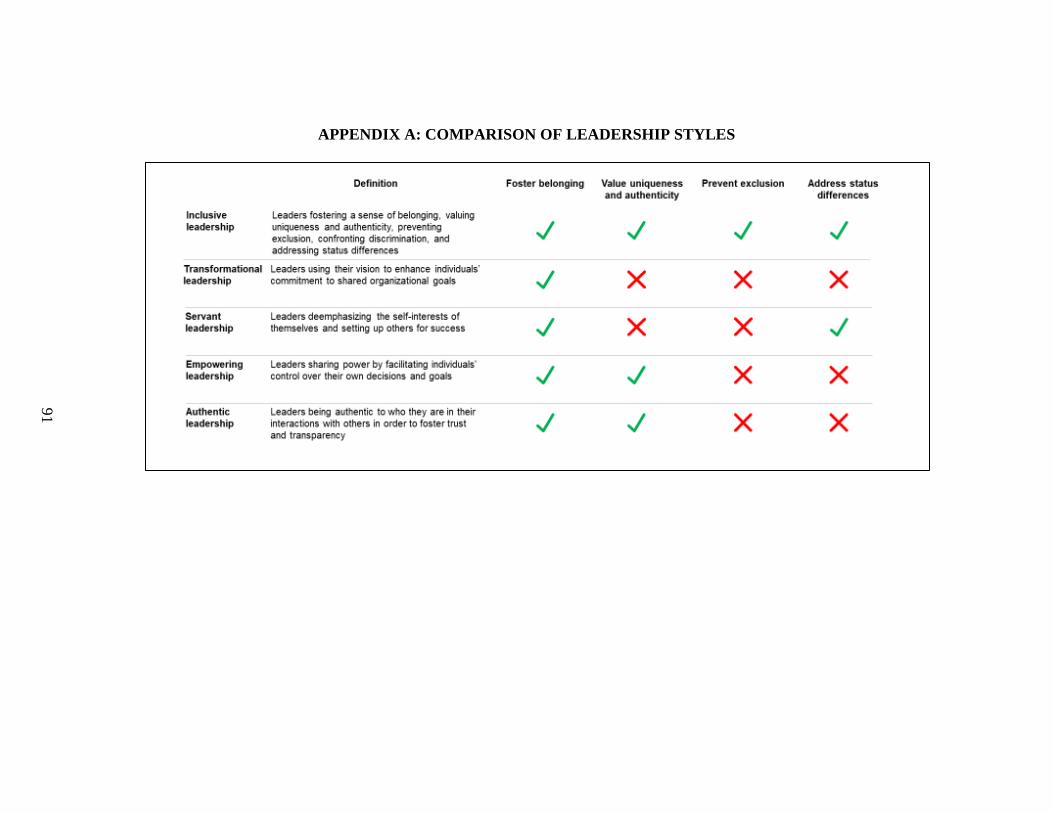
91
APPENDIX A: COMPARISON OF LEADERSHIP STYLES

92
APPENDIX B: THEORETICAL MODEL
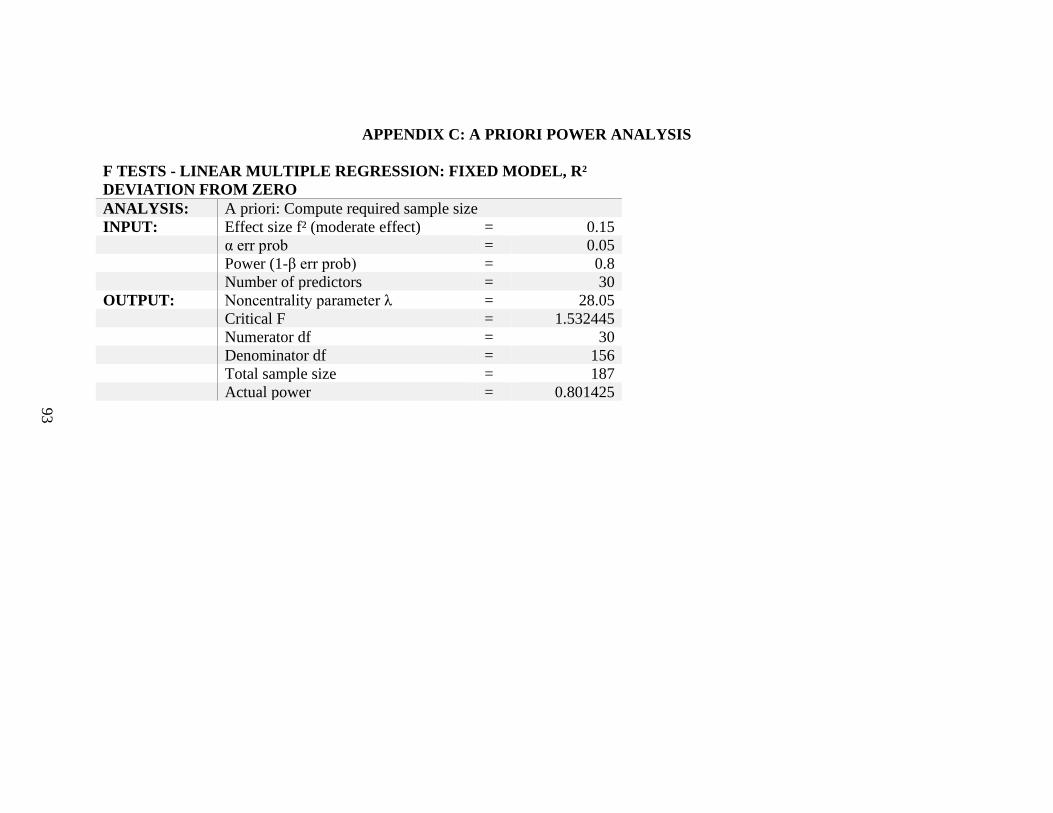
93
APPENDIX C: A PRIORI POWER ANALYSIS
F TESTS - LINEAR MULTIPLE REGRESSION: FIXED MODEL, R²
DEVIATION FROM ZERO
ANALYSIS: A priori: Compute required sample size
INPUT: Effect size f² (moderate effect) = 0.15 α err prob = 0.05 Power (1-β err prob) = 0.8 Number of predictors = 30
OUTPUT: Noncentrality parameter λ = 28.05 Critical F = 1.532445 Numerator df = 30 Denominator df = 156 Total sample size = 187 Actual power = 0.801425
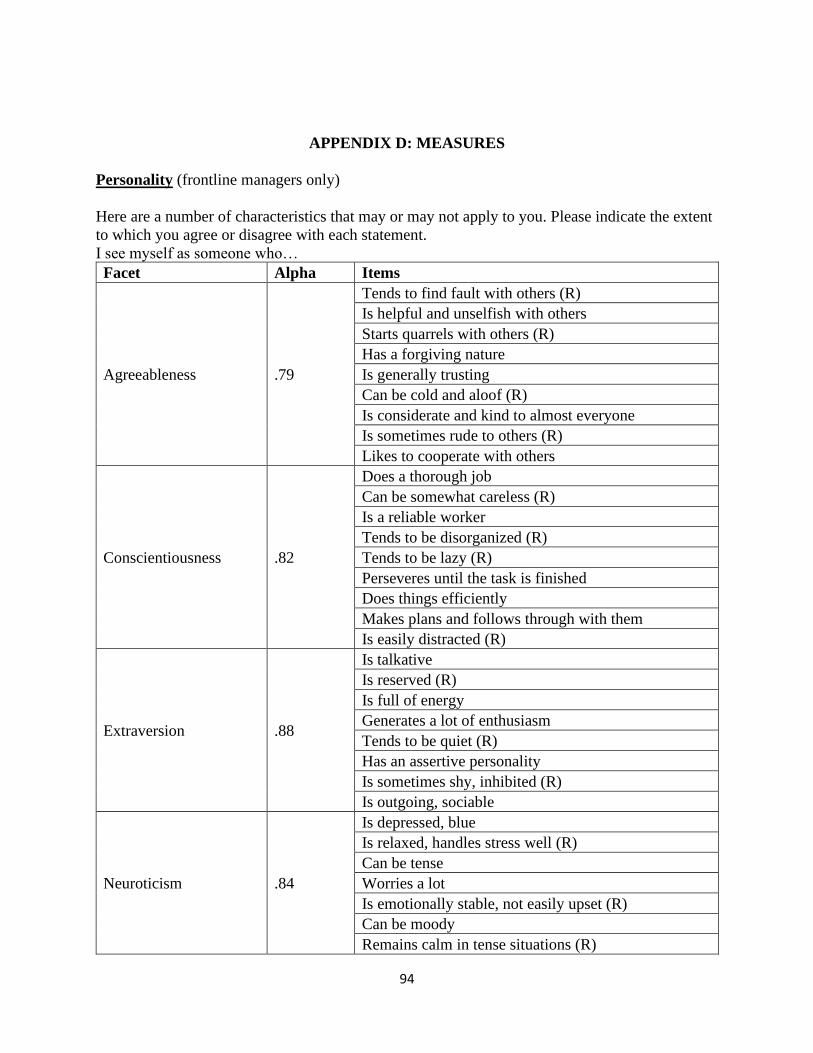
94
APPENDIX D: MEASURES
Personality (frontline managers only)
Here are a number of characteristics that may or may not apply to you. Please indicate the extent
to which you agree or disagree with each statement.
I see myself as someone who…
Facet Alpha Items
Agreeableness .79
Tends to find fault with others (R)
Is helpful and unselfish with others
Starts quarrels with others (R)
Has a forgiving nature
Is generally trusting
Can be cold and aloof (R)
Is considerate and kind to almost everyone
Is sometimes rude to others (R)
Likes to cooperate with others
Conscientiousness .82
Does a thorough job
Can be somewhat careless (R)
Is a reliable worker
Tends to be disorganized (R)
Tends to be lazy (R)
Perseveres until the task is finished
Does things efficiently
Makes plans and follows through with them
Is easily distracted (R)
Extraversion .88
Is talkative
Is reserved (R)
Is full of energy
Generates a lot of enthusiasm
Tends to be quiet (R)
Has an assertive personality
Is sometimes shy, inhibited (R)
Is outgoing, sociable
Neuroticism .84
Is depressed, blue
Is relaxed, handles stress well (R)
Can be tense
Worries a lot
Is emotionally stable, not easily upset (R)
Can be moody
Remains calm in tense situations (R)
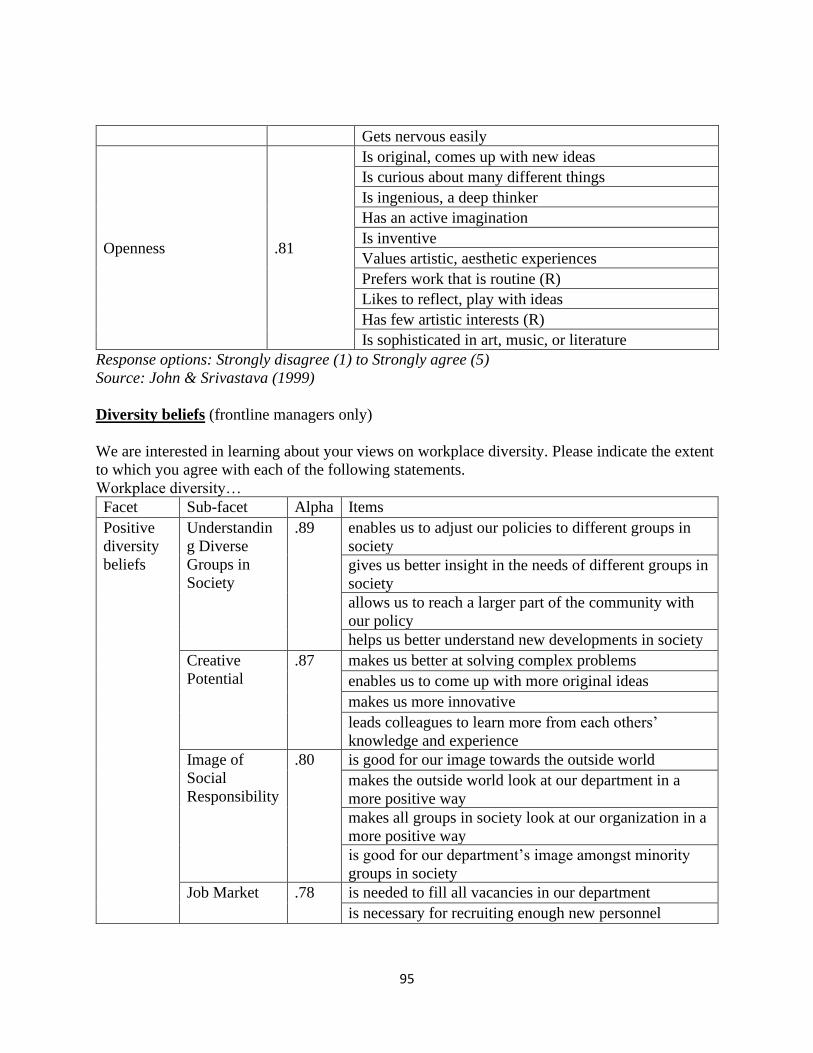
95
Gets nervous easily
Openness .81
Is original, comes up with new ideas
Is curious about many different things
Is ingenious, a deep thinker
Has an active imagination
Is inventive
Values artistic, aesthetic experiences
Prefers work that is routine (R)
Likes to reflect, play with ideas
Has few artistic interests (R)
Is sophisticated in art, music, or literature
Response options: Strongly disagree (1) to Strongly agree (5)
Source: John & Srivastava (1999)
Diversity beliefs (frontline managers only)
We are interested in learning about your views on workplace diversity. Please indicate the extent
to which you agree with each of the following statements.
Workplace diversity…
Facet Sub-facet Alpha Items
Positive
diversity
beliefs
Understandin
g Diverse
Groups in
Society
.89 enables us to adjust our policies to different groups in
society
gives us better insight in the needs of different groups in
society
allows us to reach a larger part of the community with
our policy
helps us better understand new developments in society
Creative
Potential
.87 makes us better at solving complex problems
enables us to come up with more original ideas
makes us more innovative
leads colleagues to learn more from each others’
knowledge and experience
Image of
Social
Responsibility
.80 is good for our image towards the outside world
makes the outside world look at our department in a
more positive way
makes all groups in society look at our organization in a
more positive way
is good for our department’s image amongst minority
groups in society
Job Market .78 is needed to fill all vacancies in our department
is necessary for recruiting enough new personnel
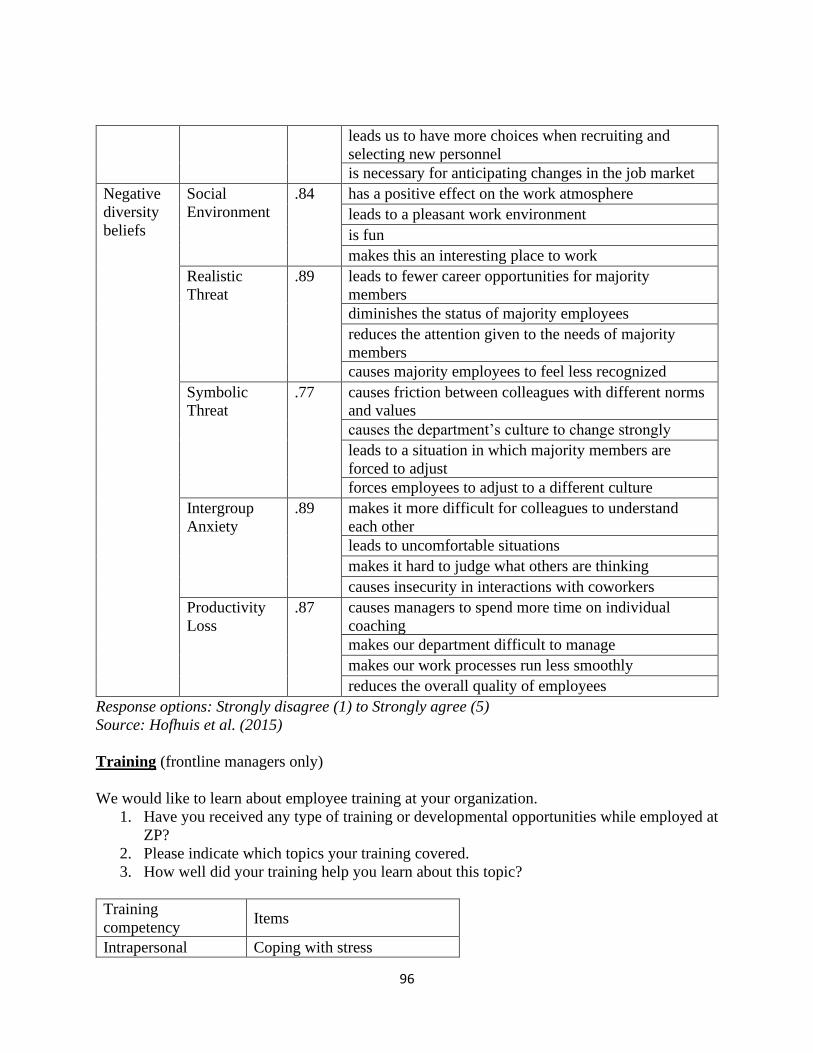
96
leads us to have more choices when recruiting and
selecting new personnel
is necessary for anticipating changes in the job market
Negative
diversity
beliefs
Social
Environment
.84 has a positive effect on the work atmosphere
leads to a pleasant work environment
is fun
makes this an interesting place to work
Realistic
Threat
.89 leads to fewer career opportunities for majority
members
diminishes the status of majority employees
reduces the attention given to the needs of majority
members
causes majority employees to feel less recognized
Symbolic
Threat
.77 causes friction between colleagues with different norms
and values
causes the department’s culture to change strongly
leads to a situation in which majority members are
forced to adjust
forces employees to adjust to a different culture
Intergroup
Anxiety
.89 makes it more difficult for colleagues to understand
each other
leads to uncomfortable situations
makes it hard to judge what others are thinking
causes insecurity in interactions with coworkers
Productivity
Loss
.87 causes managers to spend more time on individual
coaching
makes our department difficult to manage
makes our work processes run less smoothly
reduces the overall quality of employees
Response options: Strongly disagree (1) to Strongly agree (5)
Source: Hofhuis et al. (2015)
Training (frontline managers only)
We would like to learn about employee training at your organization.
1. Have you received any type of training or developmental opportunities while employed at
ZP?
2. Please indicate which topics your training covered.
3. How well did your training help you learn about this topic?
Training
competency Items
Intrapersonal Coping with stress

97
Setting goals
Time management
Interpersonal
Building relationships
Active listening
Communication
Leadership Team-building
Influencing others
Business skills
Technical skills
Financial skills
Decision-making
Strategic thinking
Inclusion-related
skills
Conflict resolution
Sexual harassment
management
Addressing unconscious bias
Managing diverse teams
Diversity and inclusion
Response options: Yes/no (Question 1), check marks (Question 2), Not well at all (1) to
Extremely well (5) (Question 3)
Sources: Kulik & Roberson, 2008; Bezrukova et al., 2012; Lacerenza et al., 2017
Mentorship (managers only)
These next questions are about mentorship. Mentorship is defined as a work relationship between
a senior and junior employee in which the senior employee personally advises, counsels,
coaches, and promotes the career development of the junior employee. We want to learn more
about your experience with mentorship in your organization.
1. Have you had at least one mentor while working at ZP?
a. Yes
b. No
2. Think about the mentor you have had at ZP who has had the greatest impact on you.
Please indicate how often this mentor advises/advised you on the following topics…
Training
competency Items
Intrapersonal
Coping with stress
Setting goals
Time management
Interpersonal Building relationships
Active listening

98
Communication
Leadership Team-building
Influencing others
Business skills
Technical skills
Financial skills
Decision-making
Strategic thinking
Inclusion-related
skills
Conflict resolution
Sexual harassment
management
Addressing unconscious bias
Managing diverse teams
Diversity and inclusion
Response options: Almost never (1) to Very frequently (5)
Sources: Kulik & Roberson, 2008; Bezrukova et al., 2012; Lacerenza et al., 2017
Frontline manager inclusive leadership (rated by subordinates) or Sr. leader inclusive
leadership (rated by frontline managers)
We will now ask some questions about leadership at ZP. Please indicate how often your
immediate supervisor or manager engages in the following behaviors.
My manager…
Facet Alpha Items
Fairness,
equality, and
respect
.95 makes training opportunities equally accessible to all team members
makes him/herself accessible to all team members for advice
makes resources equally accessible to all team members
conducts fair performance reviews of team members
treats everyone in the team fairly
listens to all team members with respect
communicates openly with all team members
respects individual differences in the team
Integration and
synergy
.98 seeks members' input when pursuing team goals
encourages diverse inputs from all members to achieve team goals
encourages team members to contribute in their own ways
integrates perspectives from all team members
encourages everyone in the team to participate in decision making
asks for opinions from all team members when making decisions
actively incorporates different points of view into final decisions
welcomes constructive debate among team members

99
encourages team members to challenge each other's perspectives in a
constructive way
encourages all team members to collaborate with each other
encourages all team members to learn from one another
encourages team members to be their authentic selves
tries to create a cohesive team where members feel like they belong
Prevention of
exclusion
.79 manages biases toward marginalized group members in the team
confronts both direct and subtle forms of discrimination in the team
Response options: Almost never (1) to Almost always (5)
Source: Li (2021)
Climate of inclusion (rated by frontline managers only)
We will now ask some questions about what it's like to work at ZP. Please indicate how much
you agree or disagree with each of the following statements about your department at ZP.
Facet Alpha Items
Foundation
of equitable
employment
practices
.93 My department has a fair promotion process
The performance review process is fair in my department
My department invests in the development of all of its employees
Employees in my department receive “equal pay for equal work”
My department provides safe ways for employees to voice their
grievances
Integration
of
differences
.94 My department is characterized by a non-threatening environment in
which people can reveal their “true” selves
My department values work-life balance
My department commits resources to ensuring that employees are able
to resolve conflicts effectively
Employees of my department are valued for who they are as people,
not just for the jobs that they fill
In my department, people often share and learn about one another as
people
My department has a culture in which employees appreciate the
differences that people bring to the workplace
Inclusion in
decision-
making
.97 In my department, employee input is actively sought
In my department, everyone’s ideas for how to do things better are
given serious consideration
In my department, employees’ insights are used to rethink or redefine
work practices
Top management exercises the belief that problem-solving is improved
when input from different roles, ranks, and functions is considered
Response options: Strongly disagree (1) to Strongly agree (5)
Source: Nishii (2013)

100
Outcomes (rated by subordinates) or Controls (rated by frontline managers)
We would now like to understand how you feel about your job and your organization.
Facet Alpha Items
Affective
organizational
commitment
.87
I would be very happy to spend the rest of my career with this
organization
I enjoy discussing my organization with people outside it
I really feel as if this organization's problems are my own
I think that I could easily become as attached to another
organization as I am to this one (R)
I do not feel like 'part of the family' at my organization (R)
I do not feel 'emotionally attached' to this organization (R)
This organization has a great deal of personal meaning for me
I do not feel a strong sense of belonging to my organization (R)
Response options: Strongly disagree (1) to Strongly agree (5)
Source: Allen & Meyer (1990)
Facet Alpha Items
Job
satisfaction .85
I find real enjoyment in my job
I like my job better than the average person
Most days I am enthusiastic about my job
I feel fairly well satisfied with my job
Response options: Strongly disagree (1) to Strongly agree (5)
Source: Thompson & Phua (2012)
Facet Alpha Items
Intent to
quit >.74
I often think about quitting this organization
I intend to search for a position with another employer within the
next year
Response options: Strongly disagree (1) to Strongly agree (5)
Source: Bentein et al. (2005)
Note: Exact alpha not available
COVID-19 (provided by frontline managers and subordinates)
Below are a few questions about how the COVID-19 pandemic has affected you at work.
1. How has the COVID-19 pandemic affected you in the following areas? (Extremely
negatively [1] to Extremely positively [5])
a. Your relationships with your coworkers
b. Your relationship with your manager
c. Your overall experience at work
101
2. How often did you work from home before the pandemic?
a. Never or almost never
b. 1-2 days per week
c. 2-3 days per week
d. 4-5 days per week
3. How often do you work from home now?
a. Never or almost never
b. 1-2 days per week
c. 2-3 days per week
d. 4-5 days per week
Demographics (provided by frontline managers and subordinates)
Finally, we have just a few questions for informational purposes.
1. What is your gender?
a. Male
b. Female
c. Other (please specify): _______
d. Prefer not to answer
2. Do you identify as transgender?
a. Yes
b. No
c. Prefer not to say
3. What is your age?
4. What is your race or ethnic background?
a. White or Caucasian
b. Black or African American
c. Asian
d. American Indian, Alaska Native, Native Hawaiian, or other Pacific Islander
e. Some other ethnicity (please specify): _______
5. Are you of Hispanic or Latino origin?
a. Yes, I am of Hispanic or Latino origin
b. No, I am not of Hispanic or Latino origin
6. Which of the following best describes your job level?
a. Individual contributor (don’t manage a team)
b. Manager (less than 5 years experience managing a team)
c. Senior manager (more than 5 years experience managing a team)
d. Senior leader (looks after a significant area of business in the organization)
7. How long have you been a leader at ZP? (frontline managers only)
a. Less than one year
b. 1-2 years
c. 2-3 years
d. 3-4 years
e. 4-5 years
102
f. More than 5 years
8. How long have you been the leader of your team? (frontline managers only)
a. Less than one year
b. 1-2 years
c. 2-3 years
d. 3-4 years
e. 4-5 years
f. More than 5 years
9. About how many employees do you manage in your current role? (frontline managers
only)
a. 1 – 3 employees
b. 3 – 5 employees
c. 5 – 7 employees
d. 7 – 9 employees
e. 10 or more employees
10. How much experience do you have working in teams that are diverse in terms of gender,
race, age, and/or education? (frontline managers only)
a. Almost no experience
b. A little experience
c. Some experience
d. A lot of experience
11. What is the highest degree or level of school you have completed? [dropdown]
▪ Less than a high school diploma
▪ High school degree or equivalent (e.g., GED)
▪ Some college, no degree
▪ Associate degree (e.g., AA, AS)
▪ Bachelor’s degree (e.g., BA, BS)
▪ Master’s degree (e.g., MA, MS, MEd)
▪ Professional degree (e.g., MD, DDS, DVM)
▪ Doctorate (e.g., PhD, EdD)


![[Benjamin Arbel, Bernard Hamilton, David Jacoby] L(BookZZ.org)](https://img.pdfslide.us/doc/110x75/55cf85f6550346484b9329c4/benjamin-arbel-bernard-hamilton-david-jacoby-lbookzzorg.jpg)