Embed Size (px)
Citation preview

1
DAVE JANNY FEBRUARY TWO 2018 INVESTMENT LETTER
2018 Volume 4
“THE GRAND ILLUSION: PROMISES, FORTUNATE SONS AND THE
GHOST OF TOM JOAD”
In 1995 Bruce Springsteen released “The Ghost of Tom Joad”:
“The highway is alive tonight
Where it's headed everybody knows
I'm sitting down here in the campfire light
With the ghost of old Tom Joad”
In this Letter I’m going to take you back to your school days when classic
literature was part of your reading regimen. One novel you may have read was
John Steinbeck’s “The Grapes of Wrath”. Wikipedia sets the stage:
“Set during the Great Depression, the novel focuses on the Joads, a poor family of
tenant farmers driven from their Oklahoma home by drought, economic hardship,
agricultural industry changes, and bank foreclosures forcing tenant farmers out of
work. Due to their nearly hopeless situation, and in part because they are trapped
in the Dust Bowl, the Joads set out for California. Along with thousands of other
"Okies", they seek jobs, land, dignity, and a future.”

2
Tom Joad is one of the main characters of the novel, the plot weaves in the tough
times and circumstances that he and his family faced while at the same time
shows Tom’s personal growth and development. According to Cliff Notes:
“Tom is kind and often merciful, yet quick to anger and fiercely independent. As a
man of action, he embodies one of the novel's main philosophical strands,
pragmatism.”
A question that is often asked about today’s FED is “what will the legacy of
Bernanke, Yellen and new FED chair Jay Powell be”? My answer to this reminded
me of the “The Ghost of Tom Joad”. Springsteen’s original song was a rather slow
but moving folk song that told the story of Tom Joad. The version I’m thinking of
was the “electrified” “live” version where Tom Morello of the band Rage Against
The Machine joins Springsteen for a powerful emotional collaboration that
features the incredible guitar playing of Morello. I’ve personally witnessed the
“live” performance, but if you’re not familiar with it, I’d urge you to check out the
video on You Tube to fully appreciate what I’m talking about. “Tom Joad” in this
Letter will serve as a symbol of the “working class” man in today’s world of QE
(Quantitative Easing). Before I fill in the details to my answer on FED legacy, let
me further set the stage with some of my other musical references.
In 1969, Credence Clearwater Revival released their song “Fortunate Son”. It was
a protest song against the “privileged”. Writer and lead singer John Fogarty said
of the song, “it speaks more to the unfairness of class”. Hold that thought.
“Promises” is a song by Eric “Slowhand” Clapton, one of the great guitarists of all
time. Clapton’s song reminds me of the usual government and central bank
tactics of giving people something today in the form of “promises” for short term
political gain at the expense of long term potential financial pain. I’ll weave that
idea into my FED legacy theory.
All of this with the backdrop of “The Grand Illusion”; this is now the fourth
straight Letter that utilizes that Styx song as on overlay of the supposed “fix” of
the 2007-2009 “financial crisis”. As the title implies and as the repeated usage
suggests, I’m obviously skeptical of the “fix”; it just doesn’t seem to make sense to
me to be able to “fix” a debt crisis by creating a lot more of it.
3
By the way, speaking of the FED, “welcome to the show” Jay Powell. Powell was
rudely greeted with a quick, sharp and “at moments” scary stock market
correction. Here’s what Powell said in 2012 about QE:
““My concern is that for very modest benefits, we are piling up risks for the future
and that it could be habit-forming. When it is time for us to sell, or even to stop
buying, the response could be quite strong.”
Well here we are at the point where the FED is selling treasury and mortgage
bonds after years of “piling up habit–forming risks”. In other words QT
(Quantitative Tightening) is here; like I said “welcome to the show”. Before we get
into FED legacy and “The Ghost of Tom Joad”, let’s start with some quick market
observations.
MARKET OBSERVATIONS
The almost two year uninterrupted stock market rally ended on 1/26/18, I
previously described it as a euphoric “blow-off” top. According to Thomson the
S&P 500 peak was 2872. The ensuing explosion in what had been dormant market
“volatility” (that I described as the “fire” in my last Letter “THE GRAND ILLUSION:
RING OF FIRE ON THE MOUNTAIN”) led to a correction, that included two rather
terrifying 1000 point plus down days in the Dow Jones Industrial Average, taking
the S&P to an intraday low of 2532 on 2/9/18. We finally got the 10% correction,
a feat that felt like it would never happen again. At the minimum, take it as a first
warning shot. Now that S&P high and low I just documented gives us a wide
trading range to work through before we can determine whether or not the 9
year bull market rally ended. The market has subsequently attempted a V-shaped
rally that has taken us up about 2/3 of the way through the aforementioned
trading range. This week’s intraday sell-offs and reluctance to move more forward
likely gives some credence to the thought of, at the minimum, a retest of the
recent low. In the background the stock market gets a bit jittery on days when
treasuries yields rise and then gets more comfortable on days when rates fall.
Either way, breaking the top or breaking the low, will give us a better handle on
the intermediate term market trend. Breaking the low would probably carry more
weight as we haven’t seen many or even any instances of that in quite a long
4
time. Again, keep in mind, this is all occurring with the backdrop of never-
attempted QT in the face of the largest and longest historic coordinated global
central bank intervention ever embarked upon. Good luck.
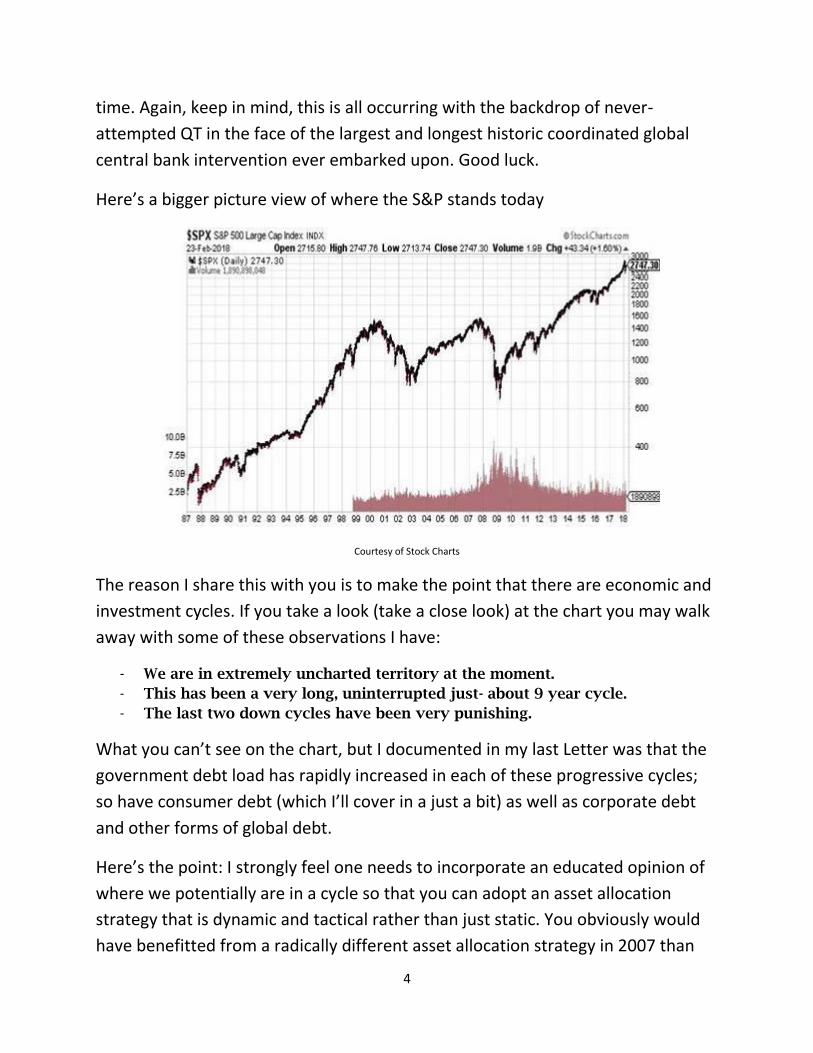
Here’s a bigger picture view of where the S&P stands today
Courtesy of Stock Charts
The reason I share this with you is to make the point that there are economic and
investment cycles. If you take a look (take a close look) at the chart you may walk
away with some of these observations I have:
- We are in extremely uncharted territory at the moment.
- This has been a very long, uninterrupted just- about 9 year cycle.
- The last two down cycles have been very punishing.
What you can’t see on the chart, but I documented in my last Letter was that the
government debt load has rapidly increased in each of these progressive cycles;
so have consumer debt (which I’ll cover in a just a bit) as well as corporate debt
and other forms of global debt.
Here’s the point: I strongly feel one needs to incorporate an educated opinion of
where we potentially are in a cycle so that you can adopt an asset allocation
strategy that is dynamic and tactical rather than just static. You obviously would
have benefitted from a radically different asset allocation strategy in 2007 than
5
would have been beneficial in 2009. I hear many investors call themselves long
term investors, that’s great but take a close look at the above chart and ask
yourself if you want to own as many stocks today as you would have ideally
wanted to own at the bottom in March of 2009. I’m not suggesting owning “no
stock” but I’m certainly advocating owning “less stock”. Unfortunately with the
handicap of human emotion, people want to typically become long term investors
when things look the best, which is actually more closely related to a market
“top” when one needs to be reducing risk. My job as a financial advisor and one
of the main objectives of my Investment Letters is to warn you about those
potential inflection points, where you need to be taking a “different” approach.
An eventual “normal” 20% correction would require a “different” approach, but if
you believe that we potentially could be in “The Grand Illusion”, you really need a
much “different” approach. If we haven’t had a conversation about your personal
situation I urge you to reach out to me at [email protected] or call me directly
at 203 221-6093 to further discuss.
I want to share a great article from Richard Rosso of Real Investment Advice titled
“2 Ways to Walk The Line With Your Money” that does a great job affirming my
above thoughts; I strongly encourage you to read it:
https://www.linkedin.com/feed/update/urn:li:activity:6370007847274582016
“TOM JOAD”, “FORTUNATE SONS” AND THE LEGACY OF THE FED
Let me jump straight to my answer to the question of what will the legacy of
Bernanke, Yellen and Powell be:
- A global asset bubble, the third in the last 20 years
- Debt, debt and more debt.
- Expanding wealth and income inequality that will lead to political change
For this Letter let’s focus on that third point “expanding wealth and income
inequality”. As I mentioned earlier “Tom Joad” will serve as my metaphor for the
“working class”/”middle class” American that is the unfortunate loser in the
global and domestic QE that we’ve seen for the last 9 years. The central bank plan
was simple; flood the system with money and intervene in the markets to lower
6
interest rates as much as possible and force up asset prices so that the wealth
effect creates consumer demand to create economic growth. After a series of QEs
here in the U.S., magnified by even more aggressive intervention in Europe, Japan
and China, boy did asset prices go up. Economic growth? Not so much. Benefits to
“Tom Joad”? Even less.
Before we delve into what happened to “Tom Joad” during this unprecedented
intervention, I want you to understand where I’m coming from. I am a free-
market capitalist. I want to see all people prosper and succeed and I don’t at all
begrudge the upper economic strata of the population for accumulating huge
sums of wealth; so when I point out the widening wealth and income inequality
gap, what I’m really disappointed with is how it has come about. Ladies and
gentlemen, we are not operating in a free-market capitalist system; with the
global elitists at the helm, capitalism has been hijacked by the “state”. The “state”
is off course big and growing government that especially since the financial crisis
has changed the rules to the benefit of the “fortunate sons” and to the detriment
of “Tom Joad”. Ever growing dependence on debt at all levels, an ever increasing
social welfare state, an alarming number of examples of “kicking the can down
the road” rather than making tough but needed political and financial decisions
and finally the implementation of a massive financial experiment by global central
bankers that has completely stacked the deck in favor of the wealthy are the
signposts of a warped capitalism, corrupted and run amok. The actions of central
bankers the last number of years has looked like a fruitless attempt to end
economic cycles, which has prevented a needed cleansing of global debt
structures and created dangerous and unprecedented moral hazard by distorting
financial markets.
Here in the U.S., “Tom Joad” has not readily participated in the FED-induced asset
bubble and either become more dependent on government welfare or been
faced with bleak job prospects with no wage growth and increasingly has been
forced to take on more and more debt to just “keep up” or pay for needed
healthcare and educational costs that have been disproportionately rising and
hurting him. Corporations have been more interested in forms of
“financialization” like stock buybacks at the expense of capital investment. Low
7
rates have forced marginal savers to “reach for yield” and increase the risk
they’ve been forced to take on their investments. Technological advances are
increasingly threatening “Tom Joad’s” job prospects. I’m going to estimate that
roughly 80% of our population is in the “Tom Joad” camp.
Back on 10/23/17, Ray Dalio who runs Bridgewater Capital, the world’s largest
hedge fund, posted a piece to LinkedIn called “Our Biggest Economic, Social and
Political Issue”. Dalio called it “the two economies: the top 40% and the bottom
60%”. Since I’m a lot closer to “Tom Joad” than Dalio, I’ll stick with my 80%
demarcation line rather than his 60%. One of his main points is that in describing
the health of the U.S. economy it is dangerous to use averages. Here’s what he
said:
“To understand what’s going on in “the economy,” it is a serious mistake to look at
average statistics. This is because the wealth and income skews are so great that
average statistics no longer reflect the conditions of the average man. For example,
as shown in the chart below, the wealth of the top one-tenth of 1% of the population
is about equal to that of the bottom 90% of the population, which is the same sort of
wealth gap that existed during the 1935-40 period.”
That’s a staggering statistic. He went on to add these facts:
“There has been no growth in earned income, and income and wealth gaps have
grown and are enormous. Since 1980, median household real incomes have been
about flat, and the average household in the top 40% earns four times more than
the average household in the bottom 60%. While they’ve experienced some growth
recently, real incomes have been flat to down slightly for the average household in
the bottom 60% since 1980 (while they have been up for the top 40%). Those in the
top 40% now have on average 10 times as much wealth as those in the bottom 60%.
That is up from six times as much in 1980.”
“Only about a third of the bottom 60% saves any of its income (in cash or financial
assets). As a result, according to a recent Federal Reserve study, most people in this
group would struggle to raise $400 in an emergency.”
I’ve accumulated additional facts from other sources that I’ll share with you that
clearly illustrate the plight of “Tom Joad”. The Richard Rosso Real Investment
Advice article I utilized above shared these additional facts:
“Crippling student loan debt: Per a study by the Brookings Institute, student loan
borrowers who left school owing at least $50,000 in student loans in 2010 had
8
failed to pay down any of the debt four years later. There are approximately 5
million borrowers affected out of a total of 44 million Americans saddled with
student loan obligations. The most recent overall loan delinquency rate stands at
11.2% and the median monthly student loan payment is $203 per one of my
favorite internet hubs of information – www.studentloanhero.com.
A downright embarrassing personal savings rate, overall: as of December 2017, the
personal U.S. saving rate fell to 2.4%. You need to return to the summer of 2005 to
get close to an equally dismal percentage.”
So “Tom Joad” is saving less and borrowing more and basically doesn’t have
enough money for emergencies. From the 12/30/17 issue of the Stansberry Digest
come some more sobering statistics:
Credit Suisse Chief Global Strategist Jonathan Wilmot published some debt
research that looked at debt-to-income ratios across different segments of the
population. In the late 1980s, the 20% of Americans with the least amount of
income held little debt, measured against their income levels. Today, however, this
segment of the population is the most in debt when measured against income.
The poorest Americans now hold debts in excess of 250% of their incomes, or about
five times more debt than the wealthiest 20%.
This massive change in the character of our household debts came about because
of "innovations" in lending – like subprime auto loans, payday lenders, and, most
important, student loans. Today, total household debt is almost $13 trillion. That's
higher than the previous all-time high of $12.6 trillion, set in the third quarter of
2008 – immediately prior to the last crisis.
And what's most important to understand is that the cost of this debt burden has
been artificially reduced since 2009 by the Fed. These costs – not just the normal
debt service, but also the cost of defaults – are about to soar.
More than 10% of these loans are student loans ($1.5 trillion outstanding). Most
were made to poor people against zero collateral, where there isn't any legal
process to deal with defaults. This is a serious economic problem that will
transform into a serious political problem because we have no economic or legal
way to deal with these debts.
And yet... the issuance of these bad debts continues to soar. Since 2013, the average
balance of all student borrowers has increased by 17% to more than $30,000.
9
“Tom Joad” now disproportionately owes the most debt. Michelle DiMartino
Booth of Money Strong LLC, shares these thoughts from a 1/3/18 interview with
Greg Hunter of USA Watchdog.com:
“We have seen 24 consecutive back-to-back months when credit card spending has
outpaced incomes. That tells you households are struggling to get by. This is not
Yves Saint Laurent handbags and Jimmy Choo shoes. These are families who are
using their credit cards to take care of the necessities, to fill up the gas tank, to buy
groceries and fill up their refrigerator...
We have seen month after month of subprime automobile delinquencies, and we are
starting to see a big tic up in FHA mortgage delinquencies as well.
...We are at almost 10% (delinquencies) of FHA mortgage loans. Underlying this
sugar high that we will see from all of these hurricanes and rebuilding efforts and
wildfires, underneath that, still waters run deep and the economy is not doing well.
We are a consumption driven economy that is weakening underneath.
The sugar high will absolutely wear off in 2018.”
I do believe that our economy is more fragile than “average” statistics would
suggest. “Tom Joad” is obviously hurting. “Tom Joad” has also not participated in
asset wealth creation as Patrick Watson who writes Connecting The Dots for John
Mauldin in a 2/13/18 piece he titled “The Stock Market Isn’t America” shows:
“About half of US households have zero exposure to the stock market: no stocks,
no mutual funds, no 401(k), no IRA, nothing.
According to research by New York University economist Edward Wolff, some 84%
of the stocks owned by Americans belong to the wealthiest 10% of households.
Subtract that 10%, and subtract the 50% who own no stocks, the remaining 40% of
Americans split about 15% of the stock market. For many, their investment is
negligible—maybe a few hundred dollars in an old 401(k). Others have a big part of
their net worth tied up in stocks. Maybe you’re in that group.
But a solid majority of the American population feels no direct impact from stock
market performance.”
Lastly David Effrig of Stansberry Research in his 2/15/18 edition of Income
intelligence further evidenced the problems of “Tom Joad”,
10
“First, wage growth for the middle class has been painfully slow over the long term.
Since 1993, real gross domestic product (GDP) per capita has risen about 40%, but
the median household income has grown only about 15%.
Second, there is an important group of necessities that have not trended lower in
costs. In particular, education, health care, and housing have all increased
drastically.
These aren't costs you can avoid...
•Since 1978, the CPI is up about 280%. But the CPI's measure of college tuition and
fees is up 1,225%.
•In 1970, we spent about $356 per person per year on health care ($1,714 in
inflation-adjusted terms). By 2013, that had risen to $9,255.
•And as far as housing goes, the median rent has risen about 33% since 1980 after
adjusting for inflation.”
“Tom Joad” obviously faces significant headwinds. On the other hand, I’m not
going to document the success of the “fortunate sons” but rather just have you
take another look at the S&P 500 chart I included on page 4 of this Investment
Letter; suffice to say the “fortunate sons” have done well in the QE regime that
global central bankers and the “elitists” have constructed. Eric Peters of One River
Asset Management succinctly sums up the conundrum and includes some political
assessment and consequences as well that may not be good for the “fortunate
sons”:
“So interest rates, just generally speaking, are very low. Debt is extremely high.
And inflation has remained low. So we’re somewhat caught in a dynamic where it’s
extremely difficult for rates to go up very high without raising a significant burden
on economies. The only way to alleviate that burden is to create more inflation.
But I think, as everyone looks at the world as they see it today, they go, well, it’s
going to be difficult for inflation to go up very far. Consequently rates can’t go up
very far, because if they do they’ll, essentially, bankrupt economies. And obviously
they won’t bankrupt the whole economy.
We’ve reached that tipping point within society where income inequality has
become sufficiently large that we’re seeing political shifts, whether it’s here in the
US, in the UK, in Germany – certainly in those three places – where there’s clear
pushback by the mid-skill worker against low wages, low wage growth.
11
As these things happen, as political winds shift, we’re seeing some of the natural
consequences. Which is, let’s call it de-globalization. I don’t think it’s going to be a
radical de-globalization. But it’s pretty clear that we’re seeing policies in these
various countries that, on balance, are going to lead to less globalization. “
“Promises” by way of social safety nets and pension and retirement programs
have been another way for the “elitists” in charge to communicate to “Tom Joad”
that in the long run everything will be okay because his retirement will be taken
care of. These “promises” have been given in exchange for votes that keep the
powers to be in power. There’s only one problem, more and more people are
seeing through the “promises” and realizing that pensions and our own Social
Security and Medicare programs are massively underfunded. Debt continues to
grow unchecked at all government levels throughout the world.
A 2/13/18 Zero Hedge article titled “$1.2 Trillion Asset Manager: Forget Volatility,
The Real Financial Timebomb is Public Pensions” gives some public pension stats
as well as some commentary from David Hunt of PGIM. By the way, I’m still
worried about “volatility” but let’s stick with script:
As we have reported over and over and over (and over, and over), public pensions
are in deep, deep trouble.
In addition critical funding shortfalls (U.S. public pensions had just 71.8% of assets
required to meet obligations as of June 2016), many of the country's largest
pensions have completely unrealistic target rates-of-return of 7% on average
"If you were going to look for what’s the possible real crack in the financial
architecture for the next crisis, rather than looking in the rearview mirror, pension
funds would be on our list,” Hunt said in a Friday interview with Bloomberg,
discussing what municipalities and states will do when local tax revenues decline
and unemployment worsens. "So we're worried about those pension obligations.”
PGIM, owned by New Jersey-based Prudential Financial, advises 147 of the 300
largest pension funds around the world.
Hunt said that corporate retirement funds typically outperform their public
counterparts. To that end, one of the most difficult aspects of managing money for
public plans, says Hunt, is the fact that lawmakers are promising unrealistic goals
to retirees. As such, he has advised public-pension clients to stop seeking the
highest returns, and "start doing what the corporate folks have long been doing,
12
which is to find ways to minimize the deficit and to take risk gradually off the
table.”
Adding to that, here are some comments from John Rubino of Dollar
Collapse.com that encapsulates the issues of “promises’ and the debt bubble
we’ve so incredibly created:
“Thirty or so years ago, state and local politicians and the leaders of their public
employee unions had a shared epiphany: If they offered workers hyper-generous
pensions they could buy labor peace without having to grant eye-popping and
headline-grabbing wage increases. And if they made unrealistically high
assumptions about the returns they could generate on pension plan assets they
could keep required contributions nice and low, thus making both workers and
taxpayers happy. The result: job security for politicians and union leaders and a
false sense of affluence for workers and taxpayers.
This scam worked beautifully for as long as it needed to – which is to say until the
architects of the over-generous benefits and unrealistic assumptions retired rich
and happy.
But now the unworkable math is coming to light and pension funds are responding
with two strategies:
1) Roll the dice by loading up on equities – the most volatile asset class available –
along with “real estate, commodities, hedge funds and private-equity holdings.”
2) Buy the dips. As the above highlighted quote illustrates, stocks have been going
up so steadily for so long that pension fund managers now see “volatility as an
investing opportunity.” When the next downturn hits they’ll throw good money
after bad, magnifying their losses.
Eventually a real bear market will shred the duct tape and chewing gum that’s
holding the public pension machine together. And several trillion dollars of
obligations will migrate from state and local governments to Washington, which is
to say taxpayers in general, at a time when federal debts are already soaring.
This is not a pretty picture. Pensions are still significantly underfunded despite a 9
year bull market in equities. As Rubino points out, what happens when we see the
unfortunate but inevitable down side of the cycle?
FINAL THOUGHTS
In my opening comments, Cliff Notes suggested that “pragmatism” was one of
“Tom Joad’s” main attributes. Much “pragmatism” will be required under the
13
current circumstances. Not only “Tom Joad”, but all of us face many challenges
ahead. Tough decisions will need to be made and political changes will be
required and continued “kicking the can down the road” will not be acceptable.
We can’t keep postponing dealing with issues that need to be addressed today
because of political convenience.
As far as global markets are concerned, there will be unintended consequences. I
don’t know when this very long market and economic cycle ends, but I do know
that there are clear warning signs that we should be heeding by employing risk
reduction strategies. If “Tom Joad” truly represents approximately 80% of the
population as I had suggested, the end may be nearer than you think. Thanks for
your readership, I look forward to any thoughts and comments and I strongly urge
you to reach out to me directly to see if I could be of help.
David Janny
Senior Vice President
Senior Portfolio Manager
Financial Advisor
NMLS# 1279369
Morgan Stanley Wealth Management
500 Post Road East
3rd Floor
Westport, CT 06880
203 221-6093
Visit my website http://fa.morganstanley.com/david.janny/
Connect with me on LinkedIn: https://www.linkedin.com/in/david-janny-ba2734115
The views expressed herein are those of the author and do not necessarily reflect the views of Morgan Stanley Wealth
Management or its affiliates. All opinions are subject to change without notice. Neither the information provided nor any
opinion expressed constitutes a solicitation for the purchase or sale of any security. Past performance is no guarantee of future
results.
Please be advised by clicking on a third party URL or hyperlink, you will leave morganstanley.com. Morgan Stanley Smith Barney
LLC is not implying an affiliation, sponsorship, endorsement with/of the third party or that any monitoring is being done by
Morgan Stanley of any information contained within the web site. Morgan Stanley is not responsible for the information
contained on the third party web site or your use of or inability to use such site. Nor do we guarantee their accuracy and
completeness
Information contained herein has been obtained from sources considered to be reliable, but we do not guarantee their accuracy
or completeness
14
Equity securities may fluctuate in response to news on companies, industries, market conditions and the general economic
environment.
This material does not provide individually tailored investment advice. It has been prepared without regard to the individual
financial circumstances and objectives of persons who receive it. The strategies and/or investments discussed in this material
may not be suitable for all investors. Morgan Stanley Wealth Management recommends that investors independently evaluate
particular investments and strategies, and encourages investors to seek the advice of a Financial Advisor. The appropriateness
of a particular investment or strategy will depend on an investor’s individual circumstances and objectives.
The appropriateness of a particular investment or strategy will depend on an investor’s individual circumstances and objectives.
Principal value and return of an investment will fluctuate with changes in market conditions.
Investors should carefully consider the investment objectives and risks as well as charges and expenses of exchange traded
funds (ETFs) before investing. To obtain a prospectus, contact your Financial Advisor or visit the fund company’s website. The
prospectus contains this and other important information about the ETFs. Read the prospectus carefully before investing.
International investing may not be suitable for every investor and is subject to additional risks, including currency fluctuations,
political factors, withholding, lack of liquidity, the absence of adequate financial information, and exchange control restrictions
impacting foreign issuers. These risks may be magnified in emerging markets.
Investing in commodities entails significant risks. Commodity prices may be affected by a variety of factors at any time, including
but not limited to, (i) changes in supply and demand relationships, (ii) governmental programs and policies, (iii) national and
international political and economic events, war and terrorist events, (iv) changes in interest and exchange rates, (v) trading
activities in commodities and related contracts, (vi) pestilence, technological change and weather, and (vii) the price volatility of
a commodity. In addition, the commodities markets are subject to temporary distortions or other disruptions due to various
factors, including lack of liquidity, participation of speculators and government intervention.
Bonds are subject to interest rate risk. When interest rates rise, bond prices fall; generally the longer a bond's maturity, the more
sensitive it is to this risk. Bonds may also be subject to call risk, which is the risk that the issuer will redeem the debt at its option,
fully or partially, before the scheduled maturity date. The market value of debt instruments may fluctuate, and proceeds from
sales prior to maturity may be more or less than the amount originally invested or the maturity value due to changes in market
conditions or changes in the credit quality of the issuer. Bonds are subject to the credit risk of the issuer. This is the risk that the
issuer might be unable to make interest and/or principal payments on a timely basis. Bonds are also subject to reinvestment risk,
which is the risk that principal and/or interest payments from a given investment may be reinvested at a lower interest rate.
Interest on municipal bonds is generally exempt from federal income tax; however, some bonds may be subject to the
alternative minimum tax (AMT). Typically, state tax-exemption applies if securities are issued within one’s state of residence
and, if applicable, local tax-exemption applies if securities are issued within one’s city of residence. The tax-exempt status of
municipal securities may be changed by legislative process, which could affect their value and marketability.
Bonds rated below investment grade may have speculative characteristics and present significant risks beyond those of
investment grade securities, including greater credit risk, price volatility, and limited liquidity in the secondary market. Investors
should be careful to consider these risks alongside their individual circumstances, objectives and risk tolerance before investing
in high-yield bonds. High yield bonds should comprise only a limited portion of a balanced portfolio.
Foreign currencies may have significant price movements, even within the same day, and any currency held in an account may
lose value against other currencies. Foreign currency exchanges depend on the relative values of two different currencies and
are therefore subject to the risk of fluctuations caused by a variety of economic and political factors in each of the two relevant
countries, as well as global pressures. These risks include national debt levels, trade deficits and balance of payments, domestic
and foreign interest rates and inflation, global, regional or national political and economic events, monetary policies of
governments and possible government intervention in the currency markets, or other markets.
15
Technical analysis is the study of past price and volume trends of a security in an attempt to predict the security's future price
and volume trends. Its limitations include but are not limited to: the lack of fundamental analysis of a security's financial
condition, lack of analysis of macro economic trend forecasts, the bias of the technician's view and the possibility
that past participants were not entirely rational in their past purchases or sales of the security being analyzed. Investors using
technical analysis should consider these limitations prior to making an investment decision.
Physical precious metals are non-regulated products. Precious metals are speculative investments which may experience short-
term and long-term price volatility. The value of precious metals investments may fluctuate and may appreciate or decline,
depending on market conditions. If sold in a declining market, the price you receive may be less than your original investment.
Unlike bonds and stocks, precious metals do not make interest or dividend payments. Therefore, precious metals may not be
suitable for investors who require current income. Precious metals are commodities that should be safely stored, which may
impose additional costs on the investor. The Securities Investor Protection Corporation (SIPC) provides certain protection for
customers’ cash and securities in the event of a brokerage firm’s bankruptcy, other financial difficulties, or if customers’ assets
are missing. SIPC insurance does not apply to precious metals or other commodities.
Asset allocation does not guarantee a profit or protect against a loss in a declining financial market.
Past performance is no guarantee of future results.
NASDAQ Composite Index is a market-value-weighted index of all NASDAQ domestic and non-U.S. based common stocks listed
on NASDAQ stock market. An investment cannot be made directly in a market index.
S&P 500 Index is an unmanaged, market value-weighted index of 500 stocks generally representative of the broad stock
market. An investment cannot be made directly in a market index.
The NYSE Arca Gold BUGS Index, also known as the AMEX Gold BUGS Index, is a modified equal dollar weighted index of
companies involved in major gold mining. The index was designed to give investors significant exposure to near term
movements in gold prices by including companies that do not hedge their gold production beyond 1½ years. The index was
developed with a base value of 200 as of March 15, 1996.
Morgan Stanley Smith Barney LLC. Member SIPC. CRC 2030504 02/2018