Embed Size (px)
Citation preview
Joined by a River: Logistics Programming in the Quad Cities
Logistics High School Survey Results1. Introduction
A survey to determine Quad-city high schools students’ awareness of logistics careers and preferences in marketing avenues was administered with enrolled Iowa and Illinois high school students in November and December of 2007 by the project team members
The survey was conducted in focus groups, with sections of the survey gathered verbally. Both the written and oral results are presented in this report.
The results were interpreted by the Laurie R. Hanson and her team, from the Department of Institutional Effectiveness at Eastern Iowa Community College District.
2. The Sample
There were 105 surveys returned. Because the surveys were completed within the focus group, there was a 100% return rate on the surveys.
3. The Survey Information
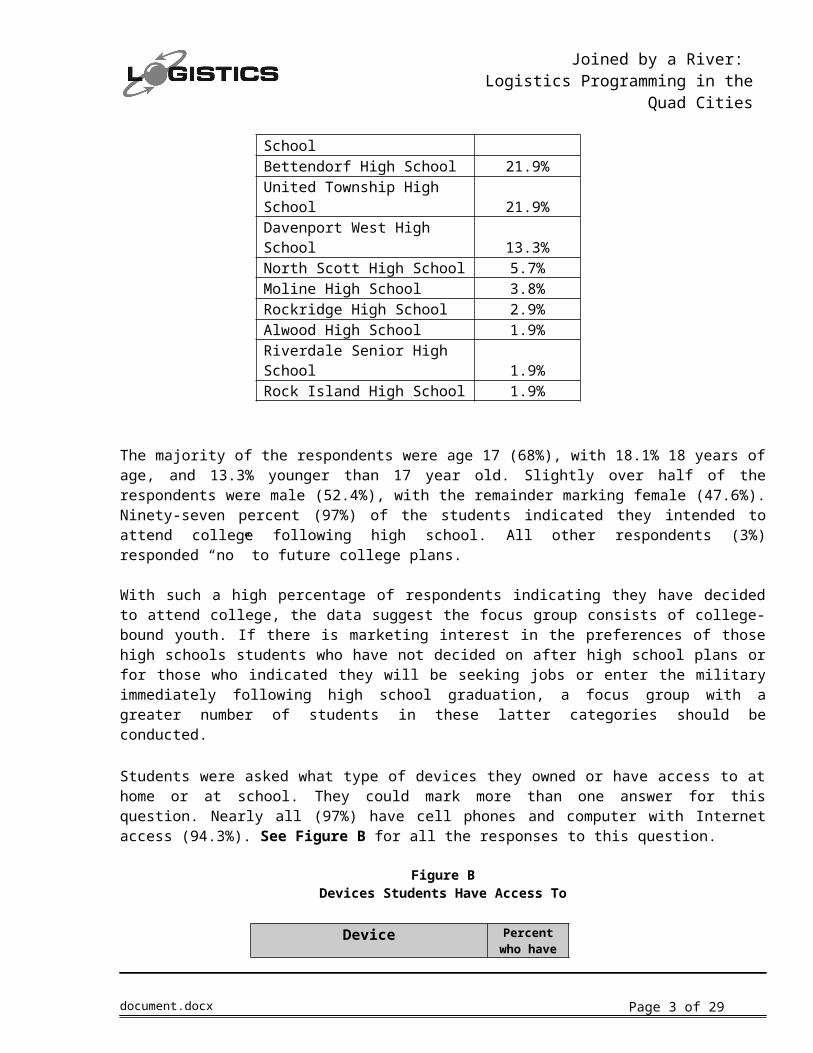
Section 1 – Demographic and Other InformationThe greatest numbers of respondents to the survey were from urban schools: Davenport, Bettendorf and United Township. See Figure A for the breakdown of the high school of origin for the respondents.
Figure A High School Origin of Respondents
High School Attending Percent of total number
Davenport North High School 24.8%Bettendorf High School 21.9%United Township High School 21.9%Davenport West High School 13.3%North Scott High School 5.7%Moline High School 3.8%Rockridge High School 2.9%Alwood High School 1.9%Riverdale Senior High School 1.9%Rock Island High School 1.9%
document.docx Page 2 of 21
Joined by a River: Logistics Programming in the Quad Cities
The majority of the respondents were age 17 (68%), with 18.1% 18 years of age, and 13.3% younger than 17 year old. Slightly over half of the respondents were male (52.4%), with the remainder marking female (47.6%). Ninety-seven percent (97%) of the students indicated they intended to attend college following high school. All other respondents (3%) responded “no” to future college plans.
With such a high percentage of respondents indicating they have decided to attend college, the data suggest the focus group consists of college-bound youth. If there is marketing interest in the preferences of those high schools students who have not decided on after high school plans or for those who indicated they will be seeking jobs or enter the military immediately following high school graduation, a focus group with a greater number of students in these latter categories should be conducted.
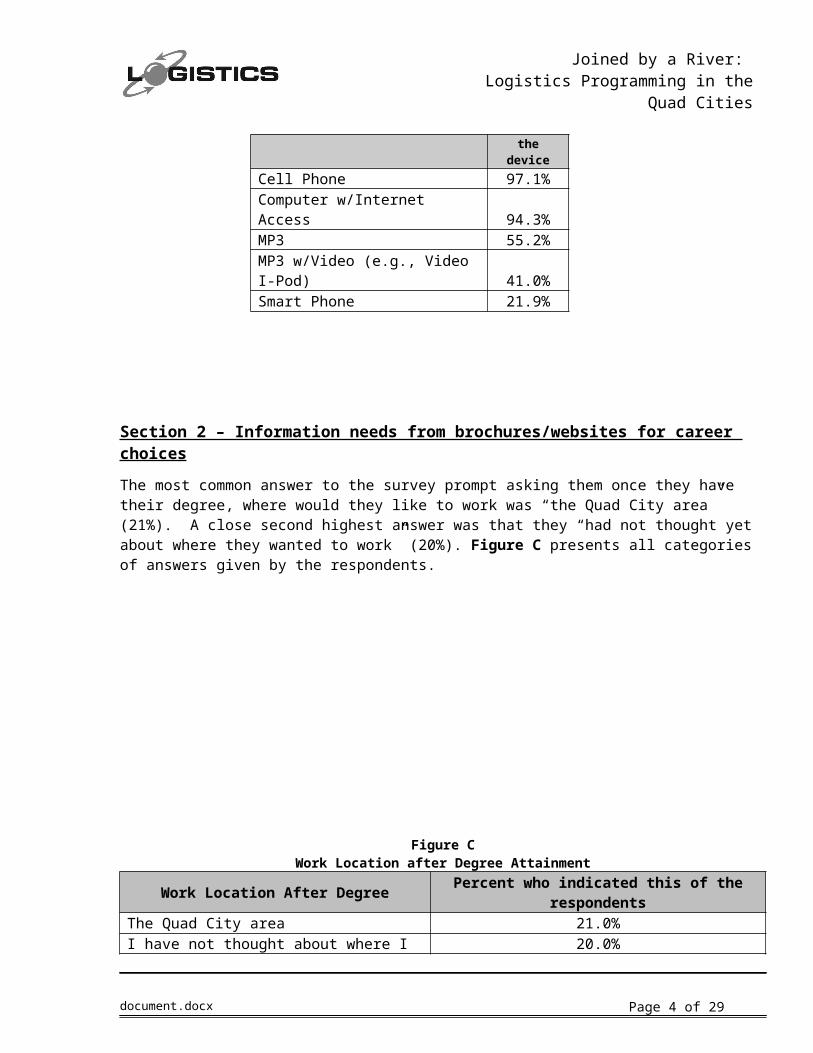
Students were asked what type of devices they owned or have access to at home or at school. They could mark more than one answer for this question. Nearly all (97%) have cell phones and computer with Internet access (94.3%). See Figure B for all the responses to this question.
Figure B Devices Students Have Access To
DevicePercent
who have the device
Cell Phone 97.1%Computer w/Internet Access 94.3%MP3 55.2%MP3 w/Video (e.g., Video I-Pod) 41.0%Smart Phone 21.9%
Section 2 – Information needs from brochures/websites for career choicesThe most common answer to the survey prompt asking them once they have their degree, where would they like to work was “the Quad City area” (21%). A close second highest answer was that they “had not thought yet about where they wanted to work” (20%). Figure C presents all categories of answers given by the respondents.
document.docx Page 3 of 21
Joined by a River: Logistics Programming in the Quad Cities
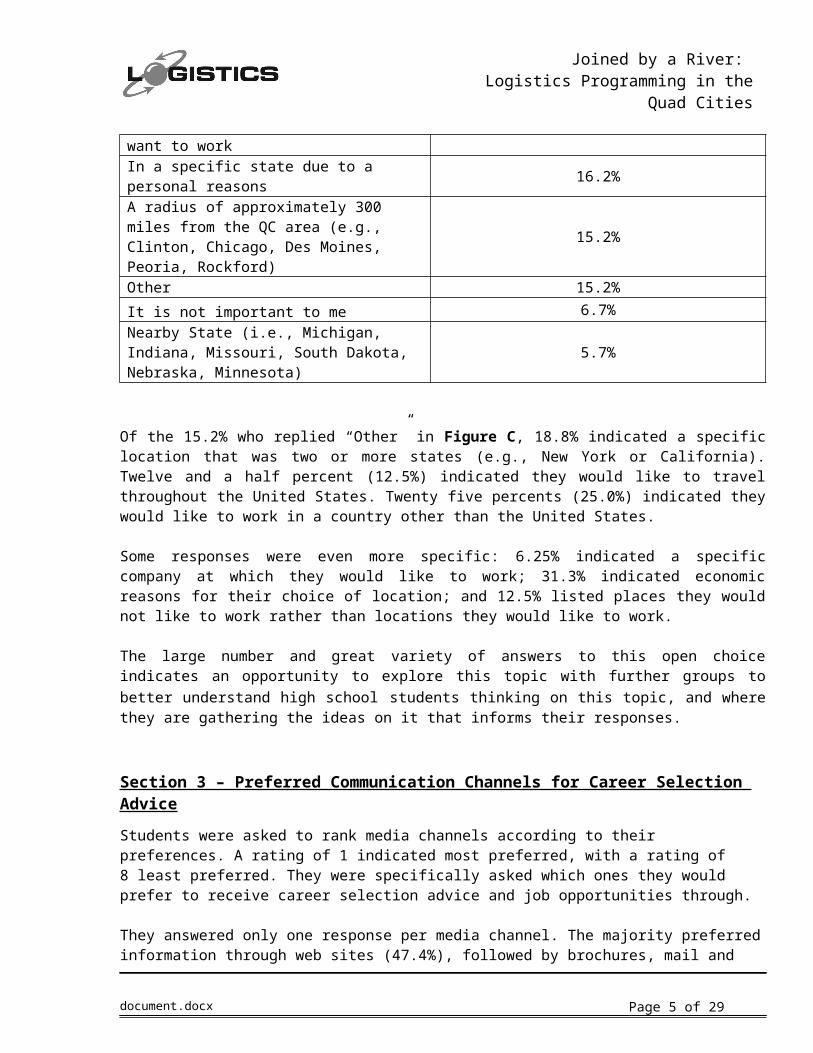
Figure CWork Location after Degree Attainment
Work Location After Degree Percent who indicated this of the respondentsThe Quad City area 21.0%I have not thought about where I want to work 20.0%In a specific state due to a personal reasons 16.2%A radius of approximately 300 miles from the QC area (e.g., Clinton, Chicago, Des Moines, Peoria, Rockford)
15.2%
Other 15.2%
It is not important to me 6.7%Nearby State (i.e., Michigan, Indiana, Missouri, South Dakota, Nebraska, Minnesota)
5.7%
Of the 15.2% who replied “Other” in Figure C, 18.8% indicated a specific location that was two or more states (e.g., New York or California). Twelve and a half percent (12.5%) indicated they would like to travel throughout the United States. Twenty five percents (25.0%) indicated they would like to work in a country other than the United States.
Some responses were even more specific: 6.25% indicated a specific company at which they would like to work; 31.3% indicated economic reasons for their choice of location; and 12.5% listed places they would not like to work rather than locations they would like to work.
The large number and great variety of answers to this open choice indicates an opportunity to explore this topic with further groups to better understand high school students thinking on this topic, and where they are gathering the ideas on it that informs their responses.
Section 3 – Preferred Communication Channels for Career Selection AdviceStudents were asked to rank media channels according to their preferences. A rating of 1 indicated most preferred, with a rating of 8 least preferred. They were specifically asked which ones they would prefer to receive career selection advice and job opportunities through.
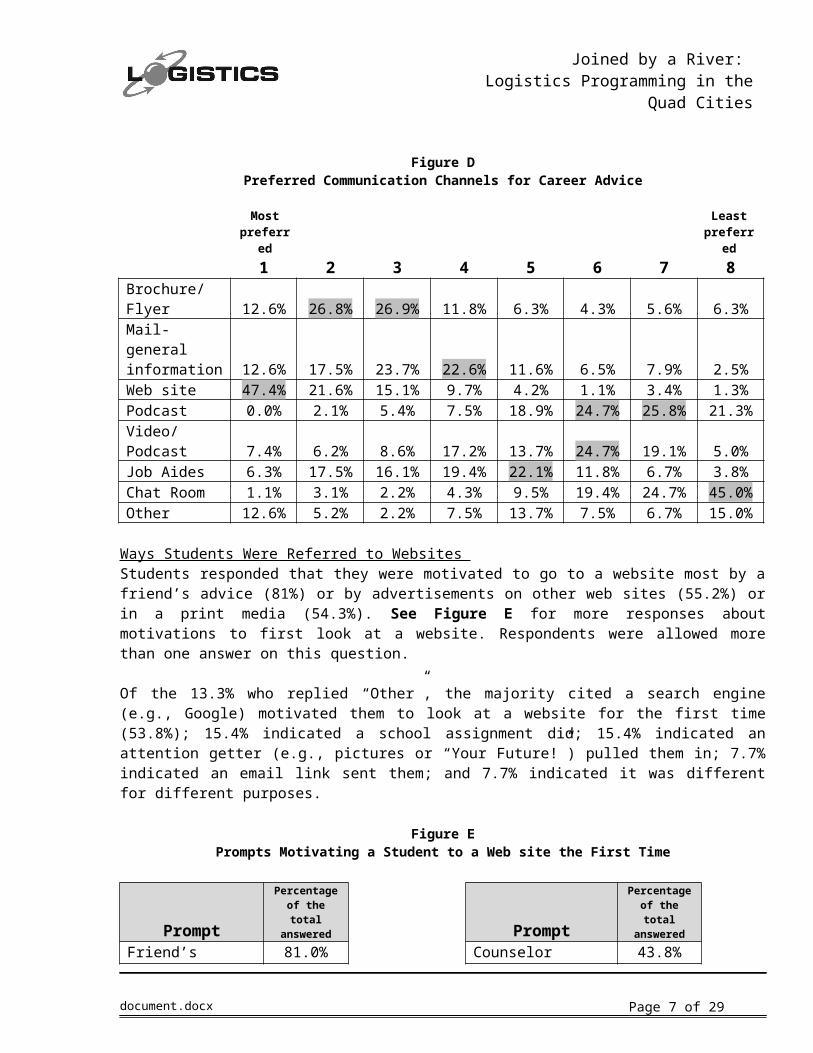
They answered only one response per media channel. The majority preferred information through web sites (47.4%), followed by brochures, mail and other (tied at 12.6%). The least preferred methods were chat rooms (45% marked it as least preferred) and Podcasts (21.3% marked it as least preferred). See Figure D for more specific data on this area. Highlighted cells indicated the highest percentage in that column.
document.docx Page 4 of 21
Joined by a River: Logistics Programming in the Quad Cities
Figure DPreferred Communication Channels for Career Advice
Mostpreferred
Least preferred
1 2 3 4 5 6 7 8Brochure/Flyer 12.6% 26.8% 26.9% 11.8% 6.3% 4.3% 5.6% 6.3%Mail-general information 12.6% 17.5% 23.7% 22.6% 11.6% 6.5% 7.9% 2.5%Web site 47.4% 21.6% 15.1% 9.7% 4.2% 1.1% 3.4% 1.3%Podcast 0.0% 2.1% 5.4% 7.5% 18.9% 24.7% 25.8% 21.3%Video/Podcast 7.4% 6.2% 8.6% 17.2% 13.7% 24.7% 19.1% 5.0%Job Aides 6.3% 17.5% 16.1% 19.4% 22.1% 11.8% 6.7% 3.8%Chat Room 1.1% 3.1% 2.2% 4.3% 9.5% 19.4% 24.7% 45.0%Other 12.6% 5.2% 2.2% 7.5% 13.7% 7.5% 6.7% 15.0%
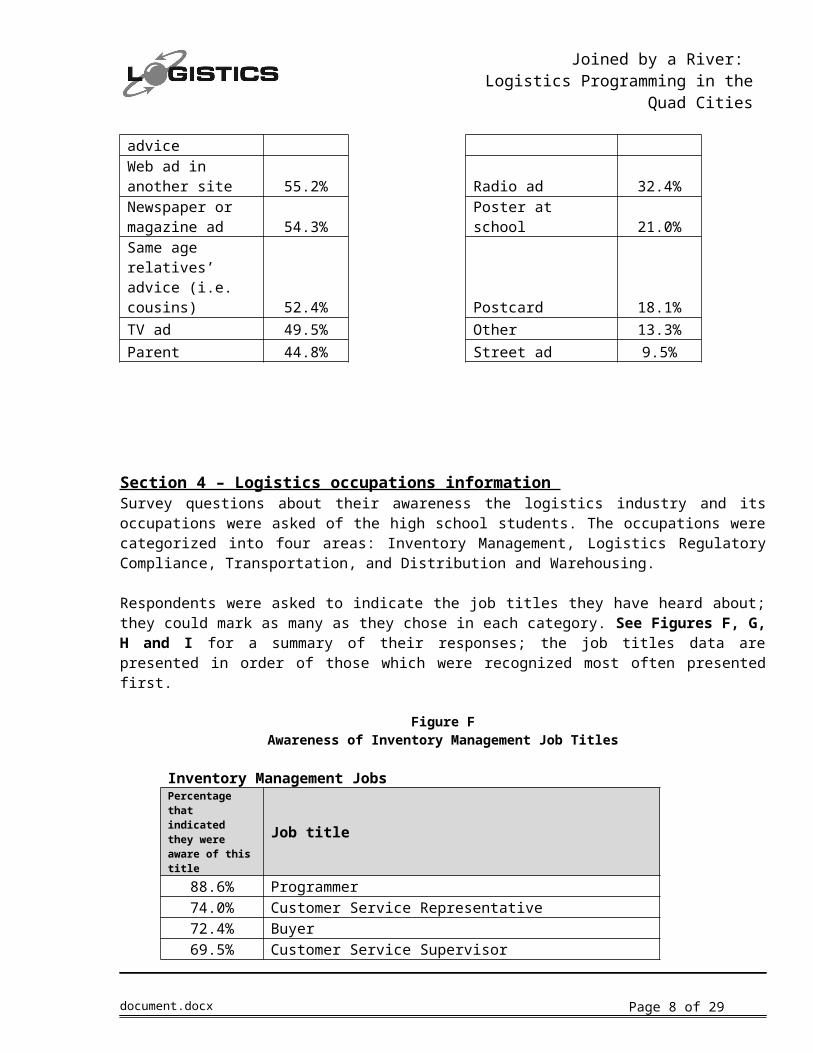
Ways Students Were Referred to Websites Students responded that they were motivated to go to a website most by a friend’s advice (81%) or by advertisements on other web sites (55.2%) or in a print media (54.3%). See Figure E for more responses about motivations to first look at a website. Respondents were allowed more than one answer on this question.
Of the 13.3% who replied “Other”, the majority cited a search engine (e.g., Google) motivated them to look at a website for the first time (53.8%); 15.4% indicated a school assignment did; 15.4% indicated an attention getter (e.g., pictures or “Your Future!”) pulled them in; 7.7% indicated an email link sent them; and 7.7% indicated it was different for different purposes.
Figure EPrompts Motivating a Student to a Web site the First Time
PromptPercentage of the total answered Prompt
Percentage of the total answered
Friend’s advice 81.0% Counselor 43.8%Web ad in another site 55.2% Radio ad 32.4%Newspaper or magazine ad 54.3% Poster at school 21.0%Same age relatives’ advice (i.e. cousins) 52.4% Postcard 18.1%TV ad 49.5% Other 13.3%Parent 44.8% Street ad 9.5%
Section 4 – Logistics occupations information
document.docx Page 5 of 21
Joined by a River: Logistics Programming in the Quad Cities
Survey questions about their awareness the logistics industry and its occupations were asked of the high school students. The occupations were categorized into four areas: Inventory Management, Logistics Regulatory Compliance, Transportation, and Distribution and Warehousing.
Respondents were asked to indicate the job titles they have heard about; they could mark as many as they chose in each category. See Figures F, G, H and I for a summary of their responses; the job titles data are presented in order of those which were recognized most often presented first.
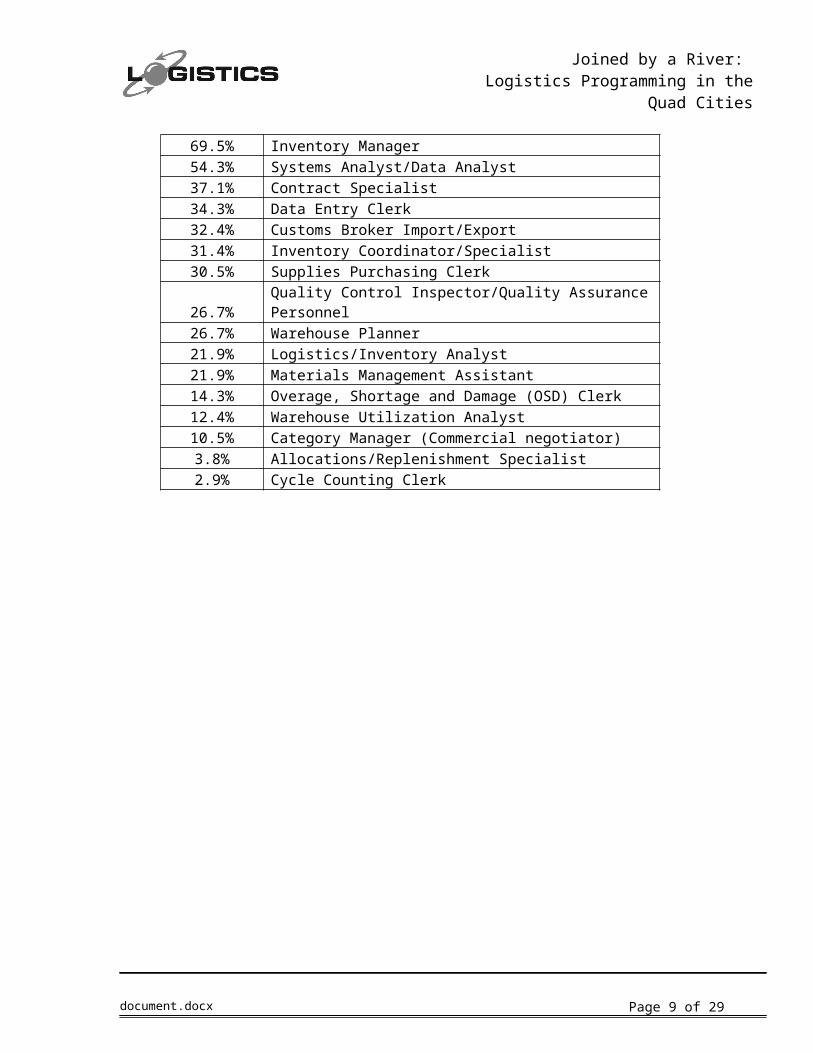
Figure FAwareness of Inventory Management Job Titles
Inventory Management JobsPercentage that indicated they were aware of this title
Job title
88.6% Programmer74.0% Customer Service Representative72.4% Buyer69.5% Customer Service Supervisor69.5% Inventory Manager54.3% Systems Analyst/Data Analyst37.1% Contract Specialist34.3% Data Entry Clerk32.4% Customs Broker Import/Export31.4% Inventory Coordinator/Specialist30.5% Supplies Purchasing Clerk26.7% Quality Control Inspector/Quality Assurance Personnel26.7% Warehouse Planner21.9% Logistics/Inventory Analyst21.9% Materials Management Assistant14.3% Overage, Shortage and Damage (OSD) Clerk12.4% Warehouse Utilization Analyst10.5% Category Manager (Commercial negotiator)3.8% Allocations/Replenishment Specialist2.9% Cycle Counting Clerk
document.docx Page 6 of 21
Joined by a River: Logistics Programming in the Quad Cities
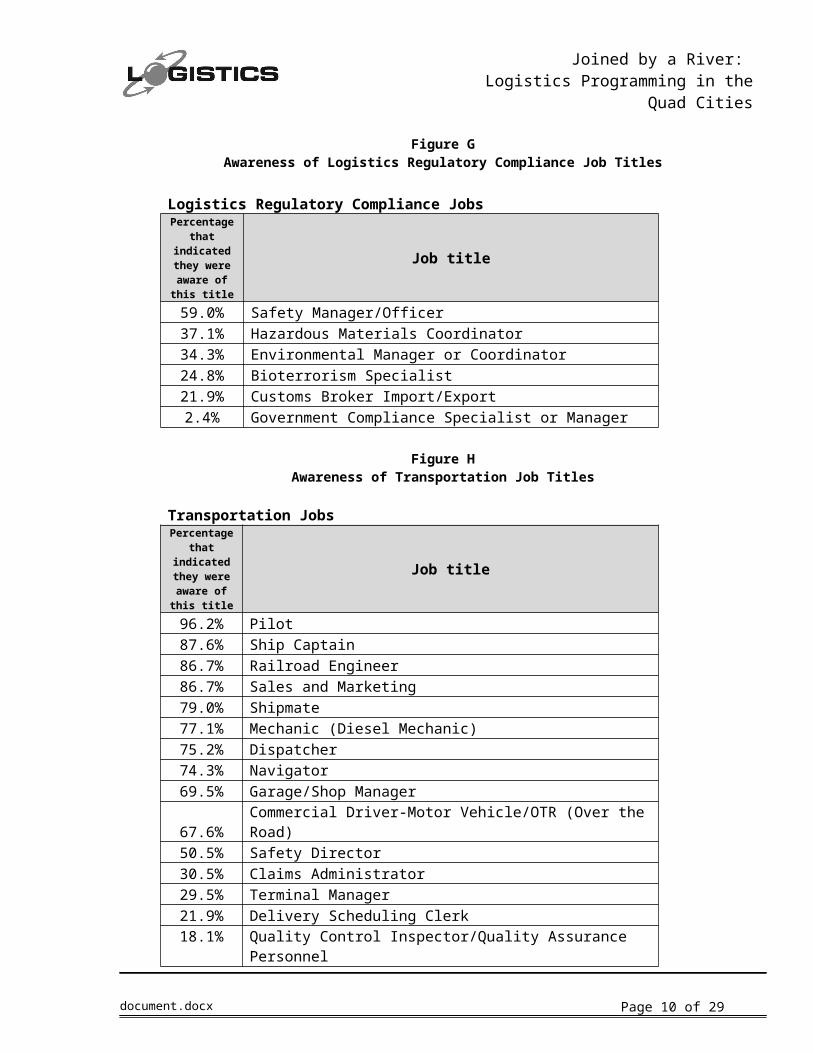
Figure GAwareness of Logistics Regulatory Compliance Job Titles
Logistics Regulatory Compliance JobsPercentage
that indicated they were
aware of this title
Job title
59.0% Safety Manager/Officer37.1% Hazardous Materials Coordinator34.3% Environmental Manager or Coordinator24.8% Bioterrorism Specialist21.9% Customs Broker Import/Export2.4% Government Compliance Specialist or Manager
Figure H
Awareness of Transportation Job Titles
Transportation JobsPercentage
that indicated they were
aware of this title
Job title
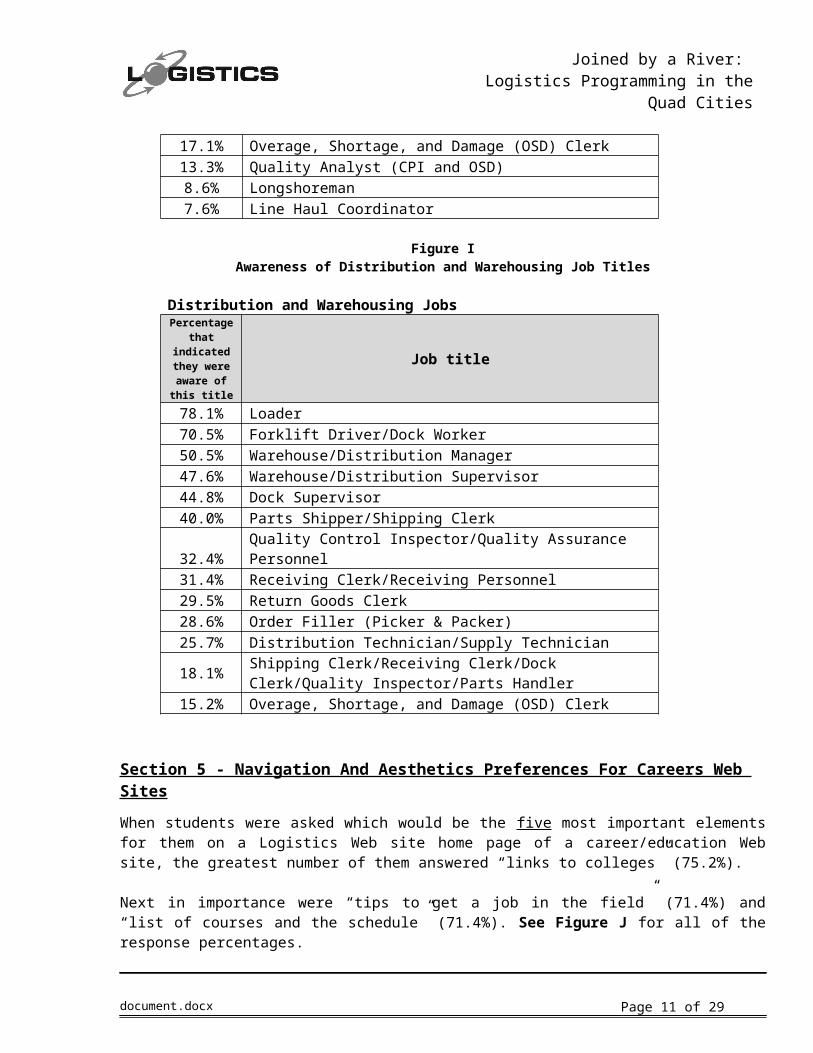
96.2% Pilot87.6% Ship Captain86.7% Railroad Engineer86.7% Sales and Marketing79.0% Shipmate77.1% Mechanic (Diesel Mechanic)75.2% Dispatcher74.3% Navigator69.5% Garage/Shop Manager67.6% Commercial Driver-Motor Vehicle/OTR (Over the Road)50.5% Safety Director30.5% Claims Administrator29.5% Terminal Manager21.9% Delivery Scheduling Clerk18.1% Quality Control Inspector/Quality Assurance Personnel17.1% Overage, Shortage, and Damage (OSD) Clerk13.3% Quality Analyst (CPI and OSD)8.6% Longshoreman7.6% Line Haul Coordinator
Figure I
document.docx Page 7 of 21
Joined by a River: Logistics Programming in the Quad Cities
Awareness of Distribution and Warehousing Job Titles
Distribution and Warehousing JobsPercentage
that indicated they were
aware of this title
Job title
78.1% Loader70.5% Forklift Driver/Dock Worker50.5% Warehouse/Distribution Manager47.6% Warehouse/Distribution Supervisor44.8% Dock Supervisor40.0% Parts Shipper/Shipping Clerk32.4% Quality Control Inspector/Quality Assurance Personnel31.4% Receiving Clerk/Receiving Personnel29.5% Return Goods Clerk28.6% Order Filler (Picker & Packer)25.7% Distribution Technician/Supply Technician
18.1% Shipping Clerk/Receiving Clerk/Dock Clerk/Quality Inspector/Parts Handler
15.2% Overage, Shortage, and Damage (OSD) Clerk
Section 5 - Navigation And Aesthetics Preferences For Careers Web SitesWhen students were asked which would be the five most important elements for them on a Logistics Web site home page of a career/education Web site, the greatest number of them answered “links to colleges” (75.2%).
Next in importance were “tips to get a job in the field” (71.4%) and “list of courses and the schedule” (71.4%). See Figure J for all of the response percentages.
The table presents the information from those cited most often as more important to those cited least often.
document.docx Page 8 of 21
Joined by a River: Logistics Programming in the Quad Cities
Figure JStudent Preferences for Home Site Page Elements
When questioned about placement of the main menu of a website, survey respondents choose “top” by a great majority (74.8%). See Figure K for the percentages for all their responses. They were to choose one answer only.
Figure KHigh School Students Preference for the Placement of a Main Menu
Main Menu Placement PercentTop 74.8%Left 20.4%Bottom 2.9%Right 1.9%
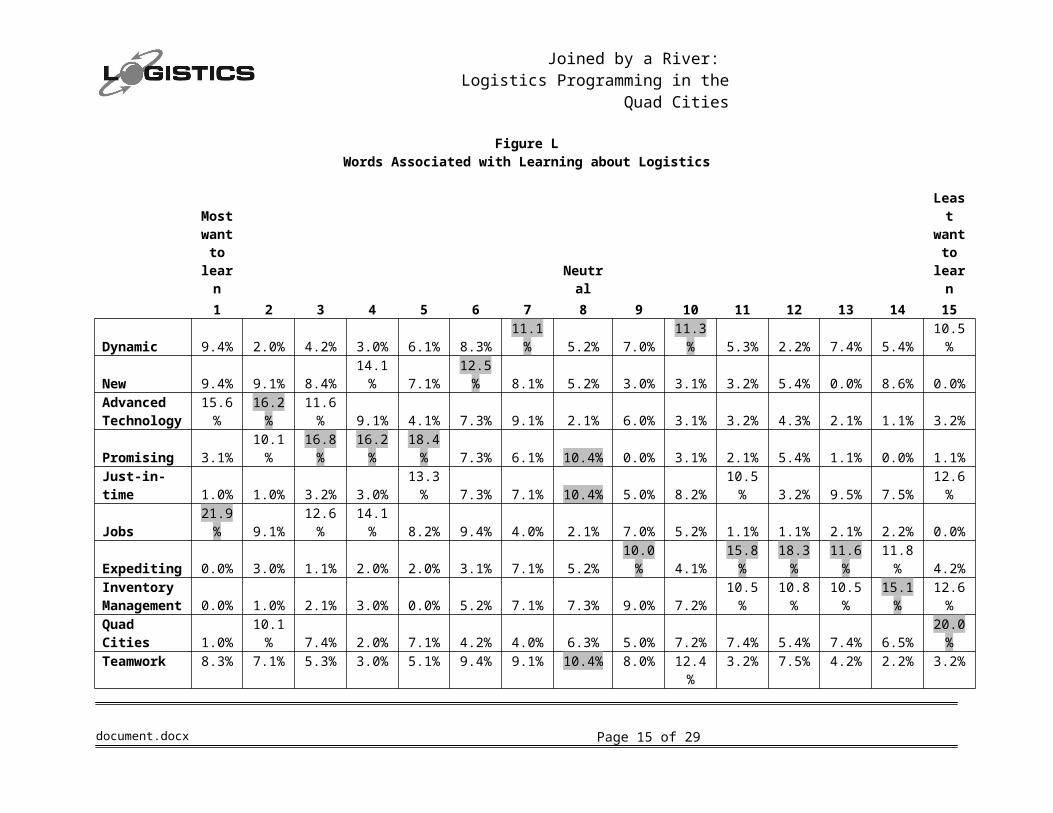
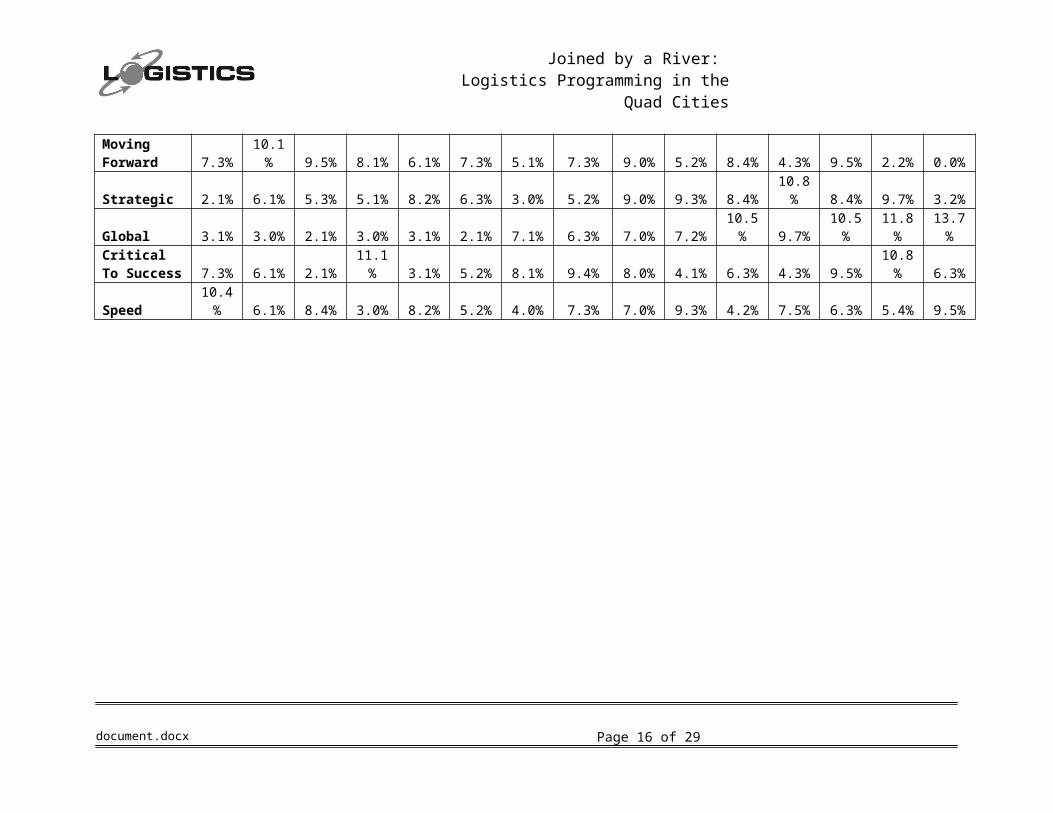
Words Associated with Learning about LogisticsStudents were asked to rank a list words in order from 1 to 15, with 1 being the word or phrase that most makes them want to learn about logistics. See Figure L for their responses. Only one circle was allowed to be filled per row. “Jobs” had the most positive rankings and “expediting” had the least positive ranking.
document.docx Page 9 of 21
Home Site Page Elements
Percentage of
students that
indicated this
elementLinks to colleges 75.2%Tips to get a job in the field 71.4%List of courses and the schedule 71.4%Search engine 55.2%Links to job sites (i.e., Monster, CareerBuilder) 48.1%In-depth explanation of featured programs at local schools 40.0%Featured Area Employer 35.6%Last posting in related jobs 27.6%Feature Nationwide Employer 26.7%Videos/Testimonials of field workers 19.0%Videos/Testimonials of current logistics students 16.2%Videos/Testimonials of prospective employers 13.5%
Joined by a River: Logistics Programming in the Quad Cities
Figure L Words Associated with Learning about Logistics
Most want
to learn
Neutral
Least want
to learn
1 2 3 4 5 6 7 8 9 10 11 12 13 14 15
Dynamic 9.4% 2.0% 4.2% 3.0% 6.1% 8.3%11.1% 5.2% 7.0%
11.3% 5.3% 2.2% 7.4% 5.4%
10.5%
New 9.4% 9.1% 8.4%14.1% 7.1%
12.5% 8.1% 5.2% 3.0% 3.1% 3.2% 5.4% 0.0% 8.6% 0.0%
Advanced Technology
15.6%
16.2%
11.6% 9.1% 4.1% 7.3% 9.1% 2.1% 6.0% 3.1% 3.2% 4.3% 2.1% 1.1% 3.2%
Promising 3.1%10.1%
16.8%
16.2%
18.4% 7.3% 6.1% 10.4% 0.0% 3.1% 2.1% 5.4% 1.1% 0.0% 1.1%
Just-in-time 1.0% 1.0% 3.2% 3.0%13.3% 7.3% 7.1% 10.4% 5.0% 8.2%
10.5% 3.2% 9.5% 7.5%
12.6%
Jobs21.9% 9.1%
12.6%
14.1% 8.2% 9.4% 4.0% 2.1% 7.0% 5.2% 1.1% 1.1% 2.1% 2.2% 0.0%
Expediting 0.0% 3.0% 1.1% 2.0% 2.0% 3.1% 7.1% 5.2%10.0% 4.1%
15.8%
18.3%
11.6%
11.8% 4.2%
Inventory Management 0.0% 1.0% 2.1% 3.0% 0.0% 5.2% 7.1% 7.3% 9.0% 7.2%
10.5%
10.8%
10.5%
15.1%
12.6%
Quad Cities 1.0%10.1% 7.4% 2.0% 7.1% 4.2% 4.0% 6.3% 5.0% 7.2% 7.4% 5.4% 7.4% 6.5%
20.0%
Teamwork 8.3% 7.1% 5.3% 3.0% 5.1% 9.4% 9.1% 10.4% 8.0%12.4% 3.2% 7.5% 4.2% 2.2% 3.2%
Moving Forward 7.3%
10.1% 9.5% 8.1% 6.1% 7.3% 5.1% 7.3% 9.0% 5.2% 8.4% 4.3% 9.5% 2.2% 0.0%
Strategic 2.1% 6.1% 5.3% 5.1% 8.2% 6.3% 3.0% 5.2% 9.0% 9.3% 8.4%10.8% 8.4% 9.7% 3.2%
Global 3.1% 3.0% 2.1% 3.0% 3.1% 2.1% 7.1% 6.3% 7.0% 7.2%10.5% 9.7%
10.5%
11.8%
13.7%
Critical To Success 7.3% 6.1% 2.1%
11.1% 3.1% 5.2% 8.1% 9.4% 8.0% 4.1% 6.3% 4.3% 9.5%
10.8% 6.3%
document.docx Page 10 of 21
Joined by a River: Logistics Programming in the Quad Cities
Speed10.4% 6.1% 8.4% 3.0% 8.2% 5.2% 4.0% 7.3% 7.0% 9.3% 4.2% 7.5% 6.3% 5.4% 9.5%
document.docx Page 11 of 21
Joined by a River: Logistics Programming in the Quad Cities
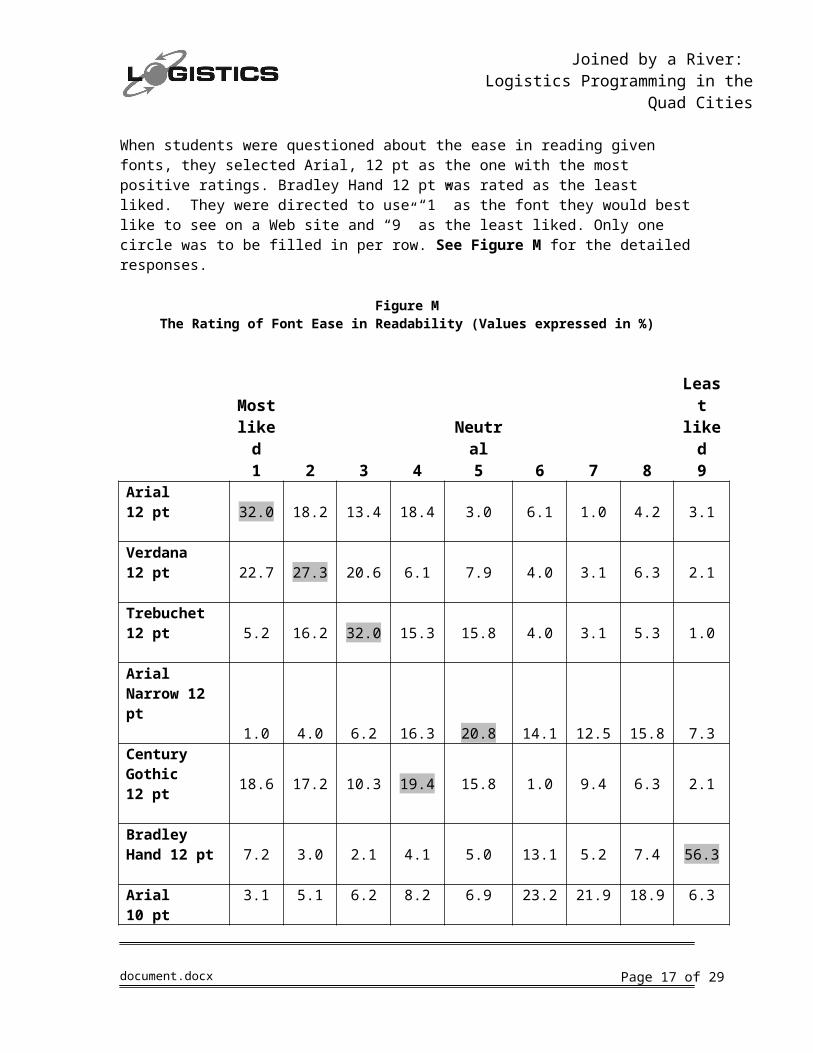
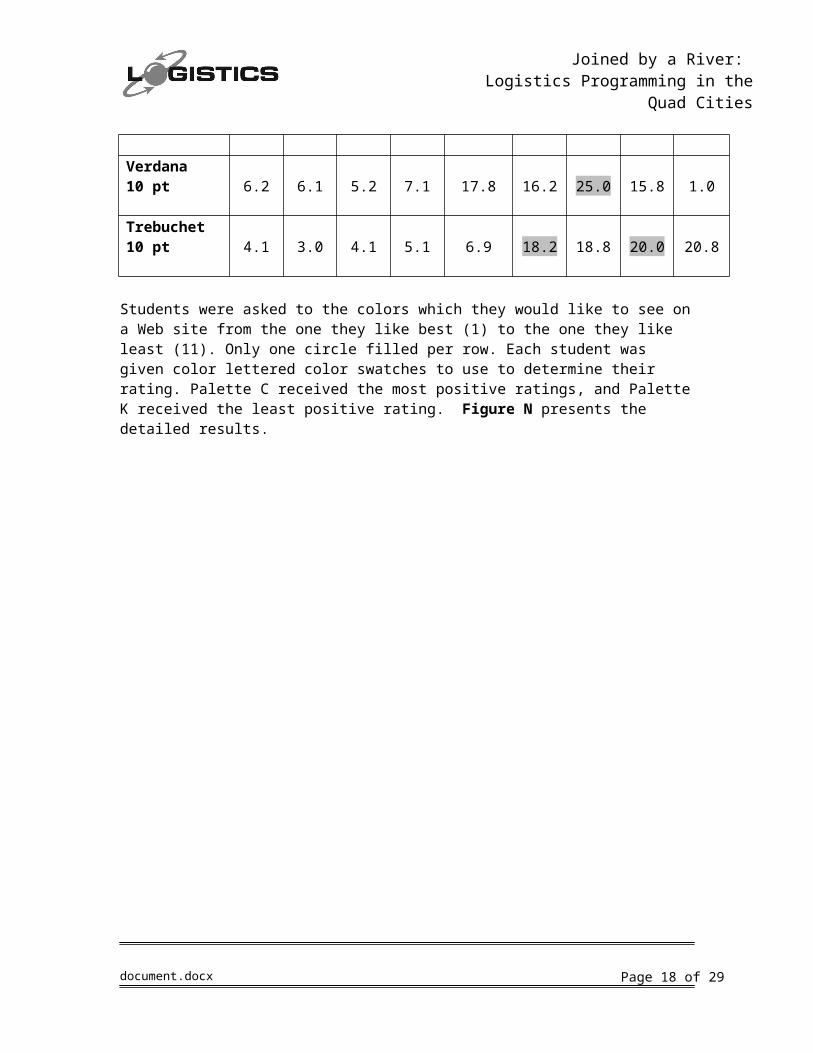
When students were questioned about the ease in reading given fonts, they selected Arial, 12 pt as the one with the most positive ratings. Bradley Hand 12 pt was rated as the least liked. They were directed to use “1” as the font they would best like to see on a Web site and “9” as the least liked. Only one circle was to be filled in per row. See Figure M for the detailed responses.
Figure MThe Rating of Font Ease in Readability (Values expressed in %)
Most liked
Neutral
Least
liked1 2 3 4 5 6 7 8 9
Arial 12 pt 32.0 18.2 13.4 18.4 3.0 6.1 1.0 4.2 3.1
Verdana 12 pt 22.7 27.3 20.6 6.1 7.9 4.0 3.1 6.3 2.1
Trebuchet 12 pt 5.2 16.2 32.0 15.3 15.8 4.0 3.1 5.3 1.0
Arial Narrow 12 pt
1.0 4.0 6.2 16.3 20.8 14.1 12.5 15.8 7.3Century Gothic12 pt 18.6 17.2 10.3 19.4 15.8 1.0 9.4 6.3 2.1
Bradley Hand 12 pt 7.2 3.0 2.1 4.1 5.0 13.1 5.2 7.4 56.3
Arial 10 pt 3.1 5.1 6.2 8.2 6.9 23.2 21.9 18.9 6.3
Verdana 10 pt 6.2 6.1 5.2 7.1 17.8 16.2 25.0 15.8 1.0
Trebuchet 10 pt 4.1 3.0 4.1 5.1 6.9 18.2 18.8 20.0 20.8
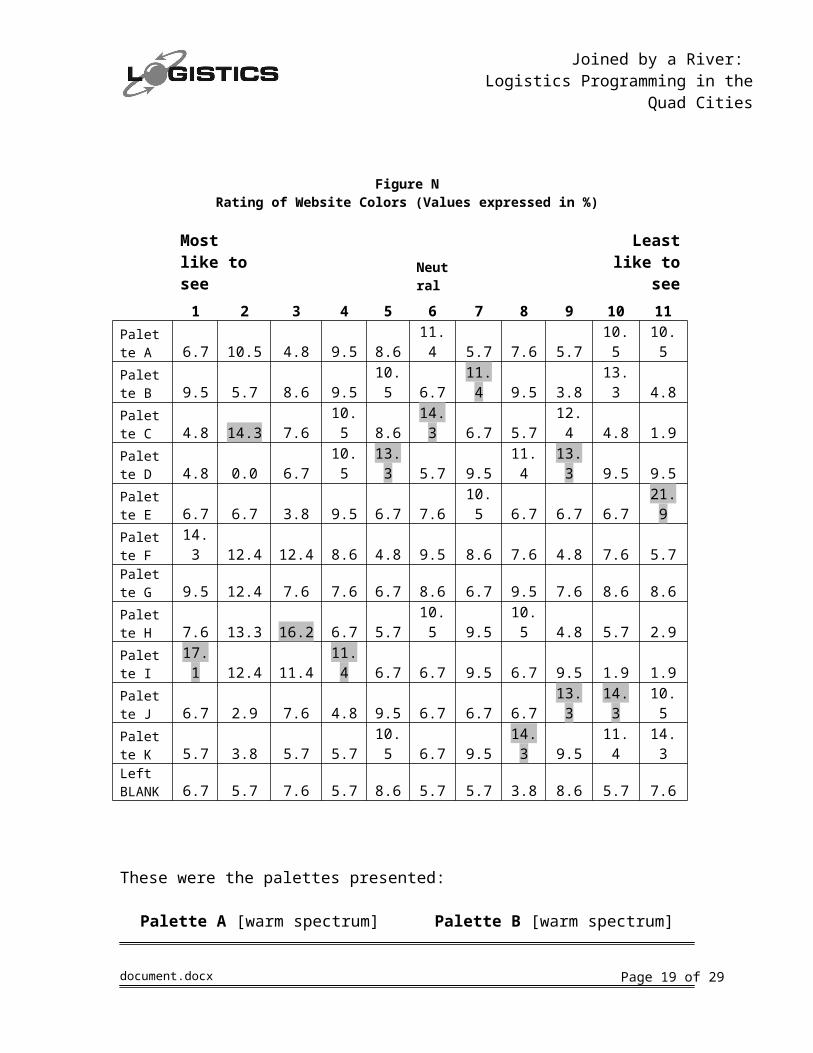
Students were asked to the colors which they would like to see on a Web site from the one they like best (1) to the one they like least (11). Only one circle filled per row. Each student was given color lettered color swatches to use to determine their rating. Palette C received the most positive ratings, and Palette K received the least positive rating. Figure N presents the detailed results.
document.docx Page 12 of 21

Joined by a River: Logistics Programming in the Quad Cities
Figure NRating of Website Colors (Values expressed in %)
Most like to see
Neutral
Least like to see
1 2 3 4 5 6 7 8 9 10 11Palette A 6.7 10.5 4.8 9.5 8.6 11.4 5.7 7.6 5.7 10.5 10.5Palette B 9.5 5.7 8.6 9.5
10.5 6.7 11.4 9.5 3.8 13.3 4.8
Palette C 4.8 14.3 7.6 10.5 8.6 14.3 6.7 5.7 12.4 4.8 1.9Palette D 4.8 0.0 6.7 10.5
13.3 5.7 9.5 11.4 13.3 9.5 9.5
Palette E 6.7 6.7 3.8 9.5 6.7 7.6 10.5 6.7 6.7 6.7 21.9Palette F 14.3 12.4 12.4 8.6 4.8 9.5 8.6 7.6 4.8 7.6 5.7Palette G 9.5 12.4 7.6 7.6 6.7 8.6 6.7 9.5 7.6 8.6 8.6Palette H 7.6 13.3 16.2 6.7 5.7 10.5 9.5 10.5 4.8 5.7 2.9Palette I 17.1 12.4 11.4 11.4 6.7 6.7 9.5 6.7 9.5 1.9 1.9Palette J 6.7 2.9 7.6 4.8 9.5 6.7 6.7 6.7 13.3 14.3 10.5Palette K 5.7 3.8 5.7 5.7
10.5 6.7 9.5 14.3 9.5 11.4 14.3
Left BLANK 6.7 5.7 7.6 5.7 8.6 5.7 5.7 3.8 8.6 5.7 7.6
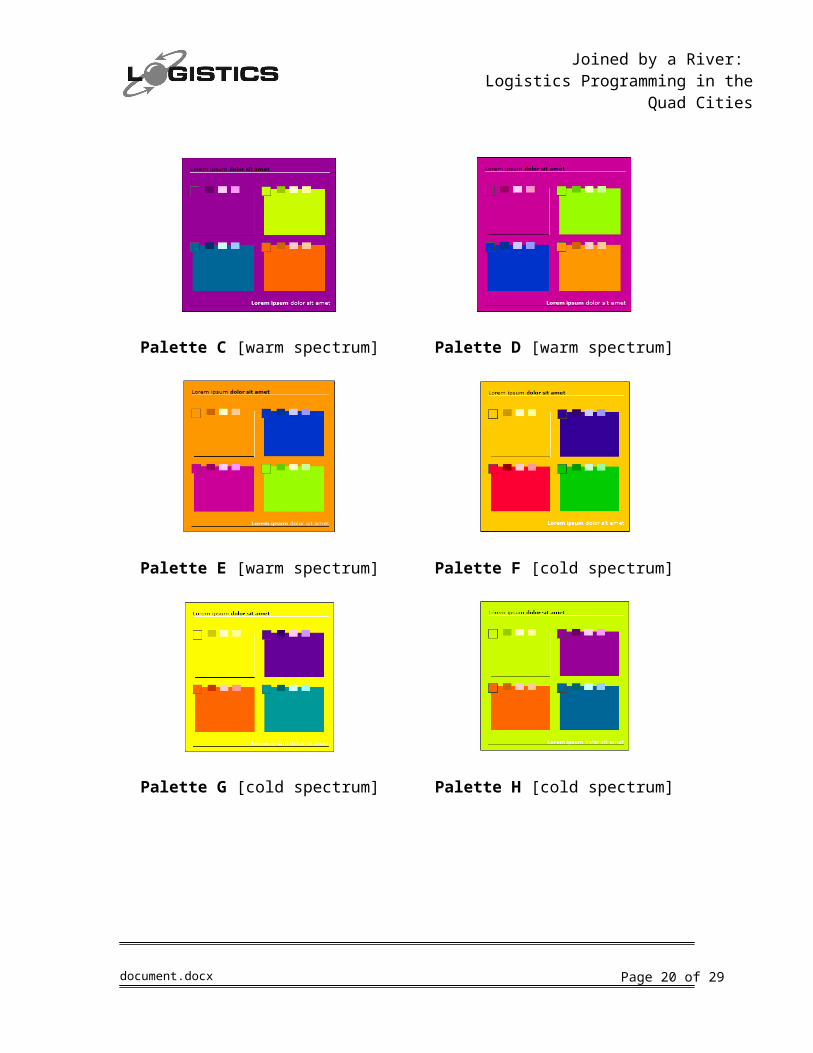
These were the palettes presented:
Palette A [warm spectrum] Palette B [warm spectrum]
document.docx Page 13 of 21
Joined by a River: Logistics Programming in the Quad Cities
Palette C [warm spectrum] Palette D [warm spectrum]
Palette E [warm spectrum] Palette F [cold spectrum]
Palette G [cold spectrum] Palette H [cold spectrum]
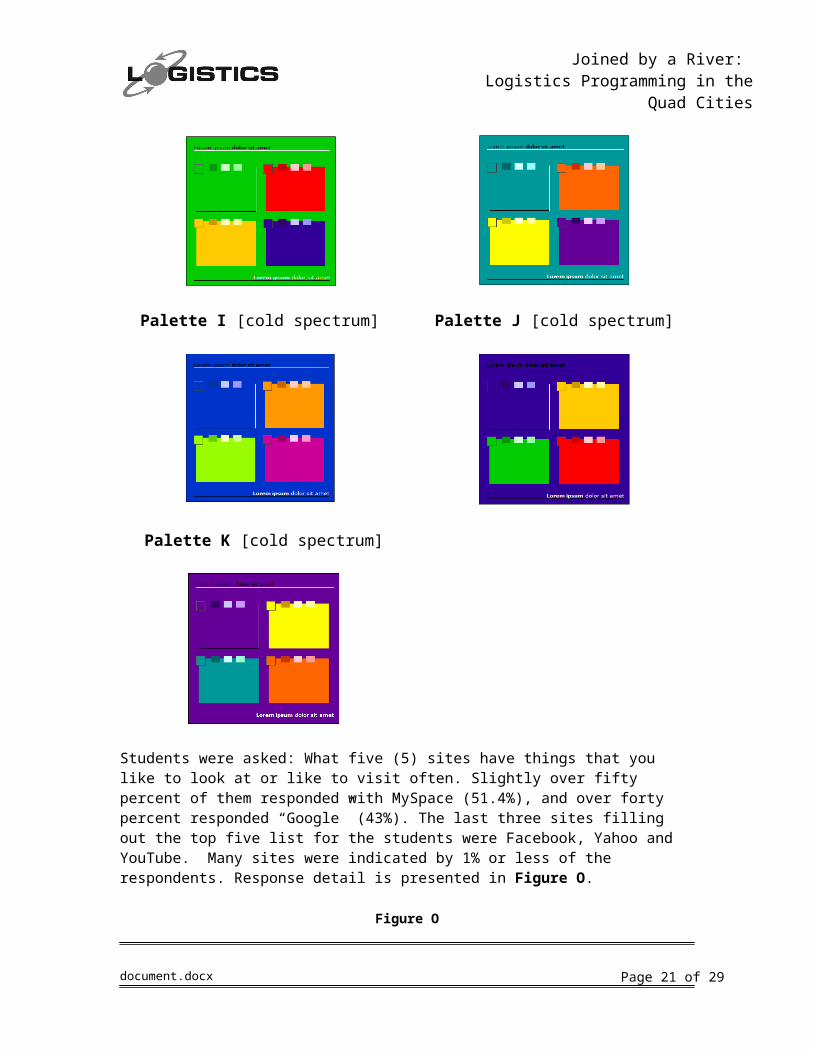
Palette I [cold spectrum] Palette J [cold spectrum]
document.docx Page 14 of 21
Joined by a River: Logistics Programming in the Quad Cities
Palette K [cold spectrum]
Students were asked: What five (5) sites have things that you like to look at or like to visit often. Slightly over fifty percent of them responded with MySpace (51.4%), and over forty percent responded “Google” (43%). The last three sites filling out the top five list for the students were Facebook, Yahoo and YouTube. Many sites were indicated by 1% or less of the respondents. Response detail is presented in Figure O.
Figure O
Websites Visited Often by Survey RespondentsURL Percentwww.myspace.com 51.4%www.google.com 43.8%www.facebook.com 35.2%www.yahoo.com 26.7%www.youtube.com 25.7%www.hotmail.com 9.5%www.msn.com 8.6%Gaming Websites 5.7%www.Ebay.com 4.8%www.espn.com 4.8%www.QCTimes.com 3.8%www.bestbuy.com 2.9%www.gmail.com 2.9%www.uiowa.edu 2.9%Askjeeves 1.9%Car Images 1.9%Music sites 1.9%Scholarship websites 1.9%uths.revealed.net 1.9%www.ask.com 1.9%
URL Percentwww.bettendorf.k12.ia.us 1.9%www.break.com 1.9%www.cnn.com 1.9%www.ebaumsworld.com 1.9%www.ebaymotors.com 1.9%www.ihmvcu.com 1.9%www.itunes.com 1.9%www.kwqc.com 1.9%www.meebo.com 1.9%www.monster.com 1.9%www.msnbc.com 1.9%www.NFL.com/NBA 1.9%www.uths.revealed.net 1.9%www.webmd.com 1.9%www.wikipedia.com 1.9%www.zwinky.com 1.9%ACT 1.0%Anime Sites 1.0%Careers 1.0%Civil Engineering 1.0%
document.docx Page 15 of 21
Joined by a River: Logistics Programming in the Quad Cities
URL PercentCo2 Car 1.0%College sites 1.0%Drag Racer v3 1.0%EMT 1.0%Funny Videos 1.0%gamestop.com 1.0%hiphopreaction.com 1.0%Hollister Clothing Company 1.0%http://games.yahoo.com 1.0%Law enforcement 1.0%MSOE 1.0%newesg 1.0%nycareerzone.com 1.0%Pizza Hut 1.0%Poetry Sites 1.0%School/Grade site (not specified) 1.0%Sites to do my homework 1.0%Sports Sites 1.0%Translater 1.0%unforgotten-realms.com 1.0%used to like E-baums world 1.0%Vampires 1.0%
Waste basket basketball, cykrom airtos 1.0%worldofwarcraft.com 1.0%www.addictinggames.com 1.0%www.AIM.com 1.0%www.allhiphop.com 1.0%www.Alwood.net 1.0%www.aol.com 1.0%www.asus.com 1.0%www.augustana.edu 1.0%www.Azlyrics.com 1.0%www.bet.com 1.0%www.bettendorf.ia.us 1.0%www.budgetplus.com 1.0%www.candyland.com 1.0%www.cankicks.com 1.0%
URL Percentwww.Cheeseburgers.com 1.0%www.collegesearch.com 1.0%www.complexmagazine 1.0%www.cordovadrag.com 1.0%www.davenportschools.org 1.0%www.dictionary.com 1.0%www.echoices.com 1.0%www.eKnowledge.com 1.0%www.electronic.com 1.0%www.fanfiction.net 1.0%www.flotrack.com 1.0%www.funny.com 1.0%www.funnyordie.com 1.0%www.gamefly.com 1.0%www.gamesloth.com 1.0%www.gandermountain.com 1.0%www.greenbaypackers.com 1.0%www.Iapreps.com 1.0%www.initiald-arcade.com 1.0%www.Iowapreps/rivals.com 1.0%www.ivhs.org 1.0%www.jeffscarcorner.com 1.0%www.jokes.com 1.0%www.latina.com 1.0%www.lincolntech.com 1.0%www.livejournal.com 1.0%www.lyrics.com 1.0%www.mailyahoo.com 1.0%www.mapmyrun.com 1.0%www.mapquest.com 1.0%www.mchsi.com 1.0%www.memphiscaraudio.com 1.0%www.memphiscaraudioi.com 1.0%www.microsoft.com 1.0%www.miniclip.com 1.0%www.mtv.com 1.0%www.mxtabs.com 1.0%www.myyearbook.com 1.0%
document.docx Page 16 of 21
Joined by a River: Logistics Programming in the Quad Cities
www.newegg.com 1.0%www.newgrounds.com 1.0%www.newyorkjets.com 1.0%www.p2p.org 1.0%www.planningyourfuture.org 1.0%www.primarygames.com 1.0%www.Qconline.com 1.0%www.qconlineauctions.com 1.0%www.qcorg.com 1.0%www.rhapsody.com 1.0%www.sau.edu 1.0%www.seanjohn.com 1.0%www.seventeen.com 1.0%www.shoes-res.com 1.0%www.sneakerfreaker.com 1.0%www.stockquest.com 1.0%www.tablegames.com 1.0%www.Themoonlitroad.com 1.0%www.thumpertalk.com 1.0%www.topgames.net 1.0%www.topgamez.net 1.0%
www.tronsworldmotocross.com 1.0%www.ultimex-guitar.com 1.0%www.unitedoffroadracing.com 1.0%www.Univision.com 1.0%www.upsjobs.com 1.0%www.us.army.mil 1.0%www.uscellular.com 1.0%www.uthsrevealed.net 1.0%www.vampirefreaks.com 1.0%www.vh1.com 1.0%www.walmart.com 1.0%www.weather.com 1.0%www.wellsfargo.com 1.0%www.whaletail.com 1.0%www.wnclogyChannel.com 1.0%
Note: These websites URL were copied from the student’s answer sheets, except for the top ten most visited websites, we haven’t check their content.
4. Information gathered from verbal responses
Focus groups discussions were held with five groups of students from Bettendorf High School, Davenport North High School, Davenport West High School, North Scott High School, and United Township High School.
First associations shared orally with the presenter:
When thinking about a career - Students were asked: what grabs your attention when you think about a career. The answers given with the greatest frequency by the students was salary and benefits, followed closely by location and work environment.
document.docx Page 17 of 21
Joined by a River: Logistics Programming in the Quad Cities
Several students also reported they associate growth/advancement opportunities, the education needed to enter the field, and the opportunity to work outdoors when considering a career.
Information needed to choose a career – There were a great number of unique ideas expressed when students were asked what information they needed when considering a career.
The most frequent response was salary, work environment, training/education required, and job duties.
The other responses (one person each) were: career growth, possible employers, employee turnover, skills needed, list of companies who employ the occupation, talking with others, internet job review information, training video, one on one presentation, company reputation, and job security.
Elements that factor in the decision on what college to attend - Students indicated that the availability of the program and courses they were interested in is the most important element they look for, followed by the college’s reputation or ranking.
Cost was second, and location (close to home) was third most frequently mentioned. Family referral and peer relationships tied with student/teacher ration for fourth most frequently answered.
Unique replies included size of the student population of the college, athletics, length of the program of study, scholarship availability, and parental influence.
Places to obtain information about jobs - Overwhelmingly, students cited newspapers as the place they would turn to when looking for a job. This was followed closely by conversations with people: people they know and can network with, and their guidance counselors and teachers, in that order.
The internet, specifically Monster, was mentioned equally often as people were. Television and radio advertisements, billboards, career fairs, and flyers were all mention by more than once student.
Unique answers included the Chamber of Commerce, stopping by the business and high school classes.
Website factors that attract students - The responses the students gave when asked what keeps their interest as they look at a website can be categorized into three areas: appearance, content and site features. By far the greatest number of comments referred to the content; the features of the site and
document.docx Page 18 of 21
Joined by a River: Logistics Programming in the Quad Cities
appearance had equal numbers of mention.
See the table below for a summation of the responses by category; the listing of comments within each category does not indicate how many students responded with that remark.
Content Site features AppearanceContent of interest that is helpful
Ease of use Use of photographs
Well-organized Interactive Bulleted information
Has Frequently Asked Question section
Has music that is what the students like
Use of colors and designs
Has a preview and overview section
Has few internal links Looks simple
Is a credible site Includes a search engine
Includes smiling faces
Includes personal references or testimonials
Links to other sites Includes animation and movement
Includes programs that the student is interested in
Has lots of options within the site
Uses simple language Includes a contact us feature that responds within 24 hours
Includes up-to-date information
Has a short load time
Word associations with “logistics” as a career: There were no two answers alike when students were asked to associate a word or phrase with the career logistics.
Three answers indicated they didn’t know; one of which said he or she would look it up if high salaries were given for it.
Four answers were somewhat related to the occupation and indicated the students thought of GPS, precision, product placement and keeping track of large quantities of things. All other answers had little connection to the occupation and included things like Barbie - she’s everywhere, wedding/party planner, and chess/checkers.
5. Pictures of some of the focus groups
document.docx Page 19 of 21
Joined by a River: Logistics Programming in the Quad Cities
Bettendorf High School - Iowa Bettendorf High School - Iowa
United Township - Illinois United Township - Illinois
Davenport West High School - Iowa Davenport West High School - Iowa
document.docx Page 20 of 21
Joined by a River: Logistics Programming in the Quad Cities
This product was partially funded by a grant awarded under the President’s Community-Based Job Training Grants as implemented by the U.S. Department of Labor’s Employment & Training Administration. The information contained in this product was created by a grantee organization and does not necessarily reflect the official position of the U.S. Department of Labor. All references to non-governmental companies or organizations, their
services, products, or resources are offered for informational purposes and should not be construed as an endorsement by the Department of Labor. This product is copyrighted by the institution that created it and is intended for individual organizational, non-commercial use only.
document.docx Page 21 of 21