Embed Size (px)
Citation preview

date: October 2014
Focus on health and safety
Trade union trends survey
Health and safety


3
Acknowledgements
The TUC would like to acknowledge:
• the trade unions and Hazards Magazine who distributed questionnaires
• the trade union health and safety representatives who responded to the TUC Safety Reps’ Survey 2014
• the Labour Research Department for processing the completed questionnaires and for drafting the report.
4
Contents
5 Executive summary
9 introduction
12 hazards at work
25 managing health and safety
31 rights of health and safety representatives
37 enforcement
42 conclusions

Trades Union Congress Focus on health and safety 5
Section one
1 Executive summary
This is the 11th biennial TUC safety representatives’ survey. It is designed to provide the TUC and its affiliated trade unions with valuable information to help shape safety campaigning and organisation in the period ahead.
Key findings
Hazards
The five most frequently cited hazards in 2014 were stress, bullying/harassment, overwork, back strains and slips, trips and falls on a level.
Stress – still the stand-out health and safety concern, identified as a top-five hazard by two-thirds of safety reps in the survey.
• There has been a very slight fall in the percentage identifying stress as a top-five hazard over the last two years (67% compared with 69% in 2012).
• Any decline has come in the private and not-for-profit sectors; in the public sector 75% of reps in the sector still identify it as a top-five hazard – the same proportion as in 2012.
• It has slightly receded as the stand-out concern across industry: overall 32% said stress was the most important hazard in their workplace, compared with 36% in 2012 and 27% in 2010.
• Concern over stress has risen to alarming levels in central government, cited as a top-five concern by 87% (compared with 80% in 2012).
• It has become slightly less widespread in all sizes of workplace except the largest (1,000+ workers), where its spread has risen from 73% to 76%.
Bullying/harassment – this has become a key hazard to watch as it has grown steadily as a top-five concern throughout the period of the TUC’s safety rep surveys. The category was changed from “bullying” to “bullying/harassment” for the 2010 survey, in which 37% cited it as a top-five concern. The figure rose to 41% in 2012 and is now 46%.
Bullying/harassment is a particular problem in the public sector, where half of safety reps identify it as one of their top five hazards.
But was also cited by eight out of 11 respondents in the banking, insurance and finance sector, equivalent to 73%.

Trades Union Congress Focus on health and safety 6
Overwork – concern in this area has crept up again, with 36% of representatives listing it as a top-five concern, compared with 33% in 2012 and 29% in 2010. Again it is much more prevalent in the public sector, where it is picked out by 42% of reps, compared with 27% in the private sector.
Other Hazards – On the other hand, concern over long hours of work is slightly more prevalent in the private sector (cited by 27%) than the public sector (24%). Overall, the proportion of respondents naming it as a top-five hazard has risen from 21% to 26%.
Also on the rise is concern over handling heavy loads – up from 16% to 19% in the last two years – and high temperatures – up from 14% to 17%.
One hazard which seems to be declining as a cause of concern is display screen equipment (DSE), listed this time by 22% compared with 26% in 2012 and 28% in 2010.
Managing health and safety
While 83% of safety representatives overall say their employer has conducted formal risk assessments at their workplace, this varies between 87% in the private sector and just 81% in the public sector (and 84% in the not-for-profit sector).
In the health services, only 72% said risk assessments had been carried out, although 11% of representatives in that sector did not know whether they had or not. And in education just 73% said they were carried out (14% did not know).
Even where risk assessments are carried out, one in five of them are thought by safety reps to be inadequate. The public sector is worse than the private sector (23% inadequate compared with 17%) and the worst industries in this area were the voluntary and banking sectors.
Safety representatives seem to be even less happy with their inclusion in the risk assessment process than they were in 2012. Just 28% were satisfied with their involvement in drawing them up compared with 33% two years ago.
Nine in 10 representatives say their employers provide occupational health services – and 97% of those in workplaces with more than a thousand workers do. The majority of employers, in both public and private sectors, now use external providers rather than in-house ones.
Sickness monitoring is still the most common service provided by occupational health (68% of reps say it is provided). However, the negative aspects of these services have retreated in the last two years. Declines have been recorded since 2012 in occupational health’s provision of sickness monitoring, disciplinary assessments and pre-employment medical screening.

Trades Union Congress Focus on health and safety 7
Safety representatives’ rights
Levels of safety representative training have remained static over the last two years, except that a slightly higher proportion of reps say they have attended joint union-employer courses (10% compared with 7%).
Of some concern is that reps who have been in post for less than a year are substantially less likely to have attended a TUC or own-union Stage I or Stage II course than new reps had in 2012.
More than one in six safety reps say management has at some point refused them time off for training.
More than one in five (22%) are never automatically consulted by their employer over health, safety and welfare matters. However, this represents an improvement on the position in 2012, when 27% said they were never spoken to.
Employers in the health sector seem to be particularly reluctant about consulting safety representative. More than a third (36%) of reps in the sector say they are never automatically consulted by their employer, and 12% say they are never consulted even when they request it. The distribution and hotels sector and the voluntary sector are also very poor on consulting with their safety representatives.
Enforcement
The 2014 survey indicates that there has been a decline in inspection levels by health and safety enforcement agencies in the last two years.
This is shown firstly by a small increase in the proportion of respondents saying that their workplace had never, as far as they knew, been inspected by a health and safety inspector (47% compared with 45% in 2012).
In addition, there has been a general increase in the period since respondents’ workplaces had last been inspected. On top of those reporting no inspection, 13% said the last inspection was more than three years ago (compared with 10% who reported this in 2012).
There were corresponding decreases in the proportions citing more recent inspections. Just 15% said their workplace was last inspected between one and three years ago (compared with 16% in 2012) and only 25% said it had been inspected within the last 12 months (compared with 28%).
Manufacturing is the only sector in which a majority (52%) of safety representatives knew of an inspection in the last 12 months. Even in the hazardous sphere of construction, only 41% said there had been an inspection

Trades Union Congress Focus on health and safety 8
in the past year and more than one in three had never known there to be an inspection.
Fewer than two in five safety representatives had been made aware in advance of the most recent inspector’s visit – a fall from 45% saying this in 2012. And only 30% had spoken with the inspector on their most recent visit – down from 37% two years ago.
The proportion of respondents who said their employer had made health and safety improvements because of the possibility of an inspection has remained stable, though fewer have done “a lot” than in 2012.
But only 23% said their employer had made improvements after hearing about a notice or prosecution of another employer, a fall from the already low point of 27% in 2012.
19% said their employer had at some point received a legal enforcement notice – slightly higher than the 17% reporting this in 2012.
However, there was a substantial deterioration in employers’ response to legal enforcement notices. Only 15% of representatives said their employer made the most comprehensive response – to comply and to review other practices elsewhere. This figure fell from 47% in 2012. Instead, more employers either made a short-term and limited response (35% compared with 17% in 2012) or did the minimum to comply with the notice (35% compared with 30% in 2012).

Trades Union Congress Focus on health and safety 9
Section one
2 introduction
The survey
This is the 11th biennial TUC survey of safety representatives. The report is analysed by senior TUC policy officials and union health and safety specialists so they can understand the changing experience of safety representatives at work and provide them with more support. They also use the survey to inform public policy debates and in work with the Health and Safety Executive (HSE). The TUC wants union safety representatives and safety committees to discuss and use the report to help with their ongoing work.
A total of 1,716 safety representatives responded to the questionnaire either on paper or online between March- and July 2014, compared with 1,875 in the 2012 survey. Their answers provide a wealth of information about the profile of safety representatives, the work they do to improve safety and the help (or otherwise) they get from employers and enforcement agencies.
Profile of safety representatives
The profile of respondents to the survey serves as an approximation of the profile of safety representatives in the UK in 2014.
Twenty-six per cent of the safety representatives responding were women – a lower proportion than in 2012, when the figure was 30%, and a more similar proportion to the 27% of both 2010 and 2008.
Some 95% described themselves as White (“White British” or “White – other”), compared with 94% in 2012. Three per cent described themselves as one of the following: “Asian or Asian British”, “Black or Black British”, or “Chinese”. This compares with 4% in 2012, the difference being in a reduction in those saying they were Black or Black British from 2% to 1%. Another 1% said they were “mixed race”, as in 2012.
Only 8% of representatives were under the age of 35 while 18% were aged between 36 and 45 and 65% were between 46 and 60. Another 9% were over 60 years of age.
These figures show that the age profile of safety representatives has shifted slightly from the 36-45 age band to the 46-60 age band over the last two years (see table A).

Trades Union Congress Focus on health and safety 10
Table A: Age profile of respondents
Age group 2014 2012 16-35 8% 8%
36-45 18% 21%
46-60 65% 62%
60+ 9% 9%
The last two years have seen a substantial shift in the employment profile of safety representatives in terms of economic sector. Only just over half of safety representatives (56%) now work for organisations in the public sector and 41% in the private sector, with the other 3% working in the not-for-profit/voluntary sector. This marks a significant change from 2012, when the equivalent figures were 63% public, 35% private and 2% not-for-profit.
The largest group of safety representatives by industry, apart from those in “other services” (21%), work in transport and communications (18%). Central government accounts for 13%, local government for 12% and education and manufacturing 9% each. This again is a significant change from 2012, when education accounted for the largest group (17%).
Twenty-seven per cent of survey respondents work in workplaces with less than 100 workers, while another 27% work in workplaces with 1,000 or more workers (up from 22% in 2012). Overall a majority (59%) work in workplaces with over 200 workers.
Just 14% of safety representatives responding said they had been doing the job for less than a year (compared with 17% in 2012 and 21% in 2010). Forty-four per cent had been in the role for over five years and 41% for between one and five years.
A little over half (54%) of those who responded were also union stewards, more than the 51% saying that in 2012, while just under half (46%) were only safety representatives.
Safety representatives are widely distributed across the UK. The largest groups of respondents came from the South East and South (15%), Scotland (12%) and the North West and Yorkshire and Humberside (11% each). Northern Ireland safety reps were included in the survey for the first time, and accounted for 1% of respondents.
Ninety five per cent of safety representatives answering this question have access to the internet at home (94% in 2012) and 80% have access at work (83% in 2012).
The proportion of respondents participating in this survey online continues to grow. Almost nine in 10 returned questionnaires (88%) were completed online in 2014, jumping from 83% in 2012, two thirds in 2010 and half in 2008.

Trades Union Congress Focus on health and safety 11
Respondents in the private sector were slightly more likely than those in the public sector to respond online (89% compared with 87%) but the gap has narrowed since 2012 (89% compared with 80%). And the industrial sectors where respondents were most likely to provide their responses online rather than on paper were: distribution, hotels and restaurants (97%); education (92%); banking, insurance and finance (91%) and health services (90%).
Regionally, representatives in London were more likely than any other region to provide their responses online, 95% having done so, while those in Northern Ireland were the least likely to do so (80%).
Women were slightly more likely than men to respond online (89% compared with 87%).

Trades Union Congress Focus on health and safety 12
Section two
3 hazards at work
Main hazards
Safety representatives were asked to identify the main hazards of concern to workers at their workplace, and then to identify the top five in order of importance. All those mentioned as being in respondent’s top five were aggregated to provide a table of “top-five hazards” across all survey respondents, which could be compared with those of previous years (see table 1).
Table 1: The main hazards of concern to workers
Top-five concern 2014 2012
Stress 67% 69%
Bullying/harassment 46% 41%
Overwork 36% 33%
Back strains 33% 32%
Slips, trips, falls on the level 32% 32%
Repetitive strain injuries 27% 27%
Long hours of work 26% 21%
Display screen equipment 22% 26%
Handling heavy loads 19% 16%
Violence and threats 19% 20%
Working alone 19% 18%
High temperatures 17% 14%
Low temperatures 11% 11%
Asbestos 10% 8%
Dusts 10% 8%
Chemicals or solvents 9% 8%
Noise 9% 9%
Road traffic accidents 8% 5%
Slips, trips, falls from a height 8% 8%
Cramped conditions 7% 5%
Machinery hazards 6% 7%
Workplace transport accidents 6% 4%
Infections 5% 5%
Dermatitis/skin rashes 4% 3%
Vibration 3% 3%
Asthma 2% 1%
Passive smoking 2% 1%

Trades Union Congress Focus on health and safety 13
The five most frequently cited top-five hazards were stress, bullying and harassment, overwork, back strains and slips, trips and falls on a level. Repetitive strain injuries (RSI) and long hours of work were in sixth and seventh place respectively. Long hours replaced display screen equipment in seventh position.
The ordering of respondents’ top-five concerns (in terms of how frequently they are cited) is similar to that in 2012, but there have been some changes in the frequency with which certain hazards are cited.
Stress was mentioned by a very slightly smaller proportion of respondents this year than in 2012, though it still by far the most widespread top-five concern, listed by two in three safety reps (67% compared with 69% in 2012).
That slight reduction gives little cause for cheer, in any case, as a rising proportion of safety representatives are citing bullying and harassment as a top-five concern – 46% did so compared with 41% two years ago and 37% in 2010.
Concern about overwork has risen again, with 36% putting it as a top-five hazard compared with 33% in 2012. That was already an increase from 2010, when it was cited by 29%.
Possibly linked with that is the jump in reporting of long hours of work as a top-five concern. The proportion of safety representatives naming it has risen from 21% in 2012 to 26% in 2014, making it the seventh most widely reported hazard.
Also on the rise is concern over handling heavy loads – up from 16% to 19% in the last two years – and high temperatures – up from 14% to 17%.
The areas of less widespread concern than in 2012 are few and far between, but one hazard which does seem to be declining as a cause of concern is display screen equipment (DSE). Twenty-two per cent of respondents put it as a top-five hazard this year compared – down from 26% in 2012 and 28% in 2010.
Asked which is the most important hazard in their workplace, stress still dominates the selections. Almost a third of safety representatives (32%) said stress was their top concern – a slightly lower proportion than the 36% of 2012 but still higher than the 27% of 2010. Not only is stress still a widespread hazard, then, but it is also still widely seen as the most worrying hazard in the workplace.
In joint second place were slips, trips and falls on the level and overwork, each cited by 7% was the most important hazard, following by back strains and violence and threats, each cited by 5%.
Trades Union Congress Focus on health and safety 14
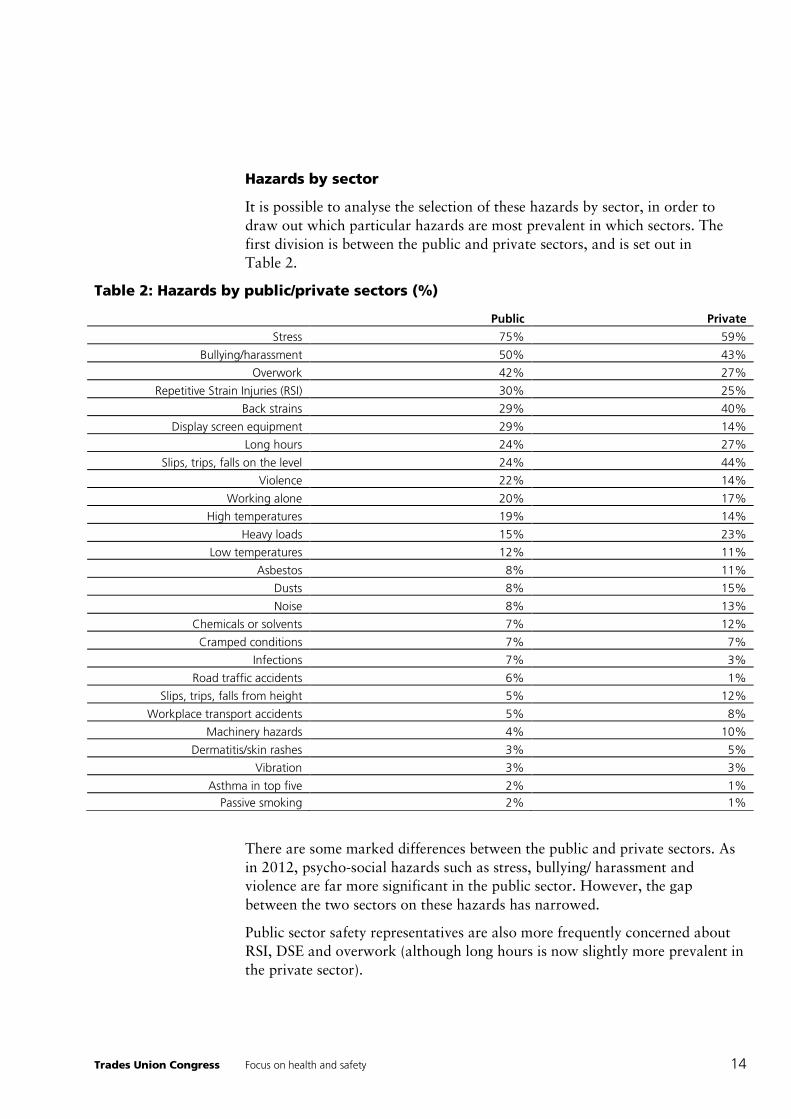
Hazards by sector
It is possible to analyse the selection of these hazards by sector, in order to draw out which particular hazards are most prevalent in which sectors. The first division is between the public and private sectors, and is set out in Table 2.
Table 2: Hazards by public/private sectors (%)
Public Private
Stress 75% 59%
Bullying/harassment 50% 43%
Overwork 42% 27%
Repetitive Strain Injuries (RSI) 30% 25%
Back strains 29% 40%
Display screen equipment 29% 14%
Long hours 24% 27%
Slips, trips, falls on the level 24% 44%
Violence 22% 14%
Working alone 20% 17%
High temperatures 19% 14%
Heavy loads 15% 23%
Low temperatures 12% 11%
Asbestos 8% 11%
Dusts 8% 15%
Noise 8% 13%
Chemicals or solvents 7% 12%
Cramped conditions 7% 7%
Infections 7% 3%
Road traffic accidents 6% 1%
Slips, trips, falls from height 5% 12%
Workplace transport accidents 5% 8%
Machinery hazards 4% 10%
Dermatitis/skin rashes 3% 5%
Vibration 3% 3%
Asthma in top five 2% 1%
Passive smoking 2% 1%
There are some marked differences between the public and private sectors. As in 2012, psycho-social hazards such as stress, bullying/ harassment and violence are far more significant in the public sector. However, the gap between the two sectors on these hazards has narrowed.
Public sector safety representatives are also more frequently concerned about RSI, DSE and overwork (although long hours is now slightly more prevalent in the private sector).
Trades Union Congress Focus on health and safety 15
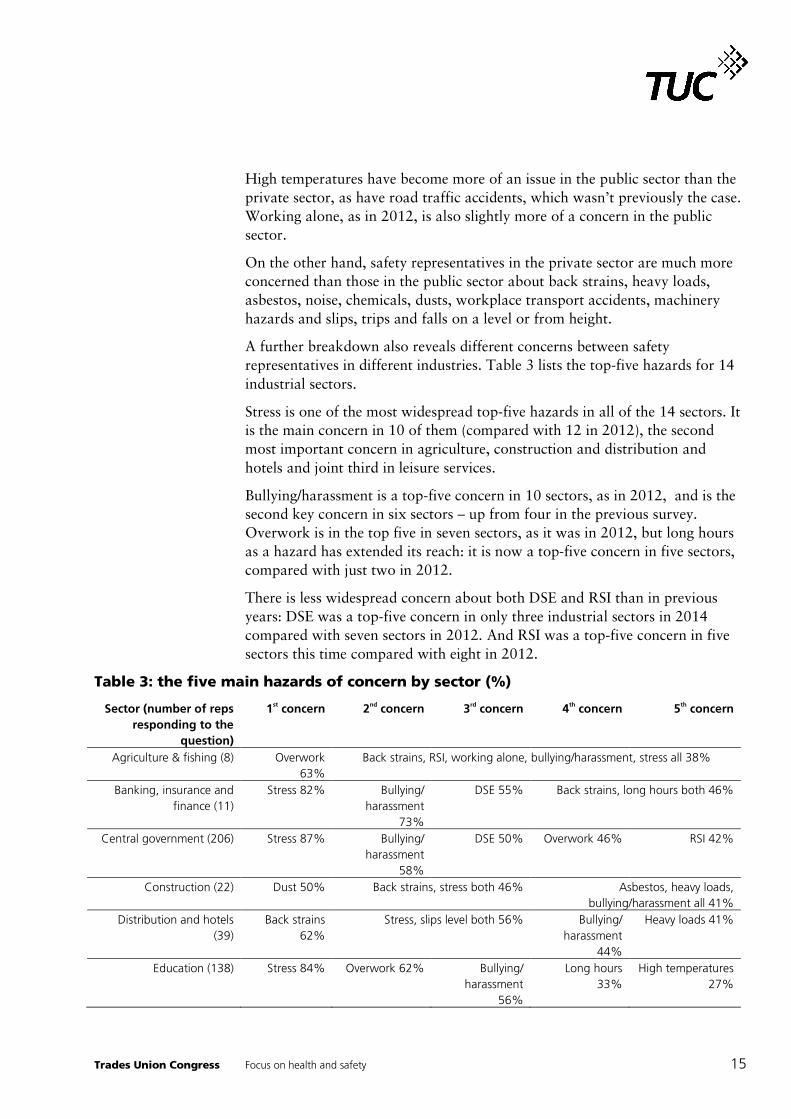
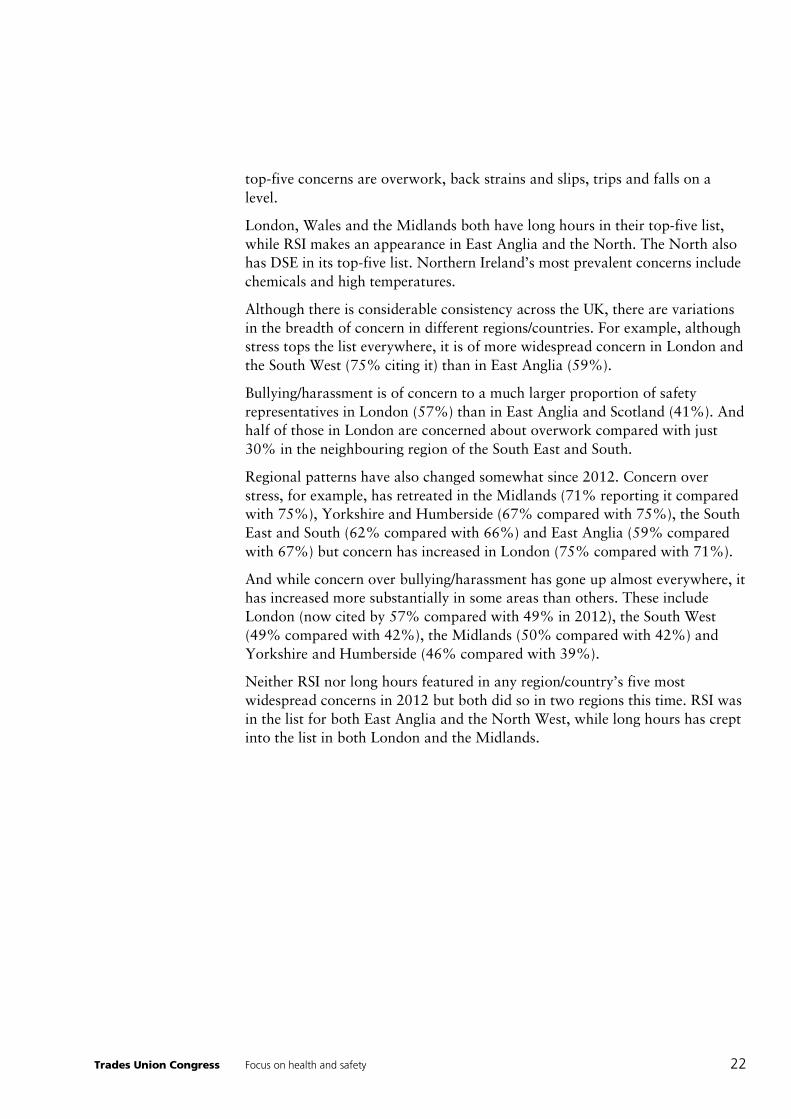
High temperatures have become more of an issue in the public sector than the private sector, as have road traffic accidents, which wasn’t previously the case. Working alone, as in 2012, is also slightly more of a concern in the public sector.
On the other hand, safety representatives in the private sector are much more concerned than those in the public sector about back strains, heavy loads, asbestos, noise, chemicals, dusts, workplace transport accidents, machinery hazards and slips, trips and falls on a level or from height.
A further breakdown also reveals different concerns between safety representatives in different industries. Table 3 lists the top-five hazards for 14 industrial sectors.
Stress is one of the most widespread top-five hazards in all of the 14 sectors. It is the main concern in 10 of them (compared with 12 in 2012), the second most important concern in agriculture, construction and distribution and hotels and joint third in leisure services.
Bullying/harassment is a top-five concern in 10 sectors, as in 2012, and is the second key concern in six sectors – up from four in the previous survey. Overwork is in the top five in seven sectors, as it was in 2012, but long hours as a hazard has extended its reach: it is now a top-five concern in five sectors, compared with just two in 2012.
There is less widespread concern about both DSE and RSI than in previous years: DSE was a top-five concern in only three industrial sectors in 2014 compared with seven sectors in 2012. And RSI was a top-five concern in five sectors this time compared with eight in 2012.
Table 3: the five main hazards of concern by sector (%)
Sector (number of reps responding to the
question)
1st concern 2nd concern 3rd concern 4th concern 5th concern
Agriculture & fishing (8) Overwork 63%
Back strains, RSI, working alone, bullying/harassment, stress all 38%
Banking, insurance and finance (11)
Stress 82% Bullying/ harassment
73%
DSE 55% Back strains, long hours both 46%
Central government (206)
Stress 87% Bullying/ harassment
58%
DSE 50% Overwork 46% RSI 42%
Construction (22)
Dust 50% Back strains, stress both 46% Asbestos, heavy loads, bullying/harassment all 41%
Distribution and hotels (39)
Back strains 62%
Stress, slips level both 56% Bullying/ harassment
44%
Heavy loads 41%
Education (138) Stress 84% Overwork 62% Bullying/ harassment
56%
Long hours 33%
High temperatures 27%

Trades Union Congress Focus on health and safety 16
Energy and water (81)
Stress 65% Slips level 53% DSE 40% Back strains, long hours both 32%
Health services (116)
Stress 78% Back strains 51%
Bullying/ harassment
49%
Overwork 48% RSI 31%
Leisure services (15) Back strains, slips level both 60% Heavy loads, long hours, stress all 47% Local government (188)
Stress 77% Bullying/
harassment 44%
Overwork 42% Back strains 29%
Violence 26%
Manufacturing (142)
Stress 48% Slips level 40% Back strains 34%
RSI 33% Dusts 32%
Transport and communications (294)
Stress 63% Bullying/ harassment
45%
Back strains 40%
Slips level 38% Long hours 33%
Voluntary sector (8)
Overwork, stress both 63% RSI 50% Violence, working alone both 38%
Other services (336)
Stress 60% Bullying/ harassment
50%
Slips level 43% Back strains 37%
Overwork 35%
Agriculture and fishing Overwork is now the number one most widespread concern in this sector, reported by 63% of its safety representatives. It has replaced stress at the top of the list, having not even made the top five in 2012. Concern over RSI is less widespread than two years ago, 38% putting it as top five concern compared with 53% in 2012. But concern over working alone and bullying/harassment have increased and have entered the five most widespread concerns, each cited by 38% of safety representatives.
Banking, insurance and finance Stress remains the most widespread concern in this sector, but bullying/harassment is fast catching up. A shocking 73% identified bullying/harassment as a top five concern this time, up from 55% in 2012, putting it in second place. RSI and overwork have dropped out of the leading five concerns in 2014 and been replaced by back strains and long hours.
Central government Concern over stress has risen to alarming levels in central government, cited as a top five concern by 87%, even more than the 80% reporting it in 2012. Overwork is also getting more widespread in this sector, with 46% of safety representatives listing it as a concern compared with 34% two years ago. Concern over bullying and harassment crept up from 56% to 58%, but worries over DSE and RSI declined.
Construction There were quite a lot changes in construction this year. Concern over dust rocketed to become the most widespread concern in 2014, having not appeared in the top five in 2012. Half of safety representatives in the sector reported it as a top-five concern. Concern also became more widespread in

Trades Union Congress Focus on health and safety 17
relation to back strains, the proportion citing it rising from 37% to 46%, and asbestos, from 33% to 41%. Bullying/harassment, also identified by 41%, entered the list of five most widespread concerns, but working alone and slips on a level, which were in the top five in 2012, fell out this time.
Distribution and hotels Back strains consolidated its position as the most common concern in this sector in 2014, with 62% of safety representatives reporting it, up from 56% in 2012. Other areas of increasing concern are stress and slips on a level, both cited by 56%, and bullying, which entered the top five this time on 44%. Less concern was expressed this time around about heavy loads and RSI.
Education There was little change in the hazards causing concern in the education sector, although reports of bullying/harassment rose from 49% to 56%. The one significant change was that concern about high temperatures entered the top five list, replacing violence.
Energy and water Stress remained the number hazard, but concern fell back from 72% of safety representatives in the sector in 2012 to 65% in 2014. The number identifying slips on a level rose, from 45% to 53%, and similarly DSE, from 31% to 40%. Back strains and long hours replaced bullying/harassment and RSI in the top five list.
Health services Concern over stress became even more widespread in 2014, with 78% of safety representatives putting it in their top five compared with 75% in 2012. Concern over back strains also spread, from 48% to 51%. A bigger increase was recorded, however, in those picking out overwork, rising from 38% to 48%. There was a reduction in concern over bullying/harassment, while violence was replaced in the top five concerns by RSI.
Leisure services The most widespread concern in this sector is back strains, and 60% reported it in 2014 compared with 53% two years ago. The new evil, however, is slips on a level, reported as a concern by 60% despite failing to hit the top five in 2012. Worry over heavy loads and long hours has also risen, but overwork, DSE, noise and bullying/harassment have slipped out of the top five.
Local government The numbers identifying stress, bullying/harassment and overwork have all increased since 2012, and worry over back strains has come into the top five this time. On the plus side, violence is a less widespread source of concern, dropping from 37% to 26%, and DSE has dropped out of the top five.
Manufacturing Concern over stress has receded a little in manufacturing over the last two years – from 54% of safety representatives to 48% – but it is still the number

Trades Union Congress Focus on health and safety 18
one concern. RSI entered the list of most widespread main hazards, with 33% selecting it, but chemicals, which was third in the list in 2012, was not in the top five this time around.
Transport and communications The list of main concerns in this sector is similar to that of 2012, with stress in the top spot, selected by 63%, followed by bullying/harassment. The main change in transport and communications is that long hours entered the list of five most widespread hazards this time, replacing dusts, which was not in the list this time.
Voluntary sector Stress has become slightly less widespread in this sector in 2014, but it is still the number one hazard, cited by 63% of safety representatives (compared with 71% in 2012). However, it has been joined in this position by overwork, which has soared to the top spot, being selected by 63% compared with 43% two years ago. RSI is now also more widely named as a hazard than before, but DSE is no longer included in the most common five hazards.
Other services Stress is still the most widely quoted hazard in “other services” but its reach has receded somewhat from the position in 2012. However, bullying and harassment, now in the number two spot, is an increasing problem, and was selected by 50% this time compared with 38% two years ago. Overwork has replaced RSI as the fifth most widespread concern in the sector.
Hazards and workplace size
Table 4 shows the five major health and safety concerns identified by safety representatives according to the number of people in their workplaces.
Table 4: Most common top-five concerns in workplaces of different sizes
Number of workers 1st concern 2nd concern 3rd concern 4th concern 5th concern Under 50
(238) Stress 64%
Bullying/ harassment
35%
Overwork 34%
Back strains 33%
Slips level 30%
50-99 (200)
Stress 62%
Bullying/ harassment
40%
Back strains 37%
Overwork 34%
Slips level 33%
100-199 (236)
Stress 66%
Bullying/ harassment
45%
Overwork 38%
RSI, back strains both 32%
200-999 (506)
Stress 67%
Bullying/ harassment
50%
Back strains 37%
Slips level 35%
Overwork 34%
1,000 or more (426)
Stress 76%
Bullying/ harassment
52%
Overwork 40%
Slips level 33%
Long hours 30%

Trades Union Congress Focus on health and safety 19
Stress is the most common concern in all sizes of workplace, as it was two years ago. It has become slightly less widespread in all size categories except for the largest ones, of 1,000 workers or more.
Bullying and harassment is the second most widespread concern in all sizes of workplace. Although it has slightly receded in workplaces of fewer than 100 members, it has increased in spread in all other workplaces.
Table 5 looks at how the most common hazards – listed by more than 20% of safety representatives overall – vary in prevalence according to the size of their workplace.
Table 5: most common hazards overall by workplace size
Under 50 employees
50-99 employees
100-199 employees
200-999 employees
1,000 or more employees
Stress 64% 62% 66% 67% 76%
Bullying/harassment 35% 40% 45% 50% 52%
Overwork 34% 34% 38% 34% 40%
Back strains 33% 37% 32% 37% 29%
Slips, trips, falls on the level
30% 33% 31% 35% 33%
Repetitive strain injuries 20% 27% 32% 31% 27%
Long hours of work 23% 27% 22% 24% 30%
Display screen equipment 23% 24% 25% 21% 24%
Variation in prevalence of the key hazard, stress, has returned to the sort of pattern identified four years ago, with concern significantly more widespread in large workplaces than small ones. Levels had equalised somewhat in the interim, according to the 2012 survey. Bullying/harassment retains a clear-cut pattern of wider prevalence the larger the workplace. Concern over other hazards do not follow clear trends according to workplace size, except that RSI seems less of a problem in workplaces of under 50 employees.
Hazards by region/country
Table 6 sets out which regions are the worst/second worst for each of the main hazards of concern. It shows that some regions/countries feature negatively in multiple areas.

Trades Union Congress Focus on health and safety 20
Table 6: Regions reporting most concern for each main hazard
Top-five concern Worst area 2nd worst area % cited nationally
Stress South West and London both 75% 67% Bullying/harassment London 57% Midlands 50% 46%
Overwork London 50% Midlands 43% 36% Back strains Yorkshire &
Humberside 38% Scotland, East Anglia, South West 37% 33%
Slips, trips, falls on the level Wales 45% South East 39% 32% Repetitive strain injuries East Anglia 35% Northern 32% 27%
Long hours of work London 34% Wales 32% 26% Display screen equipment Northern 32% North West, Yorkshire
& Humberside 28% 22%
Handling heavy loads East Anglia 24% South East, South West, London 21% 19% Violence and threats Northern Ireland 25% North West 23% 19%
Working alone Northern 24% Scotland 23% 19% High temperatures Northern Ireland 30% South West 21% 17% Low temperatures Northern 17% East Anglia 16% 11%
Asbestos Wales 18% Northern Ireland 15% 10% Dusts East Anglia 17% Northern Ireland 15% 10%
Chemicals or solvents Northern Ireland 30% Wales, North West, Yorkshire & Humberside 12%
9%
Noise South East 13% Midlands, North West 11% 9% Road traffic accidents South East, East Anglia 11% 8%
Slips, trips, falls from height Wales, Scotland 13% 8% Cramped conditions Northern Ireland 10% East Anglia 9% 7%
Machinery hazards Northern Ireland 15% Scotland, East Anglia 9% 6% Workplace transport accidents Northern Ireland 15% Northern 9% 6%
Infections Northern Ireland 10% South East, North West 8% 5% Dermatitis/skin rashes Northern Ireland 15% Scotland, Northern, South West
6% 4%
Vibration Scotland 6% Yorkshire & Humberside 4% 3%
Asthma Northern Ireland 5% South East 3% 2%
Passive smoking Midlands, North West, East Anglia 3% 2%
Northern Ireland has made an inauspicious entry into the safety reps survey, being the region/nation appearing most frequently in the table. It is the worst or second-worst place for 12 different hazards. (However, it should be borne in mind that only the survey included only a small number of respondents from Northern Ireland [20], and analysis based on this return is less reliable than with the larger samples.)
Northern Ireland would appear to have the most widespread concern in relation to high temperatures, chemicals, violence, cramped conditions, machinery, workplace transport, infections, dermatitis/skin rashes, infections and asthma. It is second worst for asbestos and dusts.

Trades Union Congress Focus on health and safety 21
East Anglia features in the table almost as frequently, revealing itself as the part of the UK with the widest or second widest concern over nine hazards. The region is the worst for RSI, heavy loads, dusts, road traffic accidents (jointly with the South East) and passive smoking (jointly with the Midlands and the North West). It is second worst for back stains (jointly with Scotland and the South West), low temperatures, cramped conditions and machinery (jointly with Scotland).
Table 7: Main hazards of concern by region/country
Region/country 1st concern 2nd concern 3rd concern 4th concern 5th concern
East Anglia Stress 59%
Bullying/ harassment
41%
Back strains 37%
Slips level, RSI 35%
London Stress 75%
Bullying/ harassment
57%
Overwork 50%
Long hours 34%
Back strains 32%
Midlands Stress 71%
Bullying/ harassment
50%
Overwork 43%
Slips level 34%
Long hours 28%
North West Stress 71%
Bullying/ harassment
45%
Overwork 35%
RSI 30%
Back strains 29%
Northern Stress 67%
Bullying/ harassment
43%
Overwork 33%
DSE, RSI 32%
Northern Ireland Stress 65%
Bullying/ harassment
45%
Slips level 35%
Back strains, chemicals, high temperatures
30%
Scotland Stress 66%
Bullying/ harassment
41%
Back strains 37%
Overwork 35%
Slips level 32%
South East and South Stress 62%
Bullying/ harassment
44%
Slips level 39%
Back strains 36%
Overwork 30%
South West Stress 75%
Bullying/ harassment
49%
Overwork 40%
Back strains 37%
Slips level 32%
Wales Stress 70%
Slips level 45%
Bullying/ harassment
43%
Overwork 35%
Back strains, long hours
32%
Yorkshire and Humberside
Stress 67%
Bullying/ harassment
46%
Back strains 38%
Slips level 33%
Overwork 32%
Stress is the top concern in every region/country of the UK, and bullying/harassment is the second concern everywhere except in Wales, where it comes third, after slips, trips and falls on a level. The other most widespread
Trades Union Congress Focus on health and safety 22
top-five concerns are overwork, back strains and slips, trips and falls on a level.
London, Wales and the Midlands both have long hours in their top-five list, while RSI makes an appearance in East Anglia and the North. The North also has DSE in its top-five list. Northern Ireland’s most prevalent concerns include chemicals and high temperatures.
Although there is considerable consistency across the UK, there are variations in the breadth of concern in different regions/countries. For example, although stress tops the list everywhere, it is of more widespread concern in London and the South West (75% citing it) than in East Anglia (59%).
Bullying/harassment is of concern to a much larger proportion of safety representatives in London (57%) than in East Anglia and Scotland (41%). And half of those in London are concerned about overwork compared with just 30% in the neighbouring region of the South East and South.
Regional patterns have also changed somewhat since 2012. Concern over stress, for example, has retreated in the Midlands (71% reporting it compared with 75%), Yorkshire and Humberside (67% compared with 75%), the South East and South (62% compared with 66%) and East Anglia (59% compared with 67%) but concern has increased in London (75% compared with 71%).
And while concern over bullying/harassment has gone up almost everywhere, it has increased more substantially in some areas than others. These include London (now cited by 57% compared with 49% in 2012), the South West (49% compared with 42%), the Midlands (50% compared with 42%) and Yorkshire and Humberside (46% compared with 39%).
Neither RSI nor long hours featured in any region/country’s five most widespread concerns in 2012 but both did so in two regions this time. RSI was in the list for both East Anglia and the North West, while long hours has crept into the list in both London and the Midlands.

Trades Union Congress Focus on health and safety 23
Section three
4 managing health and safety
As well as questions about the main hazards at work, safety representatives were asked about the way health and safety is managed in their workplace. In particular, the TUC asked about health and safety policies, risk assessments and occupational health services.
Health and safety policies
More than nine out of 10 safety representatives (93%) said that their employer had a written health and safety policy – a slightly smaller proportion than the 95% figure recorded in 2012. There was no difference between the public and private sectors on this, but those in the not-for-profit sector were rather less likely to have policies.
One industrial sector stood out as particularly non-compliant in this area: in the voluntary sector only five out of the eight safety representatives responding (63%) said their employer had a written policy. In agriculture and fishing, which was the worst offender in 2012, 100% of the eight respondents said their employer had a policy.
Regions/countries varied slightly on this issue, with the most compliant region being Scotland, where 98% of respondents said their employer had a policy. The least compliant were the South East and South, Yorkshire and Humberside and Northern Ireland, where in each case 90% said their employer had a policy.
Risk assessments
Under the Management of Health and Safety at Work Regulations 1999, and other regulations, employers have a duty to make “suitable and sufficient” assessments of the risks. Where there are five or more workers, they should also record the significant findings.
Risk assessments conducted
The key building block of good risk management according to the Health and Safety Executive (HSE) is the ability of employers to conduct risk assessments. Eighty-three per cent of all respondents in this survey said their employer had carried out formal risk assessments, while 9% said they had not and 8% did not know.
Of those saying risk assessments had been carried out, 93% said the assessments were recorded and only a small proportion (1%) said they were
Trades Union Congress Focus on health and safety 24
not. However, 7% did not know whether they were recorded. These figures were virtually unchanged from two years ago.
Although employers of 1,000 or more workers were slightly more likely than others to have carried out formal risk assessments, there was no solid link between workplace size and likelihood of risk assessments as there was in 2012.
However, there was a difference between economic sectors: 87% of safety representatives from the private sector said formal risk assessments had been carried out compared with just 81% in the public sector and 84% in the not-for-profit sector.
The conducting of risk assessments varies considerably across industries. The worst one appears to be the health services sector, where just 72% said they had been carried out, although 11% did not know. Education was also poor, with only 73% saying they were carried out, though again quite a large proportion did not know (14%).
The sector with the highest level of compliance on conducting formal risk assessments was agriculture and fishing, where all eight respondents said their employer had carried them out. Other relatively good levels of compliance were in construction, where 96% said their employer had carried risk assessments, and energy and water, where 94% did so. The figure for manufacturing was 92% – a little lower than the 96% recorded in 2012.
There was little regional variation in the level of compliance on formal risk assessments. East Anglia displayed the highest level, with 88% of safety representatives saying their employer had carried them out, while the lowest levels were in London and Wales, where 75% did so in each case.
Adequacy of risk assessments
While most employers have conducted risk assessments, in only 62% of those cases did the safety representative consider the assessments to be adequate. This means just half of all respondents were confident that their employer had carried out adequate risk assessments.
One fifth (20%) of representatives where risk assessments had been carried out said they were not adequate while 17% did not know whether they were adequate.
Risk assessments in workplaces with more than 100 employees were less likely to be considered adequate than those in workplaces with fewer than 100. And those in the public sector were more likely to say they were inadequate than those in the private sector (23% compared with 17%). Risk assessments in the not-for-profit sector were worst of all, with 30% said to be inadequate.
Industrial sectors in which representatives were least likely to say risk assessments were adequate were the voluntary sector (43%) and banking and

Trades Union Congress Focus on health and safety 25
finance (44%). However, high proportions in these sectors said they did not know (43% and 33% respectively). The sectors with the highest proportion saying risk assessments were inadequate were education and central government (28% saying this in each case).
The worst regions/countries for adequate risk assessments were Wales, where just 53% said they were adequate and 22% said they were not, the Midlands (55% and 24%) and London (56% and 26%).
Safety reps’ involvement in the risk assessment process
Safety representatives have an unsurpassed experience and knowledge of the hazards faced in their workplaces. The Health and Safety at Work Act 1974 and the Safety Representatives and Safety Committees Regulations 1977 require that employers consult with recognised trade union safety representatives on health, safety and welfare matters.
However, many safety representatives still find the risk assessment process unsatisfactory in terms of their own involvement:
• just 28% said they were satisfied with their involvement in drawing up risk assessments
• 39% said they were involved, but not enough
• 33% said they were not involved at all.
These figures suggest a slight decline in safety representatives’ satisfaction over their involvement in the last two years. Although roughly the same proportion said they were involved with risk assessments, the 28% who said they were satisfied compared with 33% in 2012.
Employer provision of occupational health services
Occupational health schemes give access to a range of professional advice and services to employees, and 90% of safety representatives said that their employers provide some sort of occupational health service. This is slightly lower than the figure of 2012 (92%) and is back to the position of 2010.
The balance between in-house and external provision is creeping steadily towards the external provision end, with 50% of safety representatives now saying their employer provides that type of service, and 40% providing an in-house service. In 2012 49% provided external services and 43% in-house ones.
Public sector employers are very slightly more likely to provide occupational health services than private sector ones (92% compared to 89%). Both are more likely to use external providers than in-house ones, whereas in 2012 private sector employers were more likely to provide in-house facilities.

Trades Union Congress Focus on health and safety 26
Employees’ access to occupational health services varies according to workplace size and industrial sector. These differences are set out in tables 9 and 10.
Table 9: Provision of occupational health services by workplace size
Number of workers 2014 2012 2010 Under 50 84% 82% 86%
50-99 90% 87% 91% 100-199 85% 86% 87% 200-999 92% 92% 90%
1,000 or more 97% 97% 94%
Workers in the largest workplaces, with over 1,000 employees, are the most likely to be provided with an occupational health service – almost all (97%) being covered in some way. Workers in the smallest workplaces are worst off, with those in workplaces with fewer than 50 employees having the lowest coverage (84%). But generally the divide in coverage between small and large workplaces has narrowed slightly compared with 2012.
Table 10: Provision of occupational health services by sector
Sector 2014 2012 2010 Agriculture & fishing 100% 82% 77%
Health services 97% 96% 98% Central govt 97% 96% 91%
Local govt. 95% 96% 95% Energy and water 94% 95% 94%
Manufacturing 94% 95% 94% Transport and communications 92% 95% 88%
Construction 86% 93% 89% Other services 86% 84% 87%
Education 85% 82% 86% Distribution and hotels 80% 77% 83%
Leisure services 80% 100% 61% Voluntary sector 75% 100% 79%
Banking, insurance and finance 73% 91% 100%
Table 10 shows how levels of occupational health service provision vary according to industrial sector. At the top end there appears to be 100% coverage in the agriculture sector (though this is based on only eight replies from the sector) and 97% in health services. The poorest provision is in banking and finance (73%), followed by the voluntary sector (75%).
Levels of occupational health service provision do not vary massively by region/country. The area with the highest coverage – of 96% – is Scotland, while that with the lowest – at 85% – is Northern Ireland. However, employers in the Northern region and in Yorkshire and Humberside are more

Trades Union Congress Focus on health and safety 27
likely than others to have in-house provision, while those in the South West are more likely to rely on external providers.
The term “occupational health services” covers a wide variety of provision. The TUC survey sought to find out the type of provision available, in order to help assess the quality of service available to workers. The survey asked safety representatives about particular forms of provision, including sickness monitoring, first aid, prevention and treatment. The proportion of representatives who said these were provided is in Table 11.
Table 11: Types of occupational health services provided
Service provided 2014 2012 2010 Sickness monitoring 68% 71% 69% Health surveillance 56% 54% 59%
Access to rehabilitation 49% 46% 48% First aid 46% 54% 51%
Disciplinary assessments 45% 50% 44% Advice on prevention 41% 46% 44%
Pre-employment medical screening 40% 43% 49% Treatment 23% 25% 26%
Records which safety reps are given 12% 14% 14%
Note: percentages do not total 100% because respondents could tick any relevant services provided.
The most common provision of occupational health services is sickness monitoring (provided in 68% of cases). Encouragingly, this has retreated back slightly from its high 2012 level, as has the provision of disciplinary assessments (50% to 45%). Also welcome is the slight decline in pre-employment medical screening, from 43% to 40%, and the small increase in access to rehabilitation (from 46% in 2010 to 49%).
Less positive is the decline in provision of advice on prevention, from 46% to 41%.

Trades Union Congress Focus on health and safety 28
Section four
5 rights of health and safety representatives
Despite the attacks on health and safety protections in the last couple of years, safety representatives still have wide-ranging rights and powers under the Safety Representatives and Safety Committees Regulations 1977 and other subsequent health and safety legislation. The TUC survey asked safety representatives about the extent to which they have been able to exercise these rights and powers.
Training
Employers must permit safety representatives to attend training during working time without loss of pay. The Approved Code of Practice (ACOP) to the Safety Representatives and Safety Committees Regulations 1977 states that this training, approved by the TUC or independent unions, should take place as soon as possible after the safety representative has been appointed. The ACOP also allows for further training as necessary.
Unionlearn, the TUC’s learning and training wing, provides a range of courses through the network of trade union studies centres in further and higher education colleges and through the Workers’ Education Association (WEA). Individual unions also provide their own approved training courses for induction and a range of safety matters. In addition, some employers provide training on specific issues.
The 2014 TUC survey asked safety representatives about the range of training they had received. The responses are set out in Table 12.
Table 12: Training received
Health and safety training received 2014 2012 2010 TUC/Union Stage 1 73% 74% 73%
TUC/Union Stage 2 46% 46% 44%
Own union introductory course 32% 32% 34%
Other TUC/union courses 21% 20% 17%
Course provided by employer 18% 19% 21%
Joint union-employer course 10% 7% 9%
TUC Diploma/Certificate in OSH 18% 17% 19%
Note: percentages do not total 100% because respondents could tick any relevant courses attended.

Trades Union Congress Focus on health and safety 29
The most common form of training received is the Stage I and II courses provided by the TUC and individual unions. Almost three in fours safety representatives have attended the stage I course and 46% the Stage II course.
Figures for training received by representatives remain almost unchanged on 2012 levels, other than slightly more of the respondents have undergone a joint union-employer course than had in 2012.
Training and experience
The TUC survey also examines the training received by safety representatives of different levels of experience in the role. Table 13 sets out the training received by safety representatives who have been in the role for different time periods in 2014 and 2012.
Table 13: Training received by term as safety representative
Under 1 year 1-5 years Over 5 years
TUC/Union Stage I course 68% (75%) 76% (73%) 73% (75%)
Other TUC/Union Stage II course 9% (18%) 46% (41%) 56% (60%)
Own union introductory /basic course 26% (23%) 28% (31%) 36% (37%)
Other TUC/Union course 9% (6%) 15% (17%) 29% (27%)
Course provided by employer 4% (7%) 13% (16%) 27% (26%)
Joint union-employer course 4% (2%) 5% (4%) 16% (13%)
TUC Certificate in Occupational Safety and Health 3% (4%) 13% (12%) 27% (28%)
Note: percentages do not total 100% as respondents could tick as many as applied. Figures in brackets indicate the results from the2012 survey.
The worrying finding here is that new safety representatives – those who have been in post for less than a year – are substantially less likely to have attended a TUC or own union Stage I or Stage II course than their equivalents had in 2012. However, this year’s new crop are slightly more likely to have attended their own union’s introductory/basic course or another TUC/union course than their 2012 counterparts.
It seems that fewer safety representatives of five years’ standing or less have attended an employer-provided course than their equivalents had in 2012. This has been slightly offset by a small increase in the proportion have attended a joint union-employer course.
Time off for training
The regulations and subsequent court cases have established the right of safety representatives to time off for training. However, two in five (39%) of those responding to the 2014 survey say there have been times when they have been unable to attend training courses – as in 2012.
The most common reason cited is being “too busy at work”, listed by 19% of all safety representatives in the survey. But, most alarmingly, 18% say they

Trades Union Congress Focus on health and safety 30
have been unable to take up courses because management has refused permission to take time off.
Seven per cent of safety representatives say that family responsibilities prevented them from taking time off to take up training, while 9% said the course was not at the right time of the day or week. For the first time this year respondents were invited to indicate if they were “prevented by lack of access or barriers to disability”, and 1% did so.
Consultation in “good time”
Safety representatives have the right to be consulted on health, safety and welfare matters by their employer. The TUC 2014 survey asked about consultation in two different situations: first, under normal conditions when consultation ought to be automatic, and secondly, when safety representatives ask or make requests. The responses to these questions are contained in Table 14.
Table 14: Management consultation with safety representatives
Consultation Frequently Occasionally Never Automatically 28% (28%) 50% (45%) 22% (27%) When you ask 36% (40%) 57% (52%) 8% (8%)
Note: Figures in brackets refer to the results of the 2012 survey
In the first situation, only 28% of safety representatives say they are frequently automatically consulted – the same as two years ago. However, there is a slight improvement on 2012 in that 50% say they are occasionally consulted, and just 22% say they never are, compared with 45% and 27% in 2012. There is a slight diminution in the number who say they are frequently consulted when they specifically ask to be.
Further analysis of these figures by economic sector, workplace size and region also reveals some differences. The worst performing sectors on consultation are the health services, distribution, hotels and restaurants and the voluntary sector (though this is based on just eight respondents).
More than a third (36%) of health service respondents say they are never automatically consulted by their employer, and just 15% are frequently automatically consulted. Even when they request it, 12% they never are consulted. In distribution just 15% of respondents are frequently automatically consulted and in the voluntary sector none are.
There has been something of an improvement in banking, insurance and finance, which was the worst sector for consultation in the last two surveys. This time around an average 18% said they are never automatically consulted, down from 41% in 2012.
Safety representatives in workplaces of 1,000-plus workers are rather more likely to be automatically consulted than those in smaller workplaces.

Trades Union Congress Focus on health and safety 31
However, the gap between smaller and larger workplaces has narrowed compared with 2012. In 2014 16% of respondents in the largest workplaces say they are never automatically consulted (15% in 2012), compared with 19% in those below 1,000 workers (26% in 2012).
Safety representatives in Northern Ireland are the most likely to say their employers never consult automatically (25%), but those in Wales are most likely to say their employers never consult even when asked (12%).
Inspections
The right to inspect the workplace is one of the most crucial rights safety representatives have to identify hazards and highlight action to be undertaken by management. The ACOP states that safety representatives can inspect every three months, or more frequently by agreement, as long as they notify the employer in writing.
As in previous surveys, the 2014 survey found a huge variation in the frequency of safety representative inspections:
• 19% had conducted one inspection
• 16% had conducted two inspections
• 25% had conducted three or four inspections
• 19% had conducted five or more inspections.
In addition, 21% said they had conducted no inspections in the last 12 months. This is a slightly improved position than was the case two years ago, when 23% said this. Also positive is the slight increase in the proportion who had conducted five or more inspections – 19% compared with 15%.
Further analysis reveals that more experienced representatives tend to carry out more frequent inspections. More than half (52%) of those with over five years’ experience carried out three or more inspections in the last 12 months compared with 42% of those with one to five years’ experience. However, the gap is much narrower than in 2012, when the comparable percentages were 49% and 26%.
(The figure for those in post for less than a year conducting three or more inspections is 26%, but clearly they have not had a full year in which to have carried out inspections.)
Time spent on safety representatives’ duties
Getting time off for training is not the only problem safety representatives face. It extends to time off for functions in the workplace, including for investigations, inspections, gathering information from members on hazards and meeting management. Previous TUC and academic research has identified

Trades Union Congress Focus on health and safety 32
the lack of time and facilities as serious impediments to safety representatives carrying out their functions.
The 2014 TUC survey asked respondents to quantify how much time they had spent on health and safety matters in the previous week. The results showed that:
• half (50%) had spent an hour or less
• a third (34%) had spent between one and five hours
• 9% had spent between five and 10 hours
• 6% had spent over 10 hours.
These figures are very similar to those of 2012, with a slight reduction in those spending less than an hour and a slight increase in those spending between one and 10 hours.
Again, the more experienced representatives tend to spend longer on their health and safety functions. One in five representatives with more than five years’ experience (21%) spent over five hours a week on this work compared with 12% of those with one to five years’ experience. This divide is narrower than in 2012 (when the figures were 20% and 9% respectively).
Joint union-management committees
The work of safety committees has been identified as a key factor in making safety representatives’ work effective. Eighty-two per cent of safety representatives said that their employer had set up a joint committee. In other words, almost one in five workplaces do not.
Even where there is a committee, in one in five cases the committee rarely meets.
This means that, overall, just two thirds of workplaces covered by the survey (65%) have a union-management safety committee that meets fairly regularly, despite having accredited safety representatives.
The larger the workplace, the more likely it is to have a safety committee that meets regularly (except for those with 100-199 workers). Among workplaces of 1,000 workers or more, 93% have a committee, at least on paper, compared with 91% in 2012.
More significantly, workplaces with fewer than 200 are much less likely to have a regularly meeting committee than those with more than that threshold.

Trades Union Congress Focus on health and safety 33
Table 15: Safety committees meeting regularly
Number of workers Under 50 48%
50-99 61% 100-199 55% 200-999 65%
1,000 or more 77%
The industrial sectors most likely to have safety committees meeting regularly in 2014 are agriculture (100%), energy and water (83%) and manufacturing (78%). Those least likely to do so are banking, insurance and finance (46% – and with 27% having no committee at all) and “other services” (49%, and 37% having no committee at all).
Respondents in the South West were the most likely to have safety committees that meet regularly (71%) while those in Northern Ireland were the least likely to (50%).

Trades Union Congress Focus on health and safety 34
Section five
6 enforcement
The survey asked about visits by health and safety inspectors, be they HSE inspectors, Environmental Health Officers or other relevant safety inspectors (such as from the Railways Inspectorate). The responses indicated that there was a slight increase in the period since respondents’ workplaces had last been inspected compared with the 2012 responses.
• Almost half of safety representatives (47%) said that their workplace had never, as far as they knew, been inspected by a health and safety inspector (compared with 45%).
• Another 13% said the last inspection was more than three years ago (compared with 10%).
• A further 15% said it was between one and three years ago (compared with 16%). .
• Just 25% said their workplace had been inspected within the last 12 months (compared with 28%).
Manufacturing is the only sector in which a majority (52%) of safety representatives said there had been an inspection in the last 12 months. In construction, seen as perhaps the most hazardous sector, only two in five safety representatives (41%) said there had been an inspection in the past year and more than one in three had never been inspected, as far as the respondent knew. Table 16 shows the figures for each industry.
Table 16: most recent inspection by industry
Sector Last 12 months Never Manufacturing 52% 9%
Distribution and hotels 44% 39% Construction 41% 36%
Leisure services 40% 27% Energy and water 36% 36%
Health services 33% 47% Other services 27% 41%
Agriculture & fishing 25% 25% Voluntary sector 25% 50%
Education 19% 41% Transport and communications 15% 55%
Local govt. 13% 51% Central government 10% 69%
Banking, insurance and finance 9% 55%

Trades Union Congress Focus on health and safety 35
There is a strong relationship between workplace size and the the chance of having been recently inspected. There had been inspections in the last 12 months at 30% of the largest workplaces (those with over 1,000 workers) but at only 21% of establishments with fewer than 200 workers.
The regions most likely to have seen an inspection in the last 12 months were Scotland and Yorkshire and Humberside (29% saying they had in each case). The regions least likely to were Northern Ireland (15%) and the South East and South (18%) – which was also the most likely to say they had never seen an inspection (55% saying this).
Inspectors and safety representatives
Contact between safety representatives and inspectors appears to have declined, from an already weak base.
Only 38% of safety representatives were aware of the most recent visit before it took place – a fall from 45% saying this in 2012.
In terms of discussions during the visit, only 30% said they or another safety representative had spoken with the inspector on their most recent visit – substantially lower than in 2012 (37%). However, more respondents than in 2012 said they didn’t know whether they had (28% compared with 21%).
Improvements and enforcement action
The survey asked safety representatives about whether their employers had made improvements to health and safety management – either because of the possibility of a visit by inspectors, or because of enforcement action taken against other employers, such as a notice or prosecution. The results are set out in Tables 17 and 18.
Table 17: Improvements because of the possibility of a visit
2014 2012 2010 Not at all 19% 26% 22%
A little 16% 18% 20% Somewhat 20% 15% 19%
A lot 16% 20% 22% Don’t know 29% 22% 17%
Table 17 indicates the extent to which safety representatives feel employers have made health and safety improvements because of the possibility of an inspection. The results suggest that fewer respondents feel their employers have made a lot of improvements than in 2012 but more feel they have made some improvements. There is an encouraging fall in the proportion who do not think improvements have been made at all (although there has been an equivalent rise in the proportion saying they don’t know).

Trades Union Congress Focus on health and safety 36
The survey also asked safety representatives whether their employer had, in the last two years, made improvements to health and safety after hearing about an enforcement notice or prosecution of another company (see table 18).
Table 18: Improvements after hearing about a notice or prosecution
2014 2012 2010 Yes 23% 27% 30% No 29% 26% 24%
Don’t know 48% 47% 46%
Just 23% said their employers have made improvements because of this situation, a fall from the already low proportion in 2012. However, almost half of the safety representatives do not know their employers’ view on this important issue.
The survey went on to ask safety representatives about actual notices served. Only one in six safety representatives (19%) said their employers have at some point received a legal enforcement notice – slightly more than the 17% reporting this in 2012.
This group were asked about their employer’s response to the most recent enforcement notice.
First they were asked whether safety representatives were involved in taking steps to make improvements to comply with the notice (see table 19)
Table 19: Involvement of safety reps in taking steps to comply with a notice
2014 2012 2010 Heard about it after the changes were made 25% 22% 22%
Heard about the changes planned but no safety reps involved in planning 36% 36% 39% Safety rep(s) involved in planning after receipt of notice 39% 42% 39%
One quarter of safety representatives whose employers had received a notice only heard about the notice after the necessary changes had been made, a slightly higher proportion than in 2012. There was an equivalent decline in the proportion who were quickly involved in planning the changes required.
Secondly safety representatives were asked about how substantial the employers’ response was to the notice (see table 20).
Table 20: Employers’ response to a legal enforcement notice
2014 2012 2010 Comply and review other practices elsewhere 15% 47% 36%
Implement best practice, effect longer term in one active/area 15% 12% 14% Implement best practice, effect short term in one activity/area 35% 17% 24%
Minimum to comply 35% 30% 30%

Trades Union Congress Focus on health and safety 37
The responses here were substantially different from 2012, indicating a deterioration in employers’ responses to legal enforcement notices.
This deterioration was displayed most dramatically in the fall in the proportion of safety representatives who said the employer made the most comprehensive response to a notice. This was defined as complying with the notice and also reviewing other practices in the company in different departments and/or work activities. But this was cited by only 15% of respondents, compared with nearly half (47%) in 2012.
Instead, there was a doubling of the proportion whose employer implemented best practice, but with a short term effect and only affecting one work activity or area. The figure citing this rose from 17% to 35%. There was also an increase (from 30% to 35%) in the proportion saying the employer did the minimum they could to comply with the notice.
Trades Union Congress Focus on health and safety 38
Section six
7 conclusions
The main purpose of the biennial survey is to help the TUC and its affiliated trade unions better understand the hazards and problems faced by union safety representatives. This information should help unions and the TUC to improve the support they provide for safety representatives in workplaces, as well as to prioritise strategically in national political work with the Health and Safety Executive (HSE) and the government. This section summarises the findings from the survey in context and suggests ways the TUC and unions and the Government can act to develop health and safety work.
Hazards
Once again stress is the top concern of union health and safety representatives. This is particularly an issue in central government where concerns on stress have soared. Other issues that grew in concern most were bullying and harassment, and overwork. This illustrates that the consequences of the spending cuts and growing job insecurity continue to be felt, especially in the public sector. It is also the area that far less is being done by the government and regulators and this was highlighted in the recent report on the HSE by Martin Temple.
There is no doubt that these issues are having a significant detrimental effect on the health and well-being of the workforce and need to be both recognised and addressed. They are most prevalent in those sectors that the government has claimed there is “low-risk” and where pro-active inspections have now been withdrawn. This survey shows that these sectors are certainly not “low risk” where occupational health issues are concerned and issues around stress, working time and harassment need to be addressed by employers and prioritised by the enforcement agencies.
A number of hazards have also seen a decrease in the number of times they have been reported as being a major concern. The biggest fall was with high temperatures, but that probably reflects the particularly wet summer rather than any real improvement in the workplace. There was also a welcome fall in the number of representatives who has concerns over the risks from slips trips and falls.
Managing health and safety
Although the vast majority of employers are conducting risk assessments, there is some concern over the quality. Only 62% of those done were considered adequate. There are also concerns over the level of involvement of union health

Trades Union Congress Focus on health and safety 39
and safety representatives in the risk assessment process. Given their high level of training and experience this is a considerable oversight in the part of employers, as well as a breach of the legal requirements.
The position on occupational health coverage is also of concern with a slight drop in coverage as well as a fall in the proportion providing in-house services. For many workplaces the level of provision is very limited, often just sickness monitoring. The TUC will be monitoring the effects on occupational health provision by the new Health and Work service which is to be introduced from later this year.
Rights of health and safety representatives
Despite the difficulty many representatives are having in getting time off for training either because their employer has refused permission or because they are simply too busy and their employer has not provided cover or support, the levels of representatives receiving training has remained roughly the same, although there has been a fall in the number of new representatives receiving Stage 1 training. This training is vital for all union health and safety representatives and representatives will be far less effective without it.
The survey also shows that, despite the current climate, representatives continue to do the basic bread and butter job of inspecting the workplace. There has been an increase in the number of inspections with 79% reporting that they have inspected their workplace in the past year and 19% had conducted five or more inspections.
Enforcement
As expected, the number of workplaces that had been inspected in the past year continued to fall. Only one in four workplaces had seen an inspector. Given that unions are more likely to be in larger, and often more hazardous workplaces, this is very worrying. In fact 47% of representatives said that their workplace had never been inspected.
Even when inspections do take place there is no evidence that inspectors are making an active attempt to speak to health and safety representatives, despite assurances from the HSE that this should always happen. In fact only 30% of representatives had spoken to an inspector on their most recent visit. Whether this is because employers are preventing this or inspectors are not asking is unclear but all enforcing bodies must review their procedures as clearly there is a significant problem here.
The TUC continues to be concerned about the Government’s enforcement policy, with the removal of proactive inspections from a huge range of sectors and the cuts in the budgets of the HSE and local authorities, which will all have a long-term detrimental effect on our health and safety and the TUC will continue to campaign on this issue over the coming year.


Trades Union Congress Congress House Great Russell Street London WC1B 3LS www.tuc.org.uk contact: Author name Telephone e-mail address © 2013 Trades Union Congress For more copies of this title contact our ordering point on 020 7467 1294 or [email protected]. Bulk discounts may be offered. All TUC publications can be provided for dyslexic or visually impaired readers in an agreed accessible format, on request, at no extra cost.