Embed Size (px)
Citation preview
Golder Associates Ltd.
6925 Century Avenue, Suite #100, Mississauga, Ontario, Canada L5N 7K2 Tel: +1 (905) 567 4444 Fax: +1 (905) 567 6561 www.golder.com
Golder Associates: Operations in Africa, Asia, Australasia, Europe, North America and South America
Golder, Golder Associates and the GA globe design are trademarks of Golder Associates Corporation.
Dear Mr. Lee,
This memo is to provide additional clarification of information as requested in the Town of Oakville Peer review
letter received on May 22, 2013 from XCG Environmental Engineers and Scientists (XCG) regarding the Phase
2 Review of the Application for Approval for Dufferin Construction Company’s Bronte Asphalt Plant.
To simplify the response, comments are summarized in a tabular format and included as attachment A to this
memo. These comments address only those areas that further clarification was requested.
As stated in the Phase 2 Review by XCG, there are a few points of clarification that should be addressed.
However, these findings are not significant and will not change the overall assessment. As a result no additional
modelling or revision of emissions quantification was required.
Based on the data provided in the application, the Facility does not significantly affect air quality in the existing
airshed as the facility induced Fine Particulate Matter (FPM) concentrations are less than 0.2 micrograms per
cubic metres annually, the criterion defined by the Oakville Health Protection Air Quality By-Law.
If you require any further clarification, please contact the undersigned at 905-567-6100 extension 1527.
Sincerely,
Tracy Hodges B.Sc. (Hons.), CCEP Anthony Ciccone, Ph.D., P.Eng. Air Quality Specialist Principal TMH/AC/am Attachments: Attachment A and Figure 2 n:\active\2012\1151\12-1151-0213 dcc - oakville bylay - oakville\correspondence\peer review response\phase 2 response\12-1151-0213 memo peer response phase 2 june 10 2013.docx
DATE June 10, 2013 PROJECT No. 12-1151-0213
TO Mr. Jeffrey Lee Town of Oakville
CC Mr. John Bayliss, Mr. Scott Winger
FROM Tracy Hodges, Golder Associates EMAIL [email protected]
RESPONSE TO PEER REVIEW – PHASE 2 OF COMPLETE APPLICATION – BRONTE ASPHALT PLANT OAKVILLE HEALTH PROTECTION AIR QUALITY BY-LAW APPLICATION FOR APPROVAL
Mr. Jeffrey Lee 12-1151-0213
Town of Oakville June 10, 2013
1/7
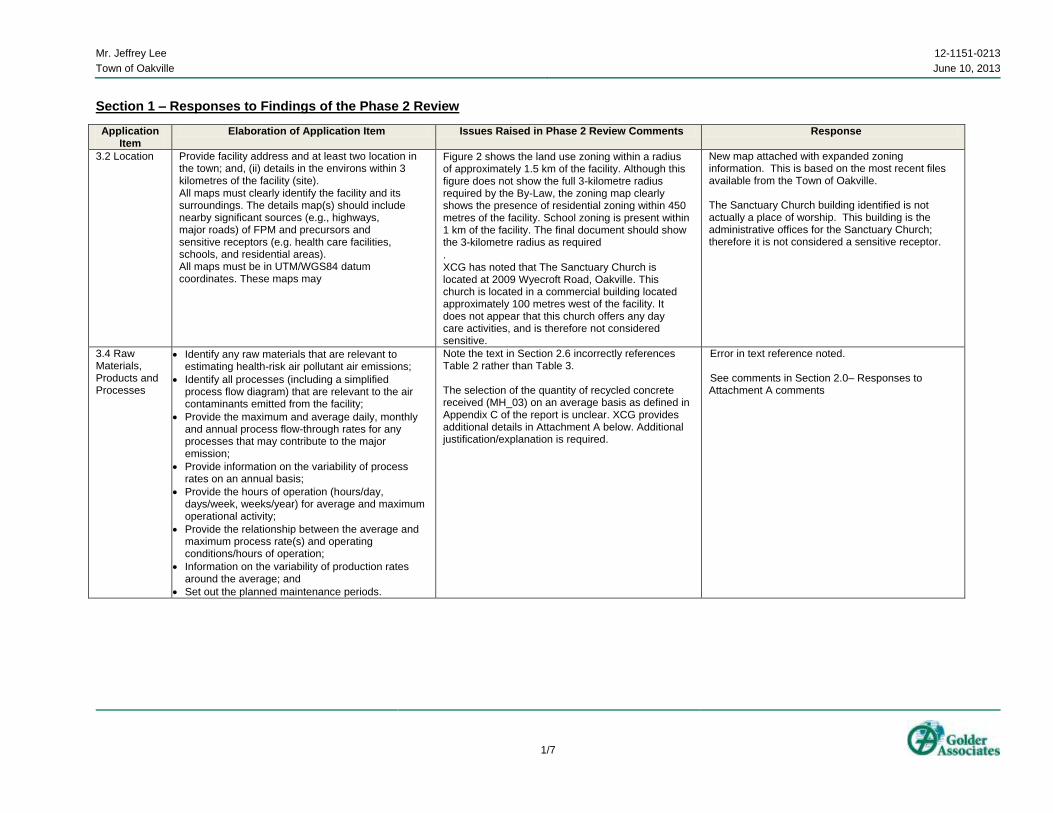
Section 1 – Responses to Findings of the Phase 2 Review
Application Item
Elaboration of Application Item Issues Raised in Phase 2 Review Comments Response
3.2 Location Provide facility address and at least two location in the town; and, (ii) details in the environs within 3 kilometres of the facility (site). All maps must clearly identify the facility and its surroundings. The details map(s) should include nearby significant sources (e.g., highways, major roads) of FPM and precursors and sensitive receptors (e.g. health care facilities, schools, and residential areas). All maps must be in UTM/WGS84 datum coordinates. These maps may
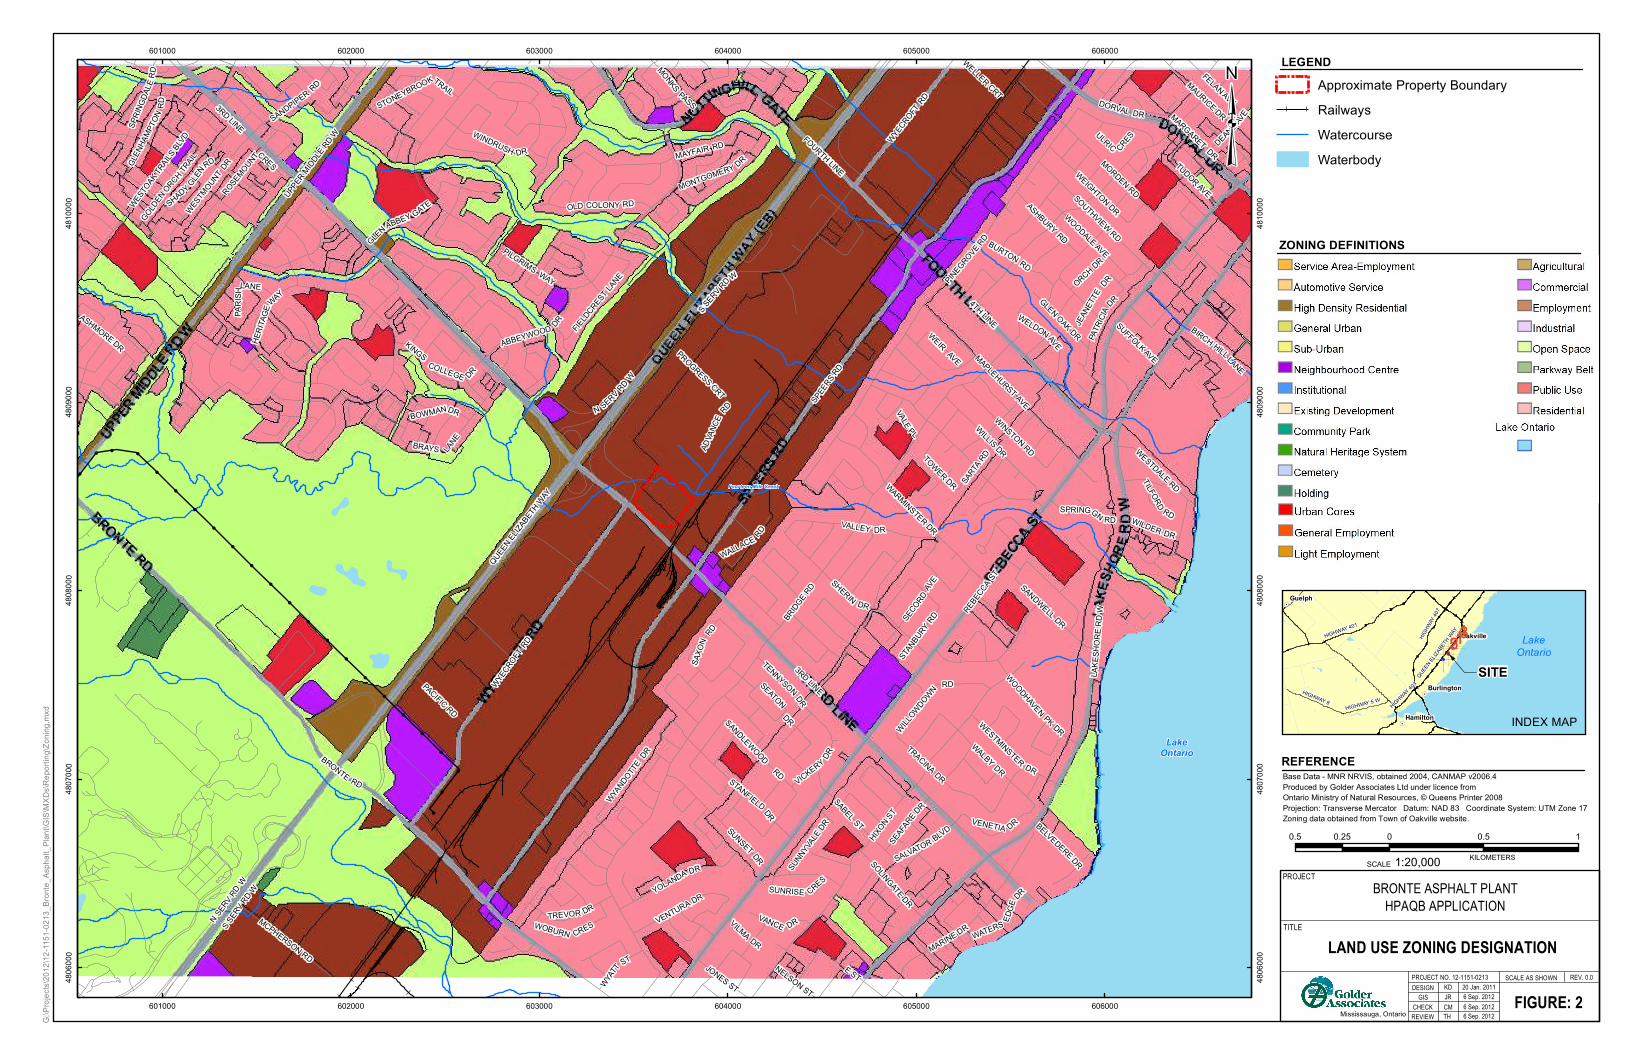
Figure 2 shows the land use zoning within a radius of approximately 1.5 km of the facility. Although this figure does not show the full 3-kilometre radius required by the By-Law, the zoning map clearly shows the presence of residential zoning within 450 metres of the facility. School zoning is present within 1 km of the facility. The final document should show the 3-kilometre radius as required
. XCG has noted that The Sanctuary Church is located at 2009 Wyecroft Road, Oakville. This church is located in a commercial building located approximately 100 metres west of the facility. It does not appear that this church offers any day care activities, and is therefore not considered sensitive.
New map attached with expanded zoning information. This is based on the most recent files available from the Town of Oakville. The Sanctuary Church building identified is not actually a place of worship. This building is the administrative offices for the Sanctuary Church; therefore it is not considered a sensitive receptor.
3.4 Raw Materials, Products and Processes
Identify any raw materials that are relevant to estimating health-risk air pollutant air emissions;
Identify all processes (including a simplified process flow diagram) that are relevant to the air contaminants emitted from the facility;
Provide the maximum and average daily, monthly and annual process flow-through rates for any processes that may contribute to the major emission;
Provide information on the variability of process rates on an annual basis;
Provide the hours of operation (hours/day, days/week, weeks/year) for average and maximum operational activity;
Provide the relationship between the average and maximum process rate(s) and operating conditions/hours of operation;
Information on the variability of production rates around the average; and
Set out the planned maintenance periods.
Note the text in Section 2.6 incorrectly references Table 2 rather than Table 3. The selection of the quantity of recycled concrete received (MH_03) on an average basis as defined in Appendix C of the report is unclear. XCG provides additional details in Attachment A below. Additional justification/explanation is required.
Error in text reference noted. See comments in Section 2.0– Responses to Attachment A comments
Mr. Jeffrey Lee 12-1151-0213
Town of Oakville June 10, 2013
2/7
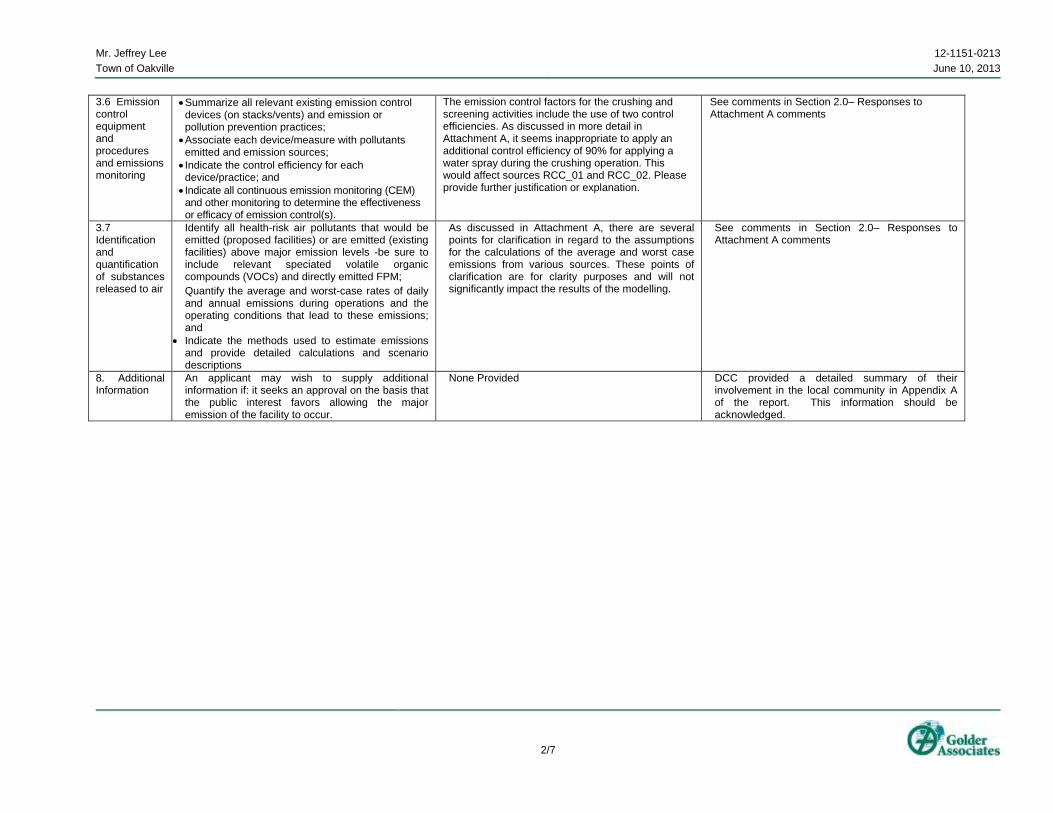
3.6 Emission control equipment and procedures and emissions monitoring
Summarize all relevant existing emission control devices (on stacks/vents) and emission or pollution prevention practices;
Associate each device/measure with pollutants emitted and emission sources;
Indicate the control efficiency for each device/practice; and
Indicate all continuous emission monitoring (CEM) and other monitoring to determine the effectiveness or efficacy of emission control(s).
The emission control factors for the crushing and screening activities include the use of two control efficiencies. As discussed in more detail in Attachment A, it seems inappropriate to apply an additional control efficiency of 90% for applying a water spray during the crushing operation. This would affect sources RCC_01 and RCC_02. Please provide further justification or explanation.
See comments in Section 2.0– Responses to Attachment A comments
3.7 Identification and quantification of substances released to air
Identify all health-risk air pollutants that would be emitted (proposed facilities) or are emitted (existing facilities) above major emission levels -be sure to include relevant speciated volatile organic compounds (VOCs) and directly emitted FPM;
Quantify the average and worst-case rates of daily and annual emissions during operations and the operating conditions that lead to these emissions; and
Indicate the methods used to estimate emissions and provide detailed calculations and scenario descriptions
As discussed in Attachment A, there are several points for clarification in regard to the assumptions for the calculations of the average and worst case emissions from various sources. These points of clarification are for clarity purposes and will not significantly impact the results of the modelling.
See comments in Section 2.0– Responses to Attachment A comments
8. Additional Information
An applicant may wish to supply additional information if: it seeks an approval on the basis that the public interest favors allowing the major emission of the facility to occur.
None Provided DCC provided a detailed summary of their involvement in the local community in Appendix A of the report. This information should be acknowledged.
Mr. Jeffrey Lee 12-1151-0213
Town of Oakville June 10, 2013
3/7
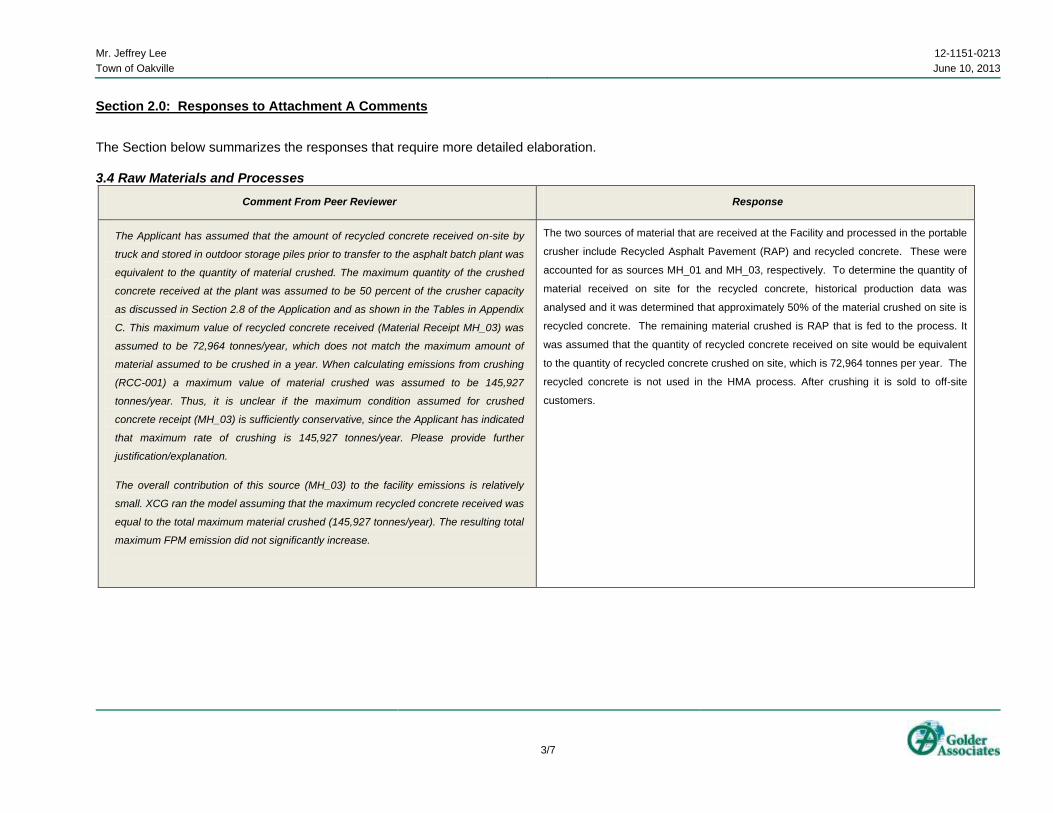
Section 2.0: Responses to Attachment A Comments
The Section below summarizes the responses that require more detailed elaboration. 3.4 Raw Materials and Processes
Comment From Peer Reviewer Response
The Applicant has assumed that the amount of recycled concrete received on-site by
truck and stored in outdoor storage piles prior to transfer to the asphalt batch plant was
equivalent to the quantity of material crushed. The maximum quantity of the crushed
concrete received at the plant was assumed to be 50 percent of the crusher capacity
as discussed in Section 2.8 of the Application and as shown in the Tables in Appendix
C. This maximum value of recycled concrete received (Material Receipt MH_03) was
assumed to be 72,964 tonnes/year, which does not match the maximum amount of
material assumed to be crushed in a year. When calculating emissions from crushing
(RCC-001) a maximum value of material crushed was assumed to be 145,927
tonnes/year. Thus, it is unclear if the maximum condition assumed for crushed
concrete receipt (MH_03) is sufficiently conservative, since the Applicant has indicated
that maximum rate of crushing is 145,927 tonnes/year. Please provide further
justification/explanation.
The overall contribution of this source (MH_03) to the facility emissions is relatively
small. XCG ran the model assuming that the maximum recycled concrete received was
equal to the total maximum material crushed (145,927 tonnes/year). The resulting total
maximum FPM emission did not significantly increase.
The two sources of material that are received at the Facility and processed in the portable
crusher include Recycled Asphalt Pavement (RAP) and recycled concrete. These were
accounted for as sources MH_01 and MH_03, respectively. To determine the quantity of
material received on site for the recycled concrete, historical production data was
analysed and it was determined that approximately 50% of the material crushed on site is
recycled concrete. The remaining material crushed is RAP that is fed to the process. It
was assumed that the quantity of recycled concrete received on site would be equivalent
to the quantity of recycled concrete crushed on site, which is 72,964 tonnes per year. The
recycled concrete is not used in the HMA process. After crushing it is sold to off-site
customers.
Mr. Jeffrey Lee 12-1151-0213
Town of Oakville June 10, 2013
4/7
3.6 Emission Control Equipment and Procedures and Emissions Monitoring
Comment From Peer Reviewer Response
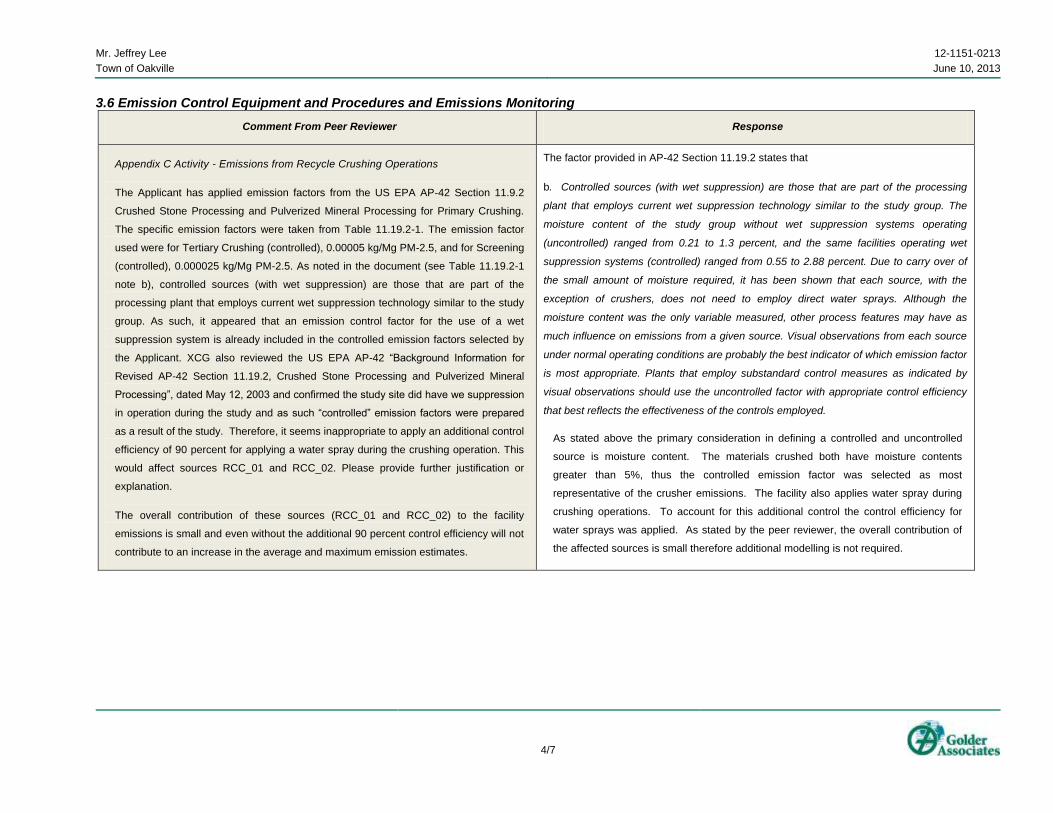
Appendix C Activity - Emissions from Recycle Crushing Operations
The Applicant has applied emission factors from the US EPA AP-42 Section 11.9.2
Crushed Stone Processing and Pulverized Mineral Processing for Primary Crushing.
The specific emission factors were taken from Table 11.19.2-1. The emission factor
used were for Tertiary Crushing (controlled), 0.00005 kg/Mg PM-2.5, and for Screening
(controlled), 0.000025 kg/Mg PM-2.5. As noted in the document (see Table 11.19.2-1
note b), controlled sources (with wet suppression) are those that are part of the
processing plant that employs current wet suppression technology similar to the study
group. As such, it appeared that an emission control factor for the use of a wet
suppression system is already included in the controlled emission factors selected by
the Applicant. XCG also reviewed the US EPA AP-42 “Background Information for
Revised AP-42 Section 11.19.2, Crushed Stone Processing and Pulverized Mineral
Processing”, dated May 12, 2003 and confirmed the study site did have we suppression
in operation during the study and as such “controlled” emission factors were prepared
as a result of the study. Therefore, it seems inappropriate to apply an additional control
efficiency of 90 percent for applying a water spray during the crushing operation. This
would affect sources RCC_01 and RCC_02. Please provide further justification or
explanation.
The overall contribution of these sources (RCC_01 and RCC_02) to the facility
emissions is small and even without the additional 90 percent control efficiency will not
contribute to an increase in the average and maximum emission estimates.
The factor provided in AP-42 Section 11.19.2 states that
b. Controlled sources (with wet suppression) are those that are part of the processing
plant that employs current wet suppression technology similar to the study group. The
moisture content of the study group without wet suppression systems operating
(uncontrolled) ranged from 0.21 to 1.3 percent, and the same facilities operating wet
suppression systems (controlled) ranged from 0.55 to 2.88 percent. Due to carry over of
the small amount of moisture required, it has been shown that each source, with the
exception of crushers, does not need to employ direct water sprays. Although the
moisture content was the only variable measured, other process features may have as
much influence on emissions from a given source. Visual observations from each source
under normal operating conditions are probably the best indicator of which emission factor
is most appropriate. Plants that employ substandard control measures as indicated by
visual observations should use the uncontrolled factor with appropriate control efficiency
that best reflects the effectiveness of the controls employed.
As stated above the primary consideration in defining a controlled and uncontrolled
source is moisture content. The materials crushed both have moisture contents
greater than 5%, thus the controlled emission factor was selected as most
representative of the crusher emissions. The facility also applies water spray during
crushing operations. To account for this additional control the control efficiency for
water sprays was applied. As stated by the peer reviewer, the overall contribution of
the affected sources is small therefore additional modelling is not required.
Mr. Jeffrey Lee 12-1151-0213
Town of Oakville June 10, 2013
5/7
3.7 Identification and Quantification of Substances Release to Air
Comment From Peer Reviewer Response
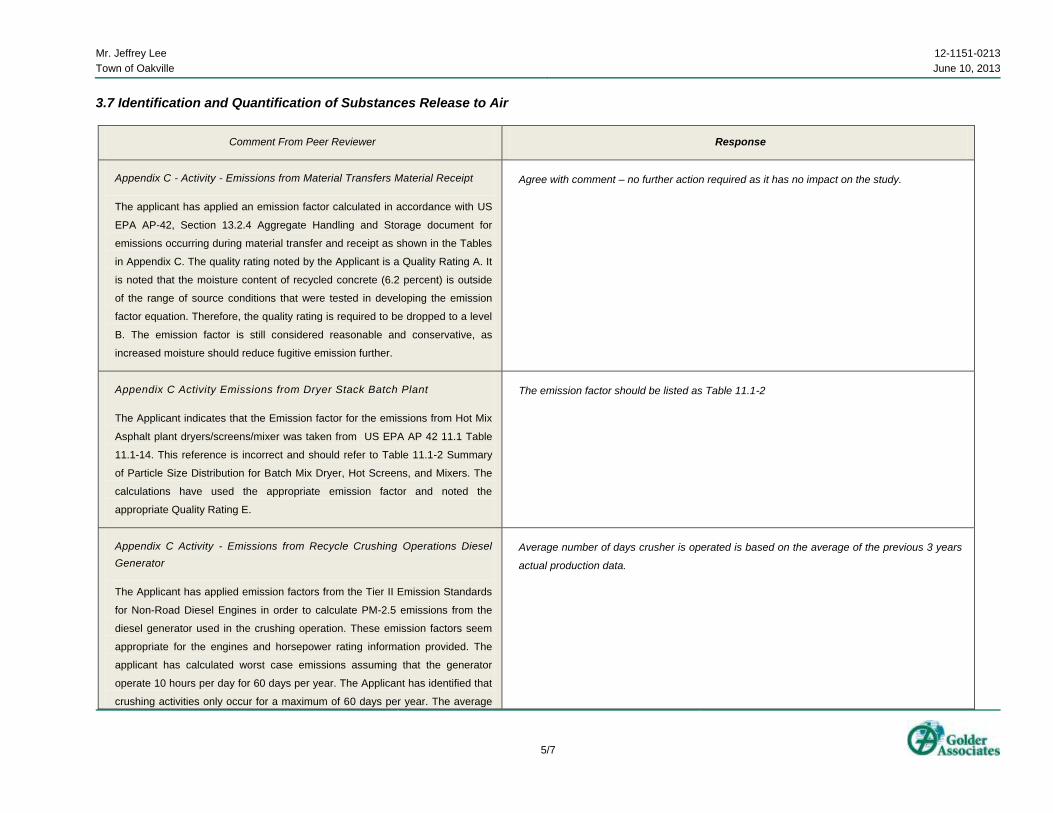
Appendix C - Activity - Emissions from Material Transfers Material Receipt
The applicant has applied an emission factor calculated in accordance with US
EPA AP-42, Section 13.2.4 Aggregate Handling and Storage document for
emissions occurring during material transfer and receipt as shown in the Tables
in Appendix C. The quality rating noted by the Applicant is a Quality Rating A. It
is noted that the moisture content of recycled concrete (6.2 percent) is outside
of the range of source conditions that were tested in developing the emission
factor equation. Therefore, the quality rating is required to be dropped to a level
B. The emission factor is still considered reasonable and conservative, as
increased moisture should reduce fugitive emission further.
Agree with comment – no further action required as it has no impact on the study.
Appendix C Activity Emissions from Dryer Stack Batch Plant
The Applicant indicates that the Emission factor for the emissions from Hot Mix
Asphalt plant dryers/screens/mixer was taken from US EPA AP 42 11.1 Table
11.1-14. This reference is incorrect and should refer to Table 11.1-2 Summary
of Particle Size Distribution for Batch Mix Dryer, Hot Screens, and Mixers. The
calculations have used the appropriate emission factor and noted the
appropriate Quality Rating E.
The emission factor should be listed as Table 11.1-2
Appendix C Activity - Emissions from Recycle Crushing Operations Diesel
Generator
The Applicant has applied emission factors from the Tier II Emission Standards
for Non-Road Diesel Engines in order to calculate PM-2.5 emissions from the
diesel generator used in the crushing operation. These emission factors seem
appropriate for the engines and horsepower rating information provided. The
applicant has calculated worst case emissions assuming that the generator
operate 10 hours per day for 60 days per year. The Applicant has identified that
crushing activities only occur for a maximum of 60 days per year. The average
Average number of days crusher is operated is based on the average of the previous 3 years
actual production data.
Mr. Jeffrey Lee 12-1151-0213
Town of Oakville June 10, 2013
6/7
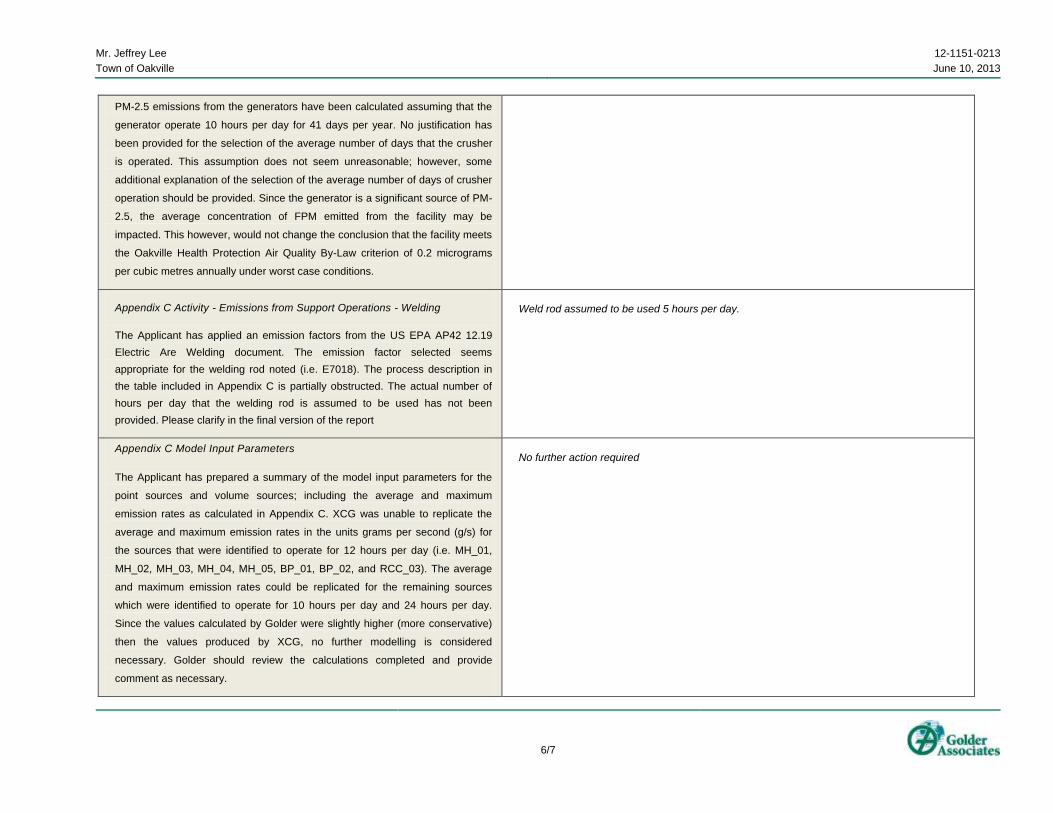
PM-2.5 emissions from the generators have been calculated assuming that the
generator operate 10 hours per day for 41 days per year. No justification has
been provided for the selection of the average number of days that the crusher
is operated. This assumption does not seem unreasonable; however, some
additional explanation of the selection of the average number of days of crusher
operation should be provided. Since the generator is a significant source of PM-
2.5, the average concentration of FPM emitted from the facility may be
impacted. This however, would not change the conclusion that the facility meets
the Oakville Health Protection Air Quality By-Law criterion of 0.2 micrograms
per cubic metres annually under worst case conditions.
Appendix C Activity - Emissions from Support Operations - Welding
The Applicant has applied an emission factors from the US EPA AP42 12.19
Electric Are Welding document. The emission factor selected seems
appropriate for the welding rod noted (i.e. E7018). The process description in
the table included in Appendix C is partially obstructed. The actual number of
hours per day that the welding rod is assumed to be used has not been
provided. Please clarify in the final version of the report
Weld rod assumed to be used 5 hours per day.
Appendix C Model Input Parameters
The Applicant has prepared a summary of the model input parameters for the
point sources and volume sources; including the average and maximum
emission rates as calculated in Appendix C. XCG was unable to replicate the
average and maximum emission rates in the units grams per second (g/s) for
the sources that were identified to operate for 12 hours per day (i.e. MH_01,
MH_02, MH_03, MH_04, MH_05, BP_01, BP_02, and RCC_03). The average
and maximum emission rates could be replicated for the remaining sources
which were identified to operate for 10 hours per day and 24 hours per day.
Since the values calculated by Golder were slightly higher (more conservative)
then the values produced by XCG, no further modelling is considered
necessary. Golder should review the calculations completed and provide
comment as necessary.
No further action required
Mr. Jeffrey Lee 12-1151-0213
Town of Oakville June 10, 2013
7/7
3.7 Identification and Quantification of Substances Release to Air
Comment From Peer Reviewer Response
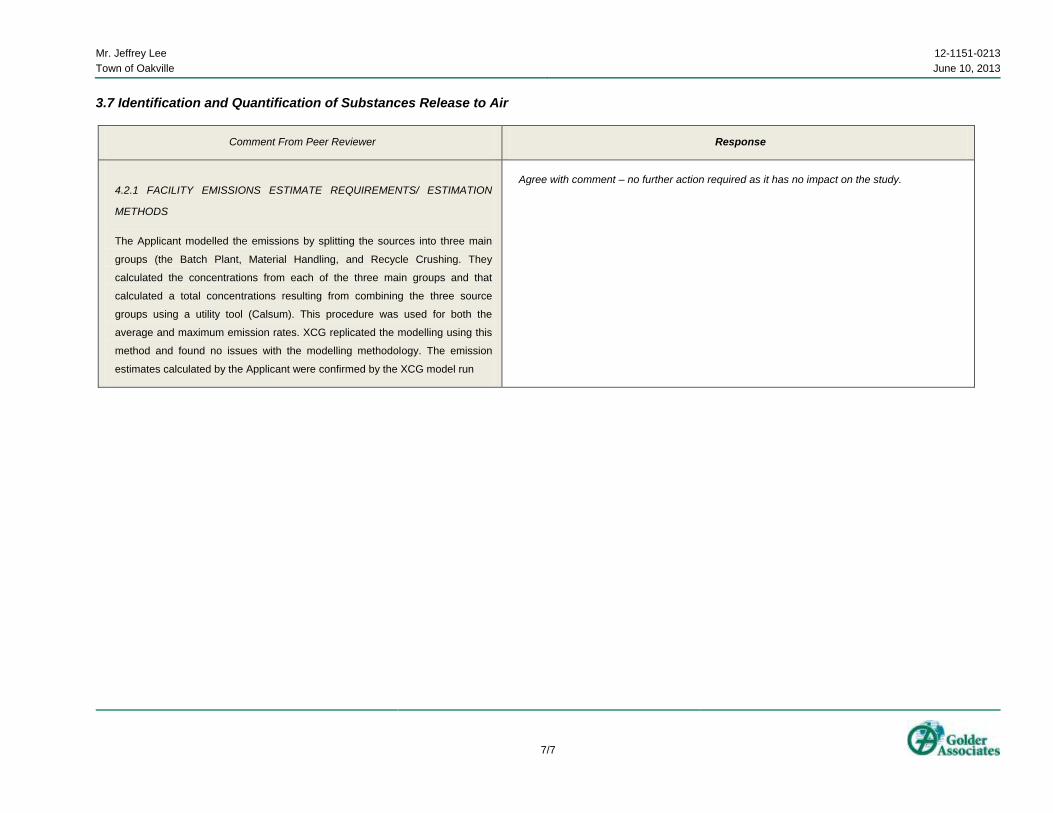
4.2.1 FACILITY EMISSIONS ESTIMATE REQUIREMENTS/ ESTIMATION
METHODS
The Applicant modelled the emissions by splitting the sources into three main
groups (the Batch Plant, Material Handling, and Recycle Crushing. They
calculated the concentrations from each of the three main groups and that
calculated a total concentrations resulting from combining the three source
groups using a utility tool (Calsum). This procedure was used for both the
average and maximum emission rates. XCG replicated the modelling using this
method and found no issues with the modelling methodology. The emission
estimates calculated by the Applicant were confirmed by the XCG model run
Agree with comment – no further action required as it has no impact on the study.
!
!
!
!
!
!
!
!
!
!
!
!
!
!
!!
!!
!!
!!
!!
!!
!!
!!
!!
!!
!!
!!
!!
!!
!!
!!
!!
!!
!!
!!
!!
!!
!!
!!
!!
!!
!!
!!
!!
!!
!!
!!
!!
!!
!!
!
!
!
!
!
!
!
!
!
!!
!!
!!
!!
!!
!!
!
!
!
!
!
!
!
!
!
!
!
!
!
!
!
!
!
!
!
!
!
!
!
!
!
!
!
!
!
!
!
!
!
!
!
!
!
!
!
!
!
!
!
!
!
!
!
!
!
!
!
!
!
!
!
!
!
!
!
!
!
!
!
!
!
!
!
!
!
!
!
!
!
!
!
!!
Fourteen Mile Creek
LakeOntario
SPEE
RS RD
SOLINGATE DR
MARINE DR
BELVEDERE DR
E STMONKS PASS
SABEL ST
SHADY GLENRD
REBEC
CA ST
WESTDALE RD
SPRINGGN RD
WESTO
AK TR
AILS B
LVD
MAURICE DR
GOLDEN
ORCH TRAIL
FELAN AVE
SUNSET DR
WATERS EDGE
DR
JEAN
ETTE
DR
DEANE AVE
TREVOR DR
SPRIN
GDAL
ERD
WYECROFT
RD
TENNYSON DR
BRONTE RD
SANDPIPER RD
VILMA DR
MAYFAIR RD
JONES ST
LAKE
SHOR
ERD
W
4TH LINE
GLEN ABBEY GATE
KINGSCOLLEGE DR
WYATT
ST
YOLANDA DR
VALE PL
SALVATOR BLVD
MORDEN RD
3RD LINE
BURTON RD
WEIGHTON DR
SEAF
ARE DR
VALLEY DR
HIXON ST
TOWER DR
SAXO
NRD
GLEN OAK DR
STANFIELD DR
MAPLEHURST AVE
STONEYBROOKTRAIL
BOWMANDR
SOUTHVIEW RD
VANCE DR
WESTMINSTER DR
ABBEYWOOD DR
SANDWELL DR
UPPER
MIDDLE RD W
WOODALE AVE
WOODHAVEN PK DR
ASHBURY RD
TRACINA DR
WARMINSTER DR
WINSTON RD
SECORD
AVE
NELSON ST
WALLACE RD
SARTA
RD
GLEN
HAMP
TON
RD
MONTGOMERY DR
TILFORD RD
WELLER CRTDORVAL DR
WYECROFT
RD
WILLOWDOWN RD
ORCH DR
S SERV
RD W
QUEEN EL
IZABE
THWAY
3RD LINE
N SERV RD
W
WILDER DR
SUFFOLK AVE
WEIR AVE
PACIFIC RD
PROGRESS CRT
FOURTH LINE
PARI
S H
LANE
VENETIA DR
MCPHERSON RD
N SERV RD W
BRAYS LANE
PILGRIMS WAY
PATR
ICIA DR
WILLIS DR
SHERIN DR
VICKERY DR
ASHMORE DR
MARGARET DR
HERI
TAGE
WAY
BRIDGE R
D
SANDLEWOOD
RD
WYANDOTTE
DR WALBY DR
WINDRUSH DR
VENTURA DR
TUDOR AVE
PINEGROVE RD
SEATON
DR
SUNNYV
ALE D
R
OLD COLONY RD
S SERV RD W
STANBURY R
D
WESTM
OUNT DRROSE
MOUNTCRES
WELDON AVE
ADVA
NCE
RD
FIELD
CRESTLAN
E
ULRIC CRES
SUNRISE CRES
WOBURN CRES
BIRCH HILL LANE
601000
601000
602000
602000
603000
603000
604000
604000
605000
605000
606000
606000
4806
000
4806
000
4807
000
4807
000
4808
000
4808
000
4809
000
4809
000
4810
000
4810
000
G:\P
rojec
ts\20
12\12
-1151
-0213
_Bron
te_As
phalt
_Plan
t\GIS
\MXD
s\Rep
orting
\Zonin
g.mxd
³LEGEND
Base Data - MNR NRVIS, obtained 2004, CANMAP v2006.4Produced by Golder Associates Ltd under licence from Ontario Ministry of Natural Resources, © Queens Printer 2008Projection: Transverse Mercator Datum: NAD 83 Coordinate System: UTM Zone 17Zoning data obtained from Town of Oakville website.
REV. 0.0
Mississauga, Ontario
DESIGN
LAND USE ZONING DESIGNATION
FIGURE: 2PROJECT NO. 12-1151-0213 SCALE AS SHOWN
PROJECT
TITLE
GIS
REVIEW
KD 20 Jan. 2011
CHECK
BRONTE ASPHALT PLANTHPAQB APPLICATION
JR 6 Sep. 2012CMTH
6 Sep. 20126 Sep. 2012
!.
!.
!.
!.
QUEEN ELIZABETH
WAYHIGHWAY 401
HIGHW
AY 40
7
HIGHWAY 8 HIGHWAY 403
HIGHWAY 5 W
Guelph
Hamilton
Oakville
Burlington
1122334455
REFERENCE
INDEX MAP
SCALE
SITE
LakeOntario
1:20,0000.5 0 0.5 10.25
KILOMETERS
Approximate Property BoundaryRailwaysWatercourseWaterbody
ZONING DEFINITIONS