Embed Size (px)
Citation preview
Deutsche Bank Markets Research
Industry
Global LNG
Date 1 December 2014 Europe United Kingdom Oil & Gas Exploration & Production
F.I.T.T. for investors
Bloated with Gas
US LNG: Challenging price, deferring growth
US LNG supply growth will absorb much demand growth in the next 10 yrs. It should come at prices below current market; bad news for existing suppliers. The IOCs will likely curb capex on LNG developments, supportive of cash flow, and greater supply may help trading operations, but fundamentally lower prices are a negative: c5% hit to super major profits by 2020.
Lucas Herrmann, ACA
Research Analyst (+44) 20 754-73636 [email protected]
Mark Bloomfield, ACA
Research Analyst (+44) 20 754-57905 [email protected]
Sebastian Yoshida
Research Analyst (+44) 20 754-56489 [email protected]
________________________________________________________________________________________________________________
Deutsche Bank AG/London
Deutsche Bank does and seeks to do business with companies covered in its research reports. Thus, investors should be aware that the firm may have a conflict of interest that could affect the objectivity of this report. Investors should consider this report as only a single factor in making their investment decision. DISCLOSURES AND ANALYST CERTIFICATIONS ARE LOCATED IN APPENDIX 1. MCI (P) 148/04/2014.

Deutsche Bank Markets Research
Europe United Kingdom Oil & Gas Exploration & Production
Industry
Global LNG
Date 1 December 2014
FITT Research
Bloated with Gas
US LNG: Challenging price, deferring growth
________________________________________________________________________________________________________________
Deutsche Bank AG/London
Deutsche Bank does and seeks to do business with companies covered in its research reports. Thus, investors should be aware that the firm may have a conflict of interest that could affect the objectivity of this report. Investors should consider this report as only a single factor in making their investment decision. DISCLOSURES AND ANALYST CERTIFICATIONS ARE LOCATED IN APPENDIX 1. MCI (P) 148/04/2014.
Lucas Herrmann, ACA
Research Analyst (+44) 20 754-73636 [email protected]
Mark Bloomfield, ACA
Research Analyst (+44) 20 754-57905 [email protected]
Sebastian Yoshida
Research Analyst (+44) 20 754-56489 [email protected]
US LNG: Sector impact
Sector Impact How Winner/loser
US E&P Positive Rising demand
EQT, GPOR
Euro Utilities Negative Margin squeeze
Drax, EDF,
CentricaKorean Utility Positive Feedstock
costKepco, Kogas
Russian gas Negative Volume & price
Gazprom
Euro E&C Negative Int'l deferrals
Saipem, Subsea7
US E&C Positive US build CBI, Fluor
Japan E&C Positive US exposure
Chiyoda, JGC
LNG Shipping Positive Shipping miles
GTT
Source: Deutsche Bank
US LNG: Surpassing expectations
2011 2012 2013 2014 2015 2016 2017 2018 2019 2020 2021 2022 2023 2024 2025
a
2011 Q4 - US Export LNG Capacity 2014 Q2 - US Export LNG capacity
US supply estimates by 2025 have RISEN by c80mtpa
Source: Deutsche Bank
US LNG supply growth will absorb much demand growth in the next 10 yrs. It should come at prices below current market; bad news for existing suppliers. The IOCs will likely curb capex on LNG developments, supportive of cash flow, and greater supply may help trading operations, but fundamentally lower prices are a negative: c5% hit to super major profits by 2020.
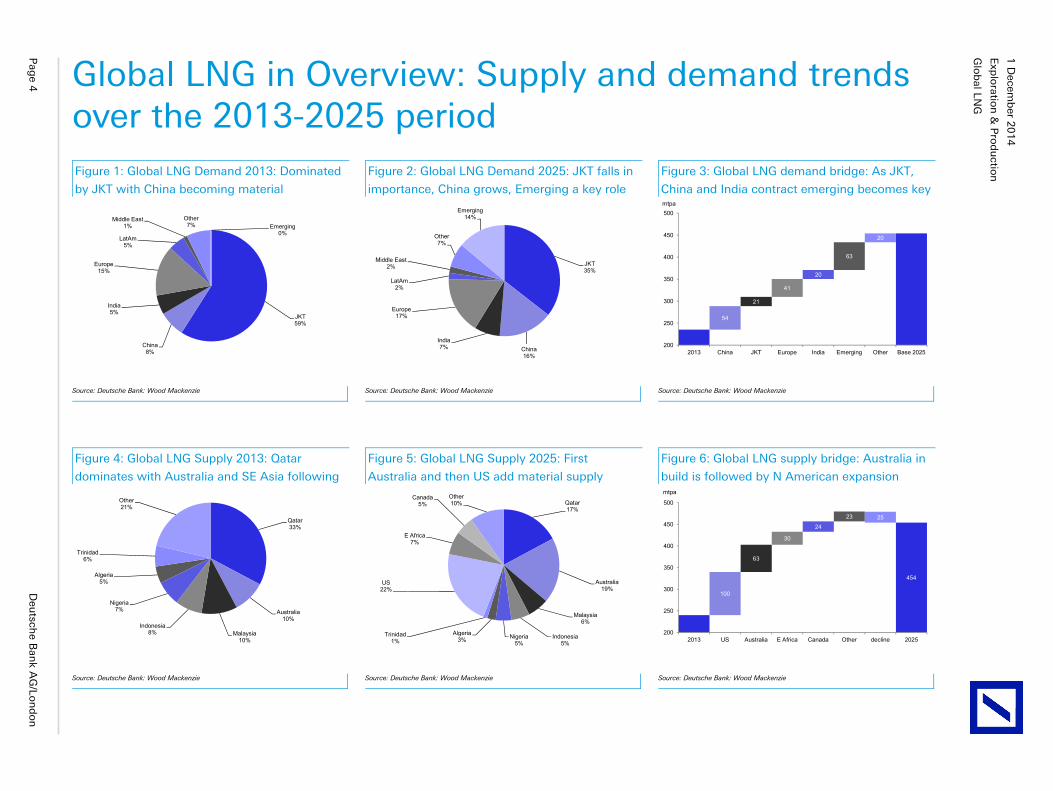
US supply take greater share of global LNG market than previously thought LNG remains a growth market with global demand of 240mtpa seen rising to c450mtpa by 2025. Yet, as the political barriers to US exports fall and the DoE’s export ‘ceiling’ rises so US supply will eat much of the market growth. 50mtpa of US LNG is under construction, with contracts for 70mtpa signed.
Need a customer to commit before build Greenfield projects from East Africa to Australia will struggle to compete on price alone. And as US supply satiates demand growth from the major buyers (JKT, India and, indirectly, China) so non-US projects will struggle to aggregate demand from other potential customers. We expect many planned projects (Mozambique, Tanzania, Canada = ENI, BG, Ophir, Shell) to see delays.
Shifting price and price mechanics for the market Asia takes 70% of today’s supply, largely priced as a % of crude oil. Switch to the greater use of US gas (Henry Hub) in price formula and US supply drives a potential 6% clip to existing LT pricing. With many contracts allowing for price reset every five years this matters. Add in greater competition in spot markets and we see Asian spot pricing down at least 20% on the $15/mmbtu 3-yr average. That will hit trading income. Unlikely felt until end decade, but we see contract and spot reductions clipping c5% of forecast NI for the major players.
There is a positive: capex likely much reduced, trading volumes enhanced Today c15-20% of major IOC capex is on LNG developments. We think much will be deferred in 2015/beyond, potentially a material $10bn plus curb on near term IOC capex. For those with trading businesses (BP & BG) greater access to US volumes gives an attractive, low capital, source of annuity cash flow.
Other industries? For Europe, by 2022 70bcm (15% of supply) could come from the US, potentially cutting Russian dominance of Europe markets (to 22% from 33% now) unless significant ground is ceded on price. For European Oil & Gas E&C companies the shift in build to the US represents another nail in their coffin. Euro utility? Falling spot gas helps affordability but curbs UK power margin.
Why bother writing this report? LNG matters to the IOCs: long-lived, low maintenance it grows towards 20% of operating cash flows by 2020. With the downstream pressured, this shift has been central to the rebuild of cash cycles at Shell, Total, Chevron and Exxon. Relative winner? BP. A price disrupter and less dependent on Asia, BP is long US gas and short European, a positive given the likely trade flows.
Glo
bal LN
G
Exp
loratio
n &
Pro
du
ction
1 D
ecemb
er 20
14
Pag
e 2
Deu
tsche B
ank A
G/Lo
nd
on
Table Of Contents
Global LNG in Overview: Supply and demand trends over the 2013-2025 period .............................................................. 4
Executive Summary ............................................................................................................................................................. 5 US LNG: Changing Industry Dynamics .................................................................................................................................................................................................. 5 US LNG: Demand outlook still healthy – but it is the US that is eating the nearer term opportunity ................................................................................................... 6 US LNG: Changing the basis of industry pricing and with it contract profitability ............................................................................................................................... 7 US LNG: What are the major negatives? ............................................................................................................................................................................................... 8 US LNG: There are clear positives – cash and portfolio ......................................................................................................................................................................... 9 US LNG: And what of Europe? Russian gas pushed out ..................................................................................................................................................................... 10 US LNG: For the corporate, portfolio LNG is key ................................................................................................................................................................................. 11 US LNG: What are the broader industry implications? ........................................................................................................................................................................ 12
The IOC Major’s portfolios compared: Gas into LNG, liquefaction, ships, regas and LNG contracted ............................. 13
The IOC Majors: Why you should care - cash flow set to surge as investment starts to pay dividends .......................... 14
The IOC Majors: Why you should care – by 2020 LNG will be c15% average income and cash flow ............................. 15
US LNG: Eating into the global supply option pool ........................................................................................................... 17 US LNG: Changes in the approval process have supported ‘real’ projects and accelerated development ........................................................................................ 18 US supply – To date some 70mtpa of SPA’s have been placed but are signs of buyer fatigue now emerging? ............................................................................... 19
Global LNG: Demand & Supply. Where are we? ............................................................................................................... 22 LNG demand – US contracts look to have sated Japanese demand to 2022; China gains the whip hand ........................................................................................ 23 Supply side – Demand suggests a further 150mtpa of capacity needed; of this 30mtpa at least from US? ..................................................................................... 24 Supply side – Considering marginal cost, US approvals threaten to push out ‘conventional supply schemes ................................................................................. 24 Supply deferral – a major boost to IOC cash flows? ............................................................................................................................................................................ 26
US LNG: The Implications ................................................................................................................................................. 27 Growth in US supply holds multiple market implications .................................................................................................................................................................... 27 Implications: Given an inflexion in US gas demand growth will Henry Hub prices escalate sharply? .............................................................................................. 28 Implications: What does Henry Hub priced LNG imply for global LNG contract pricing? .................................................................................................................. 29 US LNG – What happens to IOC LNG profits if the market rebases to a 60/40 Oil/Hub hybrid ‘norm’? ............................................................................................ 31 US LNG: What are the implications for portfolio players? ................................................................................................................................................................... 32 US LNG: What are the implications? Portfolio players will face pressure on margin ......................................................................................................................... 34
LNG – What does the US excess do for Europe? .............................................................................................................. 35 If Europe is the sink – whereto markets and pricing? .......................................................................................................................................................................... 35
Appendix A: The major IOC participants ........................................................................................................................... 38 The companies in profile – who has what? .......................................................................................................................................................................................... 38
BG Group (Buy 1300p) ....................................................................................................................................................... 39 Portfolio value ....................................................................................................................................................................................................................................... 39
Glo
bal LN
G
Exp
loratio
n &
Pro
du
ction
1 D
ecemb
er 20
14
Deu
tsche B
ank A
G/Lo
nd
on
P
age 3
Table Of Contents Cont'd.
BP (Hold PT 500p) ............................................................................................................................................................. 41 Reinvigorated by US access ................................................................................................................................................................................................................. 41
Chevron (Buy PT $140) ...................................................................................................................................................... 43 Huge Change Coming .......................................................................................................................................................................................................................... 43
ENI (Hold PT €19) .............................................................................................................................................................. 45 From nowhere to ……. ......................................................................................................................................................................................................................... 45
Exxon (Hold $103) ............................................................................................................................................................. 47 If you want someone to execute project ….. ....................................................................................................................................................................................... 47
RDS (Buy 2600p) ............................................................................................................................................................... 49 Industry leader with a cash surge coming ........................................................................................................................................................................................... 49
Total (Buy PT €50) ............................................................................................................................................................. 51 Building out, enhancing its options ...................................................................................................................................................................................................... 51
Appendix B: Other Industry Implications ........................................................................................................................... 53 US LNG: What are the threats and opportunities for other industries? .............................................................................................................................................. 53
North American E&P ......................................................................................................................................................... 54 Look to the low cost Appalachians ...................................................................................................................................................................................................... 54
European utilities ............................................................................................................................................................... 55 Plentiful US LNG could squeeze margins in Europe, but offer LatAm upside ..................................................................................................................................... 55
Korean utilities ................................................................................................................................................................... 56 Long term positive from falling LNG prices ......................................................................................................................................................................................... 56
Russian piped gas .............................................................................................................................................................. 57 Gazprom’s volumes into Europe under threat of decline from US LNG .............................................................................................................................................. 57
Global engineering & construction .................................................................................................................................... 59 Mixed potential for global E&C contractors ......................................................................................................................................................................................... 59 European E&C – more pain .................................................................................................................................................................................................................. 59 US E&C – prime beneficiaries from the US build out .......................................................................................................................................................................... 60 Japan EPC - Direct beneficiary from US LNG cycle ............................................................................................................................................................................. 61
LNG shipping ..................................................................................................................................................................... 62 Positives begin to emerge .................................................................................................................................................................................................................... 62
GTT (HOLD – E51 TP) ......................................................................................................................................................... 63 A key beneficiary of the emerging build of US LNG ............................................................................................................................................................................ 63
Glo
bal LN
G
Exp
loratio
n &
Pro
du
ction
1 D
ecemb
er 20
14
Pag
e 4
Deu
tsche B
ank A
G/Lo
nd
on
Global LNG in Overview: Supply and demand trends over the 2013-2025 period Figure 1: Global LNG Demand 2013: Dominated
by JKT with China becoming material
Figure 2: Global LNG Demand 2025: JKT falls in
importance, China grows, Emerging a key role
Figure 3: Global LNG demand bridge: As JKT,
China and India contract emerging becomes key
JKT59%
China8%
India5%
Europe15%
LatAm5%
Middle East1%
Other7% Emerging
0%
JKT35%
China16%
India7%
Europe17%
LatAm2%
Middle East2%
Other7%
Emerging14%
54
21
41
20
63
20
200
250
300
350
400
450
500
2013 China JKT Europe India Emerging Other Base 2025
mtpa
Source: Deutsche Bank: Wood Mackenzie Source: Deutsche Bank: Wood Mackenzie Source: Deutsche Bank: Wood Mackenzie
Figure 4: Global LNG Supply 2013: Qatar
dominates with Australia and SE Asia following
Figure 5: Global LNG Supply 2025: First
Australia and then US add material supply
Figure 6: Global LNG supply bridge: Australia in
build is followed by N American expansion
Qatar33%
Australia10%
Malaysia10%
Indonesia8%
Nigeria7%
Algeria5%
Trinidad6%
Other21%
Qatar17%
Australia19%
Malaysia6%
Indonesia5%
Nigeria5%
Algeria3%
Trinidad1%
US 22%
E Africa7%
Canada5%
Other10%
454
100
63
30
24
23 25
200
250
300
350
400
450
500
2013 US Australia E Africa Canada Other decline 2025
mtpa
Source: Deutsche Bank: Wood Mackenzie Source: Deutsche Bank: Wood Mackenzie Source: Deutsche Bank: Wood Mackenzie
Glo
bal LN
G
Exp
loratio
n &
Pro
du
ction
1 D
ecemb
er 20
14
Deu
tsche B
ank A
G/Lo
nd
on
P
age 5
Executive Summary
US LNG: Changing Industry Dynamics
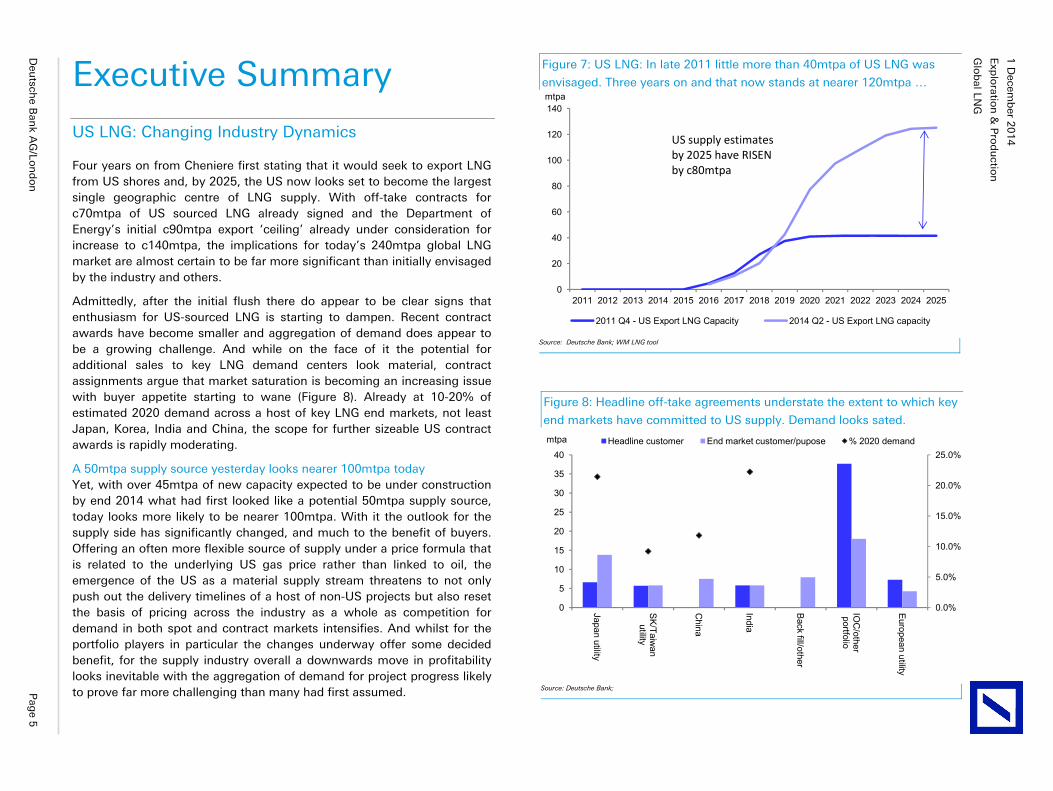
Four years on from Cheniere first stating that it would seek to export LNG from US shores and, by 2025, the US now looks set to become the largest single geographic centre of LNG supply. With off-take contracts for c70mtpa of US sourced LNG already signed and the Department of Energy’s initial c90mtpa export ‘ceiling’ already under consideration for increase to c140mtpa, the implications for today’s 240mtpa global LNG market are almost certain to be far more significant than initially envisaged by the industry and others.
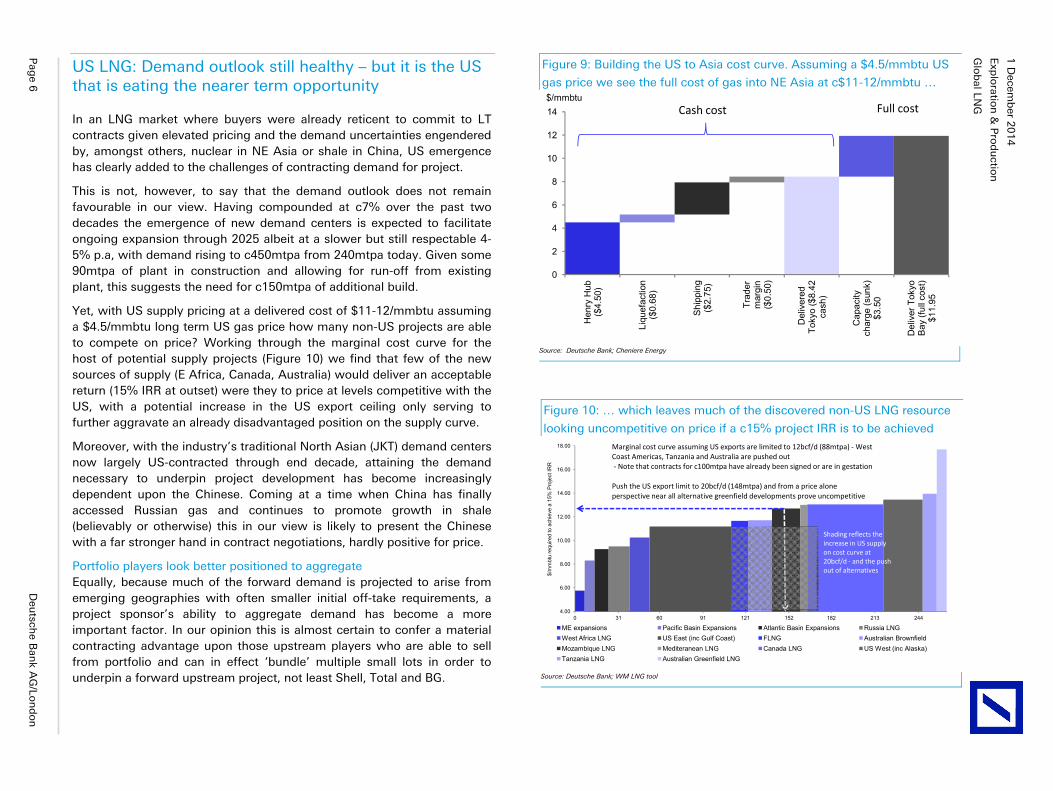
Admittedly, after the initial flush there do appear to be clear signs that enthusiasm for US-sourced LNG is starting to dampen. Recent contract awards have become smaller and aggregation of demand does appear to be a growing challenge. And while on the face of it the potential for additional sales to key LNG demand centers look material, contract assignments argue that market saturation is becoming an increasing issue with buyer appetite starting to wane (Figure 8). Already at 10-20% of estimated 2020 demand across a host of key LNG end markets, not least Japan, Korea, India and China, the scope for further sizeable US contract awards is rapidly moderating.
A 50mtpa supply source yesterday looks nearer 100mtpa today Yet, with over 45mtpa of new capacity expected to be under construction by end 2014 what had first looked like a potential 50mtpa supply source, today looks more likely to be nearer 100mtpa. With it the outlook for the supply side has significantly changed, and much to the benefit of buyers. Offering an often more flexible source of supply under a price formula that is related to the underlying US gas price rather than linked to oil, the emergence of the US as a material supply stream threatens to not only push out the delivery timelines of a host of non-US projects but also reset the basis of pricing across the industry as a whole as competition for demand in both spot and contract markets intensifies. And whilst for the portfolio players in particular the changes underway offer some decided benefit, for the supply industry overall a downwards move in profitability looks inevitable with the aggregation of demand for project progress likely to prove far more challenging than many had first assumed.
Figure 8: Headline off-take agreements understate the extent to which key
end markets have committed to US supply. Demand looks sated.
0.0%
5.0%
10.0%
15.0%
20.0%
25.0%
0
5
10
15
20
25
30
35
40Japan utility
SK/Taiw
an utility
China
India
Back fill/other
IOC
/other portfolio
European utility
mtpa Headline customer End market customer/pupose % 2020 demand
Source: Deutsche Bank;
Figure 7: US LNG: In late 2011 little more than 40mtpa of US LNG was
envisaged. Three years on and that now stands at nearer 120mtpa …
0
20
40
60
80
100
120
140
2011 2012 2013 2014 2015 2016 2017 2018 2019 2020 2021 2022 2023 2024 2025
mtpa
2011 Q4 - US Export LNG Capacity 2014 Q2 - US Export LNG capacity
US supply estimates by 2025 have RISEN by c80mtpa
Source: Deutsche Bank; WM LNG tool
Glo
bal LN
G
Exp
loratio
n &
Pro
du
ction
1 D
ecemb
er 20
14
Pag
e 6
Deu
tsche B
ank A
G/Lo
nd
on
US LNG: Demand outlook still healthy – but it is the US that is eating the nearer term opportunity
In an LNG market where buyers were already reticent to commit to LT contracts given elevated pricing and the demand uncertainties engendered by, amongst others, nuclear in NE Asia or shale in China, US emergence has clearly added to the challenges of contracting demand for project.
This is not, however, to say that the demand outlook does not remain favourable in our view. Having compounded at c7% over the past two decades the emergence of new demand centers is expected to facilitate ongoing expansion through 2025 albeit at a slower but still respectable 4-5% p.a, with demand rising to c450mtpa from 240mtpa today. Given some 90mtpa of plant in construction and allowing for run-off from existing plant, this suggests the need for c150mtpa of additional build.
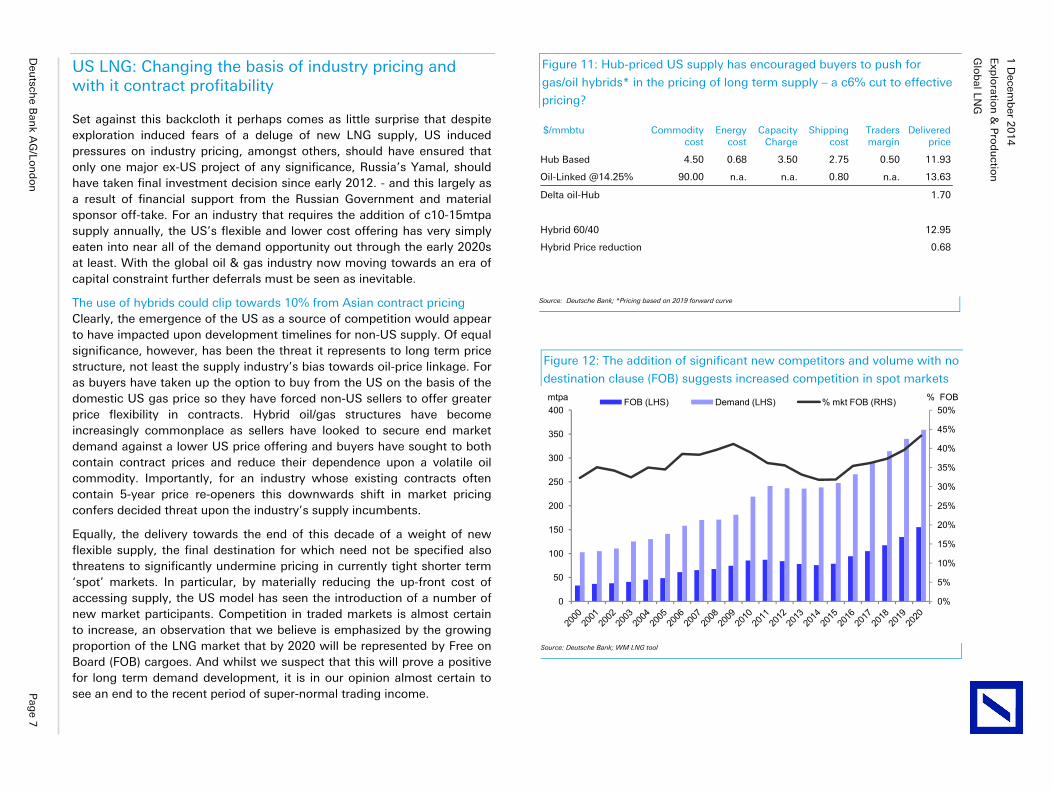
Yet, with US supply pricing at a delivered cost of $11-12/mmbtu assuming a $4.5/mmbtu long term US gas price how many non-US projects are able to compete on price? Working through the marginal cost curve for the host of potential supply projects (Figure 10) we find that few of the new sources of supply (E Africa, Canada, Australia) would deliver an acceptable return (15% IRR at outset) were they to price at levels competitive with the US, with a potential increase in the US export ceiling only serving to further aggravate an already disadvantaged position on the supply curve.
Moreover, with the industry’s traditional North Asian (JKT) demand centers now largely US-contracted through end decade, attaining the demand necessary to underpin project development has become increasingly dependent upon the Chinese. Coming at a time when China has finally accessed Russian gas and continues to promote growth in shale (believably or otherwise) this in our view is likely to present the Chinese with a far stronger hand in contract negotiations, hardly positive for price.
Portfolio players look better positioned to aggregate Equally, because much of the forward demand is projected to arise from emerging geographies with often smaller initial off-take requirements, a project sponsor’s ability to aggregate demand has become a more important factor. In our opinion this is almost certain to confer a material contracting advantage upon those upstream players who are able to sell from portfolio and can in effect ‘bundle’ multiple small lots in order to underpin a forward upstream project, not least Shell, Total and BG.
Figure 10: … which leaves much of the discovered non-US LNG resource
looking uncompetitive on price if a c15% project IRR is to be achieved
4.00
6.00
8.00
10.00
12.00
14.00
16.00
18.00
0 31 60 91 121 152 182 213 244
$/m
mbt
u re
quire
d to
ach
ieve
a 1
5% P
roje
ct IR
R
ME expansions Pacific Basin Expansions Atlantic Basin Expansions Russia LNGWest Africa LNG US East (inc Gulf Coast) FLNG Australian BrownfieldMozambique LNG Mediteranean LNG Canada LNG US West (inc Alaska)Tanzania LNG Australian Greenfield LNG
Marginal cost curve assuming US exports are limited to 12bcf/d (88mtpa) - WestCoast Americas, Tanzania and Australia are pushed out- Note that contracts for c100mtpa have already been signed or are in gestation
Push the US export limit to 20bcf/d (148mtpa) and from a price alone perspective near all alternative greenfield developments prove uncompetitive
Shading reflects the increase in US supply on cost curve at 20bcf/d - and the push out of alternatives
Source: Deutsche Bank; WM LNG tool
Figure 9: Building the US to Asia cost curve. Assuming a $4.5/mmbtu US
gas price we see the full cost of gas into NE Asia at c$11-12/mmbtu …
0
2
4
6
8
10
12
14
Hen
ry H
ub
($4.
50)
Liqu
efac
tion
($0.
68)
Shi
ppin
g ($
2.75
)
Trad
er
mar
gin
($0.
50)
Del
iver
ed
Toky
o ($
8.42
ca
sh)
Cap
acity
ch
arge
(sun
k)
$3.5
0
Del
iver
Tok
yo
Bay
(ful
l cos
t) $1
1.95
$/mmbtuCash cost Full cost
Source: Deutsche Bank; Cheniere Energy
Glo
bal LN
G
Exp
loratio
n &
Pro
du
ction
1 D
ecemb
er 20
14
Deu
tsche B
ank A
G/Lo
nd
on
P
age 7
US LNG: Changing the basis of industry pricing and with it contract profitability
Set against this backcloth it perhaps comes as little surprise that despite exploration induced fears of a deluge of new LNG supply, US induced pressures on industry pricing, amongst others, should have ensured that only one major ex-US project of any significance, Russia’s Yamal, should have taken final investment decision since early 2012. - and this largely as a result of financial support from the Russian Government and material sponsor off-take. For an industry that requires the addition of c10-15mtpa supply annually, the US’s flexible and lower cost offering has very simply eaten into near all of the demand opportunity out through the early 2020s at least. With the global oil & gas industry now moving towards an era of capital constraint further deferrals must be seen as inevitable.
The use of hybrids could clip towards 10% from Asian contract pricing Clearly, the emergence of the US as a source of competition would appear to have impacted upon development timelines for non-US supply. Of equal significance, however, has been the threat it represents to long term price structure, not least the supply industry’s bias towards oil-price linkage. For as buyers have taken up the option to buy from the US on the basis of the domestic US gas price so they have forced non-US sellers to offer greater price flexibility in contracts. Hybrid oil/gas structures have become increasingly commonplace as sellers have looked to secure end market demand against a lower US price offering and buyers have sought to both contain contract prices and reduce their dependence upon a volatile oil commodity. Importantly, for an industry whose existing contracts often contain 5-year price re-openers this downwards shift in market pricing confers decided threat upon the industry’s supply incumbents.
Equally, the delivery towards the end of this decade of a weight of new flexible supply, the final destination for which need not be specified also threatens to significantly undermine pricing in currently tight shorter term ‘spot’ markets. In particular, by materially reducing the up-front cost of accessing supply, the US model has seen the introduction of a number of new market participants. Competition in traded markets is almost certain to increase, an observation that we believe is emphasized by the growing proportion of the LNG market that by 2020 will be represented by Free on Board (FOB) cargoes. And whilst we suspect that this will prove a positive for long term demand development, it is in our opinion almost certain to see an end to the recent period of super-normal trading income.
Figure 12: The addition of significant new competitors and volume with no
destination clause (FOB) suggests increased competition in spot markets
0%
5%
10%
15%
20%
25%
30%
35%
40%
45%
50%
0
50
100
150
200
250
300
350
400% FOBmtpa FOB (LHS) Demand (LHS) % mkt FOB (RHS)
Source: Deutsche Bank; WM LNG tool
Figure 11: Hub-priced US supply has encouraged buyers to push for
gas/oil hybrids* in the pricing of long term supply – a c6% cut to effective
pricing?
$/mmbtu Commoditycost
Energy cost
Capacity Charge
Shipping cost
Traders margin
Delivered price
Hub Based 4.50 0.68 3.50 2.75 0.50 11.93
Oil-Linked @14.25% 90.00 n.a. n.a. 0.80 n.a. 13.63
Delta oil-Hub 1.70
Hybrid 60/40 12.95
Hybrid Price reduction 0.68
Source: Deutsche Bank; *Pricing based on 2019 forward curve
Glo
bal LN
G
Exp
loratio
n &
Pro
du
ction
1 D
ecemb
er 20
14
Pag
e 8
Deu
tsche B
ank A
G/Lo
nd
on
US LNG: What are the major negatives?
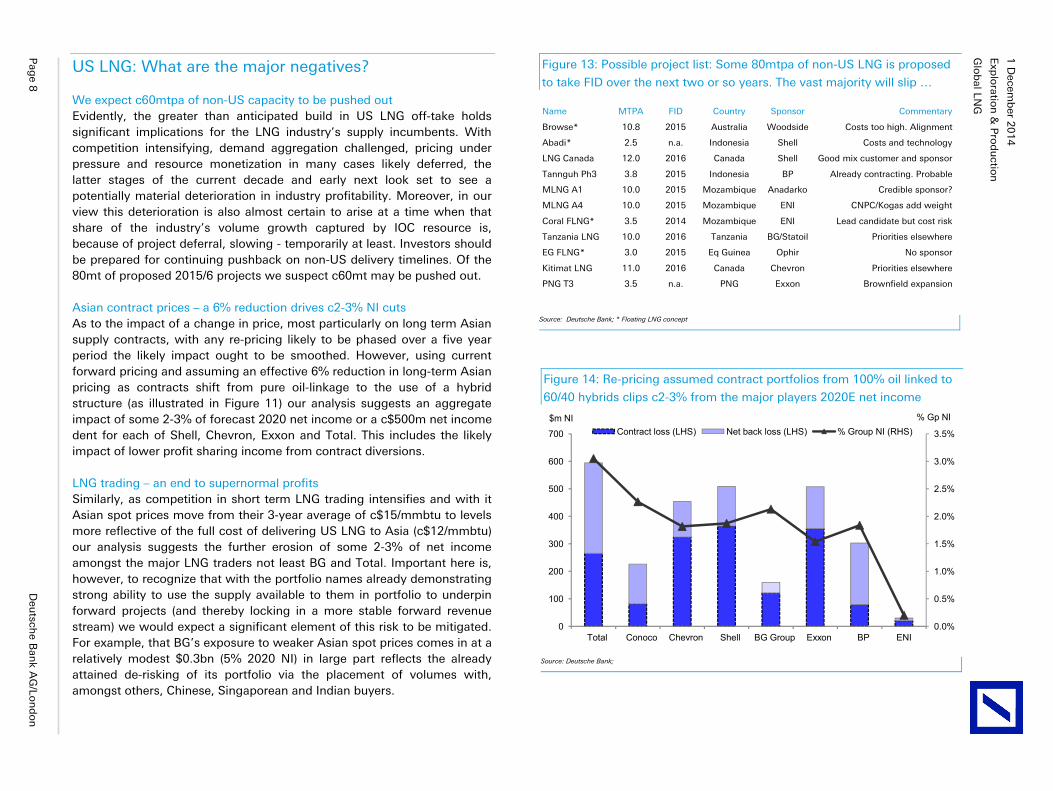
We expect c60mtpa of non-US capacity to be pushed out Evidently, the greater than anticipated build in US LNG off-take holds significant implications for the LNG industry’s supply incumbents. With competition intensifying, demand aggregation challenged, pricing under pressure and resource monetization in many cases likely deferred, the latter stages of the current decade and early next look set to see a potentially material deterioration in industry profitability. Moreover, in our view this deterioration is also almost certain to arise at a time when that share of the industry’s volume growth captured by IOC resource is, because of project deferral, slowing - temporarily at least. Investors should be prepared for continuing pushback on non-US delivery timelines. Of the 80mt of proposed 2015/6 projects we suspect c60mt may be pushed out.
Asian contract prices – a 6% reduction drives c2-3% NI cuts As to the impact of a change in price, most particularly on long term Asian supply contracts, with any re-pricing likely to be phased over a five year period the likely impact ought to be smoothed. However, using current forward pricing and assuming an effective 6% reduction in long-term Asian pricing as contracts shift from pure oil-linkage to the use of a hybrid structure (as illustrated in Figure 11) our analysis suggests an aggregate impact of some 2-3% of forecast 2020 net income or a c$500m net income dent for each of Shell, Chevron, Exxon and Total. This includes the likely impact of lower profit sharing income from contract diversions.
LNG trading – an end to supernormal profits Similarly, as competition in short term LNG trading intensifies and with it Asian spot prices move from their 3-year average of c$15/mmbtu to levels more reflective of the full cost of delivering US LNG to Asia (c$12/mmbtu) our analysis suggests the further erosion of some 2-3% of net income amongst the major LNG traders not least BG and Total. Important here is, however, to recognize that with the portfolio names already demonstrating strong ability to use the supply available to them in portfolio to underpin forward projects (and thereby locking in a more stable forward revenue stream) we would expect a significant element of this risk to be mitigated. For example, that BG’s exposure to weaker Asian spot prices comes in at a relatively modest $0.3bn (5% 2020 NI) in large part reflects the already attained de-risking of its portfolio via the placement of volumes with, amongst others, Chinese, Singaporean and Indian buyers.
Figure 14: Re-pricing assumed contract portfolios from 100% oil linked to
60/40 hybrids clips c2-3% from the major players 2020E net income
0.0%
0.5%
1.0%
1.5%
2.0%
2.5%
3.0%
3.5%
0
100
200
300
400
500
600
700
Total Conoco Chevron Shell BG Group Exxon BP ENI
% Gp NI$m NIContract loss (LHS) Net back loss (LHS) % Group NI (RHS)
Source: Deutsche Bank;
Figure 13: Possible project list: Some 80mtpa of non-US LNG is proposed
to take FID over the next two or so years. The vast majority will slip …
Name MTPA FID Country Sponsor Commentary
Browse* 10.8 2015 Australia Woodside Costs too high. Alignment
Abadi* 2.5 n.a. Indonesia Shell Costs and technology
LNG Canada 12.0 2016 Canada Shell Good mix customer and sponsor
Tannguh Ph3 3.8 2015 Indonesia BP Already contracting. Probable
MLNG A1 10.0 2015 Mozambique Anadarko Credible sponsor?
MLNG A4 10.0 2015 Mozambique ENI CNPC/Kogas add weight
Coral FLNG* 3.5 2014 Mozambique ENI Lead candidate but cost risk
Tanzania LNG 10.0 2016 Tanzania BG/Statoil Priorities elsewhere
EG FLNG* 3.0 2015 Eq Guinea Ophir No sponsor
Kitimat LNG 11.0 2016 Canada Chevron Priorities elsewhere
PNG T3 3.5 n.a. PNG Exxon Brownfield expansion
Source: Deutsche Bank; * Floating LNG concept
Glo
bal LN
G
Exp
loratio
n &
Pro
du
ction
1 D
ecemb
er 20
14
Deu
tsche B
ank A
G/Lo
nd
on
P
age 9
US LNG: There are clear positives – cash and portfolio
Between the potential negatives for resource maturation, competition and pricing it’s easy to see the emergence of a US export base as an outright negative for the supply incumbents. Yet at a time when investors are baying for capital restraint there are clear positives, most particularly in our view for those that have built a strong position in portfolio trading in recent years but also for cash flow across the industry more generally.
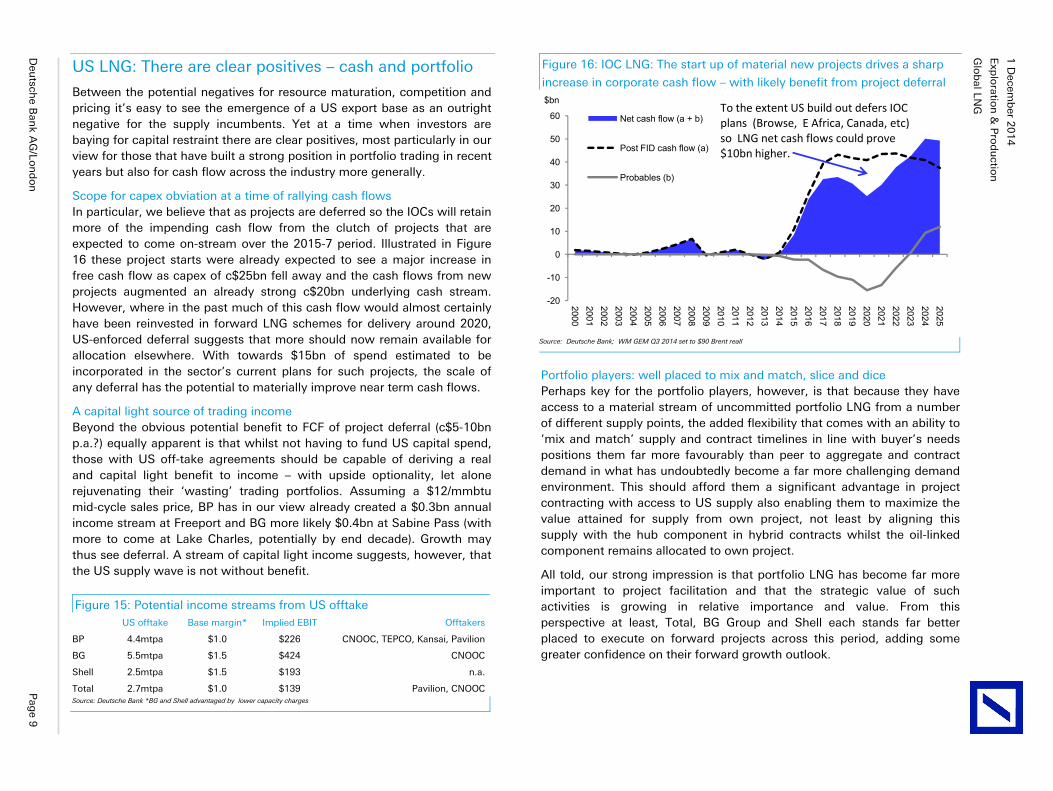
Scope for capex obviation at a time of rallying cash flows In particular, we believe that as projects are deferred so the IOCs will retain more of the impending cash flow from the clutch of projects that are expected to come on-stream over the 2015-7 period. Illustrated in Figure 16 these project starts were already expected to see a major increase in free cash flow as capex of c$25bn fell away and the cash flows from new projects augmented an already strong c$20bn underlying cash stream. However, where in the past much of this cash flow would almost certainly have been reinvested in forward LNG schemes for delivery around 2020, US-enforced deferral suggests that more should now remain available for allocation elsewhere. With towards $15bn of spend estimated to be incorporated in the sector’s current plans for such projects, the scale of any deferral has the potential to materially improve near term cash flows.
A capital light source of trading income Beyond the obvious potential benefit to FCF of project deferral (c$5-10bn p.a.?) equally apparent is that whilst not having to fund US capital spend, those with US off-take agreements should be capable of deriving a real and capital light benefit to income – with upside optionality, let alone rejuvenating their ‘wasting’ trading portfolios. Assuming a $12/mmbtu mid-cycle sales price, BP has in our view already created a $0.3bn annual income stream at Freeport and BG more likely $0.4bn at Sabine Pass (with more to come at Lake Charles, potentially by end decade). Growth may thus see deferral. A stream of capital light income suggests, however, that the US supply wave is not without benefit.
Figure 15: Potential income streams from US offtake US offtake Base margin* Implied EBIT Offtakers
BP 4.4mtpa $1.0 $226 CNOOC, TEPCO, Kansai, Pavilion
BG 5.5mtpa $1.5 $424 CNOOC
Shell 2.5mtpa $1.5 $193 n.a.
Total 2.7mtpa $1.0 $139 Pavilion, CNOOCSource: Deutsche Bank *BG and Shell advantaged by lower capacity charges
Portfolio players: well placed to mix and match, slice and dice Perhaps key for the portfolio players, however, is that because they have access to a material stream of uncommitted portfolio LNG from a number of different supply points, the added flexibility that comes with an ability to ‘mix and match’ supply and contract timelines in line with buyer’s needs positions them far more favourably than peer to aggregate and contract demand in what has undoubtedly become a far more challenging demand environment. This should afford them a significant advantage in project contracting with access to US supply also enabling them to maximize the value attained for supply from own project, not least by aligning this supply with the hub component in hybrid contracts whilst the oil-linked component remains allocated to own project.
All told, our strong impression is that portfolio LNG has become far more important to project facilitation and that the strategic value of such activities is growing in relative importance and value. From this perspective at least, Total, BG Group and Shell each stands far better placed to execute on forward projects across this period, adding some greater confidence on their forward growth outlook.
Figure 16: IOC LNG: The start up of material new projects drives a sharp
increase in corporate cash flow – with likely benefit from project deferral
-20
-10
0
10
20
30
40
50
60
20002001200220032004200520062007200820092010201120122013201420152016201720182019202020212022202320242025
$bn
Net cash flow (a + b)
Post FID cash flow (a)
Probables (b)
To the extent US build out defers IOC plans (Browse, E Africa, Canada, etc) so LNG net cash flows could prove $10bn higher.
Source: Deutsche Bank; WM GEM Q3 2014 set to $90 Brent reall
Glo
bal LN
G
Exp
loratio
n &
Pro
du
ction
1 D
ecemb
er 20
14
Pag
e 10
D
eutsch
e Ban
k AG
/Lon
do
n
US LNG: And what of Europe? Russian gas pushed out
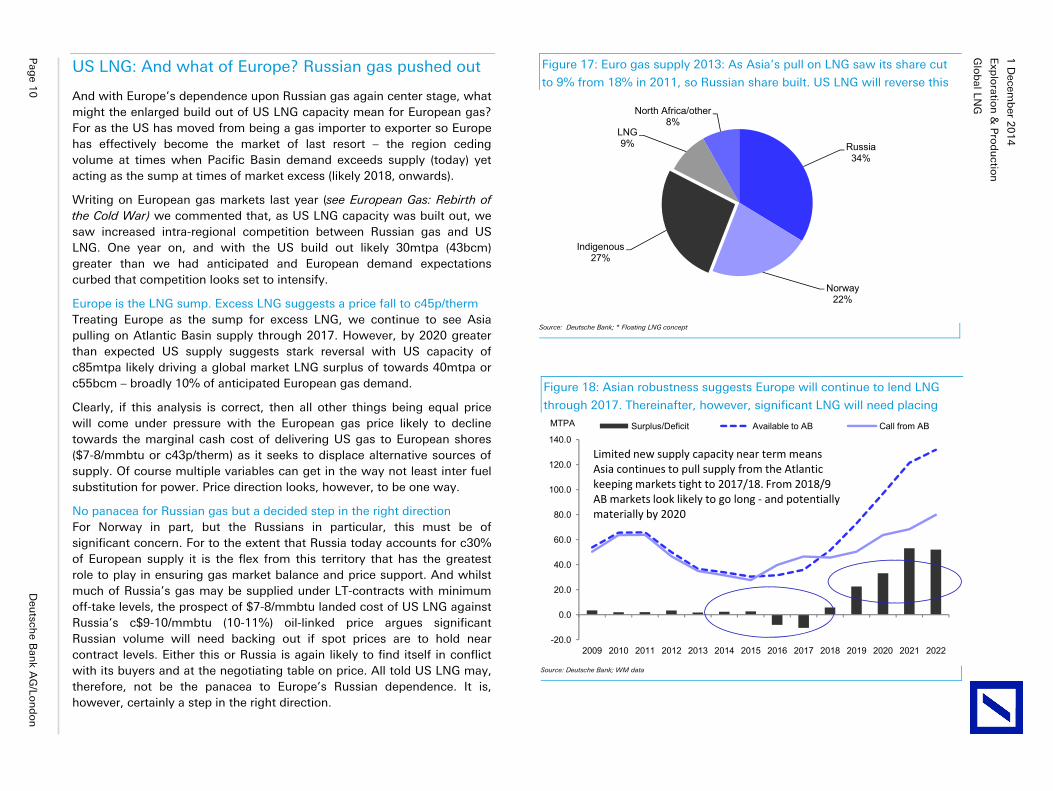
And with Europe’s dependence upon Russian gas again center stage, what might the enlarged build out of US LNG capacity mean for European gas? For as the US has moved from being a gas importer to exporter so Europe has effectively become the market of last resort – the region ceding volume at times when Pacific Basin demand exceeds supply (today) yet acting as the sump at times of market excess (likely 2018, onwards).
Writing on European gas markets last year (see European Gas: Rebirth of the Cold War) we commented that, as US LNG capacity was built out, we saw increased intra-regional competition between Russian gas and US LNG. One year on, and with the US build out likely 30mtpa (43bcm) greater than we had anticipated and European demand expectations curbed that competition looks set to intensify.
Europe is the LNG sump. Excess LNG suggests a price fall to c45p/therm Treating Europe as the sump for excess LNG, we continue to see Asia pulling on Atlantic Basin supply through 2017. However, by 2020 greater than expected US supply suggests stark reversal with US capacity of c85mtpa likely driving a global market LNG surplus of towards 40mtpa or c55bcm – broadly 10% of anticipated European gas demand.
Clearly, if this analysis is correct, then all other things being equal price will come under pressure with the European gas price likely to decline towards the marginal cash cost of delivering US gas to European shores ($7-8/mmbtu or c43p/therm) as it seeks to displace alternative sources of supply. Of course multiple variables can get in the way not least inter fuel substitution for power. Price direction looks, however, to be one way.
No panacea for Russian gas but a decided step in the right direction For Norway in part, but the Russians in particular, this must be of significant concern. For to the extent that Russia today accounts for c30% of European supply it is the flex from this territory that has the greatest role to play in ensuring gas market balance and price support. And whilst much of Russia’s gas may be supplied under LT-contracts with minimum off-take levels, the prospect of $7-8/mmbtu landed cost of US LNG against Russia’s c$9-10/mmbtu (10-11%) oil-linked price argues significant Russian volume will need backing out if spot prices are to hold near contract levels. Either this or Russia is again likely to find itself in conflict with its buyers and at the negotiating table on price. All told US LNG may, therefore, not be the panacea to Europe’s Russian dependence. It is, however, certainly a step in the right direction.
Figure 18: Asian robustness suggests Europe will continue to lend LNG
through 2017. Thereinafter, however, significant LNG will need placing
-20.0
0.0
20.0
40.0
60.0
80.0
100.0
120.0
140.0
2009 2010 2011 2012 2013 2014 2015 2016 2017 2018 2019 2020 2021 2022
MTPA Surplus/Deficit Available to AB Call from AB
Limited new supply capacity near term means Asia continues to pull supply from the Atlantickeeping markets tight to 2017/18. From 2018/9 AB markets look likely to go long - and potentially materially by 2020
Source: Deutsche Bank; WM data
Figure 17: Euro gas supply 2013: As Asia’s pull on LNG saw its share cut
to 9% from 18% in 2011, so Russian share built. US LNG will reverse this
Russia34%
Norway22%
Indigenous27%
LNG9%
North Africa/other8%
Source: Deutsche Bank; * Floating LNG concept
Glo
bal LN
G
Exp
loratio
n &
Pro
du
ction
1 D
ecemb
er 20
14
Deu
tsche B
ank A
G/Lo
nd
on
P
age 1
1
US LNG: For the corporate, portfolio LNG is key
Ultimately, in a market where pricing is under pressure and projects are subject to deferral it is hard not to conclude that all suppliers will suffer. The different approaches of the various majors involved in LNG suggests, however, that the relative impact of a more turgid period for growth capture and pricing need not be the same for all. Some will prove better positioned to gain despite the emerging negative trends than others.
Key to this ability to differentiate will in our opinion be access to portfolio LNG (in short, LNG bought into group and which is not committed to an end market customer under long term contract) ideally from several supply sources in both the Atlantic and Pacific Basins. From our perspective this should allow those with a robust portfolio to gain from:
Demand Aggregation. In effect, portfolio players should be able to bundle multiple small lots of demand by committing to supply initially from portfolio. Bundle sufficient lots and these can be used to support own project build. Such an approach should also facilitate the more rapid growth of the LNG market overall by helping to seed new geographic end markets.
Mix and match. At a time when LNG buyers are less certain about future off-take the ability to tailor packages to customer needs should also help support contract wins. Those with portfolio supply can guarantee delivery – they are not project execution dependent. Similarly, the buyer’s commitment can have a break clause; it need not be for 20-years. All told, the added flexibility that can be offered via a portfolio sale should help command premium prices as well as capture share.
Optimize shipping. In a world where the margin on trading is set to fall the value of saving cost on shipping increases materially. Supply end market demand for a cargo more locally and divert another and, as BG has demonstrated in the past, the shipping savings can be material.
Slice and dice. If contracts do increasingly hybridize one way of minimizing any negative price impact is to source the hub element from the US whilst capturing oil-linked from own plant. Given end market knowledge, access points and customer bases the portfolio players should be far better positioned to take on the extra market risk associated with seeking to place larger volumes than peer.
Disaggregation of supply. Holding a portfolio of supply inputs and end-market contracts whereby the supply source to end customer is not defined offers considerable scope to disaggregate and in doing so increase margin
opportunity and profit maximisation. This should prove all the more so at times when the market is long supply.
Portfolio rejuvenation: A single source does not create a supply portfolio. But, as previously mentioned, US supply does at least offer the portfolio names the opportunity to rejuvenate a large part of their supply in a capital light manner.
BG, Total and Shell – The key portfolio names With these observations in mind our strong impression is that while market conditions will make for a sterner trading and growth environment, portfolio length and depth at BG Group, Total and Shell will stand these three companies in far better stead to benefit from the emerging trends than their peers, with a more fluid market likely to throw up a greater number of profitable trading opportunities than has been the case in the tight supply markets of recent years. This contrasts with say, Chevron and Exxon whose bias remains towards the traditional point-to-point model and who, as such, are very much price takers. In saying this it would, however, be misleading not to emphasize that because the portfolio names already benefit materially from ‘super-normal’ trading profits in what for now remains a very tight market they have a much greater profit stream at risk. Chevron and Exxon should at least avoid this hit.
BP’s lack of exposure and long US/short Europe gas position a positive Indeed, with this in mind it could be argued that the major LNG participant that looks best exposed to gain from the current trends is BP, which to a good degree appears to have acted as happy ‘disrupter’ since the US LNG opportunity emerged. For with a lower dependence upon Asian, oil-linked LNG contracts than any of its super-major peers, BP has shown itself far more willing to use the emergence of the US to commit to supply and, in relatively sharp order, place the off-take with new customers under Hub/Hybrid contracts. In doing so it could be argued that it has helped undermine the price/contract position of its significantly more Asian exposed peers whilst at the same time creating a material and low risk, long run profit stream with significant optionality for itself.
To the extent that, with the exception of Exxon, BP remains the IOC with the greatest exposure to North American gas (c13% group production) but the lowest exposure to European gas markets, it is also BP that, in our view, stands to benefit the most from the positive impact that LNG driven demand for US gas could have upon the US Henry Hub gas price but will likely suffer the least from the detrimental impact that excess Atlantic Basin LNG supply may have upon European gas prices.
Glo
bal LN
G
Exp
loratio
n &
Pro
du
ction
1 D
ecemb
er 20
14
Pag
e 12
D
eutsch
e Ban
k AG
/Lon
do
n
US LNG: What are the broader industry implications?
Of course the implications of the swell US LNG supply run deeper than just those pertaining to the major oils. To the extent that the export of US natural gas helps support US gas demand growth and with it pricing so too would we expect relative benefit in time for the lower cost, gas focused US E&P names. Equally as the build out of LNG shifts to the Americas so should a shift in the balance of engineering & construction (E&C) contract awards between the European and US E&C companies work in favour of the US names. And what of Europe and Asia’s utilities? If the export of US gas does lead to an excess of supply, medium term at least, what might the implications for utility buyers across the affected regions? Summarized below our thoughts on these sub-industries are discussed further as an appendix to this report.
North American E&P: Look to the Appalachians Despite 4+ years of disinvestment that has seen capital rationed to the natural gas upstream in North America, the public E&Ps still derive 50-60% of their volumes from natural gas. Growth has been driven almost solely from the Northeast where Marcellus producers have benefitted from resource expansion and improved well performance. Further, the Utica play along the Ohio river valley has only just moved to full development in 2014 and promises to accelerate into 2015/16 as infrastructure (gas pipelines) and processing (rich gas) capacity comes online. Growing US natural gas exports provide a significant opportunity for the entire US upstream. In the near term, we view the low cost leaders in the Marcellus/Utica as the clear winners. The challenge is infrastructure and how this impacts development plans. EQT (Marcellus) and GPOR (Utica) are our preferred plays on the basin.
Mixed potential for global E&C contractors The degree of visibility over the long-term growth drivers of demand for LNG as a commodity through the next decade highlights that even amid current oil price uncertainty opportunities continue to exist for E&C contractors with the right technology, experience and geographic portfolio mix. However the shift in the bias of build from international to US is of importance. For Europe’s E&C companies we view the evolving mix of future supply away from traditional construction and often deepwater intensive markets such as Australia, the Med, the Middle East and emerging Africa as a net negative for a peer group that has long thrived on such high-cost and complex projects. Indeed aggregating historic contract awards we estimate that the build out of today’s 240mmtpa of global LNG
capacity has accounted for 10%+ of order intake for the largest diversified European E&C’s since 2004/5. Consequently heightened uncertainty over the timing of new schemes looks set to detract further from the visibility of order intake for the Europeans at a time when they need it least. Companies that have benefitted most from the past up-cycle in international LNG projects yet have limited US exposure include Saipem (Sell €12.5) and Subsea7 (Sell NOK73) with greatest potential seen in the membrane licensor GTT (Hold €51) from extended shipping requirements. By way of contrast, if the US price advantaged scenario plays out, we believe it may extend the US LNG EPC award cycle beyond our estimate of 2016; with a mix shift towards US LNG projects potentially a positive for margins given barriers to entry for international firms entering the US are higher vs. RoW. This would advantage the more US centric names not least Chicago Bridge & Iron (Buy $80 TP) and Fluor (Buy $83 TP). Within Asia the increasing bias of Japanese EPC contractors towards US LNG also offers relative support not least for Chiyoda (Buy ¥1,656) and JGC (Buy, ¥4,117) both of which have increasing exposure to US LNG.
Utilities: Margin squeeze in Europe, LatAm upside Korean joy At a long term price of $9/MMBtu, the arrival of US LNG in Europe looks consistent with current European utility equity valuations, and the security of the US volumes could be welcome. However, if as suggested the LNG balance moves to excess supply for an extended period and gas prices drop, this could present downside risks to European utilities towards end decade. Excess American gas could effectively put an end to 130 years of UK coal generation, transform the UK energy price outlook and offer Germany a way to hit its carbon targets while phasing out nuclear power. Politicians and customers should welcome the security and affordability, but European utilities would face a margin squeeze in this downside case. The saving grace is LatAm, where European utilities are ideally placed to benefit from transformative investments in gas infrastructure.
Korean utilities Clearly, after the pain of recent years a marked fall in contracted LNG prices would provide material relief on input costs for many Asian utilities, not least the Korean majors. Kepco (Buy Wk60.8) and Kogas (Buy Wk73.6) should be positively impacted by the fall in LNG prices and supports our investment thesis on both stocks on based on ROE expansion story without any kind of tariff hike in 2014-15. Company specific reasons are 1) Kepco: improving generation mix with increasing base fuel portion (nuclear and coal); and 2) Kogas: core LNG earnings rise from bigger rate base and falling accrued receivables lead to decreased interest expense.
Glo
bal LN
G
Exp
loratio
n &
Pro
du
ction
1 D
ecemb
er 20
14
Deu
tsche B
ank A
G/Lo
nd
on
P
age 1
3
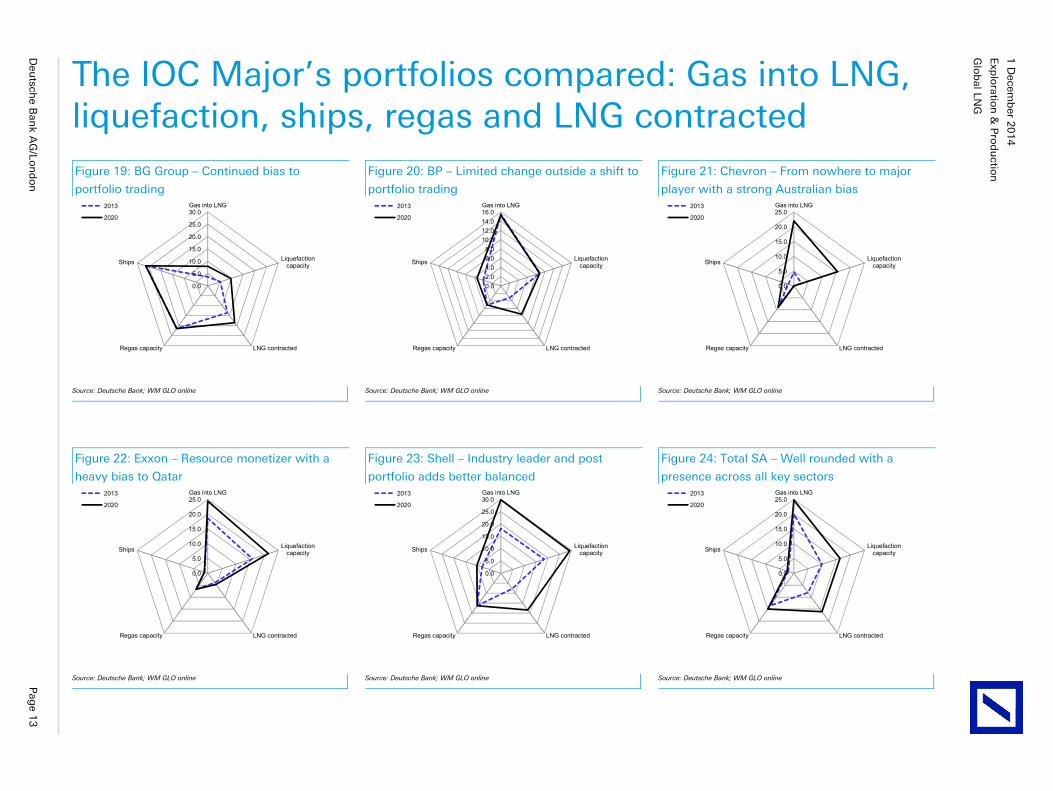
The IOC Major’s portfolios compared: Gas into LNG, liquefaction, ships, regas and LNG contracted Figure 19: BG Group – Continued bias to
portfolio trading
Figure 20: BP – Limited change outside a shift to
portfolio trading
Figure 21: Chevron – From nowhere to major
player with a strong Australian bias
0.0
5.0
10.0
15.0
20.0
25.0
30.0Gas into LNG
Liquefaction capacity
LNG contractedRegas capacity
Ships
2013
2020
0.02.04.06.08.0
10.012.014.016.0Gas into LNG
Liquefaction capacity
LNG contractedRegas capacity
Ships
2013
2020
0.0
5.0
10.0
15.0
20.0
25.0Gas into LNG
Liquefaction capacity
LNG contractedRegas capacity
Ships
2013
2020
Source: Deutsche Bank; WM GLO online Source: Deutsche Bank; WM GLO online Source: Deutsche Bank; WM GLO online
Figure 22: Exxon – Resource monetizer with a
heavy bias to Qatar
Figure 23: Shell – Industry leader and post
portfolio adds better balanced
Figure 24: Total SA – Well rounded with a
presence across all key sectors
0.0
5.0
10.0
15.0
20.0
25.0Gas into LNG
Liquefaction capacity
LNG contractedRegas capacity
Ships
2013
2020
0.0
5.0
10.0
15.0
20.0
25.0
30.0Gas into LNG
Liquefaction capacity
LNG contractedRegas capacity
Ships
2013
2020
0.0
5.0
10.0
15.0
20.0
25.0Gas into LNG
Liquefaction capacity
LNG contractedRegas capacity
Ships
2013
2020
Source: Deutsche Bank; WM GLO online Source: Deutsche Bank; WM GLO online Source: Deutsche Bank; WM GLO online
Glo
bal LN
G
Exp
loratio
n &
Pro
du
ction
1 D
ecemb
er 20
14
Pag
e 14
D
eutsch
e Ban
k AG
/Lon
do
n
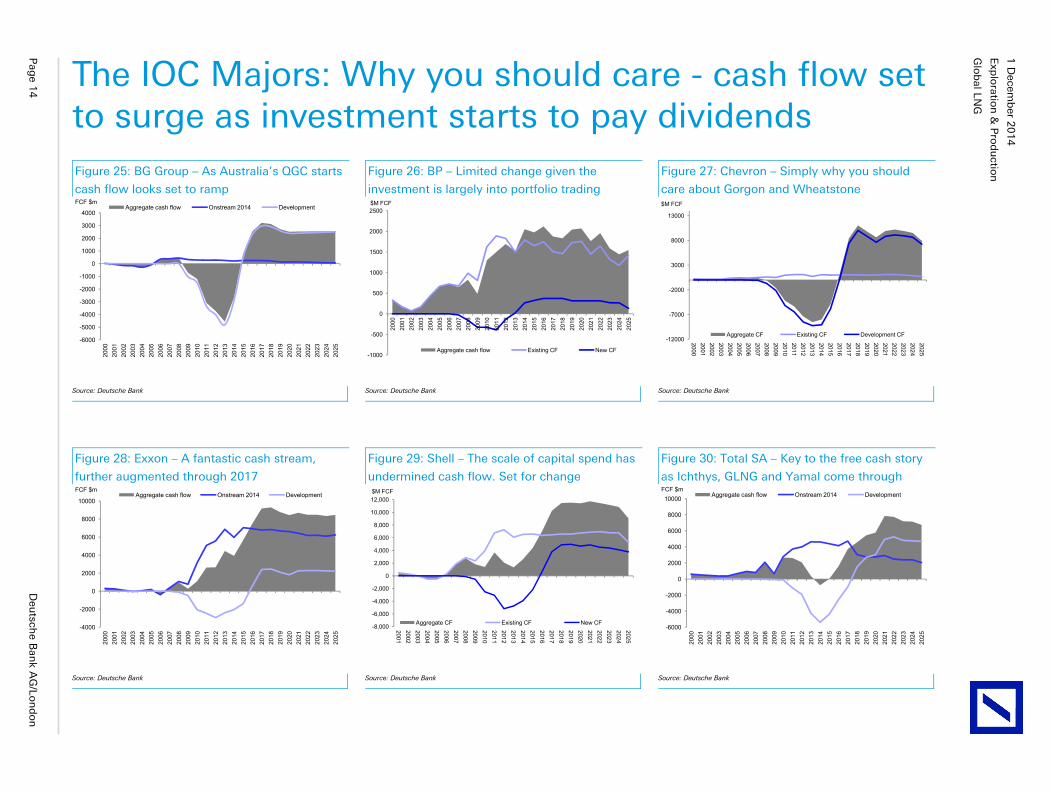
The IOC Majors: Why you should care - cash flow set to surge as investment starts to pay dividends Figure 25: BG Group – As Australia’s QGC starts
cash flow looks set to ramp
Figure 26: BP – Limited change given the
investment is largely into portfolio trading
Figure 27: Chevron – Simply why you should
care about Gorgon and Wheatstone
-6000
-5000
-4000
-3000
-2000
-1000
0
1000
2000
3000
4000
2000
2001
2002
2003
2004
2005
2006
2007
2008
2009
2010
2011
2012
2013
2014
2015
2016
2017
2018
2019
2020
2021
2022
2023
2024
2025
FCF $mAggregate cash flow Onstream 2014 Development
-1000
-500
0
500
1000
1500
2000
2500
2000
2001
2002
2003
2004
2005
2006
2007
2008
2009
2010
2011
2012
2013
2014
2015
2016
2017
2018
2019
2020
2021
2022
2023
2024
2025
$M FCF
Aggregate cash flow Existing CF New CF
-12000
-7000
-2000
3000
8000
13000
20002001200220032004200520062007200820092010201120122013201420152016201720182019202020212022202320242025
$M FCF
Aggregate CF Existing CF Development CF
Source: Deutsche Bank Source: Deutsche Bank Source: Deutsche Bank
Figure 28: Exxon – A fantastic cash stream,
further augmented through 2017
Figure 29: Shell – The scale of capital spend has
undermined cash flow. Set for change
Figure 30: Total SA – Key to the free cash story
as Ichthys, GLNG and Yamal come through
-4000
-2000
0
2000
4000
6000
8000
10000
2000
2001
2002
2003
2004
2005
2006
2007
2008
2009
2010
2011
2012
2013
2014
2015
2016
2017
2018
2019
2020
2021
2022
2023
2024
2025
FCF $mAggregate cash flow Onstream 2014 Development
-8,000
-6,000
-4,000
-2,000
0
2,000
4,000
6,000
8,000
10,000
12,000
2001200220032004200520062007200820092010201120122013201420152016201720182019202020212022202320242025
$M FCF
Aggregate CF Existing CF New CF
-6000
-4000
-2000
0
2000
4000
6000
8000
10000
2000
2001
2002
2003
2004
2005
2006
2007
2008
2009
2010
2011
2012
2013
2014
2015
2016
2017
2018
2019
2020
2021
2022
2023
2024
2025
FCF $mAggregate cash flow Onstream 2014 Development
Source: Deutsche Bank Source: Deutsche Bank Source: Deutsche Bank
Glo
bal LN
G
Exp
loratio
n &
Pro
du
ction
1 D
ecemb
er 20
14
Deu
tsche B
ank A
G/Lo
nd
on
P
age 1
5
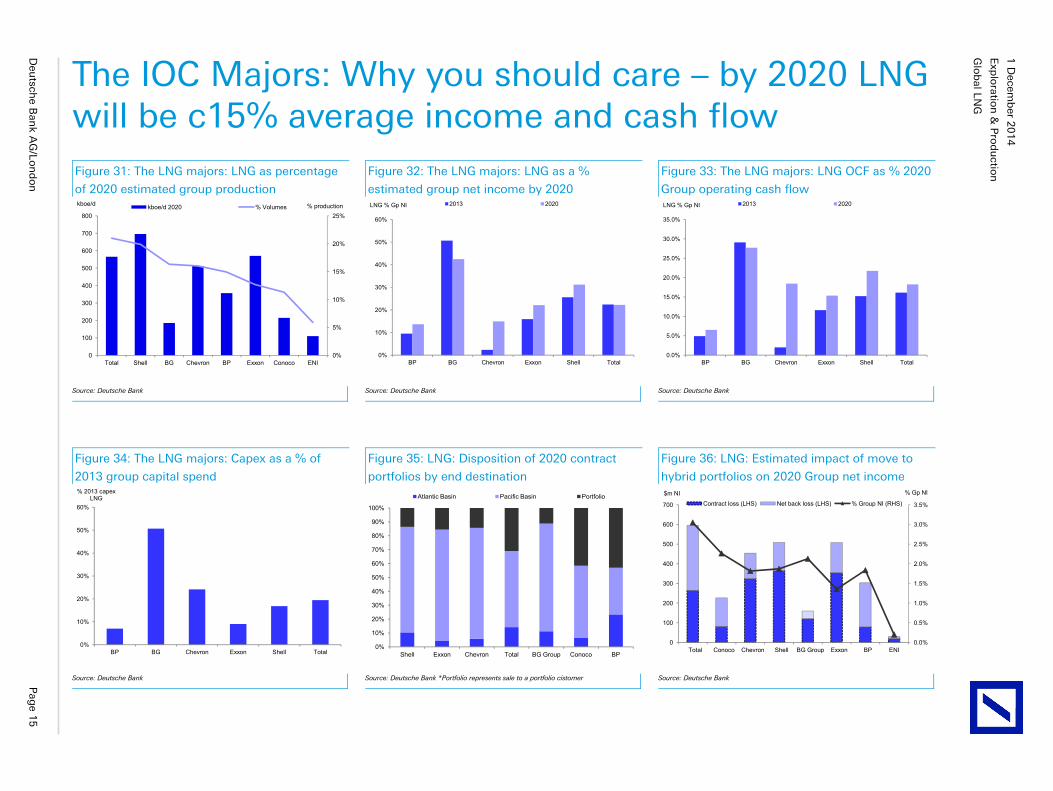
The IOC Majors: Why you should care – by 2020 LNG will be c15% average income and cash flow Figure 31: The LNG majors: LNG as percentage
of 2020 estimated group production
Figure 32: The LNG majors: LNG as a %
estimated group net income by 2020
Figure 33: The LNG majors: LNG OCF as % 2020
Group operating cash flow
0%
5%
10%
15%
20%
25%
0
100
200
300
400
500
600
700
800
Total Shell BG Chevron BP Exxon Conoco ENI
% productionkboe/d kboe/d 2020 % Volumes
0%
10%
20%
30%
40%
50%
60%
BP BG Chevron Exxon Shell Total
LNG % Gp NI 2013 2020
0.0%
5.0%
10.0%
15.0%
20.0%
25.0%
30.0%
35.0%
BP BG Chevron Exxon Shell Total
LNG % Gp NI 2013 2020
Source: Deutsche Bank Source: Deutsche Bank Source: Deutsche Bank
Figure 34: The LNG majors: Capex as a % of
2013 group capital spend
Figure 35: LNG: Disposition of 2020 contract
portfolios by end destination
Figure 36: LNG: Estimated impact of move to
hybrid portfolios on 2020 Group net income
0%
10%
20%
30%
40%
50%
60%
BP BG Chevron Exxon Shell Total
% 2013 capex LNG
0%
10%
20%
30%
40%
50%
60%
70%
80%
90%
100%
Shell Exxon Chevron Total BG Group Conoco BP
Atlantic Basin Pacific Basin Portfolio
0.0%
0.5%
1.0%
1.5%
2.0%
2.5%
3.0%
3.5%
0
100
200
300
400
500
600
700
Total Conoco Chevron Shell BG Group Exxon BP ENI
% Gp NI$m NIContract loss (LHS) Net back loss (LHS) % Group NI (RHS)
Source: Deutsche Bank Source: Deutsche Bank *Portfolio represents sale to a portfolio cistomer Source: Deutsche Bank
Glo
bal LN
G
Exp
loratio
n &
Pro
du
ction
1 D
ecemb
er 20
14
Pag
e 16
D
eutsch
e Ban
k AG
/Lon
do
n
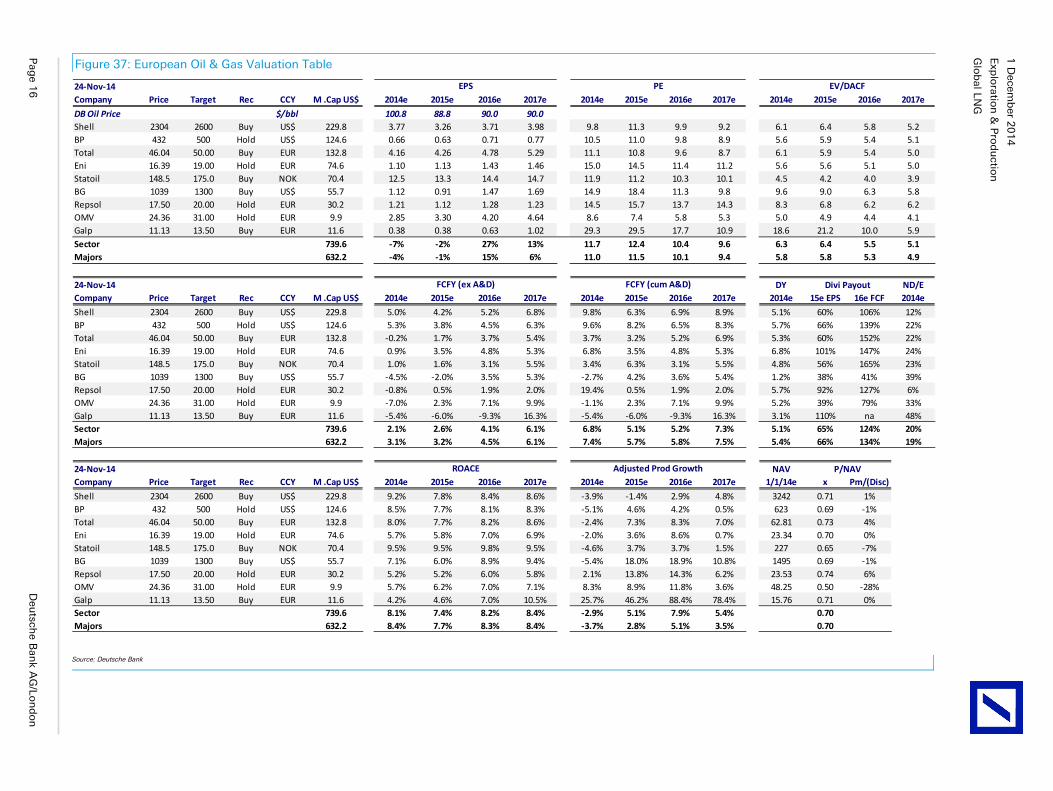
Figure 37: European Oil & Gas Valuation Table
24-Nov-14Company Price Target Rec CCY M .Cap US$ 2014e 2015e 2016e 2017e 2014e 2015e 2016e 2017e 2014e 2015e 2016e 2017e
DB Oil Price $/bbl 100.8 88.8 90.0 90.0Shell 2304 2600 Buy US$ 229.8 3.77 3.26 3.71 3.98 9.8 11.3 9.9 9.2 6.1 6.4 5.8 5.2BP 432 500 Hold US$ 124.6 0.66 0.63 0.71 0.77 10.5 11.0 9.8 8.9 5.6 5.9 5.4 5.1Total 46.04 50.00 Buy EUR 132.8 4.16 4.26 4.78 5.29 11.1 10.8 9.6 8.7 6.1 5.9 5.4 5.0Eni 16.39 19.00 Hold EUR 74.6 1.10 1.13 1.43 1.46 15.0 14.5 11.4 11.2 5.6 5.6 5.1 5.0Statoil 148.5 175.0 Buy NOK 70.4 12.5 13.3 14.4 14.7 11.9 11.2 10.3 10.1 4.5 4.2 4.0 3.9BG 1039 1300 Buy US$ 55.7 1.12 0.91 1.47 1.69 14.9 18.4 11.3 9.8 9.6 9.0 6.3 5.8Repsol 17.50 20.00 Hold EUR 30.2 1.21 1.12 1.28 1.23 14.5 15.7 13.7 14.3 8.3 6.8 6.2 6.2OMV 24.36 31.00 Hold EUR 9.9 2.85 3.30 4.20 4.64 8.6 7.4 5.8 5.3 5.0 4.9 4.4 4.1Galp 11.13 13.50 Buy EUR 11.6 0.38 0.38 0.63 1.02 29.3 29.5 17.7 10.9 18.6 21.2 10.0 5.9Sector 739.6 -7% -2% 27% 13% 11.7 12.4 10.4 9.6 6.3 6.4 5.5 5.1Majors 632.2 -4% -1% 15% 6% 11.0 11.5 10.1 9.4 5.8 5.8 5.3 4.9
24-Nov-14 DY ND/ECompany Price Target Rec CCY M .Cap US$ 2014e 2015e 2016e 2017e 2014e 2015e 2016e 2017e 2014e 15e EPS 16e FCF 2014e
Shell 2304 2600 Buy US$ 229.8 5.0% 4.2% 5.2% 6.8% 9.8% 6.3% 6.9% 8.9% 5.1% 60% 106% 12%BP 432 500 Hold US$ 124.6 5.3% 3.8% 4.5% 6.3% 9.6% 8.2% 6.5% 8.3% 5.7% 66% 139% 22%Total 46.04 50.00 Buy EUR 132.8 -0.2% 1.7% 3.7% 5.4% 3.7% 3.2% 5.2% 6.9% 5.3% 60% 152% 22%Eni 16.39 19.00 Hold EUR 74.6 0.9% 3.5% 4.8% 5.3% 6.8% 3.5% 4.8% 5.3% 6.8% 101% 147% 24%Statoil 148.5 175.0 Buy NOK 70.4 1.0% 1.6% 3.1% 5.5% 3.4% 6.3% 3.1% 5.5% 4.8% 56% 165% 23%BG 1039 1300 Buy US$ 55.7 -4.5% -2.0% 3.5% 5.3% -2.7% 4.2% 3.6% 5.4% 1.2% 38% 41% 39%Repsol 17.50 20.00 Hold EUR 30.2 -0.8% 0.5% 1.9% 2.0% 19.4% 0.5% 1.9% 2.0% 5.7% 92% 127% 6%OMV 24.36 31.00 Hold EUR 9.9 -7.0% 2.3% 7.1% 9.9% -1.1% 2.3% 7.1% 9.9% 5.2% 39% 79% 33%Galp 11.13 13.50 Buy EUR 11.6 -5.4% -6.0% -9.3% 16.3% -5.4% -6.0% -9.3% 16.3% 3.1% 110% na 48%Sector 739.6 2.1% 2.6% 4.1% 6.1% 6.8% 5.1% 5.2% 7.3% 5.1% 65% 124% 20%Majors 632.2 3.1% 3.2% 4.5% 6.1% 7.4% 5.7% 5.8% 7.5% 5.4% 66% 134% 19%
24-Nov-14 NAVCompany Price Target Rec CCY M .Cap US$ 2014e 2015e 2016e 2017e 2014e 2015e 2016e 2017e 1/1/14e x Pm/(Disc)
Shell 2304 2600 Buy US$ 229.8 9.2% 7.8% 8.4% 8.6% -3.9% -1.4% 2.9% 4.8% 3242 0.71 1%BP 432 500 Hold US$ 124.6 8.5% 7.7% 8.1% 8.3% -5.1% 4.6% 4.2% 0.5% 623 0.69 -1%Total 46.04 50.00 Buy EUR 132.8 8.0% 7.7% 8.2% 8.6% -2.4% 7.3% 8.3% 7.0% 62.81 0.73 4%Eni 16.39 19.00 Hold EUR 74.6 5.7% 5.8% 7.0% 6.9% -2.0% 3.6% 8.6% 0.7% 23.34 0.70 0%Statoil 148.5 175.0 Buy NOK 70.4 9.5% 9.5% 9.8% 9.5% -4.6% 3.7% 3.7% 1.5% 227 0.65 -7%BG 1039 1300 Buy US$ 55.7 7.1% 6.0% 8.9% 9.4% -5.4% 18.0% 18.9% 10.8% 1495 0.69 -1%Repsol 17.50 20.00 Hold EUR 30.2 5.2% 5.2% 6.0% 5.8% 2.1% 13.8% 14.3% 6.2% 23.53 0.74 6%OMV 24.36 31.00 Hold EUR 9.9 5.7% 6.2% 7.0% 7.1% 8.3% 8.9% 11.8% 3.6% 48.25 0.50 -28%Galp 11.13 13.50 Buy EUR 11.6 4.2% 4.6% 7.0% 10.5% 25.7% 46.2% 88.4% 78.4% 15.76 0.71 0%Sector 739.6 8.1% 7.4% 8.2% 8.4% -2.9% 5.1% 7.9% 5.4% 0.70Majors 632.2 8.4% 7.7% 8.3% 8.4% -3.7% 2.8% 5.1% 3.5% 0.70
EPS
FCFY (ex A&D)
ROACE
PE
FCFY (cum A&D)
Adjusted Prod Growth
EV/DACF
Divi Payout
P/NAV
Source: Deutsche Bank
Glo
bal LN
G
Exp
loratio
n &
Pro
du
ction
1 D
ecemb
er 20
14
Deu
tsche B
ank A
G/Lo
nd
on
P
age 1
7
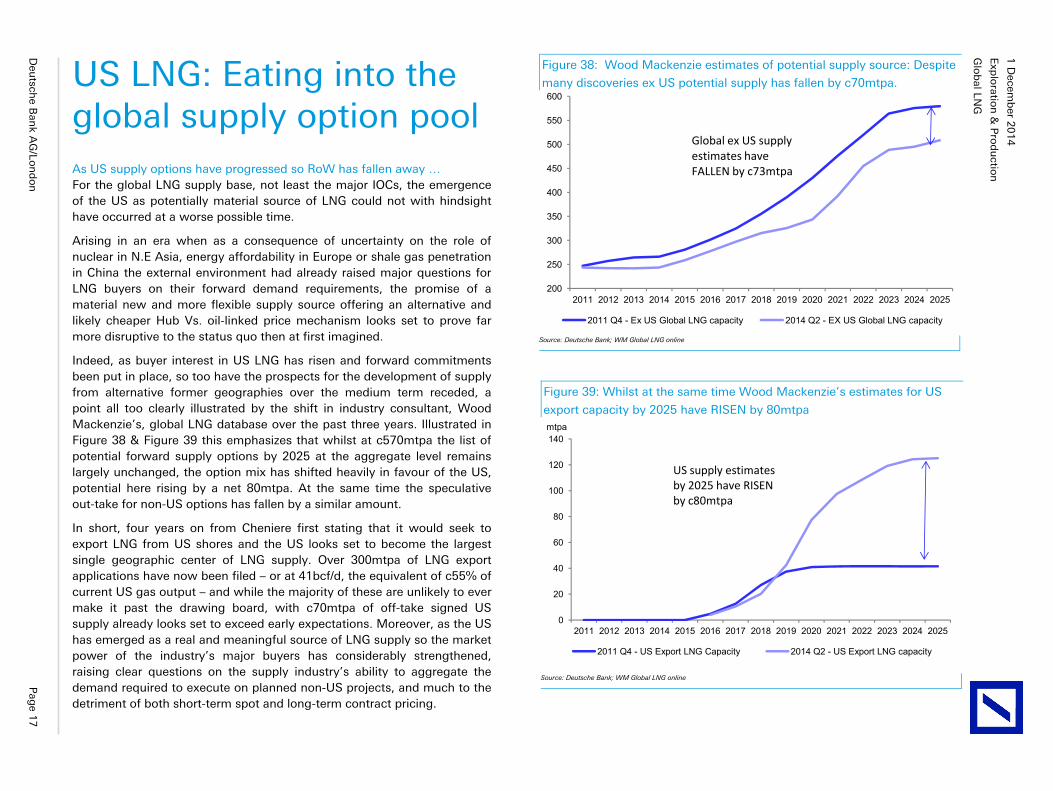
US LNG: Eating into the global supply option pool As US supply options have progressed so RoW has fallen away … For the global LNG supply base, not least the major IOCs, the emergence of the US as potentially material source of LNG could not with hindsight have occurred at a worse possible time.
Arising in an era when as a consequence of uncertainty on the role of nuclear in N.E Asia, energy affordability in Europe or shale gas penetration in China the external environment had already raised major questions for LNG buyers on their forward demand requirements, the promise of a material new and more flexible supply source offering an alternative and likely cheaper Hub Vs. oil-linked price mechanism looks set to prove far more disruptive to the status quo then at first imagined.
Indeed, as buyer interest in US LNG has risen and forward commitments been put in place, so too have the prospects for the development of supply from alternative former geographies over the medium term receded, a point all too clearly illustrated by the shift in industry consultant, Wood Mackenzie’s, global LNG database over the past three years. Illustrated in Figure 38 & Figure 39 this emphasizes that whilst at c570mtpa the list of potential forward supply options by 2025 at the aggregate level remains largely unchanged, the option mix has shifted heavily in favour of the US, potential here rising by a net 80mtpa. At the same time the speculative out-take for non-US options has fallen by a similar amount.
In short, four years on from Cheniere first stating that it would seek to export LNG from US shores and the US looks set to become the largest single geographic center of LNG supply. Over 300mtpa of LNG export applications have now been filed – or at 41bcf/d, the equivalent of c55% of current US gas output – and while the majority of these are unlikely to ever make it past the drawing board, with c70mtpa of off-take signed US supply already looks set to exceed early expectations. Moreover, as the US has emerged as a real and meaningful source of LNG supply so the market power of the industry’s major buyers has considerably strengthened, raising clear questions on the supply industry’s ability to aggregate the demand required to execute on planned non-US projects, and much to the detriment of both short-term spot and long-term contract pricing.
Figure 39: Whilst at the same time Wood Mackenzie’s estimates for US
export capacity by 2025 have RISEN by 80mtpa
0
20
40
60
80
100
120
140
2011 2012 2013 2014 2015 2016 2017 2018 2019 2020 2021 2022 2023 2024 2025
mtpa
2011 Q4 - US Export LNG Capacity 2014 Q2 - US Export LNG capacity
US supply estimates by 2025 have RISEN by c80mtpa
Source: Deutsche Bank; WM Global LNG online
Figure 38: Wood Mackenzie estimates of potential supply source: Despite
many discoveries ex US potential supply has fallen by c70mtpa.
200
250
300
350
400
450
500
550
600
2011 2012 2013 2014 2015 2016 2017 2018 2019 2020 2021 2022 2023 2024 2025
2011 Q4 - Ex US Global LNG capacity 2014 Q2 - EX US Global LNG capacity
Global ex US supply estimates have FALLEN by c73mtpa
Source: Deutsche Bank; WM Global LNG online
Glo
bal LN
G
Exp
loratio
n &
Pro
du
ction
1 D
ecemb
er 20
14
Pag
e 18
D
eutsch
e Ban
k AG
/Lon
do
n
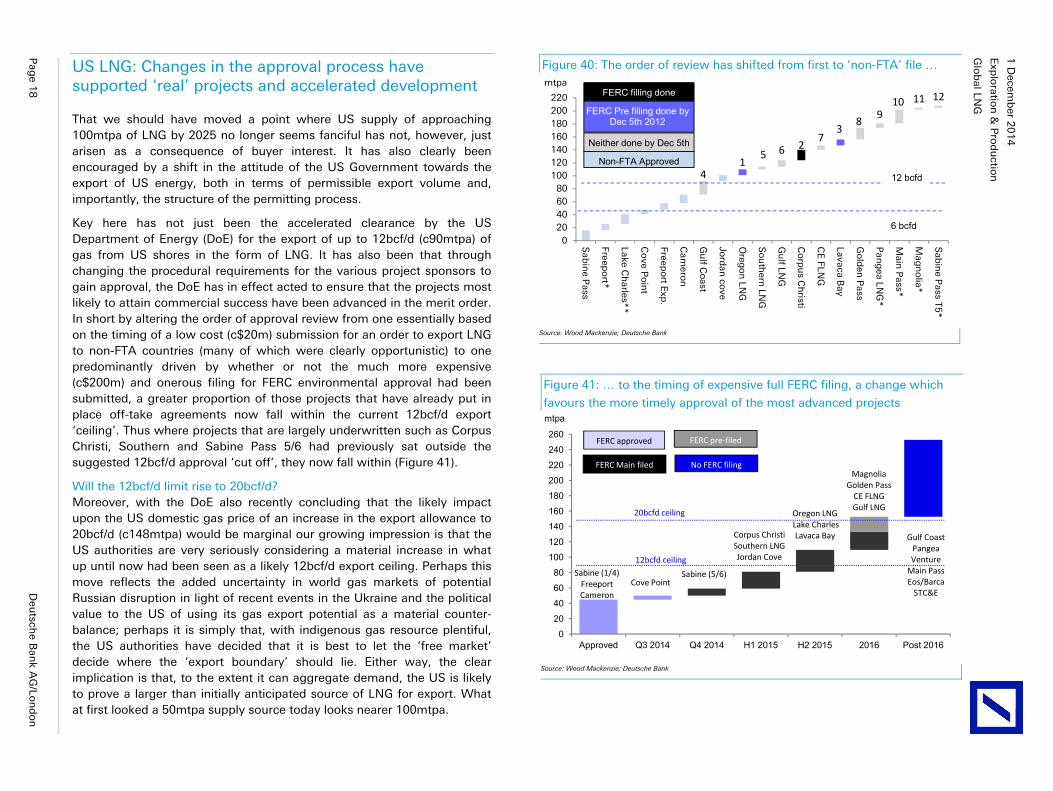
US LNG: Changes in the approval process have supported ‘real’ projects and accelerated development
That we should have moved a point where US supply of approaching 100mtpa of LNG by 2025 no longer seems fanciful has not, however, just arisen as a consequence of buyer interest. It has also clearly been encouraged by a shift in the attitude of the US Government towards the export of US energy, both in terms of permissible export volume and, importantly, the structure of the permitting process.
Key here has not just been the accelerated clearance by the US Department of Energy (DoE) for the export of up to 12bcf/d (c90mtpa) of gas from US shores in the form of LNG. It has also been that through changing the procedural requirements for the various project sponsors to gain approval, the DoE has in effect acted to ensure that the projects most likely to attain commercial success have been advanced in the merit order. In short by altering the order of approval review from one essentially based on the timing of a low cost (c$20m) submission for an order to export LNG to non-FTA countries (many of which were clearly opportunistic) to one predominantly driven by whether or not the much more expensive (c$200m) and onerous filing for FERC environmental approval had been submitted, a greater proportion of those projects that have already put in place off-take agreements now fall within the current 12bcf/d export ‘ceiling’. Thus where projects that are largely underwritten such as Corpus Christi, Southern and Sabine Pass 5/6 had previously sat outside the suggested 12bcf/d approval ‘cut off’, they now fall within (Figure 41).
Will the 12bcf/d limit rise to 20bcf/d? Moreover, with the DoE also recently concluding that the likely impact upon the US domestic gas price of an increase in the export allowance to 20bcf/d (c148mtpa) would be marginal our growing impression is that the US authorities are very seriously considering a material increase in what up until now had been seen as a likely 12bcf/d export ceiling. Perhaps this move reflects the added uncertainty in world gas markets of potential Russian disruption in light of recent events in the Ukraine and the political value to the US of using its gas export potential as a material counter-balance; perhaps it is simply that, with indigenous gas resource plentiful, the US authorities have decided that it is best to let the ‘free market’ decide where the ‘export boundary’ should lie. Either way, the clear implication is that, to the extent it can aggregate demand, the US is likely to prove a larger than initially anticipated source of LNG for export. What at first looked a 50mtpa supply source today looks nearer 100mtpa.
Figure 41: … to the timing of expensive full FERC filing, a change which
favours the more timely approval of the most advanced projects
0
20
40
60
80
100
120
140
160
180
200
220
240
260
Approved Q3 2014 Q4 2014 H1 2015 H2 2015 2016 Post 2016
mtpa
Sabine (1/4) Freeport Cameron
Gulf CoastPangeaVenture
Main PassEos/Barca
STC&E
MagnoliaGolden Pass
CE FLNGGulf LNG
Oregon LNGLake CharlesLavaca BayCorpus Christi
Southern LNGJordan Cove
Sabine (5/6)Cove Point
FERC approved
FERC Main filed
FERC pre-filed
No FERC filing
20bcfd ceiling
12bcfd ceiling
Source: Wood Mackenzie; Deutsche Bank
Figure 40: The order of review has shifted from first to ‘non-FTA’ file …
41
5 6 27
38
910 11 12
020406080
100120140160180200220
Sab
ine P
ass
Freepo
rt*
Lake Ch
arles**
Co
ve Po
int
Freepo
rt Exp
.
Cam
eron
Gu
lf Coast
Jord
an co
ve
Oreg
on
LNG
So
uth
ern LN
G
Gu
lf LNG
Corp
us C
hristi
CE
FLNG
Lavaca Bay
Go
lden
Pass
Pan
gea LN
G*
Main
Pass*
Mag
no
lia*
Sab
ine P
ass T5*
mtpaFERC filling done
FERC Pre filling done by Dec 5th 2012
Neither done by Dec 5th
Non-FTA Approved
12 bcfd
6 bcfd
Source: Wood Mackenzie; Deutsche Bank
Glo
bal LN
G
Exp
loratio
n &
Pro
du
ction
1 D
ecemb
er 20
14
Deu
tsche B
ank A
G/Lo
nd
on
P
age 1
9
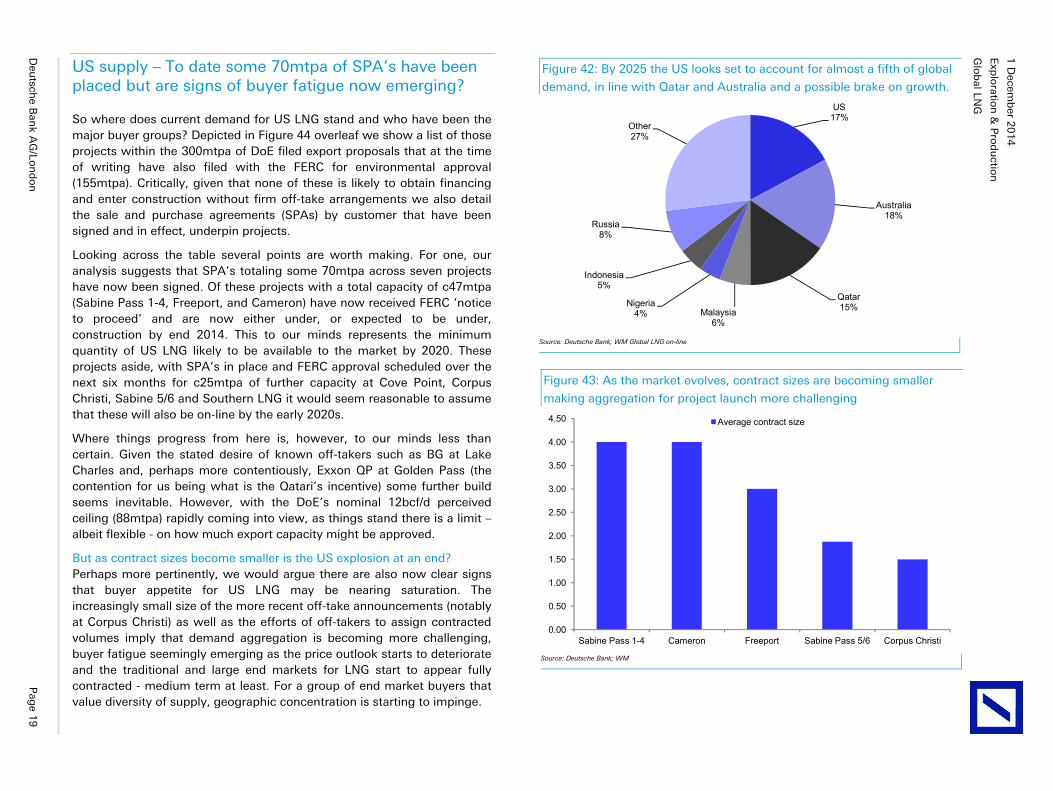
US supply – To date some 70mtpa of SPA’s have been placed but are signs of buyer fatigue now emerging?
So where does current demand for US LNG stand and who have been the major buyer groups? Depicted in Figure 44 overleaf we show a list of those projects within the 300mtpa of DoE filed export proposals that at the time of writing have also filed with the FERC for environmental approval (155mtpa). Critically, given that none of these is likely to obtain financing and enter construction without firm off-take arrangements we also detail the sale and purchase agreements (SPAs) by customer that have been signed and in effect, underpin projects.
Looking across the table several points are worth making. For one, our analysis suggests that SPA’s totaling some 70mtpa across seven projects have now been signed. Of these projects with a total capacity of c47mtpa (Sabine Pass 1-4, Freeport, and Cameron) have now received FERC ‘notice to proceed’ and are now either under, or expected to be under, construction by end 2014. This to our minds represents the minimum quantity of US LNG likely to be available to the market by 2020. These projects aside, with SPA’s in place and FERC approval scheduled over the next six months for c25mtpa of further capacity at Cove Point, Corpus Christi, Sabine 5/6 and Southern LNG it would seem reasonable to assume that these will also be on-line by the early 2020s.
Where things progress from here is, however, to our minds less than certain. Given the stated desire of known off-takers such as BG at Lake Charles and, perhaps more contentiously, Exxon QP at Golden Pass (the contention for us being what is the Qatari’s incentive) some further build seems inevitable. However, with the DoE’s nominal 12bcf/d perceived ceiling (88mtpa) rapidly coming into view, as things stand there is a limit – albeit flexible - on how much export capacity might be approved.
But as contract sizes become smaller is the US explosion at an end? Perhaps more pertinently, we would argue there are also now clear signs that buyer appetite for US LNG may be nearing saturation. The increasingly small size of the more recent off-take announcements (notably at Corpus Christi) as well as the efforts of off-takers to assign contracted volumes imply that demand aggregation is becoming more challenging, buyer fatigue seemingly emerging as the price outlook starts to deteriorate and the traditional and large end markets for LNG start to appear fully contracted - medium term at least. For a group of end market buyers that value diversity of supply, geographic concentration is starting to impinge.
Figure 43: As the market evolves, contract sizes are becoming smaller
making aggregation for project launch more challenging
0.00
0.50
1.00
1.50
2.00
2.50
3.00
3.50
4.00
4.50
Sabine Pass 1-4 Cameron Freeport Sabine Pass 5/6 Corpus Christi
Average contract size
Source: Deutsche Bank; WM
Figure 42: By 2025 the US looks set to account for almost a fifth of global
demand, in line with Qatar and Australia and a possible brake on growth.
US17%
Australia18%
Qatar15%Malaysia
6%
Nigeria4%
Indonesia5%
Russia8%
Other27%
Source: Deutsche Bank; WM Global LNG on-line
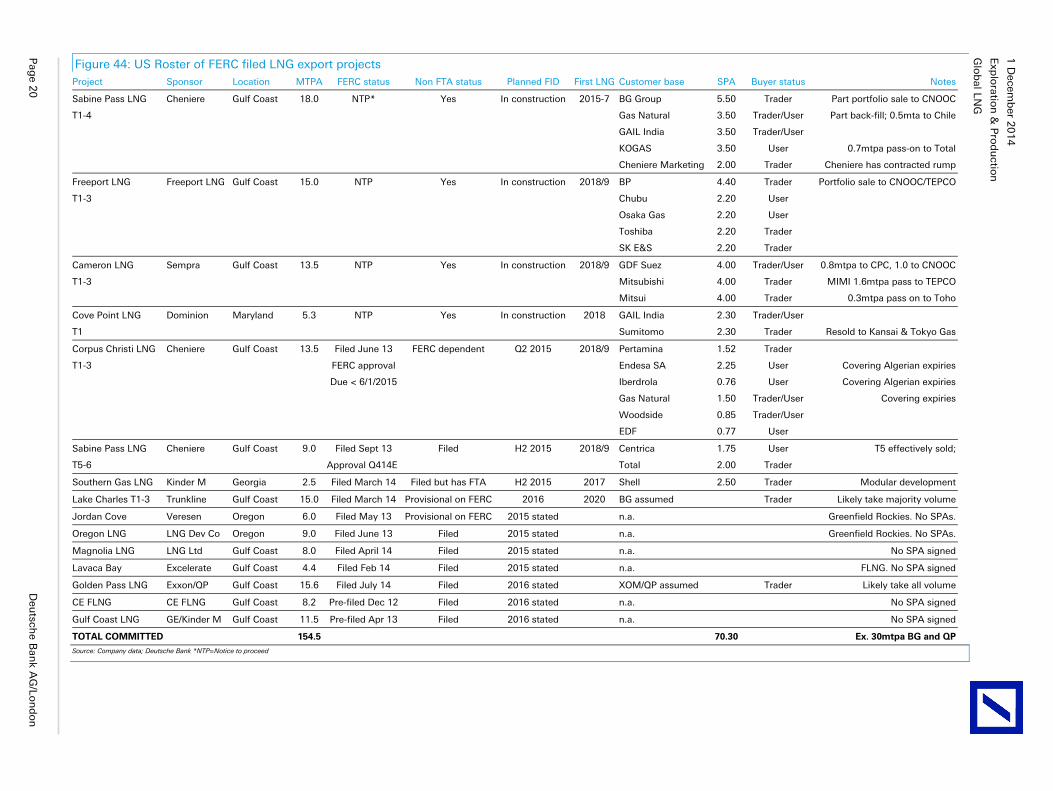
Glo
bal LN
G
Exp
loratio
n &
Pro
du
ction
1 D
ecemb
er 20
14
Pag
e 20
D
eutsch
e Ban
k AG
/Lon
do
n
Figure 44: US Roster of FERC filed LNG export projects Project Sponsor Location MTPA FERC status Non FTA status Planned FID First LNG Customer base SPA Buyer status Notes
Sabine Pass LNG Cheniere Gulf Coast 18.0 NTP* Yes In construction 2015-7 BG Group 5.50 Trader Part portfolio sale to CNOOC
T1-4 Gas Natural 3.50 Trader/User Part back-fill; 0.5mta to Chile
GAIL India 3.50 Trader/User
KOGAS 3.50 User 0.7mtpa pass-on to Total
Cheniere Marketing 2.00 Trader Cheniere has contracted rump
Freeport LNG Freeport LNG Gulf Coast 15.0 NTP Yes In construction 2018/9 BP 4.40 Trader Portfolio sale to CNOOC/TEPCO
T1-3 Chubu 2.20 User
Osaka Gas 2.20 User
Toshiba 2.20 Trader
SK E&S 2.20 Trader
Cameron LNG Sempra Gulf Coast 13.5 NTP Yes In construction 2018/9 GDF Suez 4.00 Trader/User 0.8mtpa to CPC, 1.0 to CNOOC
T1-3 Mitsubishi 4.00 Trader MIMI 1.6mtpa pass to TEPCO
Mitsui 4.00 Trader 0.3mtpa pass on to Toho
Cove Point LNG Dominion Maryland 5.3 NTP Yes In construction 2018 GAIL India 2.30 Trader/User
T1 Sumitomo 2.30 Trader Resold to Kansai & Tokyo Gas
Corpus Christi LNG Cheniere Gulf Coast 13.5 Filed June 13 FERC dependent Q2 2015 2018/9 Pertamina 1.52 Trader
T1-3 FERC approval Endesa SA 2.25 User Covering Algerian expiries
Due < 6/1/2015 Iberdrola 0.76 User Covering Algerian expiries
Gas Natural 1.50 Trader/User Covering expiries
Woodside 0.85 Trader/User
EDF 0.77 User
Sabine Pass LNG Cheniere Gulf Coast 9.0 Filed Sept 13 Filed H2 2015 2018/9 Centrica 1.75 User T5 effectively sold;
T5-6 Approval Q414E Total 2.00 Trader
Southern Gas LNG Kinder M Georgia 2.5 Filed March 14 Filed but has FTA H2 2015 2017 Shell 2.50 Trader Modular development
Lake Charles T1-3 Trunkline Gulf Coast 15.0 Filed March 14 Provisional on FERC 2016 2020 BG assumed Trader Likely take majority volume
Jordan Cove Veresen Oregon 6.0 Filed May 13 Provisional on FERC 2015 stated n.a. Greenfield Rockies. No SPAs.
Oregon LNG LNG Dev Co Oregon 9.0 Filed June 13 Filed 2015 stated n.a. Greenfield Rockies. No SPAs.
Magnolia LNG LNG Ltd Gulf Coast 8.0 Filed April 14 Filed 2015 stated n.a. No SPA signed
Lavaca Bay Excelerate Gulf Coast 4.4 Filed Feb 14 Filed 2015 stated n.a. FLNG. No SPA signed
Golden Pass LNG Exxon/QP Gulf Coast 15.6 Filed July 14 Filed 2016 stated XOM/QP assumed Trader Likely take all volume
CE FLNG CE FLNG Gulf Coast 8.2 Pre-filed Dec 12 Filed 2016 stated n.a. No SPA signed
Gulf Coast LNG GE/Kinder M Gulf Coast 11.5 Pre-filed Apr 13 Filed 2016 stated n.a. No SPA signed
TOTAL COMMITTED 154.5 70.30 Ex. 30mtpa BG and QP Source: Company data; Deutsche Bank *NTP=Notice to proceed
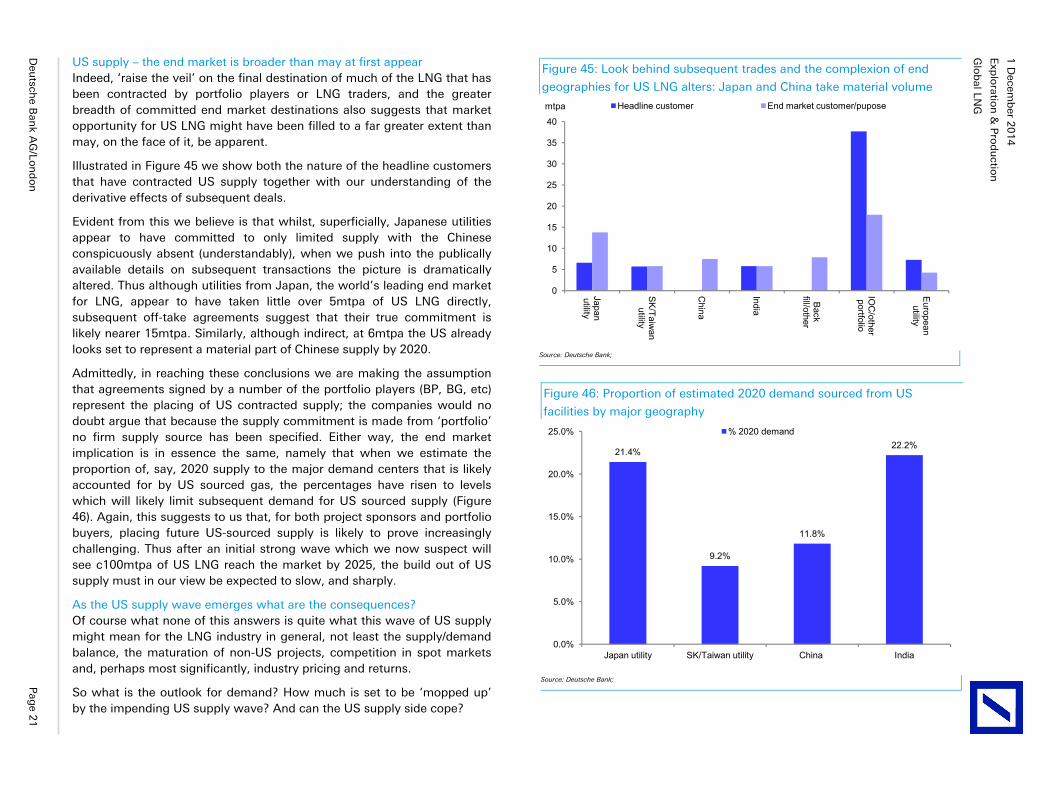
Glo
bal LN
G
Exp
loratio
n &
Pro
du
ction
1 D
ecemb
er 20
14
Deu
tsche B
ank A
G/Lo
nd
on
P
age 2
1
US supply – the end market is broader than may at first appear Indeed, ‘raise the veil’ on the final destination of much of the LNG that has been contracted by portfolio players or LNG traders, and the greater breadth of committed end market destinations also suggests that market opportunity for US LNG might have been filled to a far greater extent than may, on the face of it, be apparent.
Illustrated in Figure 45 we show both the nature of the headline customers that have contracted US supply together with our understanding of the derivative effects of subsequent deals.
Evident from this we believe is that whilst, superficially, Japanese utilities appear to have committed to only limited supply with the Chinese conspicuously absent (understandably), when we push into the publically available details on subsequent transactions the picture is dramatically altered. Thus although utilities from Japan, the world’s leading end market for LNG, appear to have taken little over 5mtpa of US LNG directly, subsequent off-take agreements suggest that their true commitment is likely nearer 15mtpa. Similarly, although indirect, at 6mtpa the US already looks set to represent a material part of Chinese supply by 2020.
Admittedly, in reaching these conclusions we are making the assumption that agreements signed by a number of the portfolio players (BP, BG, etc) represent the placing of US contracted supply; the companies would no doubt argue that because the supply commitment is made from ‘portfolio’ no firm supply source has been specified. Either way, the end market implication is in essence the same, namely that when we estimate the proportion of, say, 2020 supply to the major demand centers that is likely accounted for by US sourced gas, the percentages have risen to levels which will likely limit subsequent demand for US sourced supply (Figure 46). Again, this suggests to us that, for both project sponsors and portfolio buyers, placing future US-sourced supply is likely to prove increasingly challenging. Thus after an initial strong wave which we now suspect will see c100mtpa of US LNG reach the market by 2025, the build out of US supply must in our view be expected to slow, and sharply.
As the US supply wave emerges what are the consequences? Of course what none of this answers is quite what this wave of US supply might mean for the LNG industry in general, not least the supply/demand balance, the maturation of non-US projects, competition in spot markets and, perhaps most significantly, industry pricing and returns.
So what is the outlook for demand? How much is set to be ‘mopped up’ by the impending US supply wave? And can the US supply side cope?
Figure 46: Proportion of estimated 2020 demand sourced from US
facilities by major geography
21.4%
9.2%
11.8%
22.2%
0.0%
5.0%
10.0%
15.0%
20.0%
25.0%
Japan utility SK/Taiwan utility China India
% 2020 demand
Source: Deutsche Bank;
Figure 45: Look behind subsequent trades and the complexion of end
geographies for US LNG alters: Japan and China take material volume
0
5
10
15
20
25
30
35
40
Japan utility
SK/Taiw
an utility
China
India
Back
fill/other
IOC
/other portfolio
European utility
mtpa Headline customer End market customer/pupose
Source: Deutsche Bank;
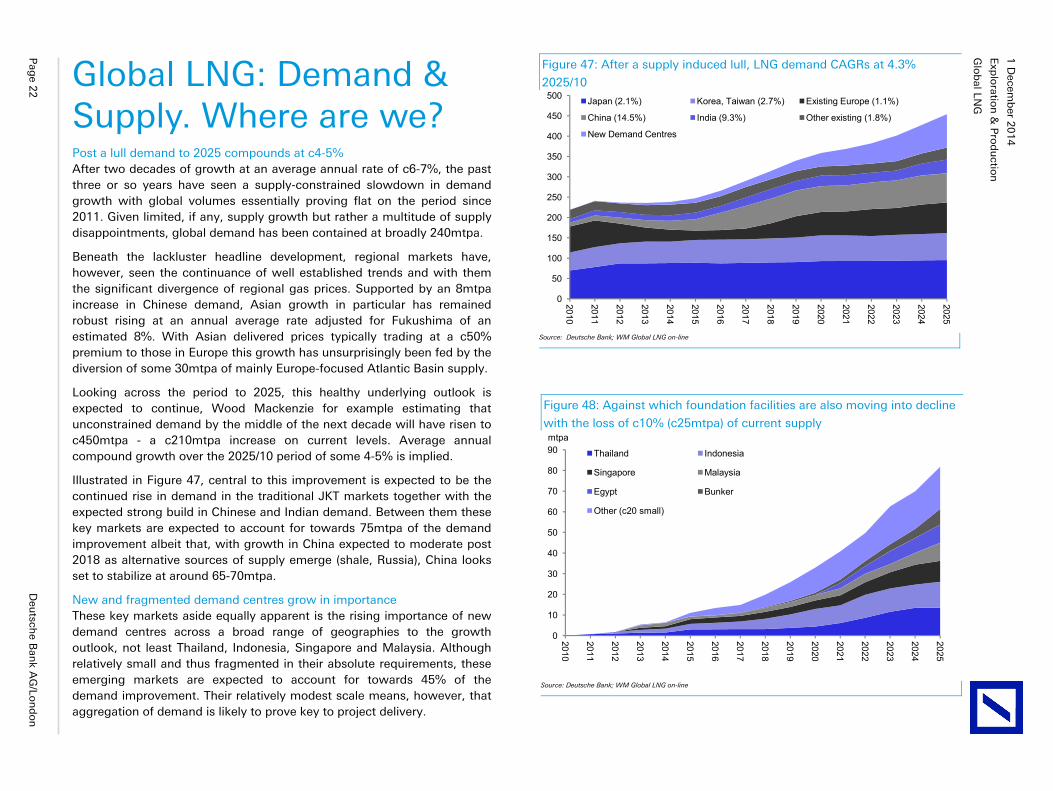
Glo
bal LN
G
Exp
loratio
n &
Pro
du
ction
1 D
ecemb
er 20
14
Pag
e 22
D
eutsch
e Ban
k AG
/Lon
do
n
Global LNG: Demand & Supply. Where are we? Post a lull demand to 2025 compounds at c4-5% After two decades of growth at an average annual rate of c6-7%, the past three or so years have seen a supply-constrained slowdown in demand growth with global volumes essentially proving flat on the period since 2011. Given limited, if any, supply growth but rather a multitude of supply disappointments, global demand has been contained at broadly 240mtpa.
Beneath the lackluster headline development, regional markets have, however, seen the continuance of well established trends and with them the significant divergence of regional gas prices. Supported by an 8mtpa increase in Chinese demand, Asian growth in particular has remained robust rising at an annual average rate adjusted for Fukushima of an estimated 8%. With Asian delivered prices typically trading at a c50% premium to those in Europe this growth has unsurprisingly been fed by the diversion of some 30mtpa of mainly Europe-focused Atlantic Basin supply.
Looking across the period to 2025, this healthy underlying outlook is expected to continue, Wood Mackenzie for example estimating that unconstrained demand by the middle of the next decade will have risen to c450mtpa - a c210mtpa increase on current levels. Average annual compound growth over the 2025/10 period of some 4-5% is implied.
Illustrated in Figure 47, central to this improvement is expected to be the continued rise in demand in the traditional JKT markets together with the expected strong build in Chinese and Indian demand. Between them these key markets are expected to account for towards 75mtpa of the demand improvement albeit that, with growth in China expected to moderate post 2018 as alternative sources of supply emerge (shale, Russia), China looks set to stabilize at around 65-70mtpa.
New and fragmented demand centres grow in importance These key markets aside equally apparent is the rising importance of new demand centres across a broad range of geographies to the growth outlook, not least Thailand, Indonesia, Singapore and Malaysia. Although relatively small and thus fragmented in their absolute requirements, these emerging markets are expected to account for towards 45% of the demand improvement. Their relatively modest scale means, however, that aggregation of demand is likely to prove key to project delivery.
Figure 48: Against which foundation facilities are also moving into decline
with the loss of c10% (c25mtpa) of current supply
0
10
20
30
40
50
60
70
80
90
2010
2011
2012
2013
2014
2015
2016
2017
2018
2019
2020
2021
2022
2023
2024
2025
mtpa
Thailand Indonesia
Singapore Malaysia
Egypt Bunker
Other (c20 small)
Source: Deutsche Bank; WM Global LNG on-line
Figure 47: After a supply induced lull, LNG demand CAGRs at 4.3%
2025/10
0
50
100
150
200
250
300
350
400
450
500
2010
2011
2012
2013
2014
2015
2016
2017
2018
2019
2020
2021
2022
2023
2024
2025Japan (2.1%) Korea, Taiwan (2.7%) Existing Europe (1.1%)
China (14.5%) India (9.3%) Other existing (1.8%)
New Demand Centres
Source: Deutsche Bank; WM Global LNG on-line
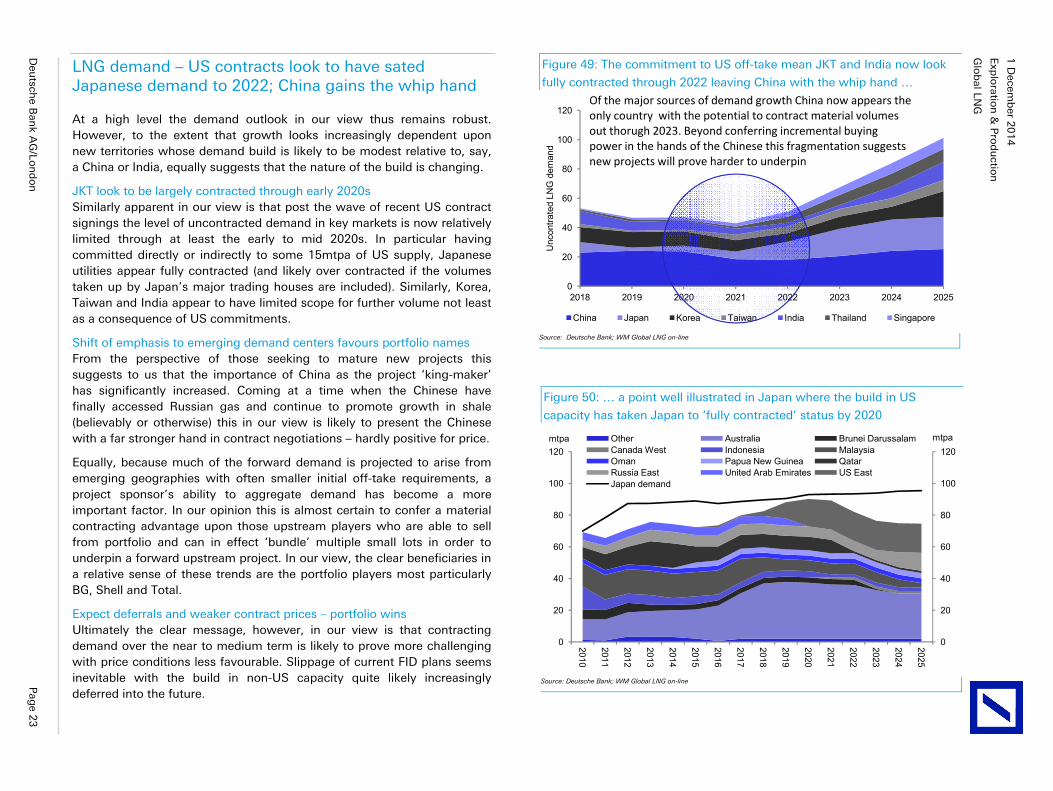
Glo
bal LN
G
Exp
loratio
n &
Pro
du
ction
1 D
ecemb
er 20
14
Deu
tsche B
ank A
G/Lo
nd
on
P
age 2
3
LNG demand – US contracts look to have sated Japanese demand to 2022; China gains the whip hand
At a high level the demand outlook in our view thus remains robust. However, to the extent that growth looks increasingly dependent upon new territories whose demand build is likely to be modest relative to, say, a China or India, equally suggests that the nature of the build is changing.
JKT look to be largely contracted through early 2020s Similarly apparent in our view is that post the wave of recent US contract signings the level of uncontracted demand in key markets is now relatively limited through at least the early to mid 2020s. In particular having committed directly or indirectly to some 15mtpa of US supply, Japanese utilities appear fully contracted (and likely over contracted if the volumes taken up by Japan’s major trading houses are included). Similarly, Korea, Taiwan and India appear to have limited scope for further volume not least as a consequence of US commitments.
Shift of emphasis to emerging demand centers favours portfolio names From the perspective of those seeking to mature new projects this suggests to us that the importance of China as the project ‘king-maker’ has significantly increased. Coming at a time when the Chinese have finally accessed Russian gas and continue to promote growth in shale (believably or otherwise) this in our view is likely to present the Chinese with a far stronger hand in contract negotiations – hardly positive for price.
Equally, because much of the forward demand is projected to arise from emerging geographies with often smaller initial off-take requirements, a project sponsor’s ability to aggregate demand has become a more important factor. In our opinion this is almost certain to confer a material contracting advantage upon those upstream players who are able to sell from portfolio and can in effect ‘bundle’ multiple small lots in order to underpin a forward upstream project. In our view, the clear beneficiaries in a relative sense of these trends are the portfolio players most particularly BG, Shell and Total.
Expect deferrals and weaker contract prices – portfolio wins Ultimately the clear message, however, in our view is that contracting demand over the near to medium term is likely to prove more challenging with price conditions less favourable. Slippage of current FID plans seems inevitable with the build in non-US capacity quite likely increasingly deferred into the future.
Figure 50: … a point well illustrated in Japan where the build in US
capacity has taken Japan to ‘fully contracted’ status by 2020
0
20
40
60
80
100
120
0
20
40
60
80
100
120
2010
2011
2012
2013
2014
2015
2016
2017
2018
2019
2020
2021
2022
2023
2024
2025
mtpamtpa Other Australia Brunei DarussalamCanada West Indonesia MalaysiaOman Papua New Guinea QatarRussia East United Arab Emirates US EastJapan demand
Source: Deutsche Bank; WM Global LNG on-line
Figure 49: The commitment to US off-take mean JKT and India now look
fully contracted through 2022 leaving China with the whip hand …
0
20
40
60
80
100
120
2018 2019 2020 2021 2022 2023 2024 2025
Unc
ontra
ted
LNG
dem
and
China Japan Korea Taiwan India Thailand Singapore
Of the major sources of demand growth China now appears the only country with the potential to contract material volumes out thorugh 2023. Beyond conferring incremental buying power in the hands of the Chinese this fragmentation suggests new projects will prove harder to underpin
Source: Deutsche Bank; WM Global LNG on-line
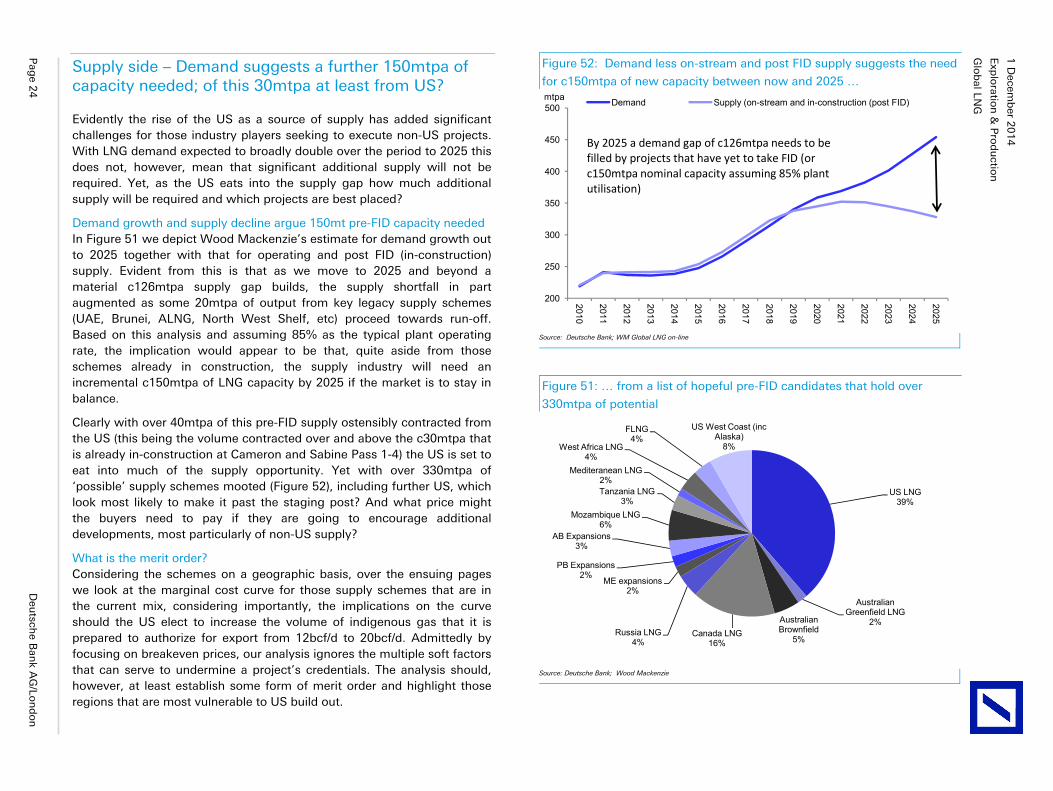
Glo
bal LN
G
Exp
loratio
n &
Pro
du
ction
1 D
ecemb
er 20
14
Pag
e 24
D
eutsch
e Ban
k AG
/Lon
do
n
Supply side – Demand suggests a further 150mtpa of capacity needed; of this 30mtpa at least from US?
Evidently the rise of the US as a source of supply has added significant challenges for those industry players seeking to execute non-US projects. With LNG demand expected to broadly double over the period to 2025 this does not, however, mean that significant additional supply will not be required. Yet, as the US eats into the supply gap how much additional supply will be required and which projects are best placed?
Demand growth and supply decline argue 150mt pre-FID capacity needed In Figure 51 we depict Wood Mackenzie’s estimate for demand growth out to 2025 together with that for operating and post FID (in-construction) supply. Evident from this is that as we move to 2025 and beyond a material c126mtpa supply gap builds, the supply shortfall in part augmented as some 20mtpa of output from key legacy supply schemes (UAE, Brunei, ALNG, North West Shelf, etc) proceed towards run-off. Based on this analysis and assuming 85% as the typical plant operating rate, the implication would appear to be that, quite aside from those schemes already in construction, the supply industry will need an incremental c150mtpa of LNG capacity by 2025 if the market is to stay in balance.
Clearly with over 40mtpa of this pre-FID supply ostensibly contracted from the US (this being the volume contracted over and above the c30mtpa that is already in-construction at Cameron and Sabine Pass 1-4) the US is set to eat into much of the supply opportunity. Yet with over 330mtpa of ‘possible’ supply schemes mooted (Figure 52), including further US, which look most likely to make it past the staging post? And what price might the buyers need to pay if they are going to encourage additional developments, most particularly of non-US supply?
What is the merit order? Considering the schemes on a geographic basis, over the ensuing pages we look at the marginal cost curve for those supply schemes that are in the current mix, considering importantly, the implications on the curve should the US elect to increase the volume of indigenous gas that it is prepared to authorize for export from 12bcf/d to 20bcf/d. Admittedly by focusing on breakeven prices, our analysis ignores the multiple soft factors that can serve to undermine a project’s credentials. The analysis should, however, at least establish some form of merit order and highlight those regions that are most vulnerable to US build out.
Figure 51: … from a list of hopeful pre-FID candidates that hold over
330mtpa of potential
US LNG39%
Australian Greenfield LNG
2%Australian Brownfield
5%Canada LNG
16%Russia LNG
4%
ME expansions2%
PB Expansions2%
AB Expansions3%
Mozambique LNG6%
Tanzania LNG3%
Mediteranean LNG2%
West Africa LNG4%
FLNG4%
US West Coast (inc Alaska)
8%
Source: Deutsche Bank; Wood Mackenzie
Figure 52: Demand less on-stream and post FID supply suggests the need
for c150mtpa of new capacity between now and 2025 …
200
250
300
350
400
450
500
2010
2011
2012
2013
2014
2015
2016
2017
2018
2019
2020
2021
2022
2023
2024
2025
mtpa Demand Supply (on-stream and in-construction (post FID)
By 2025 a demand gap of c126mtpa needs to be filled by projects that have yet to take FID (or c150mtpa nominal capacity assuming 85% plant utilisation)
Source: Deutsche Bank; WM Global LNG on-line
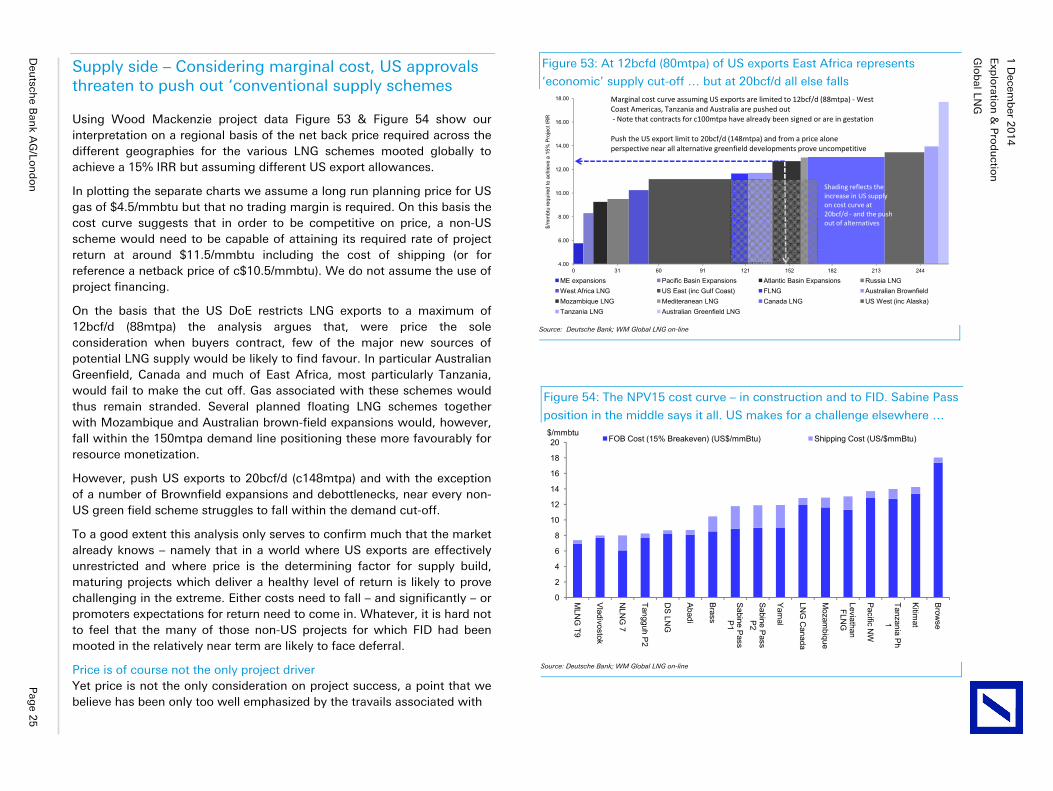
Glo
bal LN
G
Exp
loratio
n &
Pro
du
ction
1 D
ecemb
er 20
14
Deu
tsche B
ank A
G/Lo
nd
on
P
age 2
5
Supply side – Considering marginal cost, US approvals threaten to push out ‘conventional supply schemes
Using Wood Mackenzie project data Figure 53 & Figure 54 show our interpretation on a regional basis of the net back price required across the different geographies for the various LNG schemes mooted globally to achieve a 15% IRR but assuming different US export allowances.
In plotting the separate charts we assume a long run planning price for US gas of $4.5/mmbtu but that no trading margin is required. On this basis the cost curve suggests that in order to be competitive on price, a non-US scheme would need to be capable of attaining its required rate of project return at around $11.5/mmbtu including the cost of shipping (or for reference a netback price of c$10.5/mmbtu). We do not assume the use of project financing.
On the basis that the US DoE restricts LNG exports to a maximum of 12bcf/d (88mtpa) the analysis argues that, were price the sole consideration when buyers contract, few of the major new sources of potential LNG supply would be likely to find favour. In particular Australian Greenfield, Canada and much of East Africa, most particularly Tanzania, would fail to make the cut off. Gas associated with these schemes would thus remain stranded. Several planned floating LNG schemes together with Mozambique and Australian brown-field expansions would, however, fall within the 150mtpa demand line positioning these more favourably for resource monetization.
However, push US exports to 20bcf/d (c148mtpa) and with the exception of a number of Brownfield expansions and debottlenecks, near every non-US green field scheme struggles to fall within the demand cut-off.
To a good extent this analysis only serves to confirm much that the market already knows – namely that in a world where US exports are effectively unrestricted and where price is the determining factor for supply build, maturing projects which deliver a healthy level of return is likely to prove challenging in the extreme. Either costs need to fall – and significantly – or promoters expectations for return need to come in. Whatever, it is hard not to feel that the many of those non-US projects for which FID had been mooted in the relatively near term are likely to face deferral.
Price is of course not the only project driver Yet price is not the only consideration on project success, a point that we believe has been only too well emphasized by the travails associated with
Figure 54: The NPV15 cost curve – in construction and to FID. Sabine Pass
position in the middle says it all. US makes for a challenge elsewhere …
0
2
4
6
8
10
12
14
16
18
20
MLN
G T9
Vladivostok
NLN
G 7
Tangguh P2
DS
LNG
Abadi
Brass
Sabine P
ass P
1
Sabine P
ass P
2
Yam
al
LNG
Canada
Mozam
bique
Leviathan FLN
G
Pacific N
W
Tanzania Ph
1
Kitim
at
Brow
se
$/mmbtuFOB Cost (15% Breakeven) (US$/mmBtu) Shipping Cost (US/$mmBtu)
Source: Deutsche Bank; WM Global LNG on-line
Figure 53: At 12bcfd (80mtpa) of US exports East Africa represents
‘economic’ supply cut-off … but at 20bcf/d all else falls
4.00
6.00
8.00
10.00
12.00
14.00
16.00
18.00
0 31 60 91 121 152 182 213 244
$/m
mbt
u re
quire
d to
ach
ieve
a 1
5% P
roje
ct IR
R
ME expansions Pacific Basin Expansions Atlantic Basin Expansions Russia LNGWest Africa LNG US East (inc Gulf Coast) FLNG Australian BrownfieldMozambique LNG Mediteranean LNG Canada LNG US West (inc Alaska)Tanzania LNG Australian Greenfield LNG
Marginal cost curve assuming US exports are limited to 12bcf/d (88mtpa) - WestCoast Americas, Tanzania and Australia are pushed out- Note that contracts for c100mtpa have already been signed or are in gestation
Push the US export limit to 20bcf/d (148mtpa) and from a price alone perspective near all alternative greenfield developments prove uncompetitive
Shading reflects the increase in US supply on cost curve at 20bcf/d - and the push out of alternatives
Source: Deutsche Bank; WM Global LNG on-line
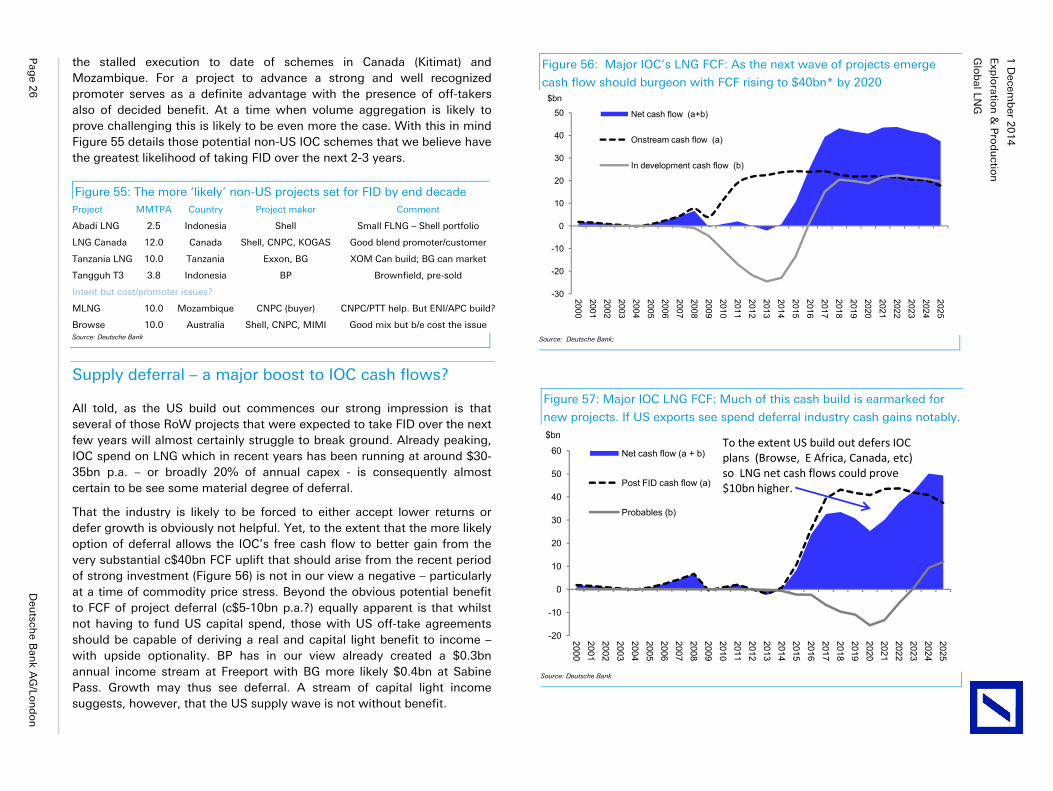
Glo
bal LN
G
Exp
loratio
n &
Pro
du
ction
1 D
ecemb
er 20
14
Pag
e 26
D
eutsch
e Ban
k AG
/Lon
do
n
the stalled execution to date of schemes in Canada (Kitimat) and Mozambique. For a project to advance a strong and well recognized promoter serves as a definite advantage with the presence of off-takers also of decided benefit. At a time when volume aggregation is likely to prove challenging this is likely to be even more the case. With this in mind Figure 55 details those potential non-US IOC schemes that we believe have the greatest likelihood of taking FID over the next 2-3 years.
Figure 55: The more ‘likely’ non-US projects set for FID by end decade Project MMTPA Country Project maker Comment
Abadi LNG 2.5 Indonesia Shell Small FLNG – Shell portfolio
LNG Canada 12.0 Canada Shell, CNPC, KOGAS Good blend promoter/customer
Tanzania LNG 10.0 Tanzania Exxon, BG XOM Can build; BG can market
Tangguh T3 3.8 Indonesia BP Brownfield, pre-sold
Intent but cost/promoter issues?
MLNG 10.0 Mozambique CNPC (buyer) CNPC/PTT help. But ENI/APC build?
Browse 10.0 Australia Shell, CNPC, MIMI Good mix but b/e cost the issue Source: Deutsche Bank
Supply deferral – a major boost to IOC cash flows?
All told, as the US build out commences our strong impression is that several of those RoW projects that were expected to take FID over the next few years will almost certainly struggle to break ground. Already peaking, IOC spend on LNG which in recent years has been running at around $30-35bn p.a. – or broadly 20% of annual capex - is consequently almost certain to be see some material degree of deferral.
That the industry is likely to be forced to either accept lower returns or defer growth is obviously not helpful. Yet, to the extent that the more likely option of deferral allows the IOC’s free cash flow to better gain from the very substantial c$40bn FCF uplift that should arise from the recent period of strong investment (Figure 56) is not in our view a negative – particularly at a time of commodity price stress. Beyond the obvious potential benefit to FCF of project deferral (c$5-10bn p.a.?) equally apparent is that whilst not having to fund US capital spend, those with US off-take agreements should be capable of deriving a real and capital light benefit to income – with upside optionality. BP has in our view already created a $0.3bn annual income stream at Freeport with BG more likely $0.4bn at Sabine Pass. Growth may thus see deferral. A stream of capital light income suggests, however, that the US supply wave is not without benefit.
Figure 57: Major IOC LNG FCF: Much of this cash build is earmarked for
new projects. If US exports see spend deferral industry cash gains notably.
-20
-10
0
10
20
30
40
50
60
20002001200220032004200520062007200820092010201120122013201420152016201720182019202020212022202320242025
$bn
Net cash flow (a + b)
Post FID cash flow (a)
Probables (b)
To the extent US build out defers IOC plans (Browse, E Africa, Canada, etc) so LNG net cash flows could prove $10bn higher.
Source: Deutsche Bank
Figure 56: Major IOC’s LNG FCF: As the next wave of projects emerge
cash flow should burgeon with FCF rising to $40bn* by 2020
-30
-20
-10
0
10
20
30
40
50
2000
20012002
20032004
20052006
2007
20082009
20102011
20122013
2014
20152016
20172018
20192020
2021
20222023
20242025
$bn
Net cash flow (a+b)
Onstream cash flow (a)
In development cash flow (b)
Source: Deutsche Bank;
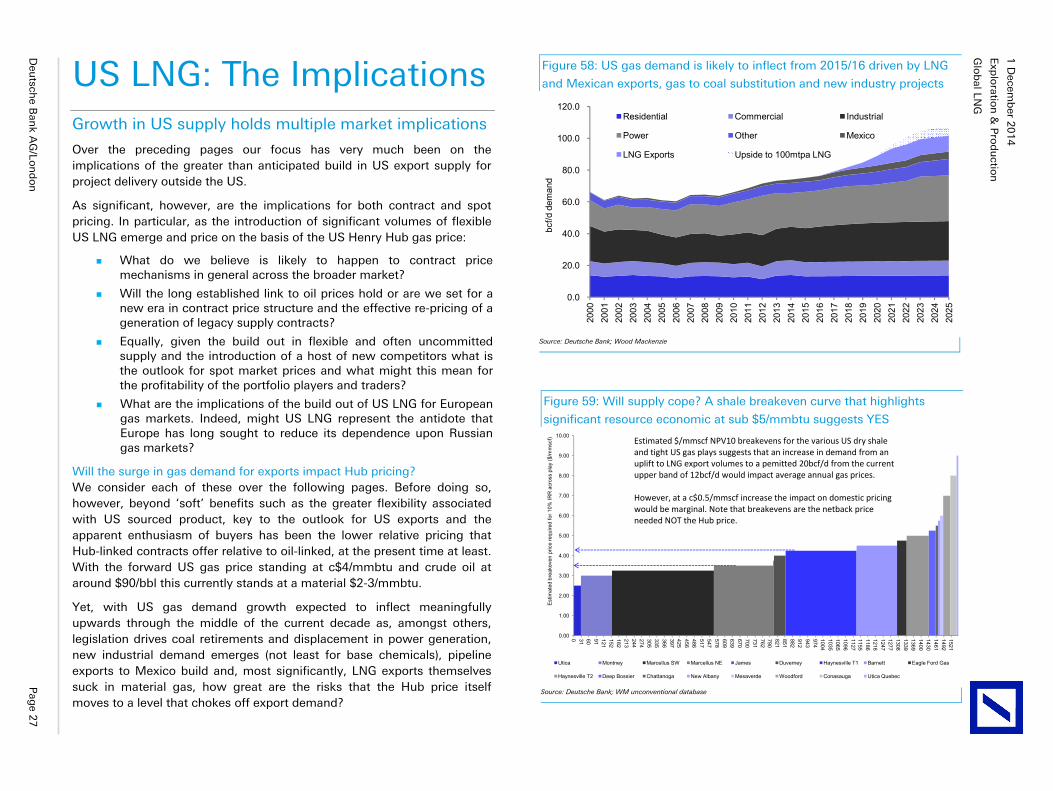
Glo
bal LN
G
Exp
loratio
n &
Pro
du
ction
1 D
ecemb
er 20
14
Deu
tsche B
ank A
G/Lo
nd
on
P
age 2
7
US LNG: The Implications Growth in US supply holds multiple market implications
Over the preceding pages our focus has very much been on the implications of the greater than anticipated build in US export supply for project delivery outside the US.
As significant, however, are the implications for both contract and spot pricing. In particular, as the introduction of significant volumes of flexible US LNG emerge and price on the basis of the US Henry Hub gas price:
What do we believe is likely to happen to contract price mechanisms in general across the broader market?
Will the long established link to oil prices hold or are we set for a new era in contract price structure and the effective re-pricing of a generation of legacy supply contracts?
Equally, given the build out in flexible and often uncommitted supply and the introduction of a host of new competitors what is the outlook for spot market prices and what might this mean for the profitability of the portfolio players and traders?
What are the implications of the build out of US LNG for European gas markets. Indeed, might US LNG represent the antidote that Europe has long sought to reduce its dependence upon Russian gas markets?
Will the surge in gas demand for exports impact Hub pricing? We consider each of these over the following pages. Before doing so, however, beyond ‘soft’ benefits such as the greater flexibility associated with US sourced product, key to the outlook for US exports and the apparent enthusiasm of buyers has been the lower relative pricing that Hub-linked contracts offer relative to oil-linked, at the present time at least. With the forward US gas price standing at c$4/mmbtu and crude oil at around $90/bbl this currently stands at a material $2-3/mmbtu.
Yet, with US gas demand growth expected to inflect meaningfully upwards through the middle of the current decade as, amongst others, legislation drives coal retirements and displacement in power generation, new industrial demand emerges (not least for base chemicals), pipeline exports to Mexico build and, most significantly, LNG exports themselves suck in material gas, how great are the risks that the Hub price itself moves to a level that chokes off export demand?
Figure 59: Will supply cope? A shale breakeven curve that highlights
significant resource economic at sub $5/mmbtu suggests YES
0.00
1.00
2.00
3.00
4.00
5.00
6.00
7.00
8.00
9.00
10.00
0 31 60 91 121152182213244274305335366397425456486517547578609639670700731762790821851882912943974100410351065109611271155118612161247127713081339136914001430146114921521
Est
imat
ed b
reak
even
pric
e re
quire
d fo
r 10%
IRR
acr
oss
play
($/m
msc
f)
Utica Montney Marcellus SW Marcellus NE James Duverney Haynesville T1 Barnett Eagle Ford Gas
Haynesville T2 Deep Bossier Chattanoga New Albany Mesaverde Woodford Conasauga Utica Quebec
Estimated $/mmscf NPV10 breakevens for the various US dry shale and tight US gas plays suggests that an increase in demand from an uplift to LNG export volumes to a pemitted 20bcf/d from the current upper band of 12bcf/d would impact average annual gas prices.
However, at a c$0.5/mmscf increase the impact on domestic pricing would be marginal. Note that breakevens are the netback price needed NOT the Hub price.
Source: Deutsche Bank; WM unconventional database
Figure 58: US gas demand is likely to inflect from 2015/16 driven by LNG
and Mexican exports, gas to coal substitution and new industry projects
0.0
20.0
40.0
60.0
80.0
100.0
120.0
2000
2001
2002
2003
2004
2005
2006
2007
2008
2009
2010
2011
2012
2013
2014
2015
2016
2017
2018
2019
2020
2021
2022
2023
2024
2025
bcf/d
dem
and
Residential Commercial Industrial
Power Other Mexico
LNG Exports Upside to 100mtpa LNG
Source: Deutsche Bank; Wood Mackenzie
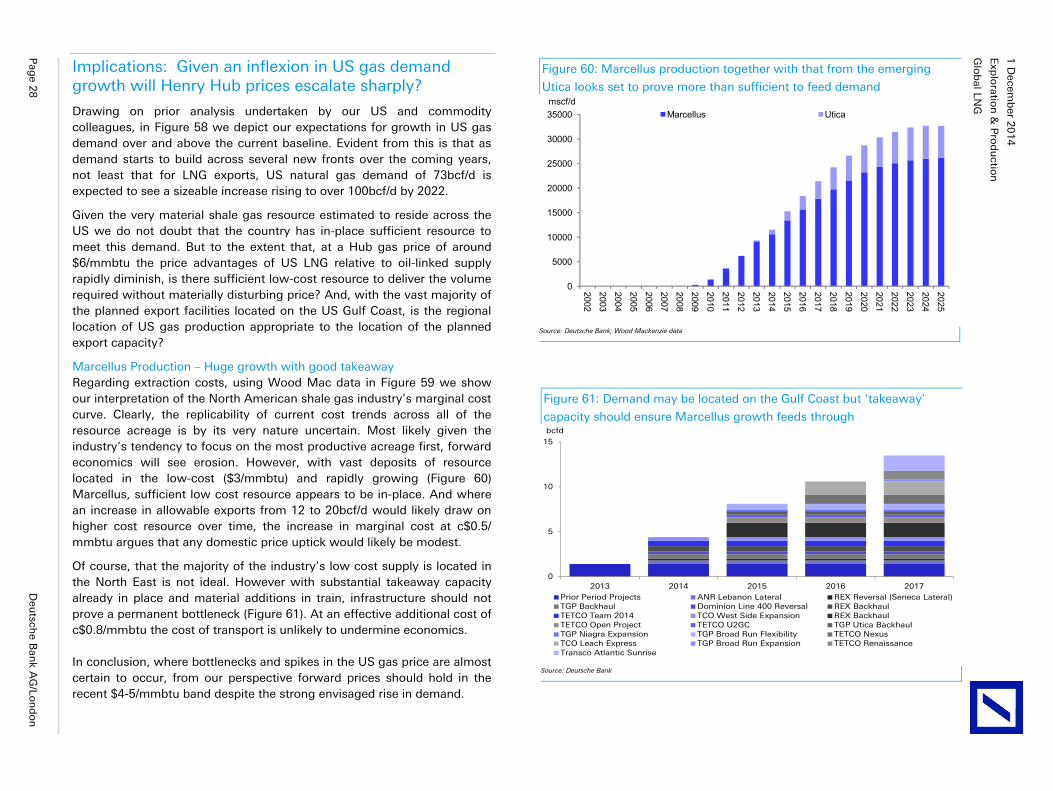
Glo
bal LN
G
Exp
loratio
n &
Pro
du
ction
1 D
ecemb
er 20
14
Pag
e 28
D
eutsch
e Ban
k AG
/Lon
do
n
Implications: Given an inflexion in US gas demand growth will Henry Hub prices escalate sharply?
Drawing on prior analysis undertaken by our US and commodity colleagues, in Figure 58 we depict our expectations for growth in US gas demand over and above the current baseline. Evident from this is that as demand starts to build across several new fronts over the coming years, not least that for LNG exports, US natural gas demand of 73bcf/d is expected to see a sizeable increase rising to over 100bcf/d by 2022.
Given the very material shale gas resource estimated to reside across the US we do not doubt that the country has in-place sufficient resource to meet this demand. But to the extent that, at a Hub gas price of around $6/mmbtu the price advantages of US LNG relative to oil-linked supply rapidly diminish, is there sufficient low-cost resource to deliver the volume required without materially disturbing price? And, with the vast majority of the planned export facilities located on the US Gulf Coast, is the regional location of US gas production appropriate to the location of the planned export capacity?
Marcellus Production – Huge growth with good takeaway Regarding extraction costs, using Wood Mac data in Figure 59 we show our interpretation of the North American shale gas industry’s marginal cost curve. Clearly, the replicability of current cost trends across all of the resource acreage is by its very nature uncertain. Most likely given the industry’s tendency to focus on the most productive acreage first, forward economics will see erosion. However, with vast deposits of resource located in the low-cost ($3/mmbtu) and rapidly growing (Figure 60) Marcellus, sufficient low cost resource appears to be in-place. And where an increase in allowable exports from 12 to 20bcf/d would likely draw on higher cost resource over time, the increase in marginal cost at c$0.5/ mmbtu argues that any domestic price uptick would likely be modest.
Of course, that the majority of the industry’s low cost supply is located in the North East is not ideal. However with substantial takeaway capacity already in place and material additions in train, infrastructure should not prove a permanent bottleneck (Figure 61). At an effective additional cost of c$0.8/mmbtu the cost of transport is unlikely to undermine economics.
In conclusion, where bottlenecks and spikes in the US gas price are almost certain to occur, from our perspective forward prices should hold in the recent $4-5/mmbtu band despite the strong envisaged rise in demand.
Figure 61: Demand may be located on the Gulf Coast but ‘takeaway’
capacity should ensure Marcellus growth feeds through
0
5
10
15
2013 2014 2015 2016 2017
bcfd
Prior Period Projects ANR Lebanon Lateral REX Reversal (Seneca Lateral)TGP Backhaul Dominion Line 400 Reversal REX BackhaulTETCO Team 2014 TCO West Side Expansion REX BackhaulTETCO Open Project TETCO U2GC TGP Utica BackhaulTGP Niagra Expansion TGP Broad Run Flexibility TETCO NexusTCO Leach Express TGP Broad Run Expansion TETCO RenaissanceTransco Atlantic Sunrise
Source: Deutsche Bank
Figure 60: Marcellus production together with that from the emerging
Utica looks set to prove more than sufficient to feed demand
0
5000
10000
15000
20000
25000
30000
35000
2002
2003
2004
2005
2006
2007
2008
2009
2010
2011
2012
2013
2014
2015
2016
2017
2018
2019
2020
2021
2022
2023
2024
2025mscf/d
Marcellus Utica
Source: Deutsche Bank; Wood Mackenzie data
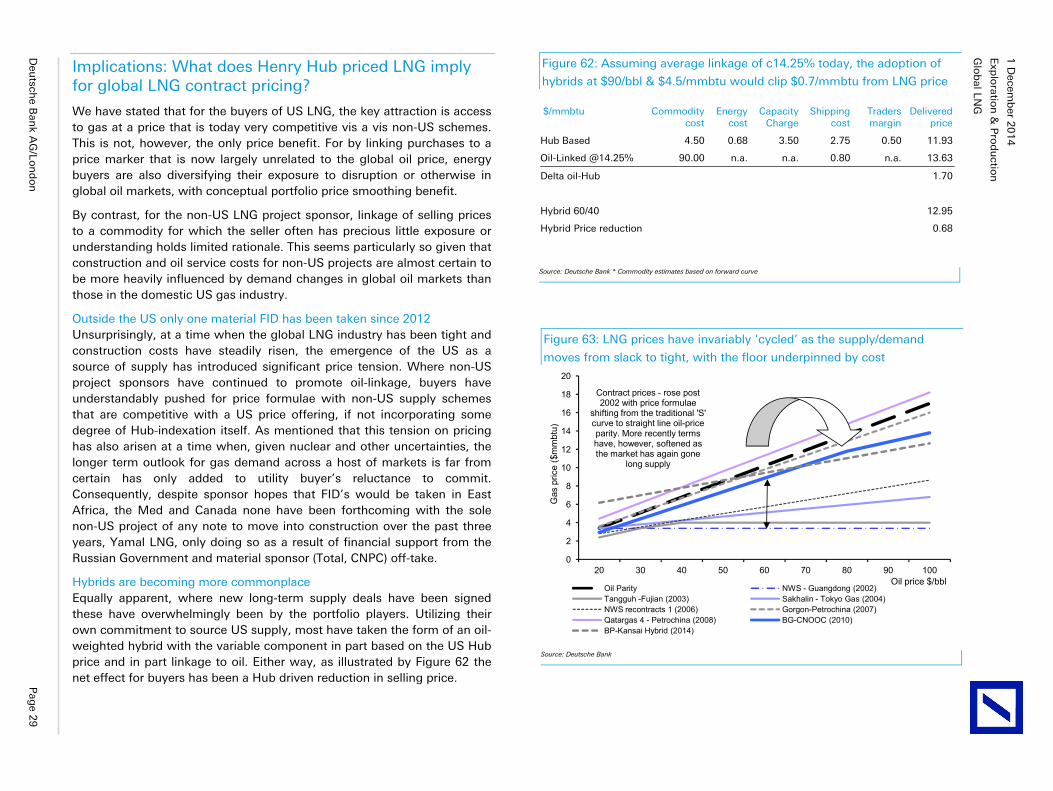
Glo
bal LN
G
Exp
loratio
n &
Pro
du
ction
1 D
ecemb
er 20
14
Deu
tsche B
ank A
G/Lo
nd
on
P
age 2
9
Implications: What does Henry Hub priced LNG imply for global LNG contract pricing?
We have stated that for the buyers of US LNG, the key attraction is access to gas at a price that is today very competitive vis a vis non-US schemes. This is not, however, the only price benefit. For by linking purchases to a price marker that is now largely unrelated to the global oil price, energy buyers are also diversifying their exposure to disruption or otherwise in global oil markets, with conceptual portfolio price smoothing benefit.
By contrast, for the non-US LNG project sponsor, linkage of selling prices to a commodity for which the seller often has precious little exposure or understanding holds limited rationale. This seems particularly so given that construction and oil service costs for non-US projects are almost certain to be more heavily influenced by demand changes in global oil markets than those in the domestic US gas industry.
Outside the US only one material FID has been taken since 2012 Unsurprisingly, at a time when the global LNG industry has been tight and construction costs have steadily risen, the emergence of the US as a source of supply has introduced significant price tension. Where non-US project sponsors have continued to promote oil-linkage, buyers have understandably pushed for price formulae with non-US supply schemes that are competitive with a US price offering, if not incorporating some degree of Hub-indexation itself. As mentioned that this tension on pricing has also arisen at a time when, given nuclear and other uncertainties, the longer term outlook for gas demand across a host of markets is far from certain has only added to utility buyer’s reluctance to commit. Consequently, despite sponsor hopes that FID’s would be taken in East Africa, the Med and Canada none have been forthcoming with the sole non-US project of any note to move into construction over the past three years, Yamal LNG, only doing so as a result of financial support from the Russian Government and material sponsor (Total, CNPC) off-take.
Hybrids are becoming more commonplace Equally apparent, where new long-term supply deals have been signed these have overwhelmingly been by the portfolio players. Utilizing their own commitment to source US supply, most have taken the form of an oil-weighted hybrid with the variable component in part based on the US Hub price and in part linkage to oil. Either way, as illustrated by Figure 62 the net effect for buyers has been a Hub driven reduction in selling price.
Figure 63: LNG prices have invariably ‘cycled’ as the supply/demand
moves from slack to tight, with the floor underpinned by cost
0
2
4
6
8
10
12
14
16
18
20
20 30 40 50 60 70 80 90 100
Oil Parity NWS - Guangdong (2002)Tangguh -Fujian (2003) Sakhalin - Tokyo Gas (2004)NWS recontracts 1 (2006) Gorgon-Petrochina (2007)Qatargas 4 - Petrochina (2008) BG-CNOOC (2010)BP-Kansai Hybrid (2014)
Gas
pric
e ($
mm
btu)
Oil price $/bbl
Contract prices - rose post 2002 with price formulae
shifting from the traditional 'S' curve to straight line oil-price parity. More recently terms have, however, softened as the market has again gone
long supply
Source: Deutsche Bank
Figure 62: Assuming average linkage of c14.25% today, the adoption of
hybrids at $90/bbl & $4.5/mmbtu would clip $0.7/mmbtu from LNG price
$/mmbtu Commoditycost
Energy cost
Capacity Charge
Shipping cost
Traders margin
Delivered price
Hub Based 4.50 0.68 3.50 2.75 0.50 11.93
Oil-Linked @14.25% 90.00 n.a. n.a. 0.80 n.a. 13.63
Delta oil-Hub 1.70
Hybrid 60/40 12.95
Hybrid Price reduction 0.68
Source: Deutsche Bank * Commodity estimates based on forward curve
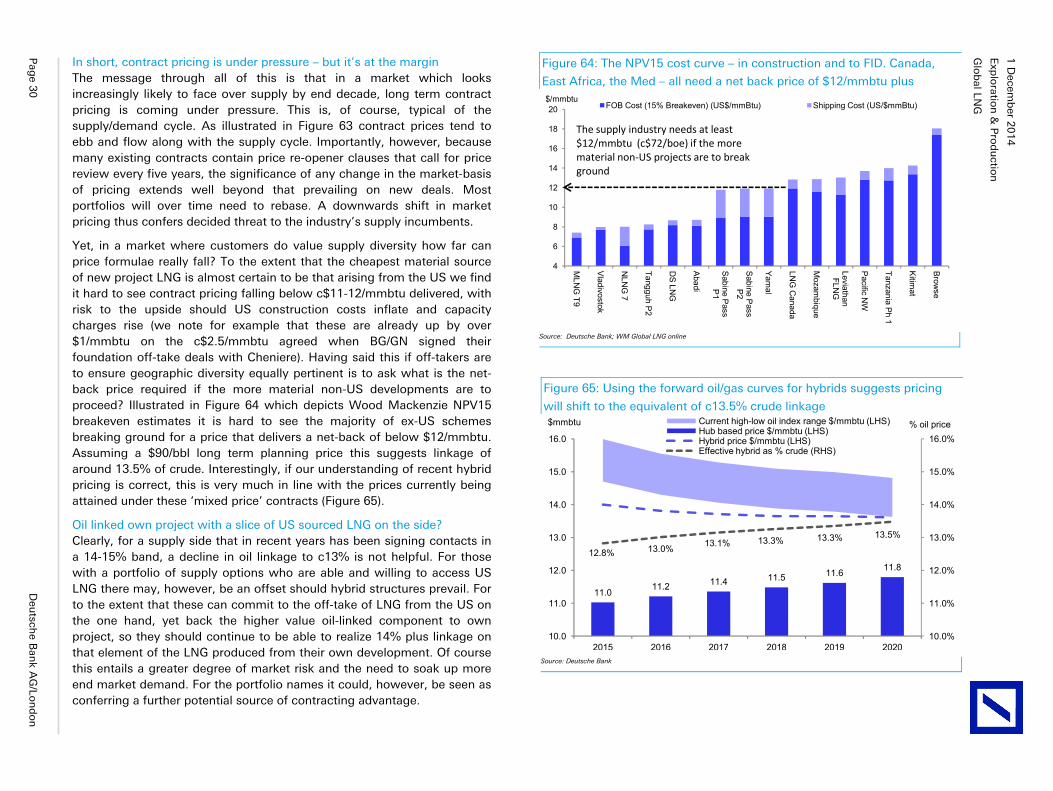
Glo
bal LN
G
Exp
loratio
n &
Pro
du
ction
1 D
ecemb
er 20
14
Pag
e 30
D
eutsch
e Ban
k AG
/Lon
do
n
In short, contract pricing is under pressure – but it’s at the margin The message through all of this is that in a market which looks increasingly likely to face over supply by end decade, long term contract pricing is coming under pressure. This is, of course, typical of the supply/demand cycle. As illustrated in Figure 63 contract prices tend to ebb and flow along with the supply cycle. Importantly, however, because many existing contracts contain price re-opener clauses that call for price review every five years, the significance of any change in the market-basis of pricing extends well beyond that prevailing on new deals. Most portfolios will over time need to rebase. A downwards shift in market pricing thus confers decided threat to the industry’s supply incumbents.
Yet, in a market where customers do value supply diversity how far can price formulae really fall? To the extent that the cheapest material source of new project LNG is almost certain to be that arising from the US we find it hard to see contract pricing falling below c$11-12/mmbtu delivered, with risk to the upside should US construction costs inflate and capacity charges rise (we note for example that these are already up by over $1/mmbtu on the c$2.5/mmbtu agreed when BG/GN signed their foundation off-take deals with Cheniere). Having said this if off-takers are to ensure geographic diversity equally pertinent is to ask what is the net-back price required if the more material non-US developments are to proceed? Illustrated in Figure 64 which depicts Wood Mackenzie NPV15 breakeven estimates it is hard to see the majority of ex-US schemes breaking ground for a price that delivers a net-back of below $12/mmbtu. Assuming a $90/bbl long term planning price this suggests linkage of around 13.5% of crude. Interestingly, if our understanding of recent hybrid pricing is correct, this is very much in line with the prices currently being attained under these ‘mixed price’ contracts (Figure 65).
Oil linked own project with a slice of US sourced LNG on the side? Clearly, for a supply side that in recent years has been signing contacts in a 14-15% band, a decline in oil linkage to c13% is not helpful. For those with a portfolio of supply options who are able and willing to access US LNG there may, however, be an offset should hybrid structures prevail. For to the extent that these can commit to the off-take of LNG from the US on the one hand, yet back the higher value oil-linked component to own project, so they should continue to be able to realize 14% plus linkage on that element of the LNG produced from their own development. Of course this entails a greater degree of market risk and the need to soak up more end market demand. For the portfolio names it could, however, be seen as conferring a further potential source of contracting advantage.
Figure 65: Using the forward oil/gas curves for hybrids suggests pricing
will shift to the equivalent of c13.5% crude linkage
11.0 11.2 11.4 11.5 11.6 11.812.8% 13.0% 13.1% 13.3% 13.3% 13.5%
10.0%
11.0%
12.0%
13.0%
14.0%
15.0%
16.0%
10.0
11.0
12.0
13.0
14.0
15.0
16.0
2015 2016 2017 2018 2019 2020
% oil price$mmbtu Current high-low oil index range $/mmbtu (LHS)Hub based price $/mmbtu (LHS)Hybrid price $/mmbtu (LHS)Effective hybrid as % crude (RHS)
Source: Deutsche Bank
Figure 64: The NPV15 cost curve – in construction and to FID. Canada,
East Africa, the Med – all need a net back price of $12/mmbtu plus
4
6
8
10
12
14
16
18
20
MLN
G T9
Vladivostok
NLN
G 7
Tangguh P2
DS
LNG
Abadi
Sabine P
ass P
1
Sabine P
ass P
2
Yam
al
LNG
Canada
Mozam
bique
Leviathan FLN
G
Pacific N
W
Tanzania Ph 1
Kitim
at
Browse
$/mmbtuFOB Cost (15% Breakeven) (US$/mmBtu) Shipping Cost (US/$mmBtu)
The supply industry needs at least $12/mmbtu (c$72/boe) if the more material non-US projects are to break ground
Source: Deutsche Bank; WM Global LNG online
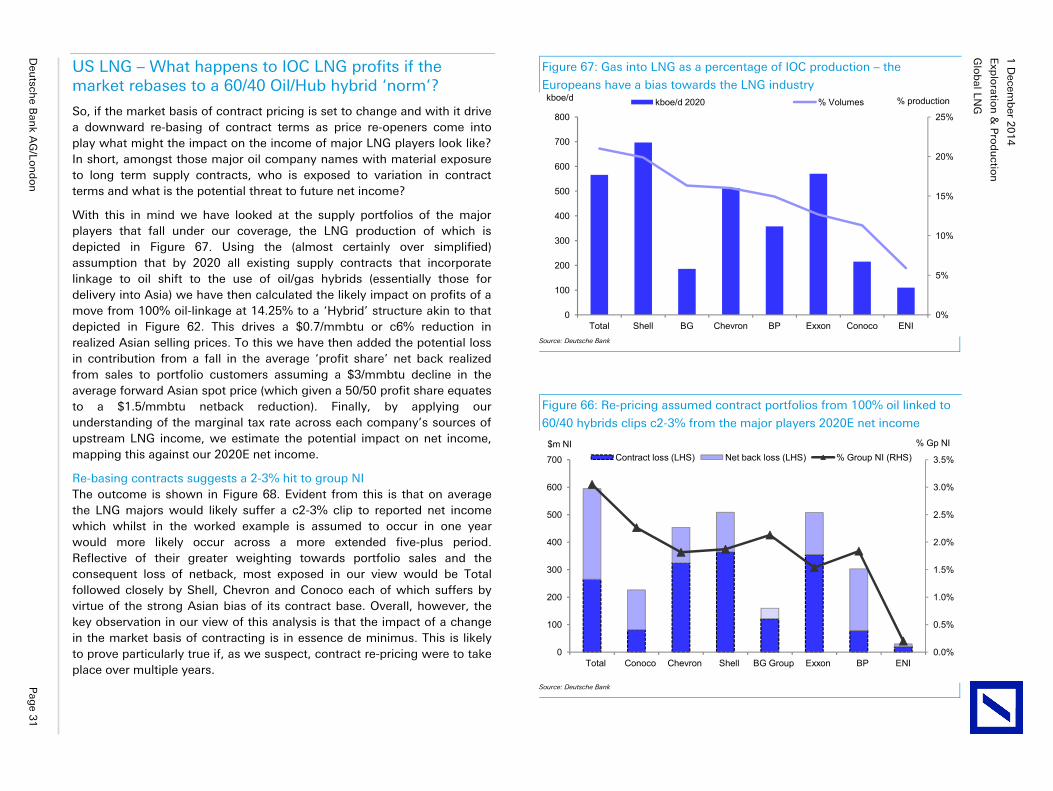
Glo
bal LN
G
Exp
loratio
n &
Pro
du
ction
1 D
ecemb
er 20
14
Deu
tsche B
ank A
G/Lo
nd
on
P
age 3
1
US LNG – What happens to IOC LNG profits if the market rebases to a 60/40 Oil/Hub hybrid ‘norm’?
So, if the market basis of contract pricing is set to change and with it drive a downward re-basing of contract terms as price re-openers come into play what might the impact on the income of major LNG players look like? In short, amongst those major oil company names with material exposure to long term supply contracts, who is exposed to variation in contract terms and what is the potential threat to future net income?
With this in mind we have looked at the supply portfolios of the major players that fall under our coverage, the LNG production of which is depicted in Figure 67. Using the (almost certainly over simplified) assumption that by 2020 all existing supply contracts that incorporate linkage to oil shift to the use of oil/gas hybrids (essentially those for delivery into Asia) we have then calculated the likely impact on profits of a move from 100% oil-linkage at 14.25% to a ‘Hybrid’ structure akin to that depicted in Figure 62. This drives a $0.7/mmbtu or c6% reduction in realized Asian selling prices. To this we have then added the potential loss in contribution from a fall in the average ‘profit share’ net back realized from sales to portfolio customers assuming a $3/mmbtu decline in the average forward Asian spot price (which given a 50/50 profit share equates to a $1.5/mmbtu netback reduction). Finally, by applying our understanding of the marginal tax rate across each company’s sources of upstream LNG income, we estimate the potential impact on net income, mapping this against our 2020E net income.
Re-basing contracts suggests a 2-3% hit to group NI The outcome is shown in Figure 68. Evident from this is that on average the LNG majors would likely suffer a c2-3% clip to reported net income which whilst in the worked example is assumed to occur in one year would more likely occur across a more extended five-plus period. Reflective of their greater weighting towards portfolio sales and the consequent loss of netback, most exposed in our view would be Total followed closely by Shell, Chevron and Conoco each of which suffers by virtue of the strong Asian bias of its contract base. Overall, however, the key observation in our view of this analysis is that the impact of a change in the market basis of contracting is in essence de minimus. This is likely to prove particularly true if, as we suspect, contract re-pricing were to take place over multiple years.
Figure 66: Re-pricing assumed contract portfolios from 100% oil linked to
60/40 hybrids clips c2-3% from the major players 2020E net income
0.0%
0.5%
1.0%
1.5%
2.0%
2.5%
3.0%
3.5%
0
100
200
300
400
500
600
700
Total Conoco Chevron Shell BG Group Exxon BP ENI
% Gp NI$m NIContract loss (LHS) Net back loss (LHS) % Group NI (RHS)
Source: Deutsche Bank
Figure 67: Gas into LNG as a percentage of IOC production – the
Europeans have a bias towards the LNG industry
0%
5%
10%
15%
20%
25%
0
100
200
300
400
500
600
700
800
Total Shell BG Chevron BP Exxon Conoco ENI
% productionkboe/d kboe/d 2020 % Volumes
Source: Deutsche Bank
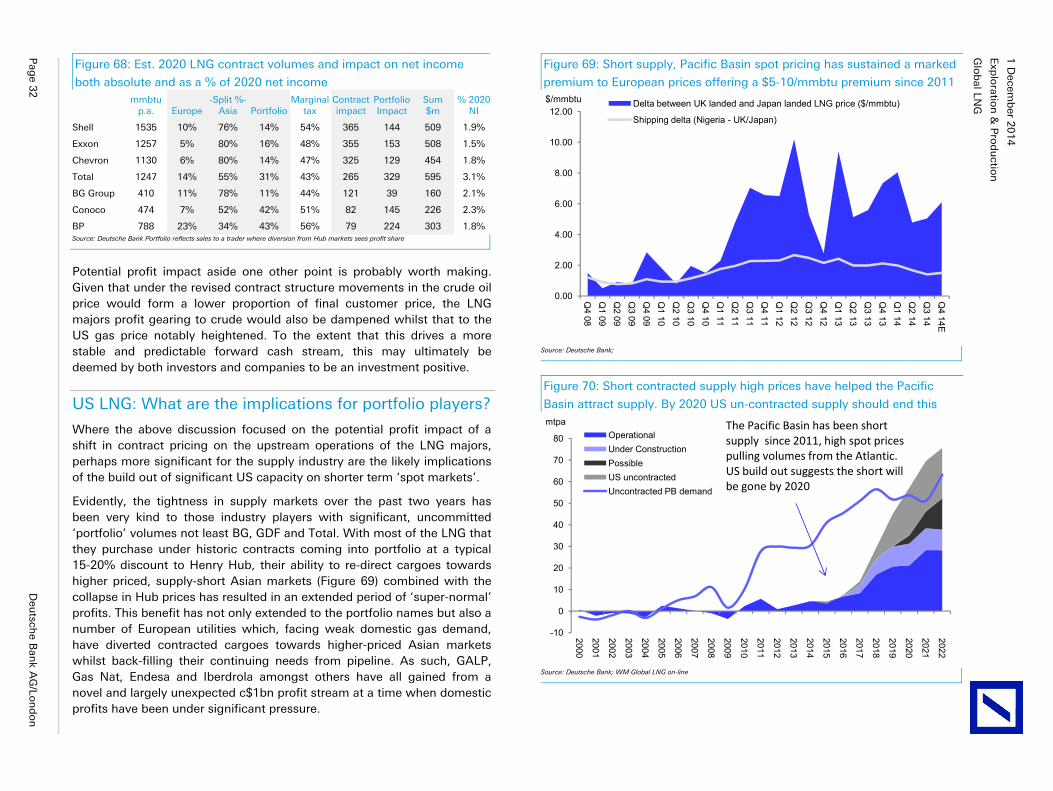
Glo
bal LN
G
Exp
loratio
n &
Pro
du
ction
1 D
ecemb
er 20
14
Pag
e 32
D
eutsch
e Ban
k AG
/Lon
do
n
Figure 68: Est. 2020 LNG contract volumes and impact on net income
both absolute and as a % of 2020 net income mmbtu
p.a.
Europe -Split %-
Asia
PortfolioMarginal
tax Contract impact
Portfolio Impact
Sum $m
% 2020NI
Shell 1535 10% 76% 14% 54% 365 144 509 1.9%
Exxon 1257 5% 80% 16% 48% 355 153 508 1.5%
Chevron 1130 6% 80% 14% 47% 325 129 454 1.8%
Total 1247 14% 55% 31% 43% 265 329 595 3.1%
BG Group 410 11% 78% 11% 44% 121 39 160 2.1%
Conoco 474 7% 52% 42% 51% 82 145 226 2.3%
BP 788 23% 34% 43% 56% 79 224 303 1.8% Source: Deutsche Bank Portfolio reflects sales to a trader where diversion from Hub markets sees profit share
Potential profit impact aside one other point is probably worth making. Given that under the revised contract structure movements in the crude oil price would form a lower proportion of final customer price, the LNG majors profit gearing to crude would also be dampened whilst that to the US gas price notably heightened. To the extent that this drives a more stable and predictable forward cash stream, this may ultimately be deemed by both investors and companies to be an investment positive.
US LNG: What are the implications for portfolio players?
Where the above discussion focused on the potential profit impact of a shift in contract pricing on the upstream operations of the LNG majors, perhaps more significant for the supply industry are the likely implications of the build out of significant US capacity on shorter term ‘spot markets’.
Evidently, the tightness in supply markets over the past two years has been very kind to those industry players with significant, uncommitted ‘portfolio’ volumes not least BG, GDF and Total. With most of the LNG that they purchase under historic contracts coming into portfolio at a typical 15-20% discount to Henry Hub, their ability to re-direct cargoes towards higher priced, supply-short Asian markets (Figure 69) combined with the collapse in Hub prices has resulted in an extended period of ‘super-normal’ profits. This benefit has not only extended to the portfolio names but also a number of European utilities which, facing weak domestic gas demand, have diverted contracted cargoes towards higher-priced Asian markets whilst back-filling their continuing needs from pipeline. As such, GALP, Gas Nat, Endesa and Iberdrola amongst others have all gained from a novel and largely unexpected c$1bn profit stream at a time when domestic profits have been under significant pressure.
Figure 69: Short supply, Pacific Basin spot pricing has sustained a marked
premium to European prices offering a $5-10/mmbtu premium since 2011
0.00
2.00
4.00
6.00
8.00
10.00
12.00
Q4 08
Q1 09
Q2 09
Q3 09
Q4 09
Q1 10
Q2 10
Q3 10
Q4 10
Q1 11
Q2 11
Q3 11
Q4 11
Q1 12
Q2 12
Q3 12
Q4 12
Q1 13
Q2 13
Q3 13
Q4 13
Q1 14
Q2 14
Q3 14
Q4 14E
$/mmbtu Delta between UK landed and Japan landed LNG price ($/mmbtu)
Shipping delta (Nigeria - UK/Japan)
Source: Deutsche Bank;
Figure 70: Short contracted supply high prices have helped the Pacific
Basin attract supply. By 2020 US un-contracted supply should end this
-10
0
10
20
30
40
50
60
70
80
2000
2001
2002
2003
2004
2005
2006
2007
2008
2009
2010
2011
2012
2013
2014
2015
2016
2017
2018
2019
2020
2021
2022
mtpaOperationalUnder ConstructionPossibleUS uncontractedUncontracted PB demand
The Pacific Basin has been short supply since 2011, high spot prices pulling volumes from the Atlantic. US build out suggests the short will be gone by 2020
Source: Deutsche Bank; WM Global LNG on-line
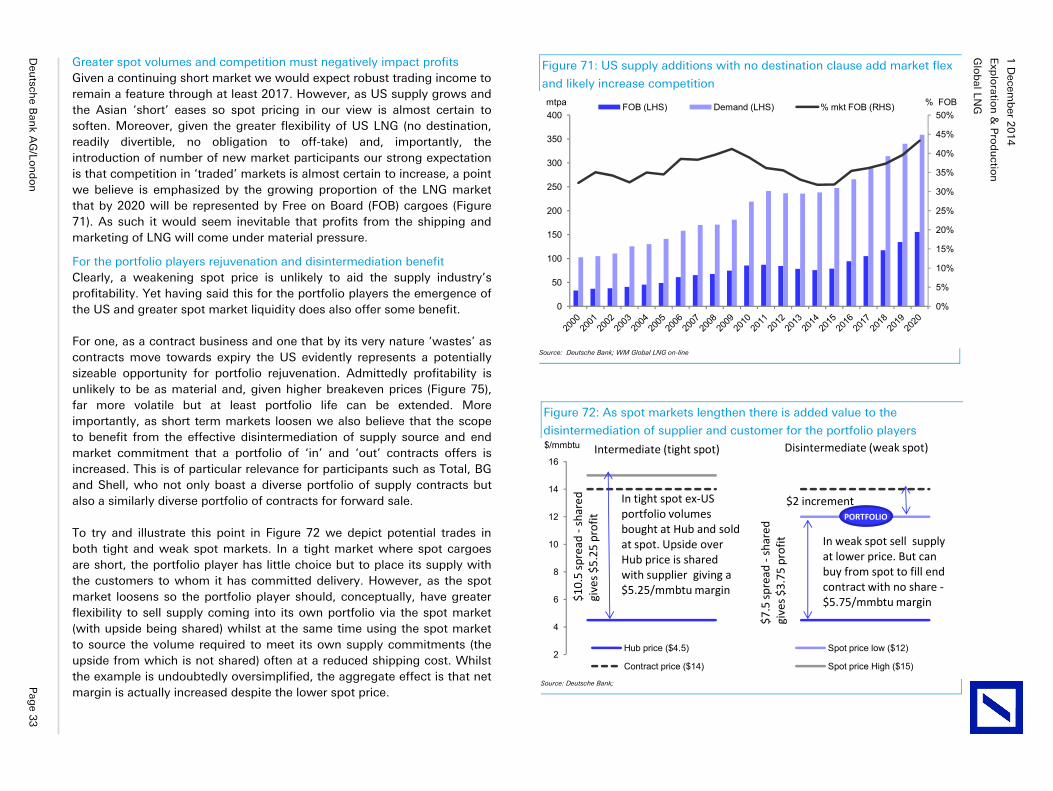
Glo
bal LN
G
Exp
loratio
n &
Pro
du
ction
1 D
ecemb
er 20
14
Deu
tsche B
ank A
G/Lo
nd
on
P
age 3
3
Greater spot volumes and competition must negatively impact profits Given a continuing short market we would expect robust trading income to remain a feature through at least 2017. However, as US supply grows and the Asian ‘short’ eases so spot pricing in our view is almost certain to soften. Moreover, given the greater flexibility of US LNG (no destination, readily divertible, no obligation to off-take) and, importantly, the introduction of number of new market participants our strong expectation is that competition in ‘traded’ markets is almost certain to increase, a point we believe is emphasized by the growing proportion of the LNG market that by 2020 will be represented by Free on Board (FOB) cargoes (Figure 71). As such it would seem inevitable that profits from the shipping and marketing of LNG will come under material pressure.
For the portfolio players rejuvenation and disintermediation benefit Clearly, a weakening spot price is unlikely to aid the supply industry’s profitability. Yet having said this for the portfolio players the emergence of the US and greater spot market liquidity does also offer some benefit.
For one, as a contract business and one that by its very nature ‘wastes’ as contracts move towards expiry the US evidently represents a potentially sizeable opportunity for portfolio rejuvenation. Admittedly profitability is unlikely to be as material and, given higher breakeven prices (Figure 75), far more volatile but at least portfolio life can be extended. More importantly, as short term markets loosen we also believe that the scope to benefit from the effective disintermediation of supply source and end market commitment that a portfolio of ‘in’ and ‘out’ contracts offers is increased. This is of particular relevance for participants such as Total, BG and Shell, who not only boast a diverse portfolio of supply contracts but also a similarly diverse portfolio of contracts for forward sale.
To try and illustrate this point in Figure 72 we depict potential trades in both tight and weak spot markets. In a tight market where spot cargoes are short, the portfolio player has little choice but to place its supply with the customers to whom it has committed delivery. However, as the spot market loosens so the portfolio player should, conceptually, have greater flexibility to sell supply coming into its own portfolio via the spot market (with upside being shared) whilst at the same time using the spot market to source the volume required to meet its own supply commitments (the upside from which is not shared) often at a reduced shipping cost. Whilst the example is undoubtedly oversimplified, the aggregate effect is that net margin is actually increased despite the lower spot price.
Figure 72: As spot markets lengthen there is added value to the
disintermediation of supplier and customer for the portfolio players
2
4
6
8
10
12
14
16
1 2 3 4 5 6 7 8 9
$/mmbtu
Hub price ($4.5) Spot price low ($12)
Contract price ($14) Spot price High ($15)
Intermediate (tight spot) Disintermediate (weak spot)
In tight spot ex-US portfolio volumes bought at Hub and sold at spot. Upside over Hub price is shared with supplier giving a $5.25/mmbtu margin
In weak spot sell supply at lower price. But can buy from spot to fill end contract with no share -$5.75/mmbtu margin$1
0.5
spre
ad -
shar
ed
give
s $5
.25
prof
it
$7.5
spr
ead
-sha
red
give
s $3
.75
prof
it
$2 incrementPORTFOLIO
Source: Deutsche Bank;
Figure 71: US supply additions with no destination clause add market flex
and likely increase competition
0%
5%
10%
15%
20%
25%
30%
35%
40%
45%
50%
0
50
100
150
200
250
300
350
400% FOBmtpa FOB (LHS) Demand (LHS) % mkt FOB (RHS)
Source: Deutsche Bank; WM Global LNG on-line
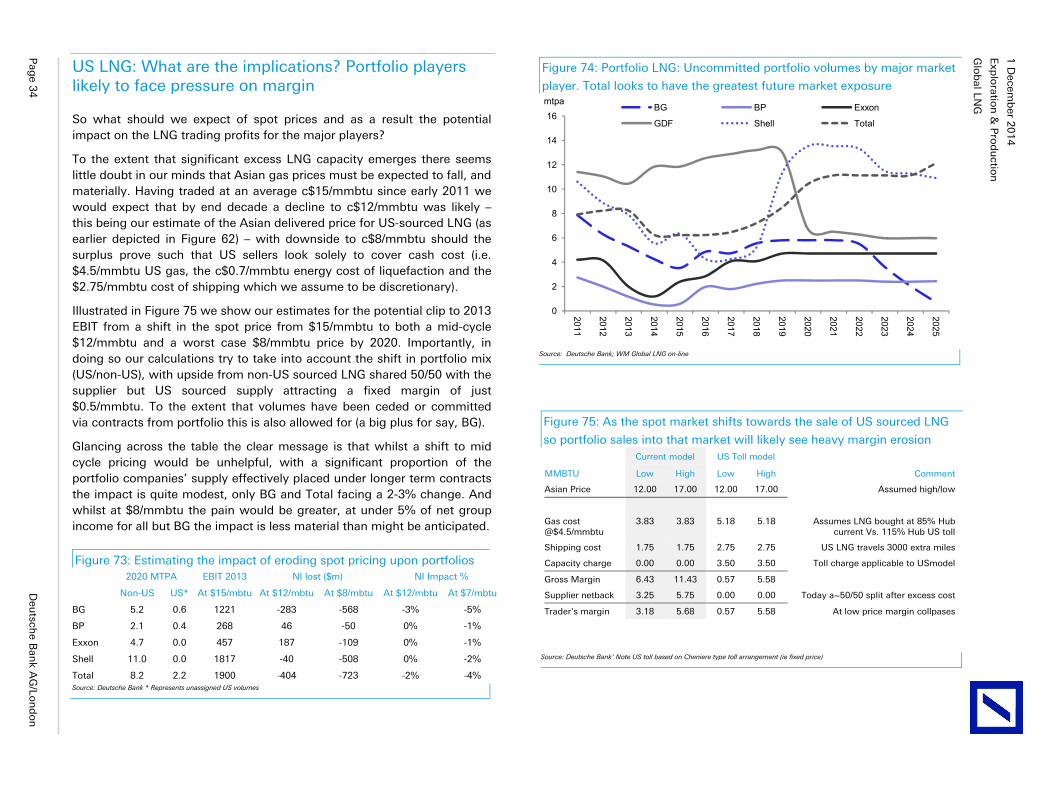
Glo
bal LN
G
Exp
loratio
n &
Pro
du
ction
1 D
ecemb
er 20
14
Pag
e 34
D
eutsch
e Ban
k AG
/Lon
do
n
US LNG: What are the implications? Portfolio players likely to face pressure on margin
So what should we expect of spot prices and as a result the potential impact on the LNG trading profits for the major players?
To the extent that significant excess LNG capacity emerges there seems little doubt in our minds that Asian gas prices must be expected to fall, and materially. Having traded at an average c$15/mmbtu since early 2011 we would expect that by end decade a decline to c$12/mmbtu was likely – this being our estimate of the Asian delivered price for US-sourced LNG (as earlier depicted in Figure 62) – with downside to c$8/mmbtu should the surplus prove such that US sellers look solely to cover cash cost (i.e. $4.5/mmbtu US gas, the c$0.7/mmbtu energy cost of liquefaction and the $2.75/mmbtu cost of shipping which we assume to be discretionary).
Illustrated in Figure 75 we show our estimates for the potential clip to 2013 EBIT from a shift in the spot price from $15/mmbtu to both a mid-cycle $12/mmbtu and a worst case $8/mmbtu price by 2020. Importantly, in doing so our calculations try to take into account the shift in portfolio mix (US/non-US), with upside from non-US sourced LNG shared 50/50 with the supplier but US sourced supply attracting a fixed margin of just $0.5/mmbtu. To the extent that volumes have been ceded or committed via contracts from portfolio this is also allowed for (a big plus for say, BG).
Glancing across the table the clear message is that whilst a shift to mid cycle pricing would be unhelpful, with a significant proportion of the portfolio companies’ supply effectively placed under longer term contracts the impact is quite modest, only BG and Total facing a 2-3% change. And whilst at $8/mmbtu the pain would be greater, at under 5% of net group income for all but BG the impact is less material than might be anticipated.
Figure 73: Estimating the impact of eroding spot pricing upon portfolios 2020 MTPA EBIT 2013 NI lost ($m) NI Impact %
Non-US US* At $15/mbtu At $12/mbtu At $8/mbtu At $12/mbtu At $7/mbtu
BG 5.2 0.6 1221 -283 -568 -3% -5%
BP 2.1 0.4 268 46 -50 0% -1%
Exxon 4.7 0.0 457 187 -109 0% -1%
Shell 11.0 0.0 1817 -40 -508 0% -2%
Total 8.2 2.2 1900 -404 -723 -2% -4% Source: Deutsche Bank * Represents unassigned US volumes
Figure 75: As the spot market shifts towards the sale of US sourced LNG
so portfolio sales into that market will likely see heavy margin erosion Current model US Toll model
MMBTU Low High Low High Comment
Asian Price 12.00 17.00 12.00 17.00 Assumed high/low
Gas cost @$4.5/mmbtu
3.83 3.83 5.18 5.18 Assumes LNG bought at 85% Hub current Vs. 115% Hub US toll
Shipping cost 1.75 1.75 2.75 2.75 US LNG travels 3000 extra miles
Capacity charge 0.00 0.00 3.50 3.50 Toll charge applicable to USmodel
Gross Margin 6.43 11.43 0.57 5.58
Supplier netback 3.25 5.75 0.00 0.00 Today a~50/50 split after excess cost
Trader's margin 3.18 5.68 0.57 5.58 At low price margin collpases
Source: Deutsche Bank’ Note US toll based on Cheniere type toll arrangement (ie fixed price)
Figure 74: Portfolio LNG: Uncommitted portfolio volumes by major market
player. Total looks to have the greatest future market exposure
0
2
4
6
8
10
12
14
16
2011
2012
2013
2014
2015
2016
2017
2018
2019
2020
2021
2022
2023
2024
2025
mtpaBG BP Exxon
GDF Shell Total
Source: Deutsche Bank; WM Global LNG on-line
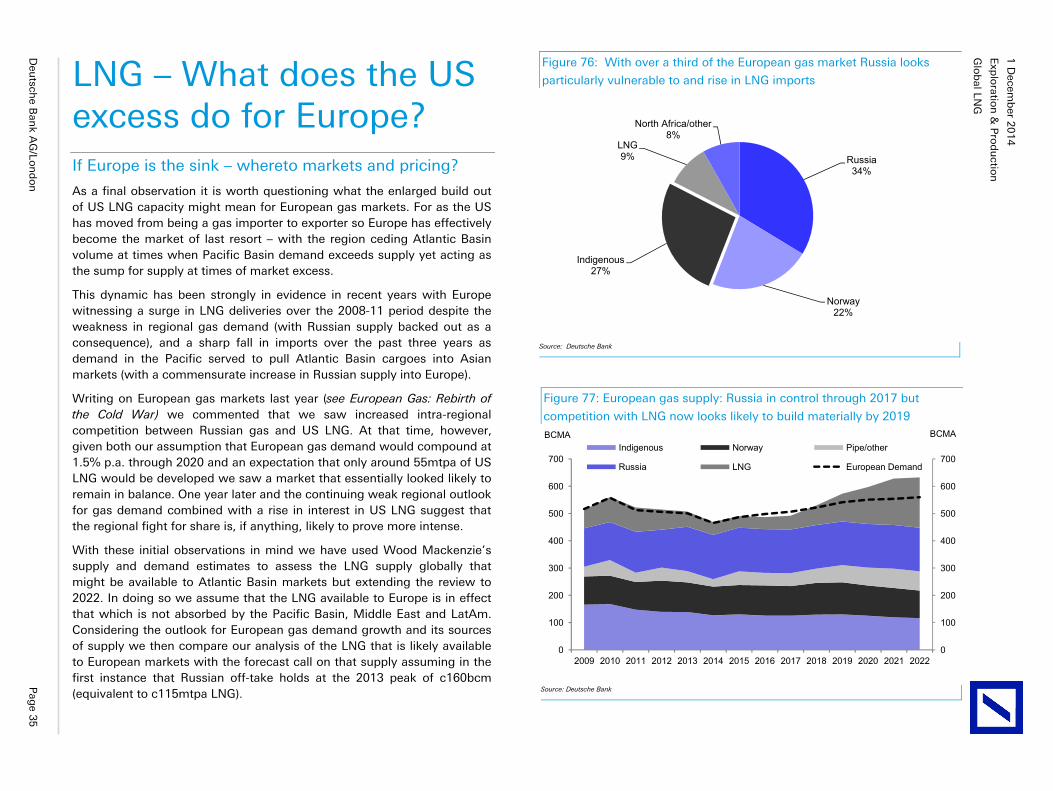
Glo
bal LN
G
Exp
loratio
n &
Pro
du
ction
1 D
ecemb
er 20
14
Deu
tsche B
ank A
G/Lo
nd
on
P
age 3
5
LNG – What does the US excess do for Europe? If Europe is the sink – whereto markets and pricing?
As a final observation it is worth questioning what the enlarged build out of US LNG capacity might mean for European gas markets. For as the US has moved from being a gas importer to exporter so Europe has effectively become the market of last resort – with the region ceding Atlantic Basin volume at times when Pacific Basin demand exceeds supply yet acting as the sump for supply at times of market excess.
This dynamic has been strongly in evidence in recent years with Europe witnessing a surge in LNG deliveries over the 2008-11 period despite the weakness in regional gas demand (with Russian supply backed out as a consequence), and a sharp fall in imports over the past three years as demand in the Pacific served to pull Atlantic Basin cargoes into Asian markets (with a commensurate increase in Russian supply into Europe).
Writing on European gas markets last year (see European Gas: Rebirth of the Cold War) we commented that we saw increased intra-regional competition between Russian gas and US LNG. At that time, however, given both our assumption that European gas demand would compound at 1.5% p.a. through 2020 and an expectation that only around 55mtpa of US LNG would be developed we saw a market that essentially looked likely to remain in balance. One year later and the continuing weak regional outlook for gas demand combined with a rise in interest in US LNG suggest that the regional fight for share is, if anything, likely to prove more intense.
With these initial observations in mind we have used Wood Mackenzie’s supply and demand estimates to assess the LNG supply globally that might be available to Atlantic Basin markets but extending the review to 2022. In doing so we assume that the LNG available to Europe is in effect that which is not absorbed by the Pacific Basin, Middle East and LatAm. Considering the outlook for European gas demand growth and its sources of supply we then compare our analysis of the LNG that is likely available to European markets with the forecast call on that supply assuming in the first instance that Russian off-take holds at the 2013 peak of c160bcm (equivalent to c115mtpa LNG).
Figure 77: European gas supply: Russia in control through 2017 but
competition with LNG now looks likely to build materially by 2019
0
100
200
300
400
500
600
700
0
100
200
300
400
500
600
700
2009 2010 2011 2012 2013 2014 2015 2016 2017 2018 2019 2020 2021 2022
BCMABCMAIndigenous Norway Pipe/other
Russia LNG European Demand
Source: Deutsche Bank
Figure 76: With over a third of the European gas market Russia looks
particularly vulnerable to and rise in LNG imports
Russia34%
Norway22%
Indigenous27%
LNG9%
North Africa/other8%
Source: Deutsche Bank
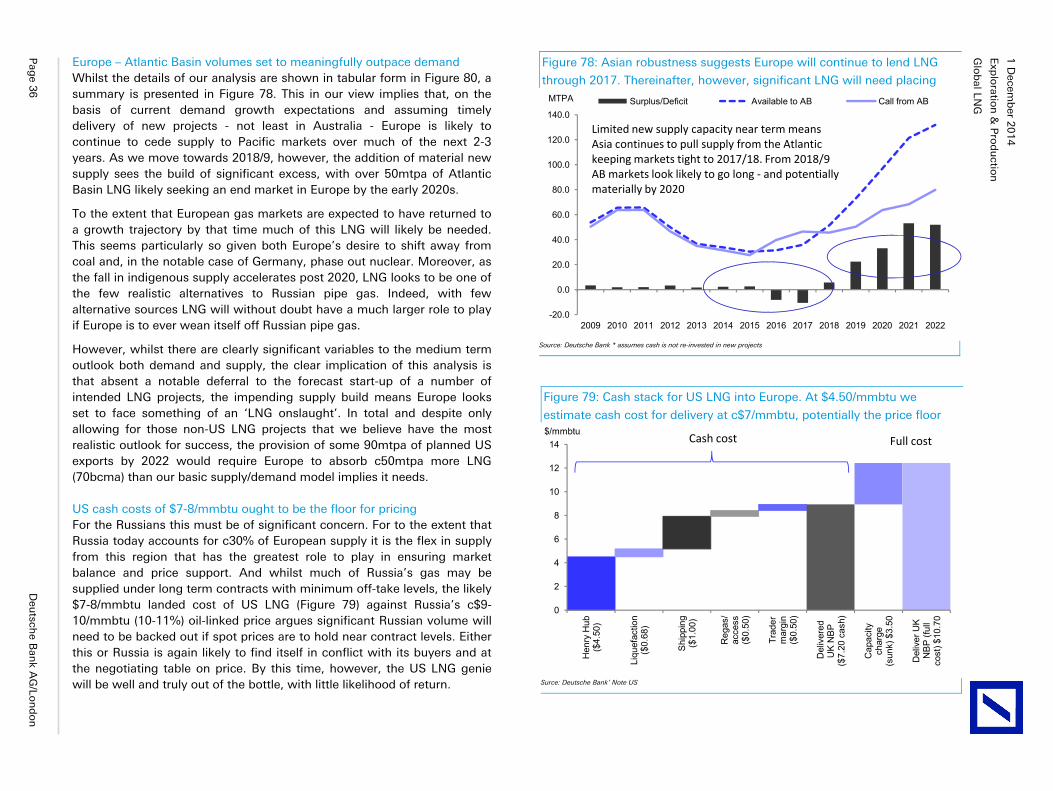
Glo
bal LN
G
Exp
loratio
n &
Pro
du
ction
1 D
ecemb
er 20
14
Pag
e 36
D
eutsch
e Ban
k AG
/Lon
do
n
Europe – Atlantic Basin volumes set to meaningfully outpace demand Whilst the details of our analysis are shown in tabular form in Figure 80, a summary is presented in Figure 78. This in our view implies that, on the basis of current demand growth expectations and assuming timely delivery of new projects - not least in Australia - Europe is likely to continue to cede supply to Pacific markets over much of the next 2-3 years. As we move towards 2018/9, however, the addition of material new supply sees the build of significant excess, with over 50mtpa of Atlantic Basin LNG likely seeking an end market in Europe by the early 2020s.
To the extent that European gas markets are expected to have returned to a growth trajectory by that time much of this LNG will likely be needed. This seems particularly so given both Europe’s desire to shift away from coal and, in the notable case of Germany, phase out nuclear. Moreover, as the fall in indigenous supply accelerates post 2020, LNG looks to be one of the few realistic alternatives to Russian pipe gas. Indeed, with few alternative sources LNG will without doubt have a much larger role to play if Europe is to ever wean itself off Russian pipe gas.
However, whilst there are clearly significant variables to the medium term outlook both demand and supply, the clear implication of this analysis is that absent a notable deferral to the forecast start-up of a number of intended LNG projects, the impending supply build means Europe looks set to face something of an ‘LNG onslaught’. In total and despite only allowing for those non-US LNG projects that we believe have the most realistic outlook for success, the provision of some 90mtpa of planned US exports by 2022 would require Europe to absorb c50mtpa more LNG (70bcma) than our basic supply/demand model implies it needs.
US cash costs of $7-8/mmbtu ought to be the floor for pricing For the Russians this must be of significant concern. For to the extent that Russia today accounts for c30% of European supply it is the flex in supply from this region that has the greatest role to play in ensuring market balance and price support. And whilst much of Russia’s gas may be supplied under long term contracts with minimum off-take levels, the likely $7-8/mmbtu landed cost of US LNG (Figure 79) against Russia’s c$9-10/mmbtu (10-11%) oil-linked price argues significant Russian volume will need to be backed out if spot prices are to hold near contract levels. Either this or Russia is again likely to find itself in conflict with its buyers and at the negotiating table on price. By this time, however, the US LNG genie will be well and truly out of the bottle, with little likelihood of return.
Figure 79: Cash stack for US LNG into Europe. At $4.50/mmbtu we
estimate cash cost for delivery at c$7/mmbtu, potentially the price floor
0
2
4
6
8
10
12
14
Hen
ry H
ub
($4.
50)
Liqu
efac
tion
($0.
68)
Shi
ppin
g ($
1.00
)
Reg
as/
acce
ss
($0.
50)
Trad
er
mar
gin
($0.
50)
Del
iver
ed
UK
NB
P
($7.
20 c
ash)
Cap
acity
ch
arge
(s
unk)
$3.
50
Del
iver
UK
N
BP
(ful
l co
st) $
10.7
0
$/mmbtuCash cost Full cost
Surce: Deutsche Bank’ Note US
Figure 78: Asian robustness suggests Europe will continue to lend LNG
through 2017. Thereinafter, however, significant LNG will need placing
-20.0
0.0
20.0
40.0
60.0
80.0
100.0
120.0
140.0
2009 2010 2011 2012 2013 2014 2015 2016 2017 2018 2019 2020 2021 2022
MTPA Surplus/Deficit Available to AB Call from AB
Limited new supply capacity near term means Asia continues to pull supply from the Atlantickeeping markets tight to 2017/18. From 2018/9 AB markets look likely to go long - and potentially materially by 2020
Source: Deutsche Bank * assumes cash is not re-invested in new projects
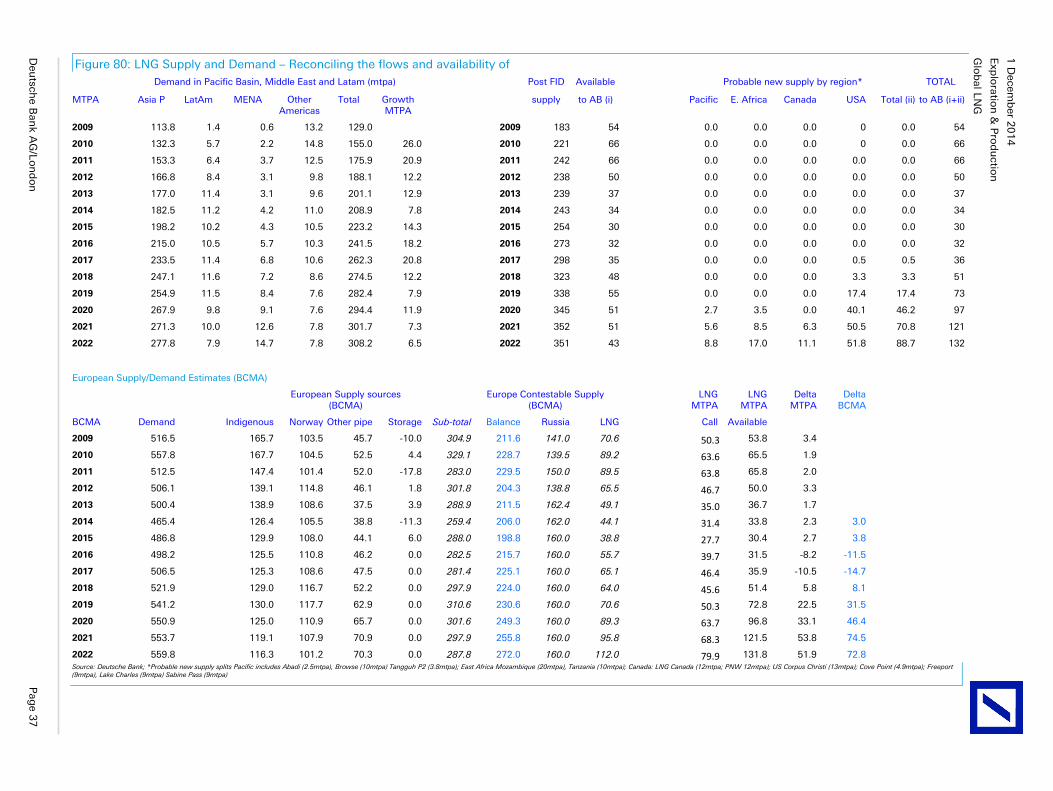
Glo
bal LN
G
Exp
loratio
n &
Pro
du
ction
1 D
ecemb
er 20
14
Deu
tsche B
ank A
G/Lo
nd
on
P
age 3
7
Figure 80: LNG Supply and Demand – Reconciling the flows and availability of Demand in Pacific Basin, Middle East and Latam (mtpa) Post FID Available Probable new supply by region* TOTAL
MTPA Asia P LatAm MENA Other Americas
Total GrowthMTPA
supply to AB (i) Pacific E. Africa Canada USA Total (ii) to AB (i+ii)
2009 113.8 1.4 0.6 13.2 129.0 2009 183 54 0.0 0.0 0.0 0 0.0 54
2010 132.3 5.7 2.2 14.8 155.0 26.0 2010 221 66 0.0 0.0 0.0 0 0.0 66
2011 153.3 6.4 3.7 12.5 175.9 20.9 2011 242 66 0.0 0.0 0.0 0.0 0.0 66
2012 166.8 8.4 3.1 9.8 188.1 12.2 2012 238 50 0.0 0.0 0.0 0.0 0.0 50
2013 177.0 11.4 3.1 9.6 201.1 12.9 2013 239 37 0.0 0.0 0.0 0.0 0.0 37
2014 182.5 11.2 4.2 11.0 208.9 7.8 2014 243 34 0.0 0.0 0.0 0.0 0.0 34
2015 198.2 10.2 4.3 10.5 223.2 14.3 2015 254 30 0.0 0.0 0.0 0.0 0.0 30
2016 215.0 10.5 5.7 10.3 241.5 18.2 2016 273 32 0.0 0.0 0.0 0.0 0.0 32
2017 233.5 11.4 6.8 10.6 262.3 20.8 2017 298 35 0.0 0.0 0.0 0.5 0.5 36
2018 247.1 11.6 7.2 8.6 274.5 12.2 2018 323 48 0.0 0.0 0.0 3.3 3.3 51
2019 254.9 11.5 8.4 7.6 282.4 7.9 2019 338 55 0.0 0.0 0.0 17.4 17.4 73
2020 267.9 9.8 9.1 7.6 294.4 11.9 2020 345 51 2.7 3.5 0.0 40.1 46.2 97
2021 271.3 10.0 12.6 7.8 301.7 7.3 2021 352 51 5.6 8.5 6.3 50.5 70.8 121
2022 277.8 7.9 14.7 7.8 308.2 6.5 2022 351 43 8.8 17.0 11.1 51.8 88.7 132
European Supply/Demand Estimates (BCMA)
European Supply sources (BCMA)
Europe Contestable Supply (BCMA)
LNGMTPA
LNGMTPA
DeltaMTPA
Delta BCMA
BCMA Demand Indigenous Norway Other pipe Storage Sub-total Balance Russia LNG Call Available
2009 516.5 165.7 103.5 45.7 -10.0 304.9 211.6 141.0 70.6 50.3 53.8 3.4
2010 557.8 167.7 104.5 52.5 4.4 329.1 228.7 139.5 89.2 63.6 65.5 1.9
2011 512.5 147.4 101.4 52.0 -17.8 283.0 229.5 150.0 89.5 63.8 65.8 2.0
2012 506.1 139.1 114.8 46.1 1.8 301.8 204.3 138.8 65.5 46.7 50.0 3.3
2013 500.4 138.9 108.6 37.5 3.9 288.9 211.5 162.4 49.1 35.0 36.7 1.7
2014 465.4 126.4 105.5 38.8 -11.3 259.4 206.0 162.0 44.1 31.4 33.8 2.3 3.0
2015 486.8 129.9 108.0 44.1 6.0 288.0 198.8 160.0 38.8 27.7 30.4 2.7 3.8
2016 498.2 125.5 110.8 46.2 0.0 282.5 215.7 160.0 55.7 39.7 31.5 -8.2 -11.5
2017 506.5 125.3 108.6 47.5 0.0 281.4 225.1 160.0 65.1 46.4 35.9 -10.5 -14.7
2018 521.9 129.0 116.7 52.2 0.0 297.9 224.0 160.0 64.0 45.6 51.4 5.8 8.1
2019 541.2 130.0 117.7 62.9 0.0 310.6 230.6 160.0 70.6 50.3 72.8 22.5 31.5
2020 550.9 125.0 110.9 65.7 0.0 301.6 249.3 160.0 89.3 63.7 96.8 33.1 46.4
2021 553.7 119.1 107.9 70.9 0.0 297.9 255.8 160.0 95.8 68.3 121.5 53.8 74.5
2022 559.8 116.3 101.2 70.3 0.0 287.8 272.0 160.0 112.0 79.9 131.8 51.9 72.8 Source: Deutsche Bank; *Probable new supply splits Pacific includes Abadi (2.5mtpa), Browse (10mtpa) Tangguh P2 (3.8mtpa); East Africa Mozambique (20mtpa), Tanzania (10mtpa); Canada: LNG Canada (12mtpa; PNW 12mtpa); US Corpus Christi (13mtpa); Cove Point (4.9mtpa); Freeport (9mtpa), Lake Charles (9mtpa) Sabine Pass (9mtpa)
Glo
bal LN
G
Exp
loratio
n &
Pro
du
ction
1 D
ecemb
er 20
14
Pag
e 38
D
eutsch
e Ban
k AG
/Lon
do
n
Appendix A: The major IOC participants
The companies in profile – who has what?
BG Group
BP
Chevron
ENI
ExxonMobil
Royal Dutch Shell
Total
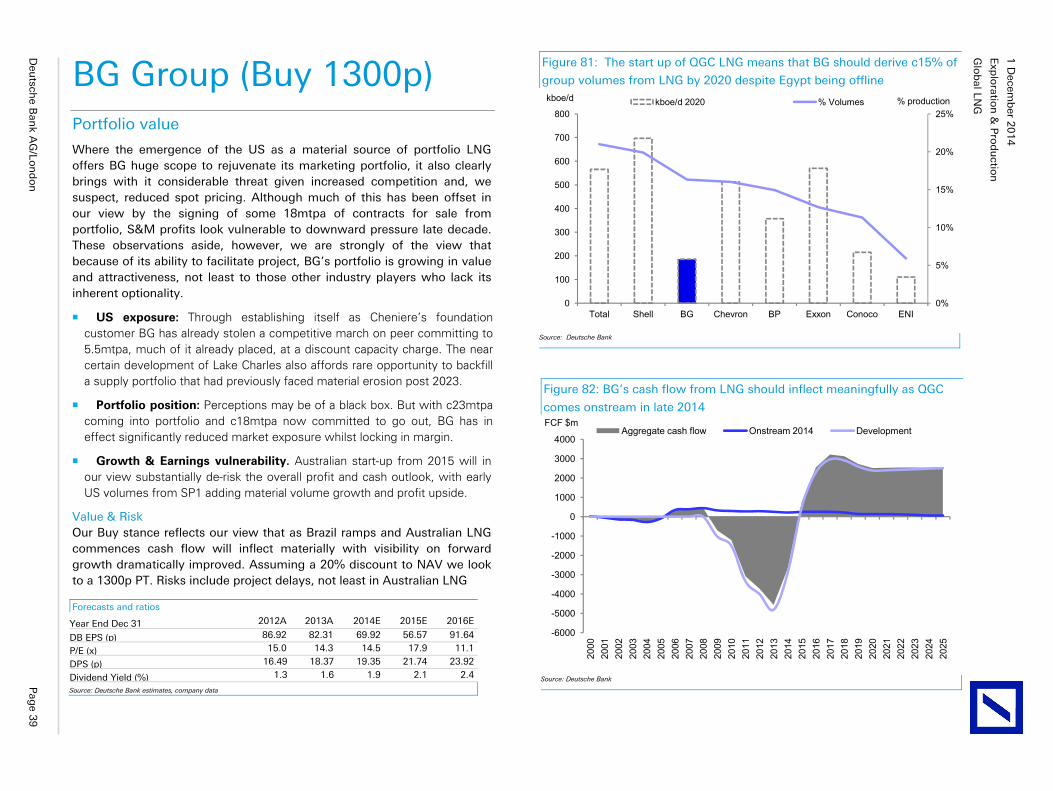
Glo
bal LN
G
Exp
loratio
n &
Pro
du
ction
1 D
ecemb
er 20
14
Deu
tsche B
ank A
G/Lo
nd
on
P
age 3
9
BG Group (Buy 1300p) Portfolio value
Where the emergence of the US as a material source of portfolio LNG offers BG huge scope to rejuvenate its marketing portfolio, it also clearly brings with it considerable threat given increased competition and, we suspect, reduced spot pricing. Although much of this has been offset in our view by the signing of some 18mtpa of contracts for sale from portfolio, S&M profits look vulnerable to downward pressure late decade. These observations aside, however, we are strongly of the view that because of its ability to facilitate project, BG’s portfolio is growing in value and attractiveness, not least to those other industry players who lack its inherent optionality.
US exposure: Through establishing itself as Cheniere’s foundation customer BG has already stolen a competitive march on peer committing to 5.5mtpa, much of it already placed, at a discount capacity charge. The near certain development of Lake Charles also affords rare opportunity to backfill a supply portfolio that had previously faced material erosion post 2023.
Portfolio position: Perceptions may be of a black box. But with c23mtpa coming into portfolio and c18mtpa now committed to go out, BG has in effect significantly reduced market exposure whilst locking in margin.
Growth & Earnings vulnerability. Australian start-up from 2015 will in our view substantially de-risk the overall profit and cash outlook, with early US volumes from SP1 adding material volume growth and profit upside.
Value & Risk Our Buy stance reflects our view that as Brazil ramps and Australian LNG commences cash flow will inflect materially with visibility on forward growth dramatically improved. Assuming a 20% discount to NAV we look to a 1300p PT. Risks include project delays, not least in Australian LNG
Figure 82: BG’s cash flow from LNG should inflect meaningfully as QGC
comes onstream in late 2014
-6000
-5000
-4000
-3000
-2000
-1000
0
1000
2000
3000
4000
2000
2001
2002
2003
2004
2005
2006
2007
2008
2009
2010
2011
2012
2013
2014
2015
2016
2017
2018
2019
2020
2021
2022
2023
2024
2025
FCF $mAggregate cash flow Onstream 2014 Development
Source: Deutsche Bank
Forecasts and ratios
Year End Dec 31 2012A 2013A 2014E 2015E 2016E
DB EPS (p) 86.92 82.31 69.92 56.57 91.64
P/E (x) 15.0 14.3 14.5 17.9 11.1
DPS (p) 16.49 18.37 19.35 21.74 23.92
Dividend Yield (%) 1.3 1.6 1.9 2.1 2.4
Source: Deutsche Bank estimates, company data
Figure 81: The start up of QGC LNG means that BG should derive c15% of
group volumes from LNG by 2020 despite Egypt being offline
0%
5%
10%
15%
20%
25%
0
100
200
300
400
500
600
700
800
Total Shell BG Chevron BP Exxon Conoco ENI
% productionkboe/d kboe/d 2020 % Volumes
Source: Deutsche Bank
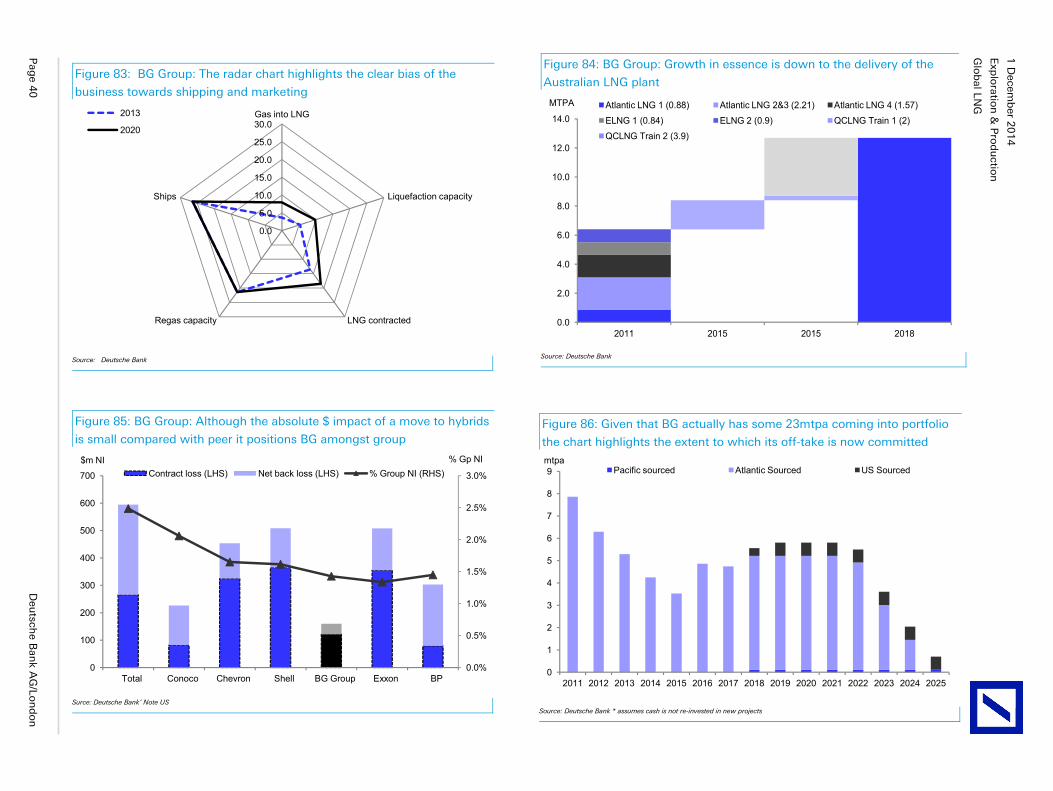
Glo
bal LN
G
Exp
loratio
n &
Pro
du
ction
1 D
ecemb
er 20
14
Pag
e 40
D
eutsch
e Ban
k AG
/Lon
do
n
Figure 84: BG Group: Growth in essence is down to the delivery of the
Australian LNG plant
0.0
2.0
4.0
6.0
8.0
10.0
12.0
14.0
2011 2015 2015 2018
MTPA Atlantic LNG 1 (0.88) Atlantic LNG 2&3 (2.21) Atlantic LNG 4 (1.57)ELNG 1 (0.84) ELNG 2 (0.9) QCLNG Train 1 (2)QCLNG Train 2 (3.9)
Source: Deutsche Bank
Figure 83: BG Group: The radar chart highlights the clear bias of the
business towards shipping and marketing
0.0
5.0
10.0
15.0
20.0
25.0
30.0Gas into LNG
Liquefaction capacity
LNG contractedRegas capacity
Ships
2013
2020
Source: Deutsche Bank
Figure 85: BG Group: Although the absolute $ impact of a move to hybrids
is small compared with peer it positions BG amongst group
0.0%
0.5%
1.0%
1.5%
2.0%
2.5%
3.0%
0
100
200
300
400
500
600
700
Total Conoco Chevron Shell BG Group Exxon BP
% Gp NI$m NIContract loss (LHS) Net back loss (LHS) % Group NI (RHS)
Surce: Deutsche Bank’ Note US
Figure 86: Given that BG actually has some 23mtpa coming into portfolio
the chart highlights the extent to which its off-take is now committed
0
1
2
3
4
5
6
7
8
9
2011 2012 2013 2014 2015 2016 2017 2018 2019 2020 2021 2022 2023 2024 2025
mtpaPacific sourced Atlantic Sourced US Sourced
Source: Deutsche Bank * assumes cash is not re-invested in new projects
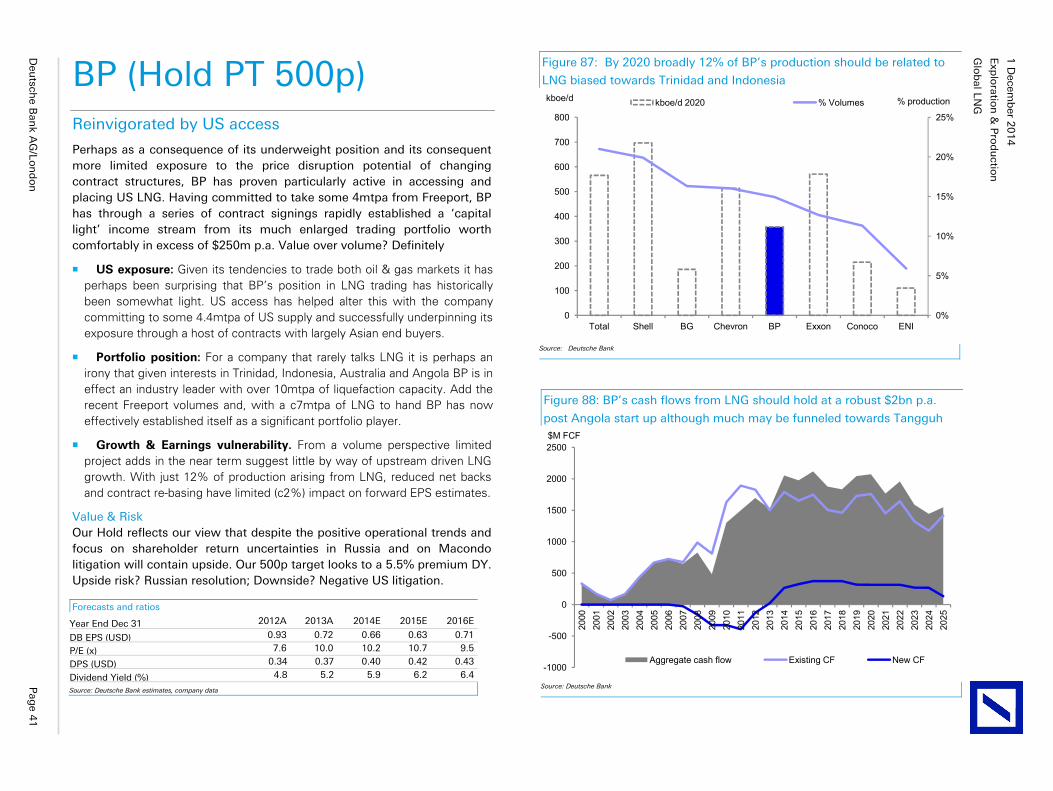
Glo
bal LN
G
Exp
loratio
n &
Pro
du
ction
1 D
ecemb
er 20
14
Deu
tsche B
ank A
G/Lo
nd
on
P
age 4
1
BP (Hold PT 500p) Reinvigorated by US access
Perhaps as a consequence of its underweight position and its consequent more limited exposure to the price disruption potential of changing contract structures, BP has proven particularly active in accessing and placing US LNG. Having committed to take some 4mtpa from Freeport, BP has through a series of contract signings rapidly established a ‘capital light’ income stream from its much enlarged trading portfolio worth comfortably in excess of $250m p.a. Value over volume? Definitely
US exposure: Given its tendencies to trade both oil & gas markets it has perhaps been surprising that BP’s position in LNG trading has historically been somewhat light. US access has helped alter this with the company committing to some 4.4mtpa of US supply and successfully underpinning its exposure through a host of contracts with largely Asian end buyers.
Portfolio position: For a company that rarely talks LNG it is perhaps an irony that given interests in Trinidad, Indonesia, Australia and Angola BP is in effect an industry leader with over 10mtpa of liquefaction capacity. Add the recent Freeport volumes and, with a c7mtpa of LNG to hand BP has now effectively established itself as a significant portfolio player.
Growth & Earnings vulnerability. From a volume perspective limited project adds in the near term suggest little by way of upstream driven LNG growth. With just 12% of production arising from LNG, reduced net backs and contract re-basing have limited (c2%) impact on forward EPS estimates.
Value & Risk Our Hold reflects our view that despite the positive operational trends and focus on shareholder return uncertainties in Russia and on Macondo litigation will contain upside. Our 500p target looks to a 5.5% premium DY. Upside risk? Russian resolution; Downside? Negative US litigation.
Figure 88: BP’s cash flows from LNG should hold at a robust $2bn p.a.
post Angola start up although much may be funneled towards Tangguh
-1000
-500
0
500
1000
1500
2000
2500
2000
2001
2002
2003
2004
2005
2006
2007
2008
2009
2010
2011
2012
2013
2014
2015
2016
2017
2018
2019
2020
2021
2022
2023
2024
2025
$M FCF
Aggregate cash flow Existing CF New CF
Source: Deutsche Bank
Forecasts and ratios
Year End Dec 31 2012A 2013A 2014E 2015E 2016E
DB EPS (USD) 0.93 0.72 0.66 0.63 0.71
P/E (x) 7.6 10.0 10.2 10.7 9.5
DPS (USD) 0.34 0.37 0.40 0.42 0.43
Dividend Yield (%) 4.8 5.2 5.9 6.2 6.4
Source: Deutsche Bank estimates, company data
Figure 87: By 2020 broadly 12% of BP’s production should be related to
LNG biased towards Trinidad and Indonesia
0%
5%
10%
15%
20%
25%
0
100
200
300
400
500
600
700
800
Total Shell BG Chevron BP Exxon Conoco ENI
% productionkboe/d kboe/d 2020 % Volumes
Source: Deutsche Bank
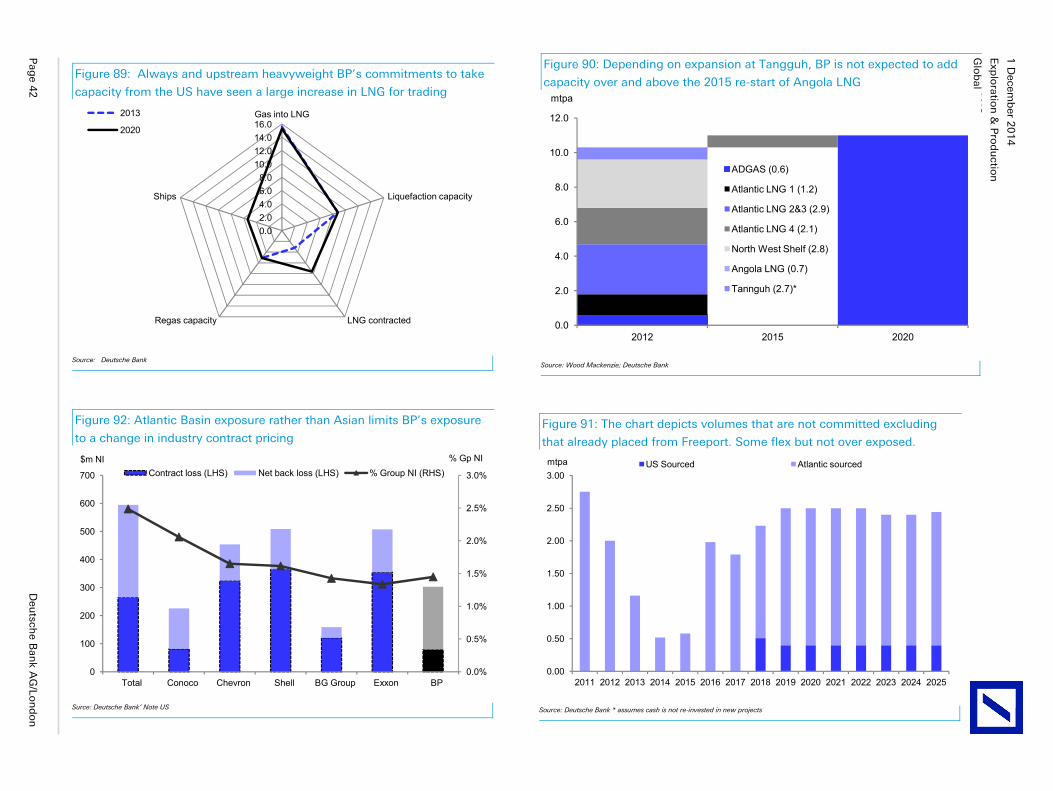
Glo
bal LN
G
Exp
loratio
n &
Pro
du
ction
1 D
ecemb
er 20
14
Pag
e 42
D
eutsch
e Ban
k AG
/Lon
do
n
Figure 90: Depending on expansion at Tangguh, BP is not expected to add
capacity over and above the 2015 re-start of Angola LNG
0.0
2.0
4.0
6.0
8.0
10.0
12.0
2012 2015 2020
mtpa
ADGAS (0.6)
Atlantic LNG 1 (1.2)
Atlantic LNG 2&3 (2.9)
Atlantic LNG 4 (2.1)
North West Shelf (2.8)
Angola LNG (0.7)
Tannguh (2.7)*
Source: Wood Mackenzie; Deutsche Bank
Figure 89: Always and upstream heavyweight BP’s commitments to take
capacity from the US have seen a large increase in LNG for trading
0.02.04.06.08.0
10.012.014.016.0Gas into LNG
Liquefaction capacity
LNG contractedRegas capacity
Ships
2013
2020
Source: Deutsche Bank
Figure 91: The chart depicts volumes that are not committed excluding
that already placed from Freeport. Some flex but not over exposed.
0.00
0.50
1.00
1.50
2.00
2.50
3.00
2011 2012 2013 2014 2015 2016 2017 2018 2019 2020 2021 2022 2023 2024 2025
mtpa US Sourced Atlantic sourced
Source: Deutsche Bank * assumes cash is not re-invested in new projects
Figure 92: Atlantic Basin exposure rather than Asian limits BP’s exposure
to a change in industry contract pricing
0.0%
0.5%
1.0%
1.5%
2.0%
2.5%
3.0%
0
100
200
300
400
500
600
700
Total Conoco Chevron Shell BG Group Exxon BP
% Gp NI$m NIContract loss (LHS) Net back loss (LHS) % Group NI (RHS)
Surce: Deutsche Bank’ Note US
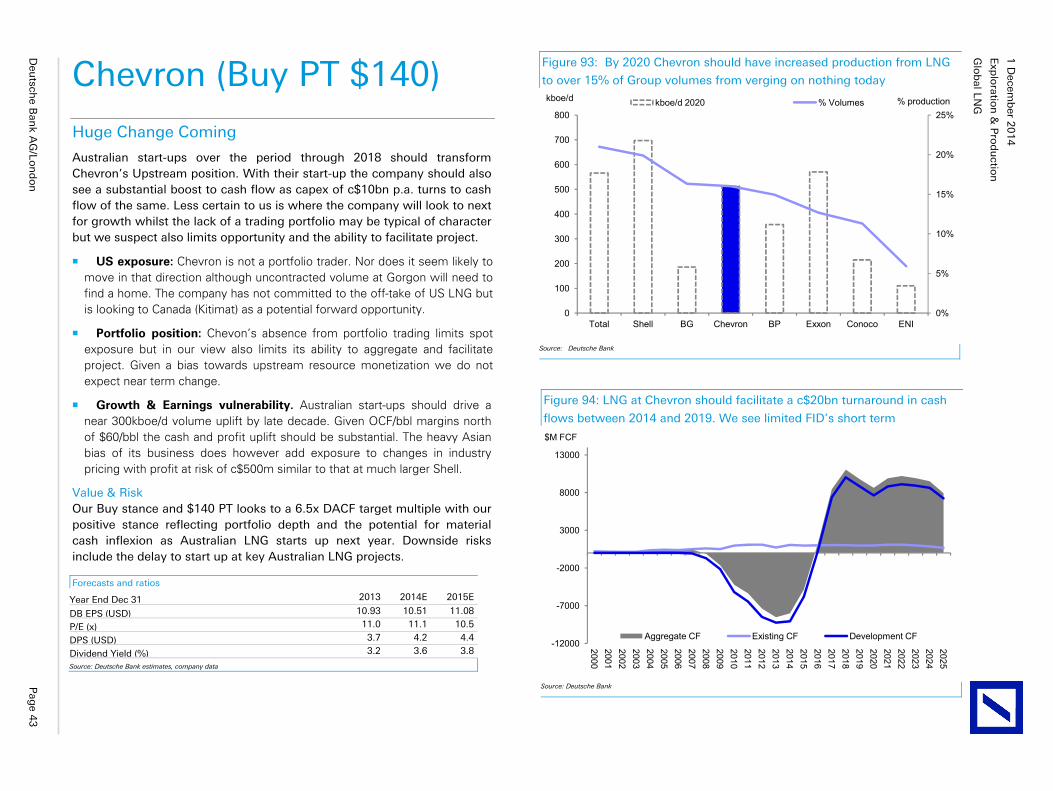
Glo
bal LN
G
Exp
loratio
n &
Pro
du
ction
1 D
ecemb
er 20
14
Deu
tsche B
ank A
G/Lo
nd
on
P
age 4
3
Chevron (Buy PT $140)
Huge Change Coming
Australian start-ups over the period through 2018 should transform Chevron’s Upstream position. With their start-up the company should also see a substantial boost to cash flow as capex of c$10bn p.a. turns to cash flow of the same. Less certain to us is where the company will look to next for growth whilst the lack of a trading portfolio may be typical of character but we suspect also limits opportunity and the ability to facilitate project.
US exposure: Chevron is not a portfolio trader. Nor does it seem likely to move in that direction although uncontracted volume at Gorgon will need to find a home. The company has not committed to the off-take of US LNG but is looking to Canada (Kitimat) as a potential forward opportunity.
Portfolio position: Chevon’s absence from portfolio trading limits spot exposure but in our view also limits its ability to aggregate and facilitate project. Given a bias towards upstream resource monetization we do not expect near term change.
Growth & Earnings vulnerability. Australian start-ups should drive a near 300kboe/d volume uplift by late decade. Given OCF/bbl margins north of $60/bbl the cash and profit uplift should be substantial. The heavy Asian bias of its business does however add exposure to changes in industry pricing with profit at risk of c$500m similar to that at much larger Shell.
Value & Risk Our Buy stance and $140 PT looks to a 6.5x DACF target multiple with our positive stance reflecting portfolio depth and the potential for material cash inflexion as Australian LNG starts up next year. Downside risks include the delay to start up at key Australian LNG projects.
Figure 94: LNG at Chevron should facilitate a c$20bn turnaround in cash
flows between 2014 and 2019. We see limited FID’s short term
-12000
-7000
-2000
3000
8000
1300020002001200220032004200520062007200820092010201120122013201420152016201720182019202020212022202320242025
$M FCF
Aggregate CF Existing CF Development CF
Source: Deutsche Bank
Forecasts and ratios
Year End Dec 31 2013 2014E 2015E
DB EPS (USD) 10.93 10.51 11.08
P/E (x) 11.0 11.1 10.5
DPS (USD) 3.7 4.2 4.4
Dividend Yield (%) 3.2 3.6 3.8
Source: Deutsche Bank estimates, company data
Figure 93: By 2020 Chevron should have increased production from LNG
to over 15% of Group volumes from verging on nothing today
0%
5%
10%
15%
20%
25%
0
100
200
300
400
500
600
700
800
Total Shell BG Chevron BP Exxon Conoco ENI
% productionkboe/d kboe/d 2020 % Volumes
Source: Deutsche Bank
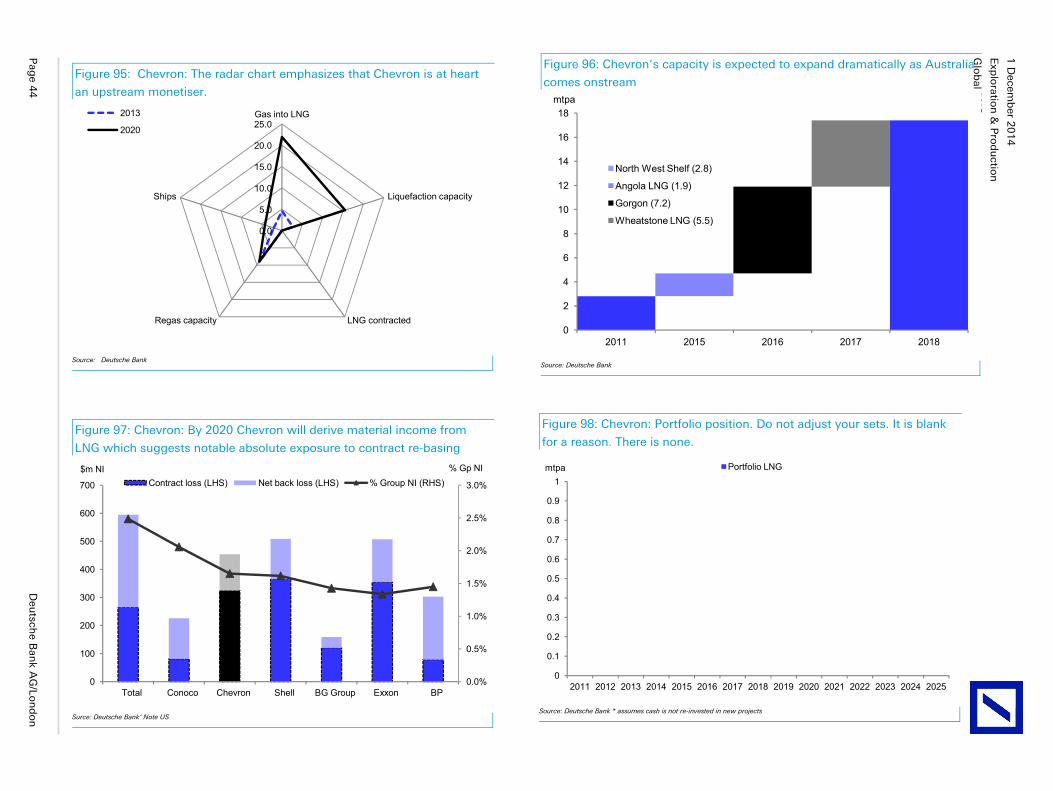
Glo
bal LN
G
Exp
loratio
n &
Pro
du
ction
1 D
ecemb
er 20
14
Pag
e 44
D
eutsch
e Ban
k AG
/Lon
do
n
Figure 96: Chevron’s capacity is expected to expand dramatically as Australia
comes onstream
0
2
4
6
8
10
12
14
16
18
2011 2015 2016 2017 2018
mtpa
North West Shelf (2.8)
Angola LNG (1.9)
Gorgon (7.2)
Wheatstone LNG (5.5)
Source: Deutsche Bank
Figure 95: Chevron: The radar chart emphasizes that Chevron is at heart
an upstream monetiser.
0.0
5.0
10.0
15.0
20.0
25.0Gas into LNG
Liquefaction capacity
LNG contractedRegas capacity
Ships
2013
2020
Source: Deutsche Bank
Figure 97: Chevron: By 2020 Chevron will derive material income from
LNG which suggests notable absolute exposure to contract re-basing
0.0%
0.5%
1.0%
1.5%
2.0%
2.5%
3.0%
0
100
200
300
400
500
600
700
Total Conoco Chevron Shell BG Group Exxon BP
% Gp NI$m NIContract loss (LHS) Net back loss (LHS) % Group NI (RHS)
Surce: Deutsche Bank’ Note US
Figure 98: Chevron: Portfolio position. Do not adjust your sets. It is blank
for a reason. There is none.
0
0.1
0.2
0.3
0.4
0.5
0.6
0.7
0.8
0.9
1
2011 2012 2013 2014 2015 2016 2017 2018 2019 2020 2021 2022 2023 2024 2025
mtpa Portfolio LNG
Source: Deutsche Bank * assumes cash is not re-invested in new projects
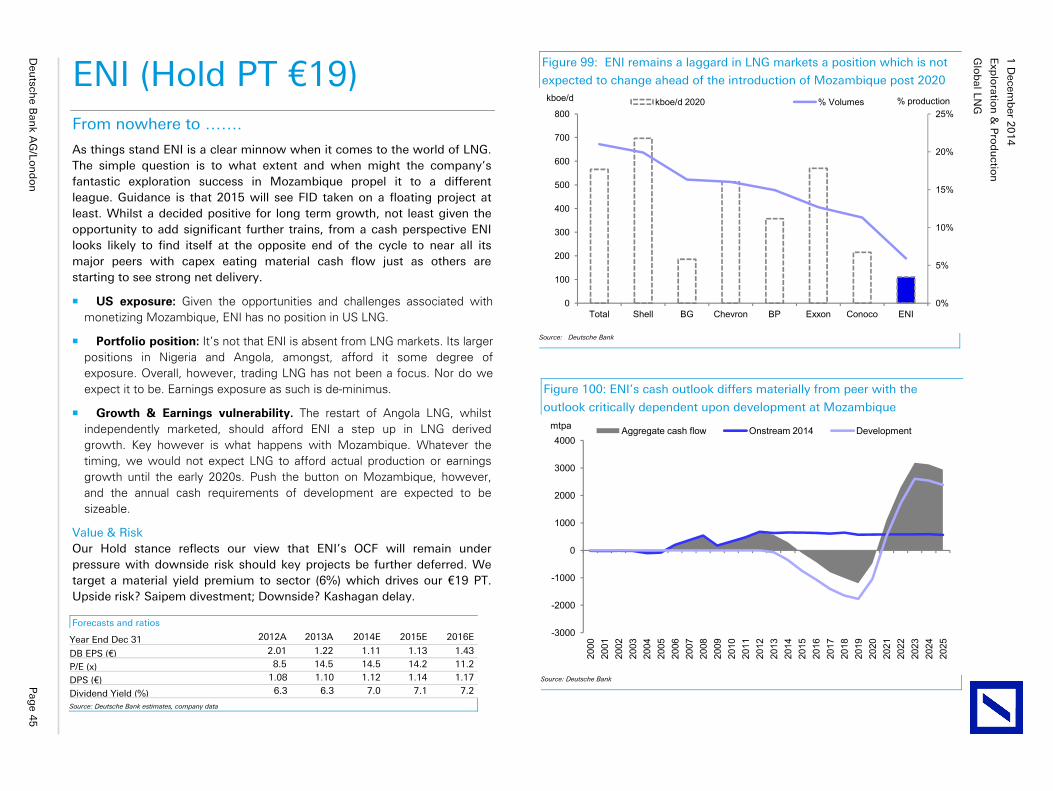
Glo
bal LN
G
Exp
loratio
n &
Pro
du
ction
1 D
ecemb
er 20
14
Deu
tsche B
ank A
G/Lo
nd
on
P
age 4
5
ENI (Hold PT €19) From nowhere to …….
As things stand ENI is a clear minnow when it comes to the world of LNG. The simple question is to what extent and when might the company’s fantastic exploration success in Mozambique propel it to a different league. Guidance is that 2015 will see FID taken on a floating project at least. Whilst a decided positive for long term growth, not least given the opportunity to add significant further trains, from a cash perspective ENI looks likely to find itself at the opposite end of the cycle to near all its major peers with capex eating material cash flow just as others are starting to see strong net delivery.
US exposure: Given the opportunities and challenges associated with monetizing Mozambique, ENI has no position in US LNG.
Portfolio position: It’s not that ENI is absent from LNG markets. Its larger positions in Nigeria and Angola, amongst, afford it some degree of exposure. Overall, however, trading LNG has not been a focus. Nor do we expect it to be. Earnings exposure as such is de-minimus.
Growth & Earnings vulnerability. The restart of Angola LNG, whilst independently marketed, should afford ENI a step up in LNG derived growth. Key however is what happens with Mozambique. Whatever the timing, we would not expect LNG to afford actual production or earnings growth until the early 2020s. Push the button on Mozambique, however, and the annual cash requirements of development are expected to be sizeable.
Value & Risk Our Hold stance reflects our view that ENI’s OCF will remain under pressure with downside risk should key projects be further deferred. We target a material yield premium to sector (6%) which drives our €19 PT. Upside risk? Saipem divestment; Downside? Kashagan delay.
Figure 100: ENI’s cash outlook differs materially from peer with the
outlook critically dependent upon development at Mozambique
-3000
-2000
-1000
0
1000
2000
3000
4000
2000
2001
2002
2003
2004
2005
2006
2007
2008
2009
2010
2011
2012
2013
2014
2015
2016
2017
2018
2019
2020
2021
2022
2023
2024
2025
mtpa Aggregate cash flow Onstream 2014 Development
Source: Deutsche Bank
Forecasts and ratios
Year End Dec 31 2012A 2013A 2014E 2015E 2016E
DB EPS (€) 2.01 1.22 1.11 1.13 1.43
P/E (x) 8.5 14.5 14.5 14.2 11.2
DPS (€) 1.08 1.10 1.12 1.14 1.17
Dividend Yield (%) 6.3 6.3 7.0 7.1 7.2
Source: Deutsche Bank estimates, company data
Figure 99: ENI remains a laggard in LNG markets a position which is not
expected to change ahead of the introduction of Mozambique post 2020
0%
5%
10%
15%
20%
25%
0
100
200
300
400
500
600
700
800
Total Shell BG Chevron BP Exxon Conoco ENI
% productionkboe/d kboe/d 2020 % Volumes
Source: Deutsche Bank
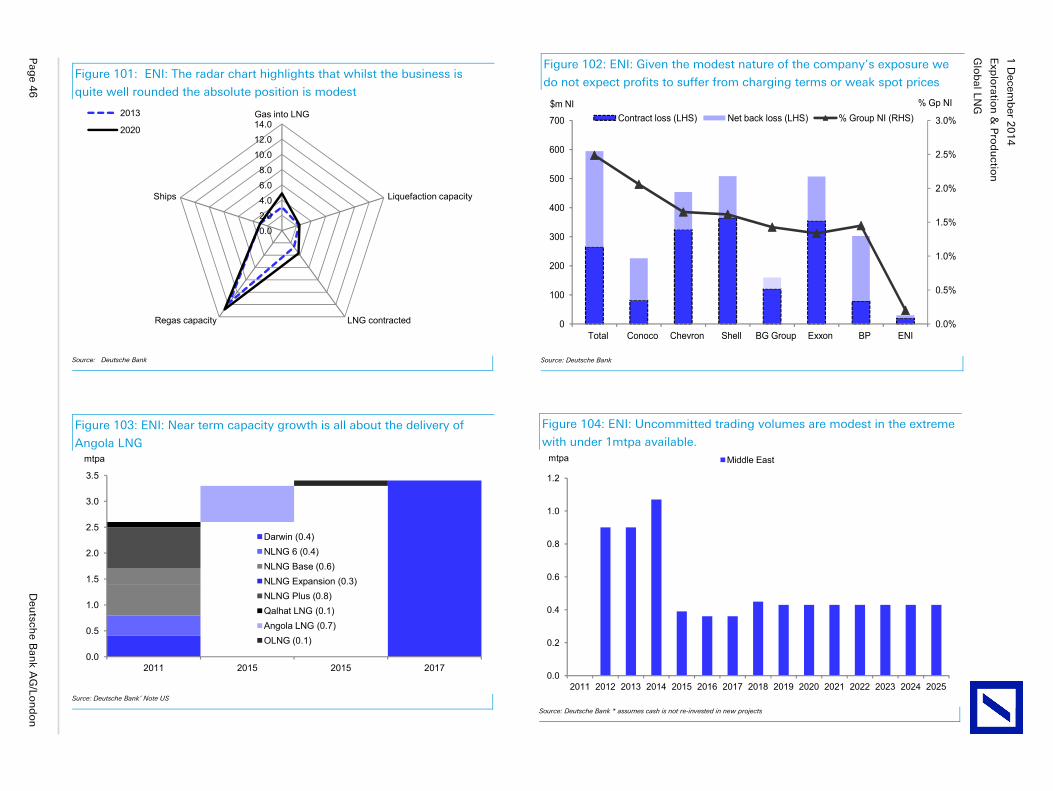
Glo
bal LN
G
Exp
loratio
n &
Pro
du
ction
1 D
ecemb
er 20
14
Pag
e 46
D
eutsch
e Ban
k AG
/Lon
do
n
Figure 102: ENI: Given the modest nature of the company’s exposure we
do not expect profits to suffer from charging terms or weak spot prices
0.0%
0.5%
1.0%
1.5%
2.0%
2.5%
3.0%
0
100
200
300
400
500
600
700
Total Conoco Chevron Shell BG Group Exxon BP ENI
% Gp NI$m NIContract loss (LHS) Net back loss (LHS) % Group NI (RHS)
Source: Deutsche Bank
Figure 101: ENI: The radar chart highlights that whilst the business is
quite well rounded the absolute position is modest
0.0
2.0
4.0
6.0
8.0
10.0
12.0
14.0Gas into LNG
Liquefaction capacity
LNG contractedRegas capacity
Ships
2013
2020
Source: Deutsche Bank
Figure 103: ENI: Near term capacity growth is all about the delivery of
Angola LNG
0.0
0.5
1.0
1.5
2.0
2.5
3.0
3.5
2011 2015 2015 2017
mtpa
Darwin (0.4)NLNG 6 (0.4)NLNG Base (0.6)NLNG Expansion (0.3)NLNG Plus (0.8)Qalhat LNG (0.1)Angola LNG (0.7)OLNG (0.1)
Surce: Deutsche Bank’ Note US
Figure 104: ENI: Uncommitted trading volumes are modest in the extreme
with under 1mtpa available.
0.0
0.2
0.4
0.6
0.8
1.0
1.2
2011 2012 2013 2014 2015 2016 2017 2018 2019 2020 2021 2022 2023 2024 2025
mtpa Middle East
Source: Deutsche Bank * assumes cash is not re-invested in new projects
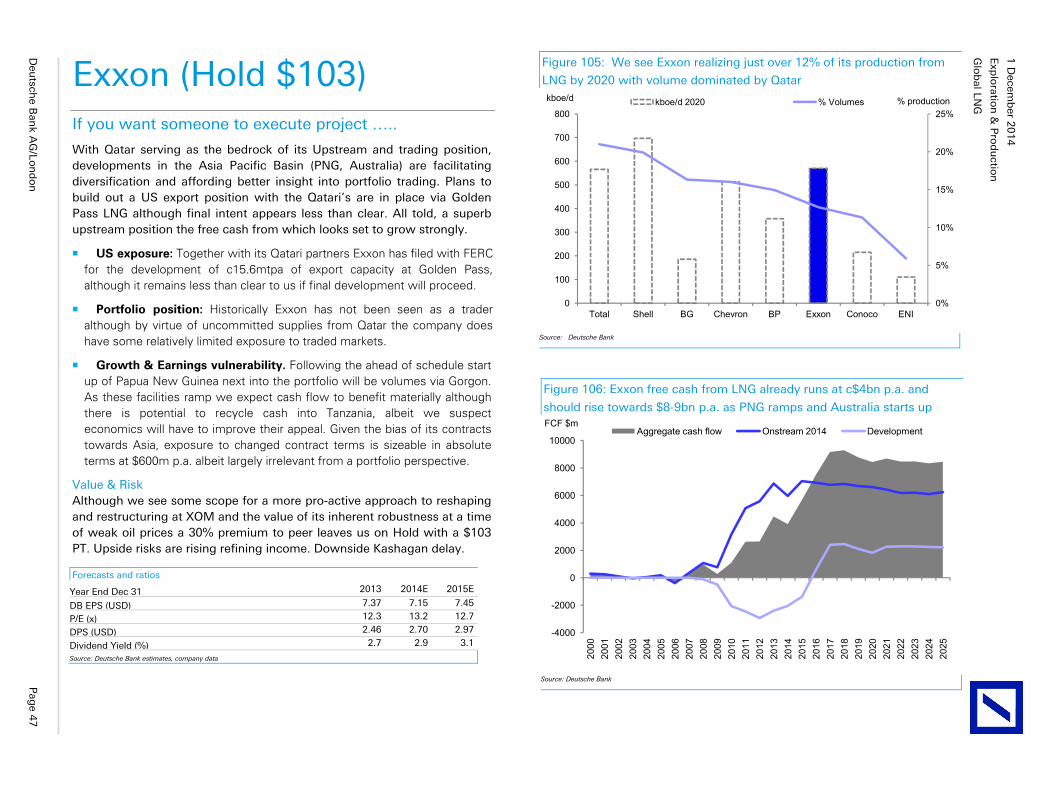
Glo
bal LN
G
Exp
loratio
n &
Pro
du
ction
1 D
ecemb
er 20
14
Deu
tsche B
ank A
G/Lo
nd
on
P
age 4
7
Exxon (Hold $103) If you want someone to execute project …..
With Qatar serving as the bedrock of its Upstream and trading position, developments in the Asia Pacific Basin (PNG, Australia) are facilitating diversification and affording better insight into portfolio trading. Plans to build out a US export position with the Qatari’s are in place via Golden Pass LNG although final intent appears less than clear. All told, a superb upstream position the free cash from which looks set to grow strongly.
US exposure: Together with its Qatari partners Exxon has filed with FERC for the development of c15.6mtpa of export capacity at Golden Pass, although it remains less than clear to us if final development will proceed.
Portfolio position: Historically Exxon has not been seen as a trader although by virtue of uncommitted supplies from Qatar the company does have some relatively limited exposure to traded markets.
Growth & Earnings vulnerability. Following the ahead of schedule start up of Papua New Guinea next into the portfolio will be volumes via Gorgon. As these facilities ramp we expect cash flow to benefit materially although there is potential to recycle cash into Tanzania, albeit we suspect economics will have to improve their appeal. Given the bias of its contracts towards Asia, exposure to changed contract terms is sizeable in absolute terms at $600m p.a. albeit largely irrelevant from a portfolio perspective.
Value & Risk Although we see some scope for a more pro-active approach to reshaping and restructuring at XOM and the value of its inherent robustness at a time of weak oil prices a 30% premium to peer leaves us on Hold with a $103 PT. Upside risks are rising refining income. Downside Kashagan delay.
Figure 106: Exxon free cash from LNG already runs at c$4bn p.a. and
should rise towards $8-9bn p.a. as PNG ramps and Australia starts up
-4000
-2000
0
2000
4000
6000
8000
10000
2000
2001
2002
2003
2004
2005
2006
2007
2008
2009
2010
2011
2012
2013
2014
2015
2016
2017
2018
2019
2020
2021
2022
2023
2024
2025
FCF $mAggregate cash flow Onstream 2014 Development
Source: Deutsche Bank
Forecasts and ratios
Year End Dec 31 2013 2014E 2015E
DB EPS (USD) 7.37 7.15 7.45
P/E (x) 12.3 13.2 12.7
DPS (USD) 2.46 2.70 2.97
Dividend Yield (%) 2.7 2.9 3.1
Source: Deutsche Bank estimates, company data
Figure 105: We see Exxon realizing just over 12% of its production from
LNG by 2020 with volume dominated by Qatar
0%
5%
10%
15%
20%
25%
0
100
200
300
400
500
600
700
800
Total Shell BG Chevron BP Exxon Conoco ENI
% productionkboe/d kboe/d 2020 % Volumes
Source: Deutsche Bank
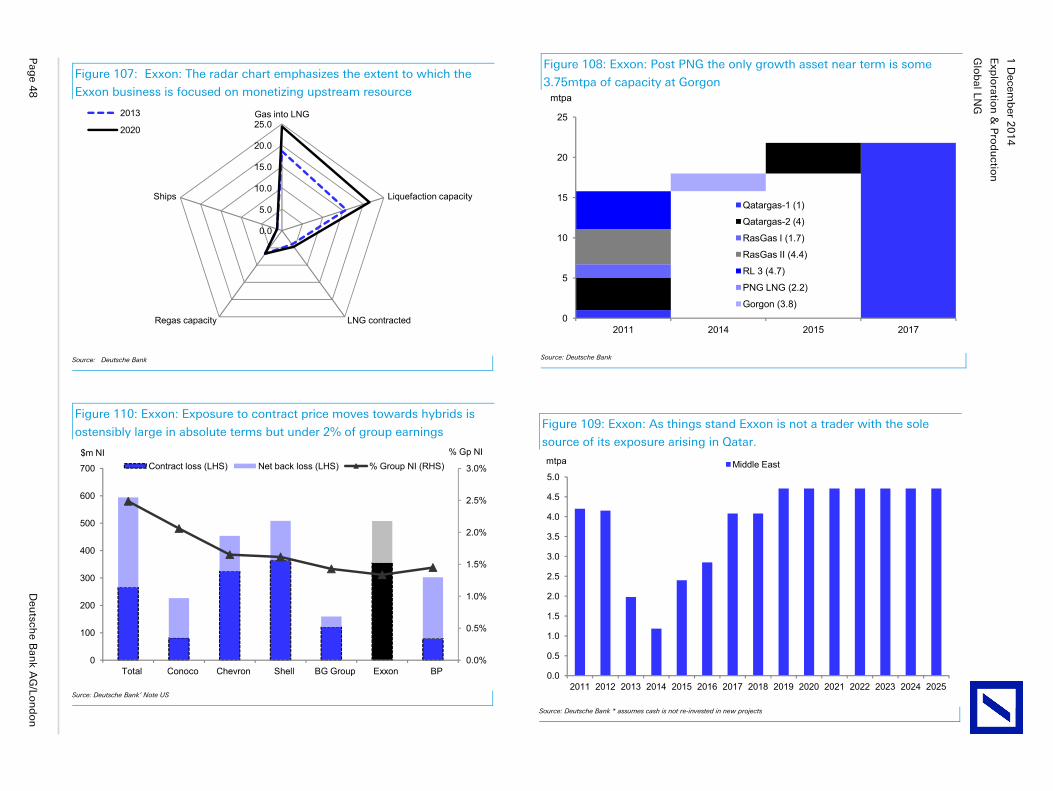
Glo
bal LN
G
Exp
loratio
n &
Pro
du
ction
1 D
ecemb
er 20
14
Pag
e 48
D
eutsch
e Ban
k AG
/Lon
do
n
Figure 108: Exxon: Post PNG the only growth asset near term is some
3.75mtpa of capacity at Gorgon
0
5
10
15
20
25
2011 2014 2015 2017
mtpa
Qatargas-1 (1)
Qatargas-2 (4)
RasGas I (1.7)
RasGas II (4.4)
RL 3 (4.7)
PNG LNG (2.2)
Gorgon (3.8)
Source: Deutsche Bank
Figure 107: Exxon: The radar chart emphasizes the extent to which the
Exxon business is focused on monetizing upstream resource
0.0
5.0
10.0
15.0
20.0
25.0Gas into LNG
Liquefaction capacity
LNG contractedRegas capacity
Ships
2013
2020
Source: Deutsche Bank
Figure 109: Exxon: As things stand Exxon is not a trader with the sole
source of its exposure arising in Qatar.
0.0
0.5
1.0
1.5
2.0
2.5
3.0
3.5
4.0
4.5
5.0
2011 2012 2013 2014 2015 2016 2017 2018 2019 2020 2021 2022 2023 2024 2025
mtpa Middle East
Source: Deutsche Bank * assumes cash is not re-invested in new projects
Figure 110: Exxon: Exposure to contract price moves towards hybrids is
ostensibly large in absolute terms but under 2% of group earnings
0.0%
0.5%
1.0%
1.5%
2.0%
2.5%
3.0%
0
100
200
300
400
500
600
700
Total Conoco Chevron Shell BG Group Exxon BP
% Gp NI$m NIContract loss (LHS) Net back loss (LHS) % Group NI (RHS)
Surce: Deutsche Bank’ Note US
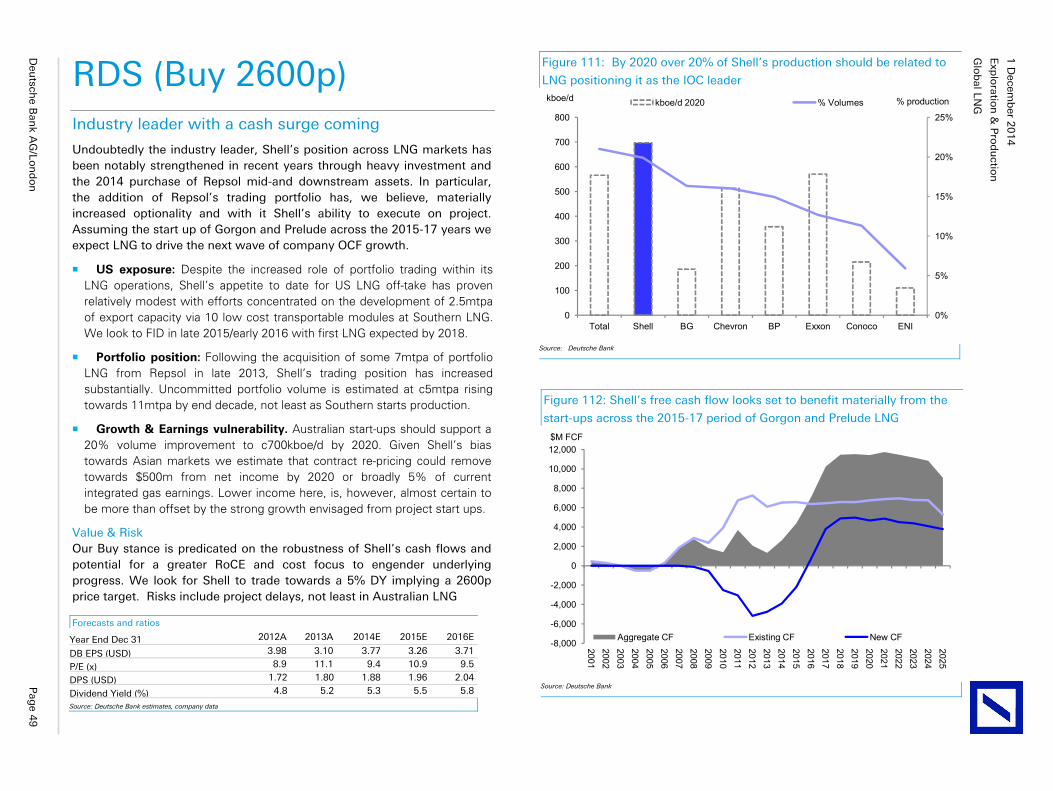
Glo
bal LN
G
Exp
loratio
n &
Pro
du
ction
1 D
ecemb
er 20
14
Deu
tsche B
ank A
G/Lo
nd
on
P
age 4
9
RDS (Buy 2600p) Industry leader with a cash surge coming
Undoubtedly the industry leader, Shell’s position across LNG markets has been notably strengthened in recent years through heavy investment and the 2014 purchase of Repsol mid-and downstream assets. In particular, the addition of Repsol’s trading portfolio has, we believe, materially increased optionality and with it Shell’s ability to execute on project. Assuming the start up of Gorgon and Prelude across the 2015-17 years we expect LNG to drive the next wave of company OCF growth.
US exposure: Despite the increased role of portfolio trading within its LNG operations, Shell’s appetite to date for US LNG off-take has proven relatively modest with efforts concentrated on the development of 2.5mtpa of export capacity via 10 low cost transportable modules at Southern LNG. We look to FID in late 2015/early 2016 with first LNG expected by 2018.
Portfolio position: Following the acquisition of some 7mtpa of portfolio LNG from Repsol in late 2013, Shell’s trading position has increased substantially. Uncommitted portfolio volume is estimated at c5mtpa rising towards 11mtpa by end decade, not least as Southern starts production.
Growth & Earnings vulnerability. Australian start-ups should support a 20% volume improvement to c700kboe/d by 2020. Given Shell’s bias towards Asian markets we estimate that contract re-pricing could remove towards $500m from net income by 2020 or broadly 5% of current integrated gas earnings. Lower income here, is, however, almost certain to be more than offset by the strong growth envisaged from project start ups.
Value & Risk Our Buy stance is predicated on the robustness of Shell’s cash flows and potential for a greater RoCE and cost focus to engender underlying progress. We look for Shell to trade towards a 5% DY implying a 2600p price target. Risks include project delays, not least in Australian LNG
Figure 112: Shell’s free cash flow looks set to benefit materially from the
start-ups across the 2015-17 period of Gorgon and Prelude LNG
-8,000
-6,000
-4,000
-2,000
0
2,000
4,000
6,000
8,000
10,000
12,0002001200220032004200520062007200820092010201120122013201420152016201720182019202020212022202320242025
$M FCF
Aggregate CF Existing CF New CF
Source: Deutsche Bank
Forecasts and ratios
Year End Dec 31 2012A 2013A 2014E 2015E 2016E
DB EPS (USD) 3.98 3.10 3.77 3.26 3.71
P/E (x) 8.9 11.1 9.4 10.9 9.5
DPS (USD) 1.72 1.80 1.88 1.96 2.04
Dividend Yield (%) 4.8 5.2 5.3 5.5 5.8
Source: Deutsche Bank estimates, company data
Figure 111: By 2020 over 20% of Shell’s production should be related to
LNG positioning it as the IOC leader
0%
5%
10%
15%
20%
25%
0
100
200
300
400
500
600
700
800
Total Shell BG Chevron BP Exxon Conoco ENI
% productionkboe/d kboe/d 2020 % Volumes
Source: Deutsche Bank
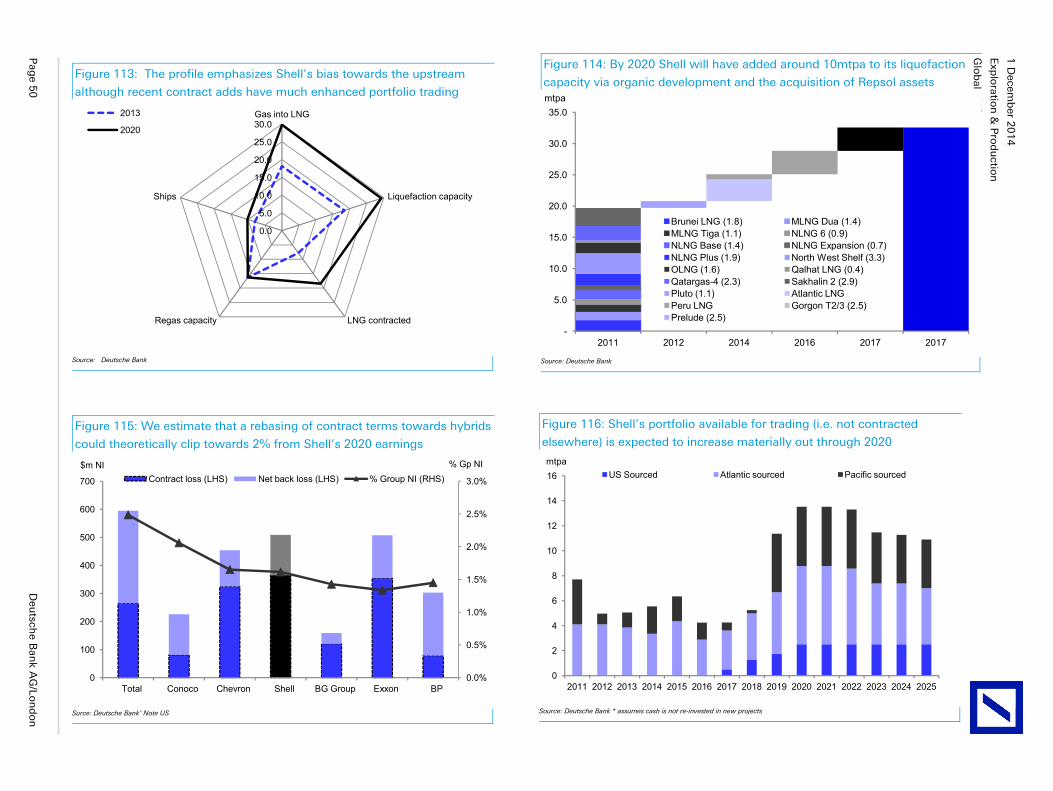
Glo
bal LN
G
Exp
loratio
n &
Pro
du
ction
1 D
ecemb
er 20
14
Pag
e 50
D
eutsch
e Ban
k AG
/Lon
do
n
Figure 114: By 2020 Shell will have added around 10mtpa to its liquefaction
capacity via organic development and the acquisition of Repsol assets
-
5.0
10.0
15.0
20.0
25.0
30.0
35.0
2011 2012 2014 2016 2017 2017
mtpa
Brunei LNG (1.8) MLNG Dua (1.4)MLNG Tiga (1.1) NLNG 6 (0.9)NLNG Base (1.4) NLNG Expansion (0.7)NLNG Plus (1.9) North West Shelf (3.3)OLNG (1.6) Qalhat LNG (0.4)Qatargas-4 (2.3) Sakhalin 2 (2.9)Pluto (1.1) Atlantic LNGPeru LNG Gorgon T2/3 (2.5)Prelude (2.5)
Source: Deutsche Bank
Figure 113: The profile emphasizes Shell’s bias towards the upstream
although recent contract adds have much enhanced portfolio trading
0.0
5.0
10.0
15.0
20.0
25.0
30.0Gas into LNG
Liquefaction capacity
LNG contractedRegas capacity
Ships
2013
2020
Source: Deutsche Bank
Figure 115: We estimate that a rebasing of contract terms towards hybrids
could theoretically clip towards 2% from Shell’s 2020 earnings
0.0%
0.5%
1.0%
1.5%
2.0%
2.5%
3.0%
0
100
200
300
400
500
600
700
Total Conoco Chevron Shell BG Group Exxon BP
% Gp NI$m NIContract loss (LHS) Net back loss (LHS) % Group NI (RHS)
Surce: Deutsche Bank’ Note US
Figure 116: Shell’s portfolio available for trading (i.e. not contracted
elsewhere) is expected to increase materially out through 2020
0
2
4
6
8
10
12
14
16
2011 2012 2013 2014 2015 2016 2017 2018 2019 2020 2021 2022 2023 2024 2025
mtpaUS Sourced Atlantic sourced Pacific sourced
Source: Deutsche Bank * assumes cash is not re-invested in new projects
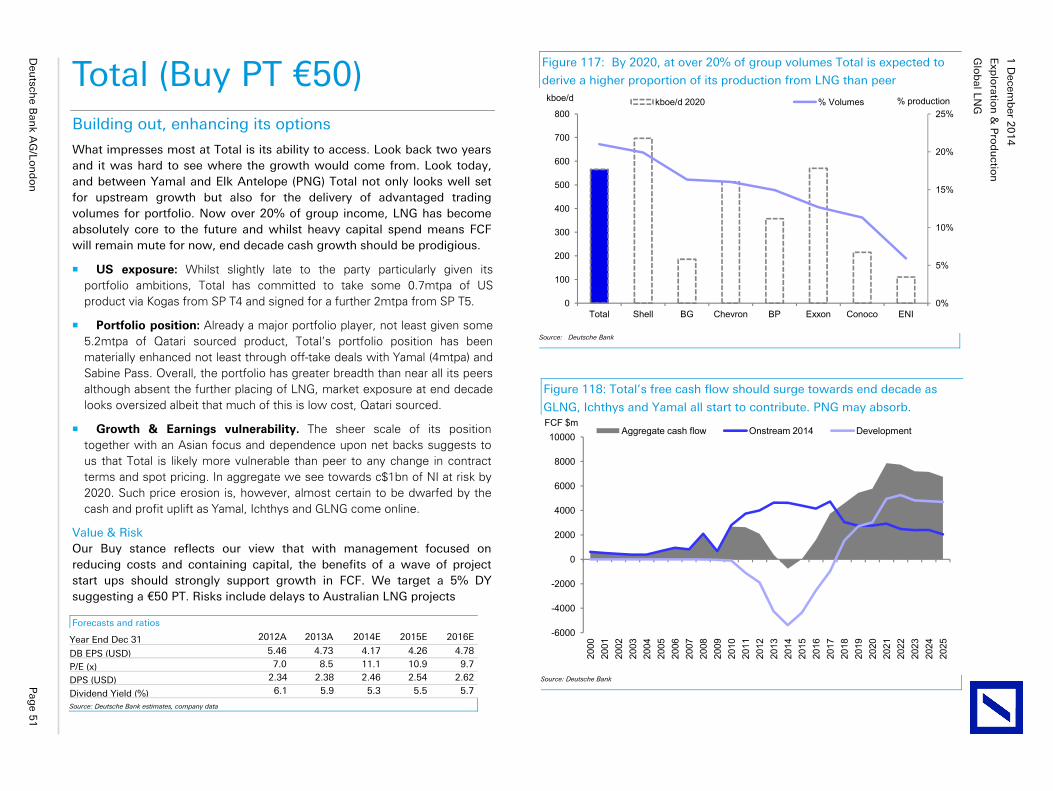
Glo
bal LN
G
Exp
loratio
n &
Pro
du
ction
1 D
ecemb
er 20
14
Deu
tsche B
ank A
G/Lo
nd
on
P
age 5
1
Total (Buy PT €50) Building out, enhancing its options
What impresses most at Total is its ability to access. Look back two years and it was hard to see where the growth would come from. Look today, and between Yamal and Elk Antelope (PNG) Total not only looks well set for upstream growth but also for the delivery of advantaged trading volumes for portfolio. Now over 20% of group income, LNG has become absolutely core to the future and whilst heavy capital spend means FCF will remain mute for now, end decade cash growth should be prodigious.
US exposure: Whilst slightly late to the party particularly given its portfolio ambitions, Total has committed to take some 0.7mtpa of US product via Kogas from SP T4 and signed for a further 2mtpa from SP T5.
Portfolio position: Already a major portfolio player, not least given some 5.2mtpa of Qatari sourced product, Total’s portfolio position has been materially enhanced not least through off-take deals with Yamal (4mtpa) and Sabine Pass. Overall, the portfolio has greater breadth than near all its peers although absent the further placing of LNG, market exposure at end decade looks oversized albeit that much of this is low cost, Qatari sourced.
Growth & Earnings vulnerability. The sheer scale of its position together with an Asian focus and dependence upon net backs suggests to us that Total is likely more vulnerable than peer to any change in contract terms and spot pricing. In aggregate we see towards c$1bn of NI at risk by 2020. Such price erosion is, however, almost certain to be dwarfed by the cash and profit uplift as Yamal, Ichthys and GLNG come online.
Value & Risk Our Buy stance reflects our view that with management focused on reducing costs and containing capital, the benefits of a wave of project start ups should strongly support growth in FCF. We target a 5% DY suggesting a €50 PT. Risks include delays to Australian LNG projects
Figure 118: Total’s free cash flow should surge towards end decade as
GLNG, Ichthys and Yamal all start to contribute. PNG may absorb.
-6000
-4000
-2000
0
2000
4000
6000
8000
10000
2000
2001
2002
2003
2004
2005
2006
2007
2008
2009
2010
2011
2012
2013
2014
2015
2016
2017
2018
2019
2020
2021
2022
2023
2024
2025
FCF $mAggregate cash flow Onstream 2014 Development
Source: Deutsche Bank
Forecasts and ratios
Year End Dec 31 2012A 2013A 2014E 2015E 2016E
DB EPS (USD) 5.46 4.73 4.17 4.26 4.78
P/E (x) 7.0 8.5 11.1 10.9 9.7
DPS (USD) 2.34 2.38 2.46 2.54 2.62
Dividend Yield (%) 6.1 5.9 5.3 5.5 5.7
Source: Deutsche Bank estimates, company data
Figure 117: By 2020, at over 20% of group volumes Total is expected to
derive a higher proportion of its production from LNG than peer
0%
5%
10%
15%
20%
25%
0
100
200
300
400
500
600
700
800
Total Shell BG Chevron BP Exxon Conoco ENI
% productionkboe/d kboe/d 2020 % Volumes
Source: Deutsche Bank
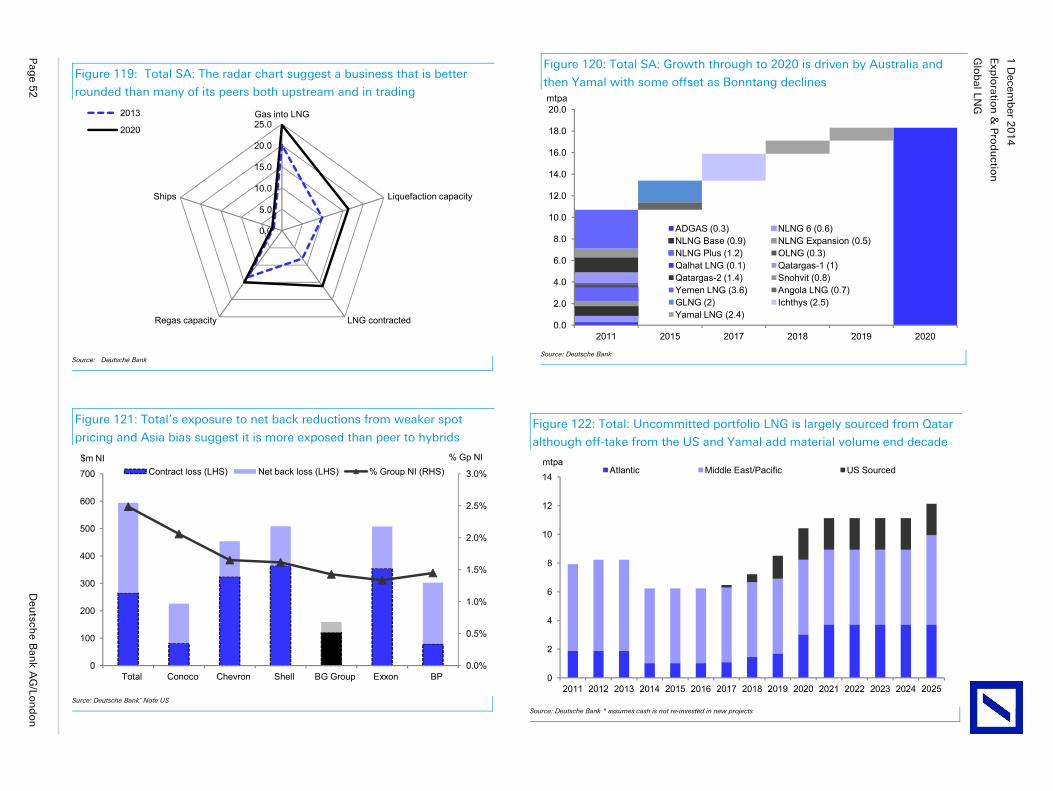
Glo
bal LN
G
Exp
loratio
n &
Pro
du
ction
1 D
ecemb
er 20
14
Pag
e 52
D
eutsch
e Ban
k AG
/Lon
do
n
Figure 120: Total SA: Growth through to 2020 is driven by Australia and
then Yamal with some offset as Bonntang declines
0.0
2.0
4.0
6.0
8.0
10.0
12.0
14.0
16.0
18.0
20.0
2011 2015 2017 2018 2019 2020
mtpa
ADGAS (0.3) NLNG 6 (0.6)NLNG Base (0.9) NLNG Expansion (0.5)NLNG Plus (1.2) OLNG (0.3)Qalhat LNG (0.1) Qatargas-1 (1)Qatargas-2 (1.4) Snohvit (0.8)Yemen LNG (3.6) Angola LNG (0.7)GLNG (2) Ichthys (2.5)Yamal LNG (2.4)
Source: Deutsche Bank
Figure 119: Total SA: The radar chart suggest a business that is better
rounded than many of its peers both upstream and in trading
0.0
5.0
10.0
15.0
20.0
25.0Gas into LNG
Liquefaction capacity
LNG contractedRegas capacity
Ships
2013
2020
Source: Deutsche Bank
Figure 121: Total’s exposure to net back reductions from weaker spot
pricing and Asia bias suggest it is more exposed than peer to hybrids
0.0%
0.5%
1.0%
1.5%
2.0%
2.5%
3.0%
0
100
200
300
400
500
600
700
Total Conoco Chevron Shell BG Group Exxon BP
% Gp NI$m NIContract loss (LHS) Net back loss (LHS) % Group NI (RHS)
Surce: Deutsche Bank’ Note US
Figure 122: Total: Uncommitted portfolio LNG is largely sourced from Qatar
although off-take from the US and Yamal add material volume end decade
0
2
4
6
8
10
12
14
2011 2012 2013 2014 2015 2016 2017 2018 2019 2020 2021 2022 2023 2024 2025
mtpaAtlantic Middle East/Pacific US Sourced
Source: Deutsche Bank * assumes cash is not re-invested in new projects
Glo
bal LN
G
Exp
loratio
n &
Pro
du
ction
1 D
ecemb
er 20
14
Deu
tsche B
ank A
G/Lo
nd
on
P
age 5
3
Appendix B: Other Industry Implications
US LNG: What are the threats and opportunities for other industries?
North American Exploration & Production
European Utilities
Korean Utilities
Russian Piped Gas
European Engineering & Construction
US Engineering & Construction
Asian Engineering & Construction
LNG Shipping inc GTT
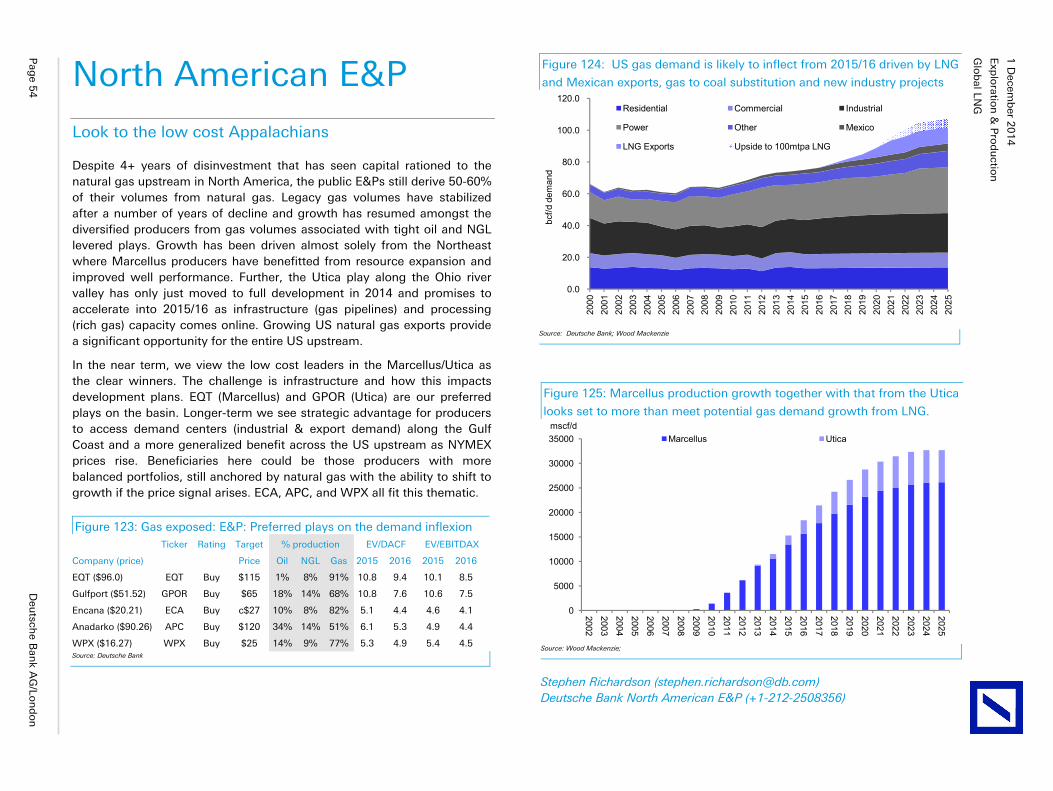
Glo
bal LN
G
Exp
loratio
n &
Pro
du
ction
1 D
ecemb
er 20
14
Pag
e 54
D
eutsch
e Ban
k AG
/Lon
do
n
North American E&P
Look to the low cost Appalachians
Despite 4+ years of disinvestment that has seen capital rationed to the natural gas upstream in North America, the public E&Ps still derive 50-60% of their volumes from natural gas. Legacy gas volumes have stabilized after a number of years of decline and growth has resumed amongst the diversified producers from gas volumes associated with tight oil and NGL levered plays. Growth has been driven almost solely from the Northeast where Marcellus producers have benefitted from resource expansion and improved well performance. Further, the Utica play along the Ohio river valley has only just moved to full development in 2014 and promises to accelerate into 2015/16 as infrastructure (gas pipelines) and processing (rich gas) capacity comes online. Growing US natural gas exports provide a significant opportunity for the entire US upstream.
In the near term, we view the low cost leaders in the Marcellus/Utica as the clear winners. The challenge is infrastructure and how this impacts development plans. EQT (Marcellus) and GPOR (Utica) are our preferred plays on the basin. Longer-term we see strategic advantage for producers to access demand centers (industrial & export demand) along the Gulf Coast and a more generalized benefit across the US upstream as NYMEX prices rise. Beneficiaries here could be those producers with more balanced portfolios, still anchored by natural gas with the ability to shift to growth if the price signal arises. ECA, APC, and WPX all fit this thematic.
Figure 123: Gas exposed: E&P: Preferred plays on the demand inflexion Ticker Rating Target % production EV/DACF EV/EBITDAX
Company (price) Price Oil NGL Gas 2015 2016 2015 2016
EQT ($96.0) EQT Buy $115 1% 8% 91% 10.8 9.4 10.1 8.5
Gulfport ($51.52) GPOR Buy $65 18% 14% 68% 10.8 7.6 10.6 7.5
Encana ($20.21) ECA Buy c$27 10% 8% 82% 5.1 4.4 4.6 4.1
Anadarko ($90.26) APC Buy $120 34% 14% 51% 6.1 5.3 4.9 4.4
WPX ($16.27) WPX Buy $25 14% 9% 77% 5.3 4.9 5.4 4.5 Source: Deutsche Bank
Figure 125: Marcellus production growth together with that from the Utica
looks set to more than meet potential gas demand growth from LNG.
0
5000
10000
15000
20000
25000
30000
35000
2002
2003
2004
2005
2006
2007
2008
2009
2010
2011
2012
2013
2014
2015
2016
2017
2018
2019
2020
2021
2022
2023
2024
2025
mscf/dMarcellus Utica
Source: Wood Mackenzie;
Stephen Richardson ([email protected]) Deutsche Bank North American E&P (+1-212-2508356)
Figure 124: US gas demand is likely to inflect from 2015/16 driven by LNG
and Mexican exports, gas to coal substitution and new industry projects
0.0
20.0
40.0
60.0
80.0
100.0
120.0
2000
2001
2002
2003
2004
2005
2006
2007
2008
2009
2010
2011
2012
2013
2014
2015
2016
2017
2018
2019
2020
2021
2022
2023
2024
2025
bcf/d
dem
and
Residential Commercial Industrial
Power Other Mexico
LNG Exports Upside to 100mtpa LNG
Source: Deutsche Bank; Wood Mackenzie
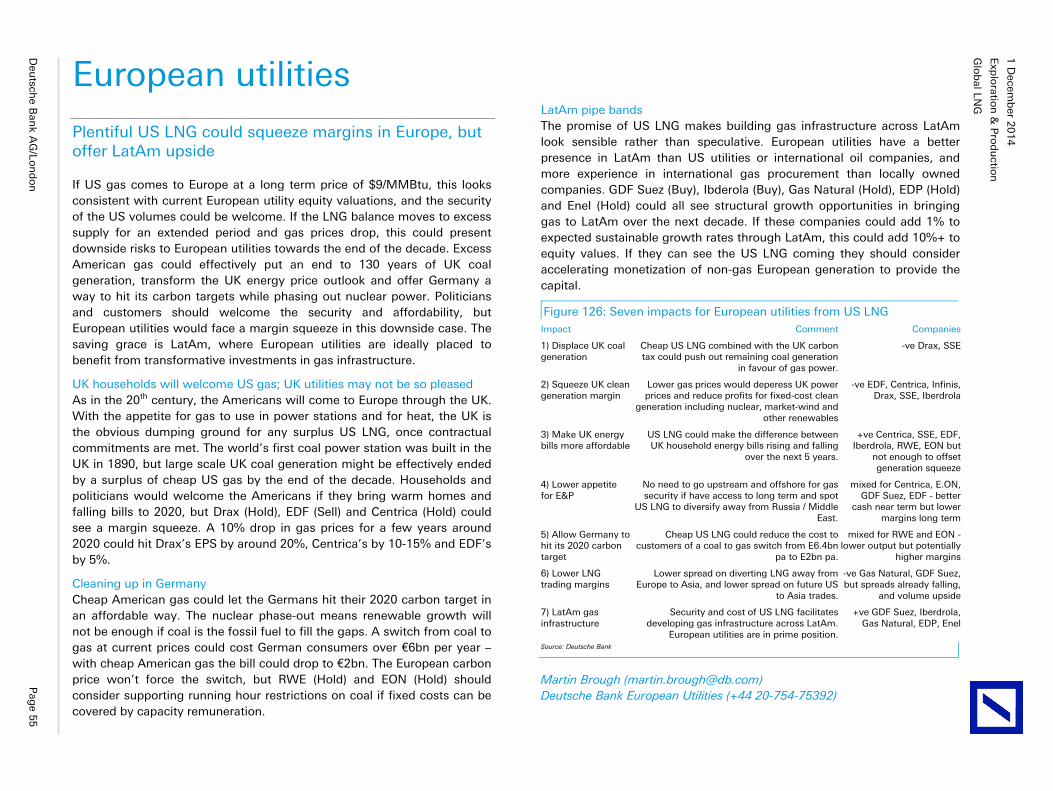
Glo
bal LN
G
Exp
loratio
n &
Pro
du
ction
1 D
ecemb
er 20
14
Deu
tsche B
ank A
G/Lo
nd
on
P
age 5
5
European utilities
Plentiful US LNG could squeeze margins in Europe, but offer LatAm upside
If US gas comes to Europe at a long term price of $9/MMBtu, this looks consistent with current European utility equity valuations, and the security of the US volumes could be welcome. If the LNG balance moves to excess supply for an extended period and gas prices drop, this could present downside risks to European utilities towards the end of the decade. Excess American gas could effectively put an end to 130 years of UK coal generation, transform the UK energy price outlook and offer Germany a way to hit its carbon targets while phasing out nuclear power. Politicians and customers should welcome the security and affordability, but European utilities would face a margin squeeze in this downside case. The saving grace is LatAm, where European utilities are ideally placed to benefit from transformative investments in gas infrastructure.
UK households will welcome US gas; UK utilities may not be so pleased As in the 20th century, the Americans will come to Europe through the UK. With the appetite for gas to use in power stations and for heat, the UK is the obvious dumping ground for any surplus US LNG, once contractual commitments are met. The world’s first coal power station was built in the UK in 1890, but large scale UK coal generation might be effectively ended by a surplus of cheap US gas by the end of the decade. Households and politicians would welcome the Americans if they bring warm homes and falling bills to 2020, but Drax (Hold), EDF (Sell) and Centrica (Hold) could see a margin squeeze. A 10% drop in gas prices for a few years around 2020 could hit Drax’s EPS by around 20%, Centrica’s by 10-15% and EDF’s by 5%.
Cleaning up in Germany Cheap American gas could let the Germans hit their 2020 carbon target in an affordable way. The nuclear phase-out means renewable growth will not be enough if coal is the fossil fuel to fill the gaps. A switch from coal to gas at current prices could cost German consumers over €6bn per year – with cheap American gas the bill could drop to €2bn. The European carbon price won’t force the switch, but RWE (Hold) and EON (Hold) should consider supporting running hour restrictions on coal if fixed costs can be covered by capacity remuneration.
LatAm pipe bands The promise of US LNG makes building gas infrastructure across LatAm look sensible rather than speculative. European utilities have a better presence in LatAm than US utilities or international oil companies, and more experience in international gas procurement than locally owned companies. GDF Suez (Buy), Ibderola (Buy), Gas Natural (Hold), EDP (Hold) and Enel (Hold) could all see structural growth opportunities in bringing gas to LatAm over the next decade. If these companies could add 1% to expected sustainable growth rates through LatAm, this could add 10%+ to equity values. If they can see the US LNG coming they should consider accelerating monetization of non-gas European generation to provide the capital.
Figure 126: Seven impacts for European utilities from US LNG Impact Comment Companies
1) Displace UK coal generation
Cheap US LNG combined with the UK carbon tax could push out remaining coal generation
in favour of gas power.
-ve Drax, SSE
2) Squeeze UK clean generation margin
Lower gas prices would deperess UK power prices and reduce profits for fixed-cost clean
generation including nuclear, market-wind and other renewables
-ve EDF, Centrica, Infinis, Drax, SSE, Iberdrola
3) Make UK energy bills more affordable
US LNG could make the difference between UK household energy bills rising and falling
over the next 5 years.
+ve Centrica, SSE, EDF, Iberdrola, RWE, EON but
not enough to offset generation squeeze
4) Lower appetite for E&P
No need to go upstream and offshore for gas security if have access to long term and spot
US LNG to diversify away from Russia / Middle East.
mixed for Centrica, E.ON, GDF Suez, EDF - better
cash near term but lower margins long term
5) Allow Germany to hit its 2020 carbon target
Cheap US LNG could reduce the cost to customers of a coal to gas switch from E6.4bn
pa to E2bn pa.
mixed for RWE and EON - lower output but potentially
higher margins
6) Lower LNG trading margins
Lower spread on diverting LNG away from Europe to Asia, and lower spread on future US
to Asia trades.
-ve Gas Natural, GDF Suez, but spreads already falling,
and volume upside
7) LatAm gas infrastructure
Security and cost of US LNG facilitates developing gas infrastructure across LatAm.
European utilities are in prime position.
+ve GDF Suez, Iberdrola, Gas Natural, EDP, Enel
Source: Deutsche Bank
Martin Brough ([email protected]) Deutsche Bank European Utilities (+44 20-754-75392)
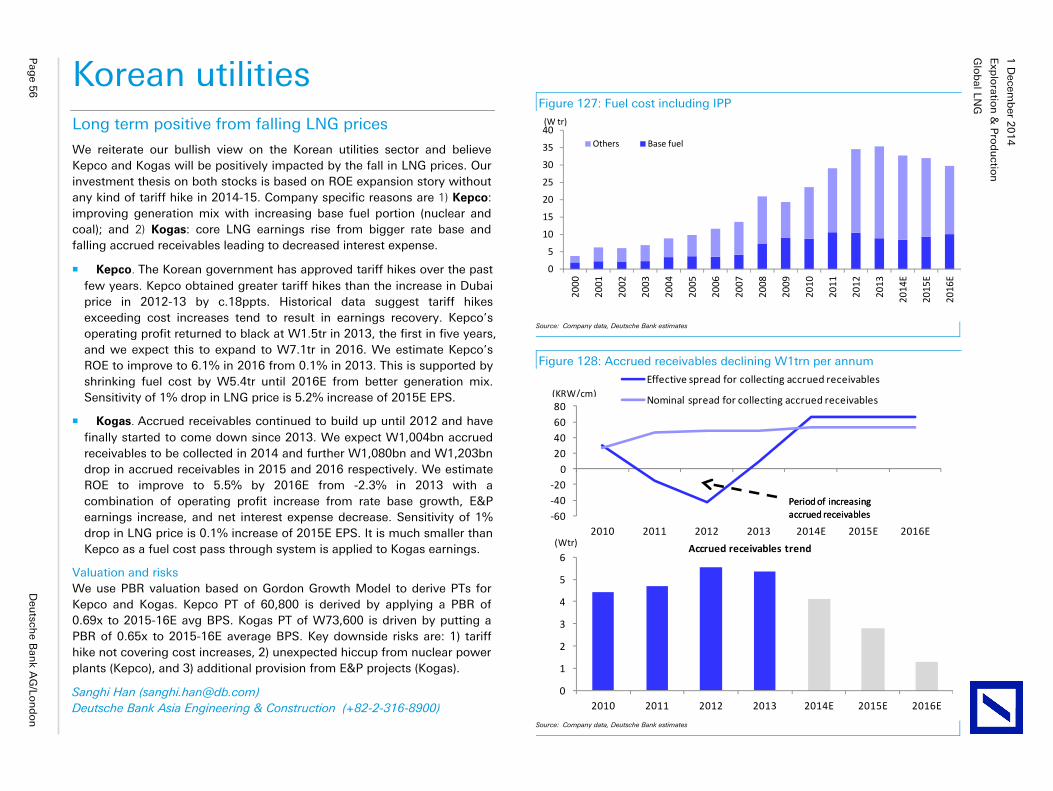
Glo
bal LN
G
Exp
loratio
n &
Pro
du
ction
1 D
ecemb
er 20
14
Pag
e 56
D
eutsch
e Ban
k AG
/Lon
do
n
Korean utilities Long term positive from falling LNG prices
We reiterate our bullish view on the Korean utilities sector and believe Kepco and Kogas will be positively impacted by the fall in LNG prices. Our investment thesis on both stocks is based on ROE expansion story without any kind of tariff hike in 2014-15. Company specific reasons are 1) Kepco: improving generation mix with increasing base fuel portion (nuclear and coal); and 2) Kogas: core LNG earnings rise from bigger rate base and falling accrued receivables leading to decreased interest expense.
Kepco. The Korean government has approved tariff hikes over the past few years. Kepco obtained greater tariff hikes than the increase in Dubai price in 2012-13 by c.18ppts. Historical data suggest tariff hikes exceeding cost increases tend to result in earnings recovery. Kepco’s operating profit returned to black at W1.5tr in 2013, the first in five years, and we expect this to expand to W7.1tr in 2016. We estimate Kepco’s ROE to improve to 6.1% in 2016 from 0.1% in 2013. This is supported by shrinking fuel cost by W5.4tr until 2016E from better generation mix. Sensitivity of 1% drop in LNG price is 5.2% increase of 2015E EPS.
Kogas. Accrued receivables continued to build up until 2012 and have finally started to come down since 2013. We expect W1,004bn accrued receivables to be collected in 2014 and further W1,080bn and W1,203bn drop in accrued receivables in 2015 and 2016 respectively. We estimate ROE to improve to 5.5% by 2016E from -2.3% in 2013 with a combination of operating profit increase from rate base growth, E&P earnings increase, and net interest expense decrease. Sensitivity of 1% drop in LNG price is 0.1% increase of 2015E EPS. It is much smaller than Kepco as a fuel cost pass through system is applied to Kogas earnings.
Valuation and risks We use PBR valuation based on Gordon Growth Model to derive PTs for Kepco and Kogas. Kepco PT of 60,800 is derived by applying a PBR of 0.69x to 2015-16E avg BPS. Kogas PT of W73,600 is driven by putting a PBR of 0.65x to 2015-16E average BPS. Key downside risks are: 1) tariff hike not covering cost increases, 2) unexpected hiccup from nuclear power plants (Kepco), and 3) additional provision from E&P projects (Kogas).
Sanghi Han ([email protected]) Deutsche Bank Asia Engineering & Construction (+82-2-316-8900)
Figure 127: Fuel cost including IPP
0
5
10
15
20
25
30
35
40
2000
2001
2002
2003
2004
2005
2006
2007
2008
2009
2010
2011
2012
2013
2014
E
2015
E
2016
E
Others Base fuel
(W tr)
Source: Company data, Deutsche Bank estimates
Figure 128: Accrued receivables declining W1trn per annum
-60-40-20
020406080
2010 2011 2012 2013 2014E 2015E 2016E
Effective spread for collecting accrued receivables
Nominal spread for collecting accrued receivables(KRW/cm)
Period of increasing accrued receivablesPeriod of increasing accrued receivables
0
1
2
3
4
5
6
2010 2011 2012 2013 2014E 2015E 2016E
Accrued receivables trend(Wtr)
Source: Company data, Deutsche Bank estimates
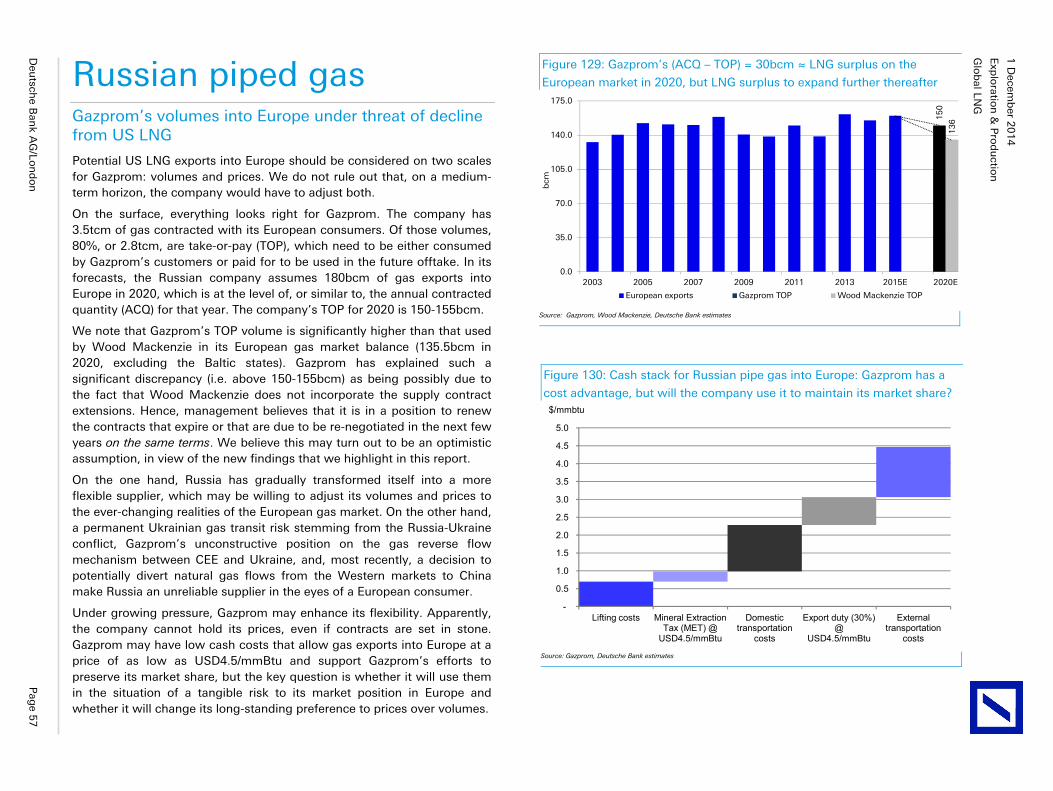
Glo
bal LN
G
Exp
loratio
n &
Pro
du
ction
1 D
ecemb
er 20
14
Deu
tsche B
ank A
G/Lo
nd
on
P
age 5
7
Russian piped gas Gazprom’s volumes into Europe under threat of decline from US LNG
Potential US LNG exports into Europe should be considered on two scales for Gazprom: volumes and prices. We do not rule out that, on a medium-term horizon, the company would have to adjust both.
On the surface, everything looks right for Gazprom. The company has 3.5tcm of gas contracted with its European consumers. Of those volumes, 80%, or 2.8tcm, are take-or-pay (TOP), which need to be either consumed by Gazprom’s customers or paid for to be used in the future offtake. In its forecasts, the Russian company assumes 180bcm of gas exports into Europe in 2020, which is at the level of, or similar to, the annual contracted quantity (ACQ) for that year. The company’s TOP for 2020 is 150-155bcm.
We note that Gazprom’s TOP volume is significantly higher than that used by Wood Mackenzie in its European gas market balance (135.5bcm in 2020, excluding the Baltic states). Gazprom has explained such a significant discrepancy (i.e. above 150-155bcm) as being possibly due to the fact that Wood Mackenzie does not incorporate the supply contract extensions. Hence, management believes that it is in a position to renew the contracts that expire or that are due to be re-negotiated in the next few years on the same terms. We believe this may turn out to be an optimistic assumption, in view of the new findings that we highlight in this report.
On the one hand, Russia has gradually transformed itself into a more flexible supplier, which may be willing to adjust its volumes and prices to the ever-changing realities of the European gas market. On the other hand, a permanent Ukrainian gas transit risk stemming from the Russia-Ukraine conflict, Gazprom’s unconstructive position on the gas reverse flow mechanism between CEE and Ukraine, and, most recently, a decision to potentially divert natural gas flows from the Western markets to China make Russia an unreliable supplier in the eyes of a European consumer.
Under growing pressure, Gazprom may enhance its flexibility. Apparently, the company cannot hold its prices, even if contracts are set in stone. Gazprom may have low cash costs that allow gas exports into Europe at a price of as low as USD4.5/mmBtu and support Gazprom’s efforts to preserve its market share, but the key question is whether it will use them in the situation of a tangible risk to its market position in Europe and whether it will change its long-standing preference to prices over volumes.
Figure 130: Cash stack for Russian pipe gas into Europe: Gazprom has a
cost advantage, but will the company use it to maintain its market share?
-
0.5
1.0
1.5
2.0
2.5
3.0
3.5
4.0
4.5
5.0
Lifting costs Mineral Extraction Tax (MET) @
USD4.5/mmBtu
Domestic transportation
costs
Export duty (30%) @
USD4.5/mmBtu
External transportation
costs
$/mmbtu
Source: Gazprom, Deutsche Bank estimates
Figure 129: Gazprom’s (ACQ – TOP) = 30bcm ≈ LNG surplus on the
European market in 2020, but LNG surplus to expand further thereafter
15
0
13
6
0.0
35.0
70.0
105.0
140.0
175.0
2003 2005 2007 2009 2011 2013 2015E 2020E
bcm
European exports Gazprom TOP Wood Mackenzie TOP Source: Gazprom, Wood Mackenzie, Deutsche Bank estimates
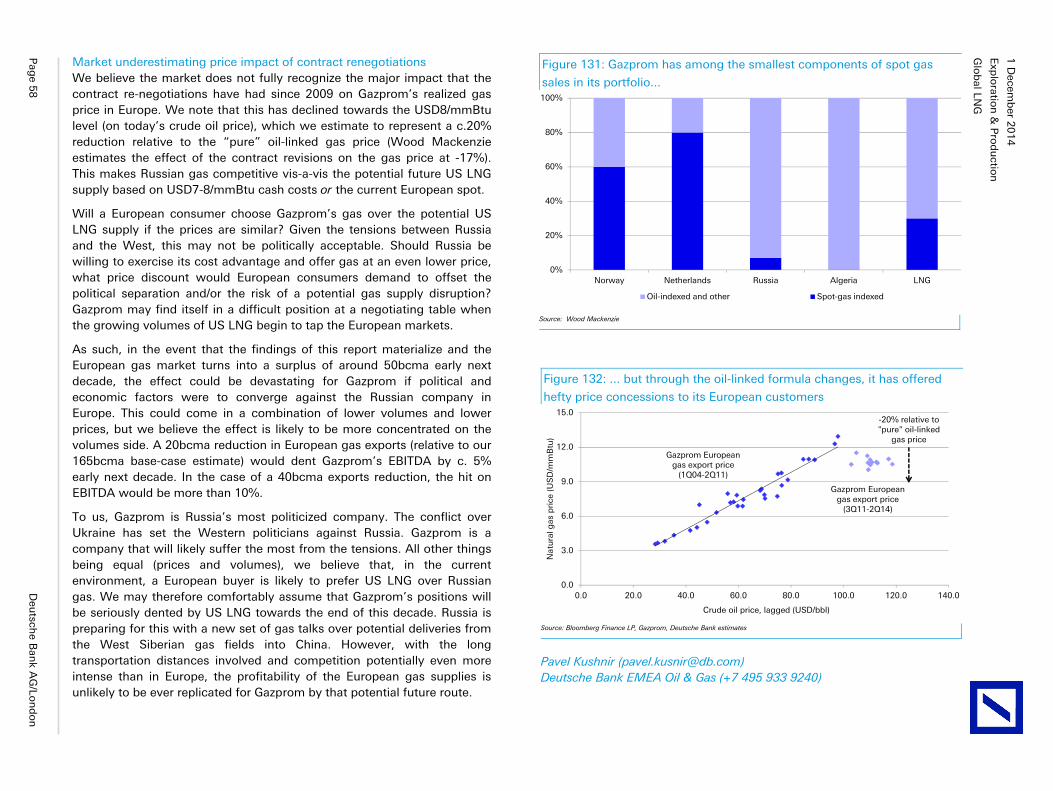
Glo
bal LN
G
Exp
loratio
n &
Pro
du
ction
1 D
ecemb
er 20
14
Pag
e 58
D
eutsch
e Ban
k AG
/Lon
do
n
Market underestimating price impact of contract renegotiations We believe the market does not fully recognize the major impact that the contract re-negotiations have had since 2009 on Gazprom’s realized gas price in Europe. We note that this has declined towards the USD8/mmBtu level (on today’s crude oil price), which we estimate to represent a c.20% reduction relative to the “pure” oil-linked gas price (Wood Mackenzie estimates the effect of the contract revisions on the gas price at -17%). This makes Russian gas competitive vis-a-vis the potential future US LNG supply based on USD7-8/mmBtu cash costs or the current European spot.
Will a European consumer choose Gazprom’s gas over the potential US LNG supply if the prices are similar? Given the tensions between Russia and the West, this may not be politically acceptable. Should Russia be willing to exercise its cost advantage and offer gas at an even lower price, what price discount would European consumers demand to offset the political separation and/or the risk of a potential gas supply disruption? Gazprom may find itself in a difficult position at a negotiating table when the growing volumes of US LNG begin to tap the European markets.
As such, in the event that the findings of this report materialize and the European gas market turns into a surplus of around 50bcma early next decade, the effect could be devastating for Gazprom if political and economic factors were to converge against the Russian company in Europe. This could come in a combination of lower volumes and lower prices, but we believe the effect is likely to be more concentrated on the volumes side. A 20bcma reduction in European gas exports (relative to our 165bcma base-case estimate) would dent Gazprom’s EBITDA by c. 5% early next decade. In the case of a 40bcma exports reduction, the hit on EBITDA would be more than 10%.
To us, Gazprom is Russia’s most politicized company. The conflict over Ukraine has set the Western politicians against Russia. Gazprom is a company that will likely suffer the most from the tensions. All other things being equal (prices and volumes), we believe that, in the current environment, a European buyer is likely to prefer US LNG over Russian gas. We may therefore comfortably assume that Gazprom’s positions will be seriously dented by US LNG towards the end of this decade. Russia is preparing for this with a new set of gas talks over potential deliveries from the West Siberian gas fields into China. However, with the long transportation distances involved and competition potentially even more intense than in Europe, the profitability of the European gas supplies is unlikely to be ever replicated for Gazprom by that potential future route.
Figure 132: ... but through the oil-linked formula changes, it has offered
hefty price concessions to its European customers
0.0
3.0
6.0
9.0
12.0
15.0
0.0 20.0 40.0 60.0 80.0 100.0 120.0 140.0
Nat
ura
l gas
pri
ce (
US
D/m
mB
tu)
Crude oil price, lagged (USD/bbl)
Gazprom European gas export price
(1Q04-2Q11)
Gazprom European gas export price
(3Q11-2Q14)
-20% relative to "pure" oil-linked
gas price
Source: Bloomberg Finance LP, Gazprom, Deutsche Bank estimates
Pavel Kushnir ([email protected]) Deutsche Bank EMEA Oil & Gas (+7 495 933 9240)
Figure 131: Gazprom has among the smallest components of spot gas
sales in its portfolio...
0%
20%
40%
60%
80%
100%
Norway Netherlands Russia Algeria LNG
Oil-indexed and other Spot-gas indexed
Source: Wood Mackenzie
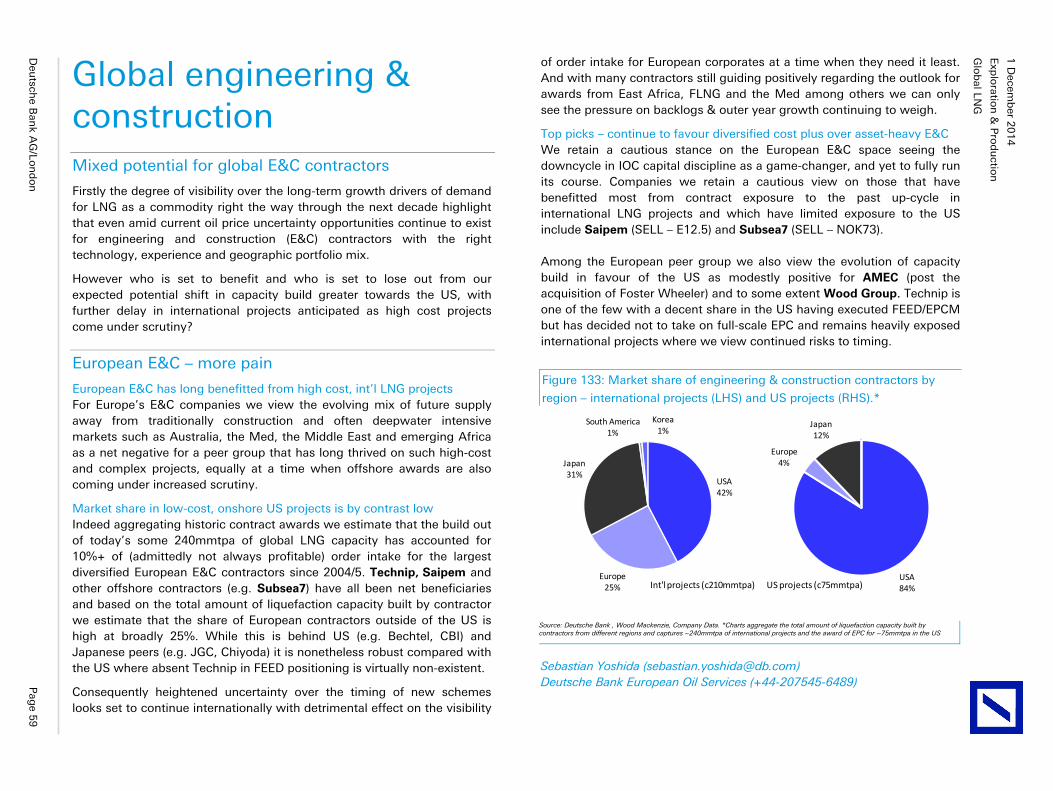
Glo
bal LN
G
Exp
loratio
n &
Pro
du
ction
1 D
ecemb
er 20
14
Deu
tsche B
ank A
G/Lo
nd
on
P
age 5
9
Global engineering & construction Mixed potential for global E&C contractors
Firstly the degree of visibility over the long-term growth drivers of demand for LNG as a commodity right the way through the next decade highlight that even amid current oil price uncertainty opportunities continue to exist for engineering and construction (E&C) contractors with the right technology, experience and geographic portfolio mix.
However who is set to benefit and who is set to lose out from our expected potential shift in capacity build greater towards the US, with further delay in international projects anticipated as high cost projects come under scrutiny?
European E&C – more pain
European E&C has long benefitted from high cost, int’l LNG projects For Europe’s E&C companies we view the evolving mix of future supply away from traditionally construction and often deepwater intensive markets such as Australia, the Med, the Middle East and emerging Africa as a net negative for a peer group that has long thrived on such high-cost and complex projects, equally at a time when offshore awards are also coming under increased scrutiny.
Market share in low-cost, onshore US projects is by contrast low Indeed aggregating historic contract awards we estimate that the build out of today’s some 240mmtpa of global LNG capacity has accounted for 10%+ of (admittedly not always profitable) order intake for the largest diversified European E&C contractors since 2004/5. Technip, Saipem and other offshore contractors (e.g. Subsea7) have all been net beneficiaries and based on the total amount of liquefaction capacity built by contractor we estimate that the share of European contractors outside of the US is high at broadly 25%. While this is behind US (e.g. Bechtel, CBI) and Japanese peers (e.g. JGC, Chiyoda) it is nonetheless robust compared with the US where absent Technip in FEED positioning is virtually non-existent.
Consequently heightened uncertainty over the timing of new schemes looks set to continue internationally with detrimental effect on the visibility
of order intake for European corporates at a time when they need it least. And with many contractors still guiding positively regarding the outlook for awards from East Africa, FLNG and the Med among others we can only see the pressure on backlogs & outer year growth continuing to weigh.
Top picks – continue to favour diversified cost plus over asset-heavy E&C We retain a cautious stance on the European E&C space seeing the downcycle in IOC capital discipline as a game-changer, and yet to fully run its course. Companies we retain a cautious view on those that have benefitted most from contract exposure to the past up-cycle in international LNG projects and which have limited exposure to the US include Saipem (SELL – E12.5) and Subsea7 (SELL – NOK73).
Among the European peer group we also view the evolution of capacity build in favour of the US as modestly positive for AMEC (post the acquisition of Foster Wheeler) and to some extent Wood Group. Technip is one of the few with a decent share in the US having executed FEED/EPCM but has decided not to take on full-scale EPC and remains heavily exposed international projects where we view continued risks to timing.
Sebastian Yoshida ([email protected]) Deutsche Bank European Oil Services (+44-207545-6489)
Figure 133: Market share of engineering & construction contractors by
region – international projects (LHS) and US projects (RHS).*
USA42%
Europe25%
Japan31%
South America1%
Korea1%
USA84%
Europe4%
Japan12%
US projects (c75mmtpa) Int'l projects (c210mmtpa)
Source: Deutsche Bank , Wood Mackenzie, Company Data. *Charts aggregate the total amount of liquefaction capacity built by contractors from different regions and captures ~240mmtpa of international projects and the award of EPC for ~75mmtpa in the US
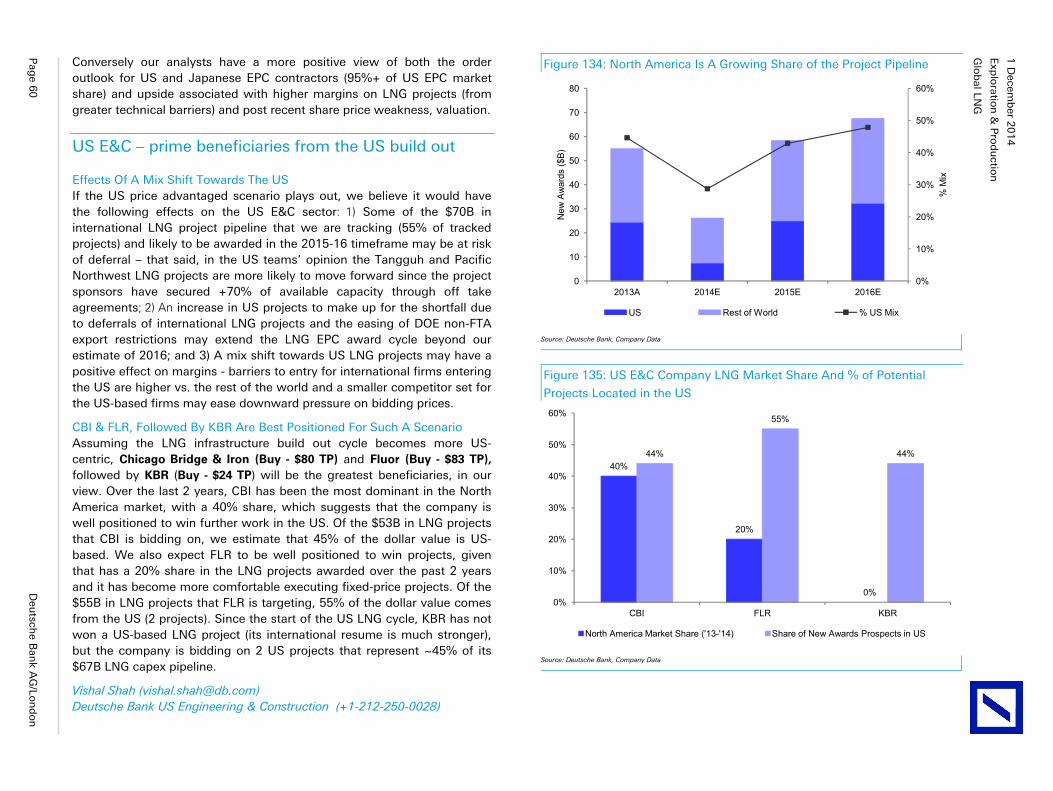
Glo
bal LN
G
Exp
loratio
n &
Pro
du
ction
1 D
ecemb
er 20
14
Pag
e 60
D
eutsch
e Ban
k AG
/Lon
do
n
Conversely our analysts have a more positive view of both the order outlook for US and Japanese EPC contractors (95%+ of US EPC market share) and upside associated with higher margins on LNG projects (from greater technical barriers) and post recent share price weakness, valuation.
US E&C – prime beneficiaries from the US build out
Effects Of A Mix Shift Towards The US If the US price advantaged scenario plays out, we believe it would have the following effects on the US E&C sector: 1) Some of the $70B in international LNG project pipeline that we are tracking (55% of tracked projects) and likely to be awarded in the 2015-16 timeframe may be at risk of deferral – that said, in the US teams’ opinion the Tangguh and Pacific Northwest LNG projects are more likely to move forward since the project sponsors have secured +70% of available capacity through off take agreements; 2) An increase in US projects to make up for the shortfall due to deferrals of international LNG projects and the easing of DOE non-FTA export restrictions may extend the LNG EPC award cycle beyond our estimate of 2016; and 3) A mix shift towards US LNG projects may have a positive effect on margins - barriers to entry for international firms entering the US are higher vs. the rest of the world and a smaller competitor set for the US-based firms may ease downward pressure on bidding prices.
CBI & FLR, Followed By KBR Are Best Positioned For Such A Scenario Assuming the LNG infrastructure build out cycle becomes more US-centric, Chicago Bridge & Iron (Buy - $80 TP) and Fluor (Buy - $83 TP), followed by KBR (Buy - $24 TP) will be the greatest beneficiaries, in our view. Over the last 2 years, CBI has been the most dominant in the North America market, with a 40% share, which suggests that the company is well positioned to win further work in the US. Of the $53B in LNG projects that CBI is bidding on, we estimate that 45% of the dollar value is US-based. We also expect FLR to be well positioned to win projects, given that has a 20% share in the LNG projects awarded over the past 2 years and it has become more comfortable executing fixed-price projects. Of the $55B in LNG projects that FLR is targeting, 55% of the dollar value comes from the US (2 projects). Since the start of the US LNG cycle, KBR has not won a US-based LNG project (its international resume is much stronger), but the company is bidding on 2 US projects that represent ~45% of its $67B LNG capex pipeline.
Vishal Shah ([email protected]) Deutsche Bank US Engineering & Construction (+1-212-250-0028)
Figure 134: North America Is A Growing Share of the Project Pipeline
0%
10%
20%
30%
40%
50%
60%
0
10
20
30
40
50
60
70
80
2013A 2014E 2015E 2016E
% M
ix
New
Aw
ards
($B)
US Rest of World % US Mix
Source: Deutsche Bank, Company Data
Figure 135: US E&C Company LNG Market Share And % of Potential
Projects Located in the US
40%
20%
0%
44%
55%
44%
0%
10%
20%
30%
40%
50%
60%
CBI FLR KBR
North America Market Share ('13-'14) Share of New Awards Prospects in US
Source: Deutsche Bank, Company Data
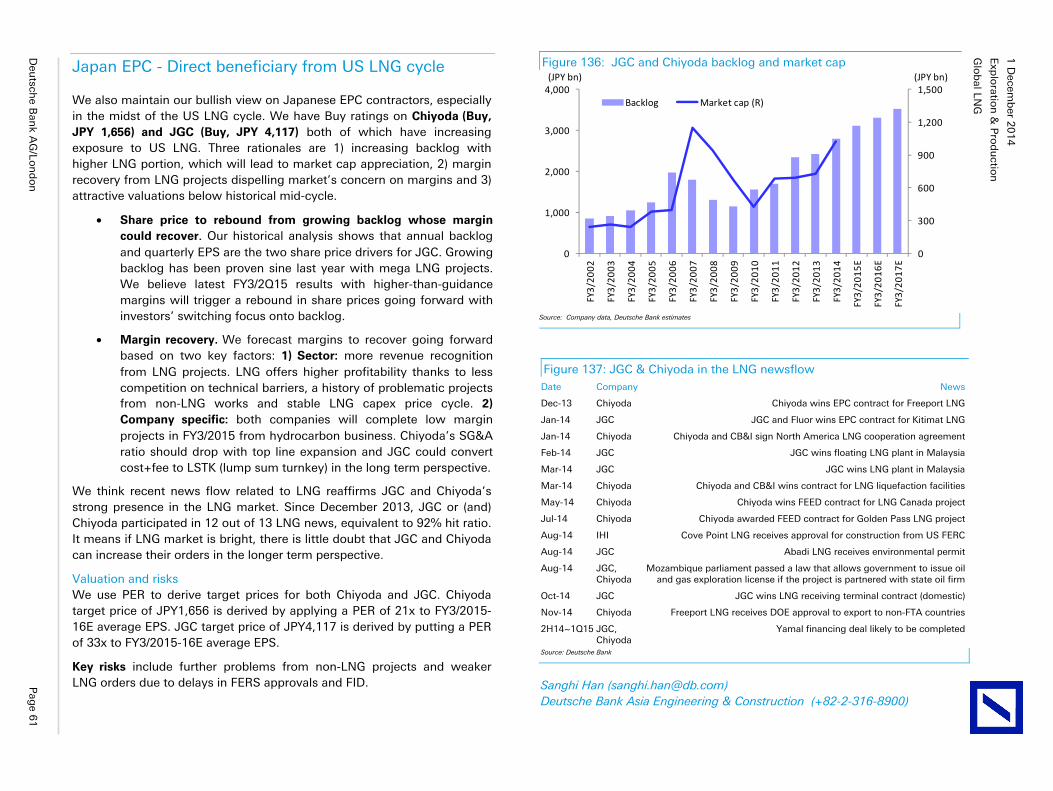
Glo
bal LN
G
Exp
loratio
n &
Pro
du
ction
1 D
ecemb
er 20
14
Deu
tsche B
ank A
G/Lo
nd
on
P
age 6
1
Japan EPC - Direct beneficiary from US LNG cycle
We also maintain our bullish view on Japanese EPC contractors, especially in the midst of the US LNG cycle. We have Buy ratings on Chiyoda (Buy, JPY 1,656) and JGC (Buy, JPY 4,117) both of which have increasing exposure to US LNG. Three rationales are 1) increasing backlog with higher LNG portion, which will lead to market cap appreciation, 2) margin recovery from LNG projects dispelling market’s concern on margins and 3) attractive valuations below historical mid-cycle.
• Share price to rebound from growing backlog whose margin could recover. Our historical analysis shows that annual backlog and quarterly EPS are the two share price drivers for JGC. Growing backlog has been proven sine last year with mega LNG projects. We believe latest FY3/2Q15 results with higher-than-guidance margins will trigger a rebound in share prices going forward with investors’ switching focus onto backlog.
• Margin recovery. We forecast margins to recover going forward based on two key factors: 1) Sector: more revenue recognition from LNG projects. LNG offers higher profitability thanks to less competition on technical barriers, a history of problematic projects from non-LNG works and stable LNG capex price cycle. 2) Company specific: both companies will complete low margin projects in FY3/2015 from hydrocarbon business. Chiyoda’s SG&A ratio should drop with top line expansion and JGC could convert cost+fee to LSTK (lump sum turnkey) in the long term perspective.
We think recent news flow related to LNG reaffirms JGC and Chiyoda’s strong presence in the LNG market. Since December 2013, JGC or (and) Chiyoda participated in 12 out of 13 LNG news, equivalent to 92% hit ratio. It means if LNG market is bright, there is little doubt that JGC and Chiyoda can increase their orders in the longer term perspective.
Valuation and risks We use PER to derive target prices for both Chiyoda and JGC. Chiyoda target price of JPY1,656 is derived by applying a PER of 21x to FY3/2015-16E average EPS. JGC target price of JPY4,117 is derived by putting a PER of 33x to FY3/2015-16E average EPS.
Key risks include further problems from non-LNG projects and weaker LNG orders due to delays in FERS approvals and FID.
Figure 137: JGC & Chiyoda in the LNG newsflow Date Company News
Dec-13 Chiyoda Chiyoda wins EPC contract for Freeport LNG
Jan-14 JGC JGC and Fluor wins EPC contract for Kitimat LNG
Jan-14 Chiyoda Chiyoda and CB&I sign North America LNG cooperation agreement
Feb-14 JGC JGC wins floating LNG plant in Malaysia
Mar-14 JGC JGC wins LNG plant in Malaysia
Mar-14 Chiyoda Chiyoda and CB&I wins contract for LNG liquefaction facilities
May-14 Chiyoda Chiyoda wins FEED contract for LNG Canada project
Jul-14 Chiyoda Chiyoda awarded FEED contract for Golden Pass LNG project
Aug-14 IHI Cove Point LNG receives approval for construction from US FERC
Aug-14 JGC Abadi LNG receives environmental permit
Aug-14 JGC, Chiyoda
Mozambique parliament passed a law that allows government to issue oil and gas exploration license if the project is partnered with state oil firm
Oct-14 JGC JGC wins LNG receiving terminal contract (domestic)
Nov-14 Chiyoda Freeport LNG receives DOE approval to export to non-FTA countries
2H14~1Q15 JGC, Chiyoda
Yamal financing deal likely to be completed
Source: Deutsche Bank
Sanghi Han ([email protected]) Deutsche Bank Asia Engineering & Construction (+82-2-316-8900)
Figure 136: JGC and Chiyoda backlog and market cap
0
300
600
900
1,200
1,500
0
1,000
2,000
3,000
4,000
FY3/
2002
FY3/
2003
FY3/
2004
FY3/
2005
FY3/
2006
FY3/
2007
FY3/
2008
FY3/
2009
FY3/
2010
FY3/
2011
FY3/
2012
FY3/
2013
FY3/
2014
FY3/
2015
E
FY3/
2016
E
FY3/
2017
E
Backlog Market cap (R)
(JPY bn)(JPY bn)
Source: Company data, Deutsche Bank estimates
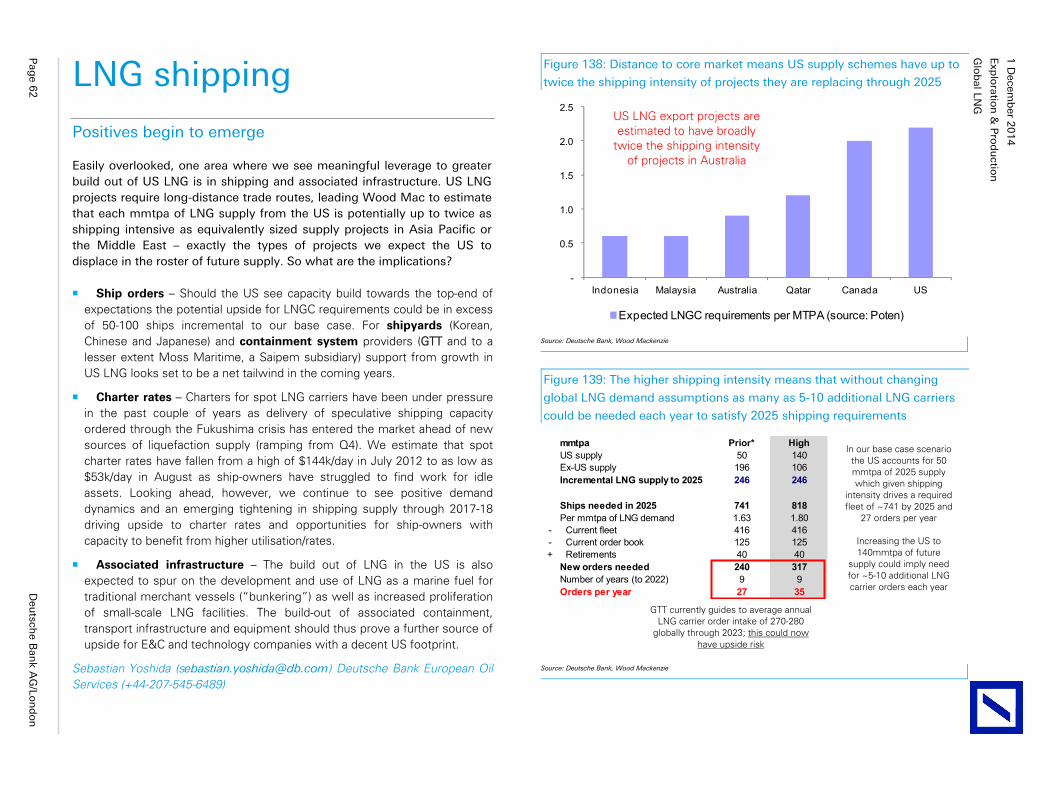
Glo
bal LN
G
Exp
loratio
n &
Pro
du
ction
1 D
ecemb
er 20
14
Pag
e 62
D
eutsch
e Ban
k AG
/Lon
do
n
LNG shipping
Positives begin to emerge
Easily overlooked, one area where we see meaningful leverage to greater build out of US LNG is in shipping and associated infrastructure. US LNG projects require long-distance trade routes, leading Wood Mac to estimate that each mmtpa of LNG supply from the US is potentially up to twice as shipping intensive as equivalently sized supply projects in Asia Pacific or the Middle East – exactly the types of projects we expect the US to displace in the roster of future supply. So what are the implications?
Ship orders – Should the US see capacity build towards the top-end of expectations the potential upside for LNGC requirements could be in excess of 50-100 ships incremental to our base case. For shipyards (Korean, Chinese and Japanese) and containment system providers (GTT and to a lesser extent Moss Maritime, a Saipem subsidiary) support from growth in US LNG looks set to be a net tailwind in the coming years.
Charter rates – Charters for spot LNG carriers have been under pressure in the past couple of years as delivery of speculative shipping capacity ordered through the Fukushima crisis has entered the market ahead of new sources of liquefaction supply (ramping from Q4). We estimate that spot charter rates have fallen from a high of $144k/day in July 2012 to as low as $53k/day in August as ship-owners have struggled to find work for idle assets. Looking ahead, however, we continue to see positive demand dynamics and an emerging tightening in shipping supply through 2017-18 driving upside to charter rates and opportunities for ship-owners with capacity to benefit from higher utilisation/rates.
Associated infrastructure – The build out of LNG in the US is also expected to spur on the development and use of LNG as a marine fuel for traditional merchant vessels (“bunkering”) as well as increased proliferation of small-scale LNG facilities. The build-out of associated containment, transport infrastructure and equipment should thus prove a further source of upside for E&C and technology companies with a decent US footprint.
Sebastian Yoshida ([email protected]) Deutsche Bank European Oil Services (+44-207-545-6489)
Figure 138: Distance to core market means US supply schemes have up to
twice the shipping intensity of projects they are replacing through 2025
-
0.5
1.0
1.5
2.0
2.5
Indonesia Malaysia Australia Qatar Canada US
Expected LNGC requirements per MTPA (source: Poten)
Source: Deutsche Bank, Wood Mackenzie
Figure 139: The higher shipping intensity means that without changing
global LNG demand assumptions as many as 5-10 additional LNG carriers
could be needed each year to satisfy 2025 shipping requirements
mmtpa Prior* HighUS supply 50 140Ex-US supply 196 106Incremental LNG supply to 2025 246 246
Ships needed in 2025 741 818Per mmtpa of LNG demand 1.63 1.80
- Current fleet 416 416- Current order book 125 125+ Retirements 40 40
New orders needed 240 317Number of years (to 2022) 9 9Orders per year 27 35
Source: Deutsche Bank, Wood Mackenzie
US LNG export projects are estimated to have broadly
twice the shipping intensity of projects in Australia
In our base case scenario the US accounts for 50 mmtpa of 2025 supply which given shipping
intensity drives a required fleet of ~741 by 2025 and
27 orders per year
Increasing the US to 140mmtpa of future
supply could imply need for ~5-10 additional LNG carrier orders each year
GTT currently guides to average annual
LNG carrier order intake of 270-280 globally through 2023; this could now
have upside risk
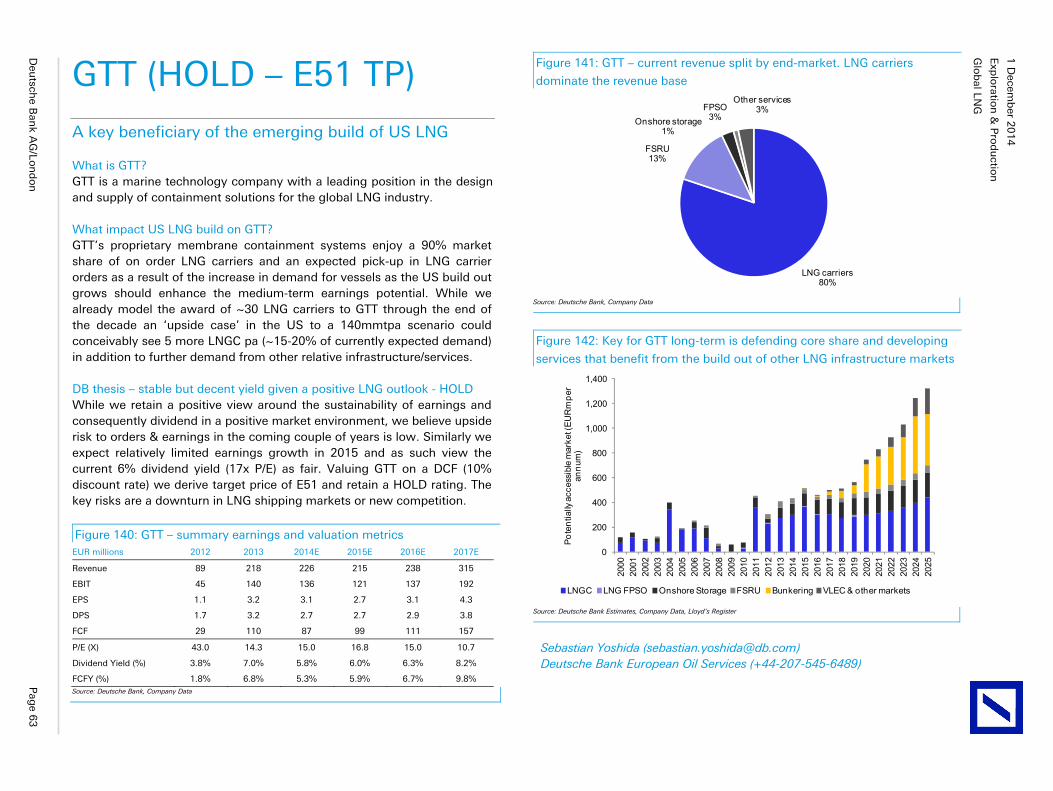
Glo
bal LN
G
Exp
loratio
n &
Pro
du
ction
1 D
ecemb
er 20
14
Deu
tsche B
ank A
G/Lo
nd
on
P
age 6
3
GTT (HOLD – E51 TP)
A key beneficiary of the emerging build of US LNG
What is GTT? GTT is a marine technology company with a leading position in the design and supply of containment solutions for the global LNG industry. What impact US LNG build on GTT? GTT’s proprietary membrane containment systems enjoy a 90% market share of on order LNG carriers and an expected pick-up in LNG carrier orders as a result of the increase in demand for vessels as the US build out grows should enhance the medium-term earnings potential. While we already model the award of ~30 LNG carriers to GTT through the end of the decade an ‘upside case’ in the US to a 140mmtpa scenario could conceivably see 5 more LNGC pa (~15-20% of currently expected demand) in addition to further demand from other relative infrastructure/services.
DB thesis – stable but decent yield given a positive LNG outlook - HOLD While we retain a positive view around the sustainability of earnings and consequently dividend in a positive market environment, we believe upside risk to orders & earnings in the coming couple of years is low. Similarly we expect relatively limited earnings growth in 2015 and as such view the current 6% dividend yield (17x P/E) as fair. Valuing GTT on a DCF (10% discount rate) we derive target price of E51 and retain a HOLD rating. The key risks are a downturn in LNG shipping markets or new competition.
Figure 140: GTT – summary earnings and valuation metrics EUR millions 2012 2013 2014E 2015E 2016E 2017E
Revenue 89 218 226 215 238 315
EBIT 45 140 136 121 137 192
EPS 1.1 3.2 3.1 2.7 3.1 4.3
DPS 1.7 3.2 2.7 2.7 2.9 3.8
FCF 29 110 87 99 111 157
P/E (X) 43.0 14.3 15.0 16.8 15.0 10.7
Dividend Yield (%) 3.8% 7.0% 5.8% 6.0% 6.3% 8.2%
FCFY (%) 1.8% 6.8% 5.3% 5.9% 6.7% 9.8% Source: Deutsche Bank, Company Data
Sebastian Yoshida ([email protected]) Deutsche Bank European Oil Services (+44-207-545-6489)
Figure 141: GTT – current revenue split by end-market. LNG carriers
dominate the revenue base
LNG carriers80%
FSRU13%
FPSO3%Onshore storage
1%
Other services3%
Source: Deutsche Bank, Company Data
Figure 142: Key for GTT long-term is defending core share and developing
services that benefit from the build out of other LNG infrastructure markets
0
200
400
600
800
1,000
1,200
1,400
2000
2001
2002
2003
2004
2005
2006
2007
2008
2009
2010
2011
2012
2013
2014
2015
2016
2017
2018
2019
2020
2021
2022
2023
2024
2025
Pote
ntia
lly a
cces
sibl
e m
arke
t (EU
Rm
per
an
num
)LNGC LNG FPSO Onshore Storage FSRU Bunkering VLEC & other markets
Source: Deutsche Bank Estimates, Company Data, Lloyd’s Register
1 December 2014
Exploration & Production
Global LNG
Page 64 Deutsche Bank AG/London
Appendix 1
Important Disclosures Additional information available upon request Disclosure checklist
Company Ticker Recent price* Disclosure
Royal Dutch Shell plc RDSa.L 2,250.50 (GBp) 25 Nov 14 1,7,17,SD11
BG Group BG.L 1,055.47 (GBp) 25 Nov 14 14,15
Royal Dutch Shell Plc RDSb.L 2,357.50 (GBp) 25 Nov 14 1,7,17,SD11
Total SA TOTF.PA 47.68 (EUR) 25 Nov 14 1,6,7,14,17 *Prices are current as of the end of the previous trading session unless otherwise indicated and are sourced from local exchanges via Reuters, Bloomberg and other vendors . Data is sourced from Deutsche Bank and subject companies. Important Disclosures Required by U.S. Regulators
Disclosures marked with an asterisk may also be required by at least one jurisdiction in addition to the United States. See Important Disclosures Required by Non-US Regulators and Explanatory Notes.
1. Within the past year, Deutsche Bank and/or its affiliate(s) has managed or co-managed a public or private offering for this company, for which it received fees.
6. Deutsche Bank and/or its affiliate(s) owns one percent or more of any class of common equity securities of this company calculated under computational methods required by US law.
7. Deutsche Bank and/or its affiliate(s) has received compensation from this company for the provision of investment banking or financial advisory services within the past year.
14. Deutsche Bank and/or its affiliate(s) has received non-investment banking related compensation from this company within the past year.
15. This company has been a client of Deutsche Bank Securities Inc. within the past year, during which time it received non-investment banking securities-related services.
Important Disclosures Required by Non-U.S. Regulators
Please also refer to disclosures in the Important Disclosures Required by US Regulators and the Explanatory Notes.
1. Within the past year, Deutsche Bank and/or its affiliate(s) has managed or co-managed a public or private offering for this company, for which it received fees.
6. Deutsche Bank and/or its affiliate(s) owns one percent or more of any class of common equity securities of this company calculated under computational methods required by US law.
7. Deutsche Bank and/or its affiliate(s) has received compensation from this company for the provision of investment banking or financial advisory services within the past year.
17. Deutsche Bank and or/its affiliate(s) has a significant Non-Equity financial interest (this can include Bonds, Convertible Bonds, Credit Derivatives and Traded Loans) where the aggregate net exposure to the following issuer(s), or issuer(s) group, is more than 25m Euros.
Special Disclosures
11. A director of the covered company is a director of Deutsche Bank. For disclosures pertaining to recommendations or estimates made on securities other than the primary subject of this research, please see the most recently published company report or visit our global disclosure look-up page on our website at http://gm.db.com/ger/disclosure/DisclosureDirectory.eqsr
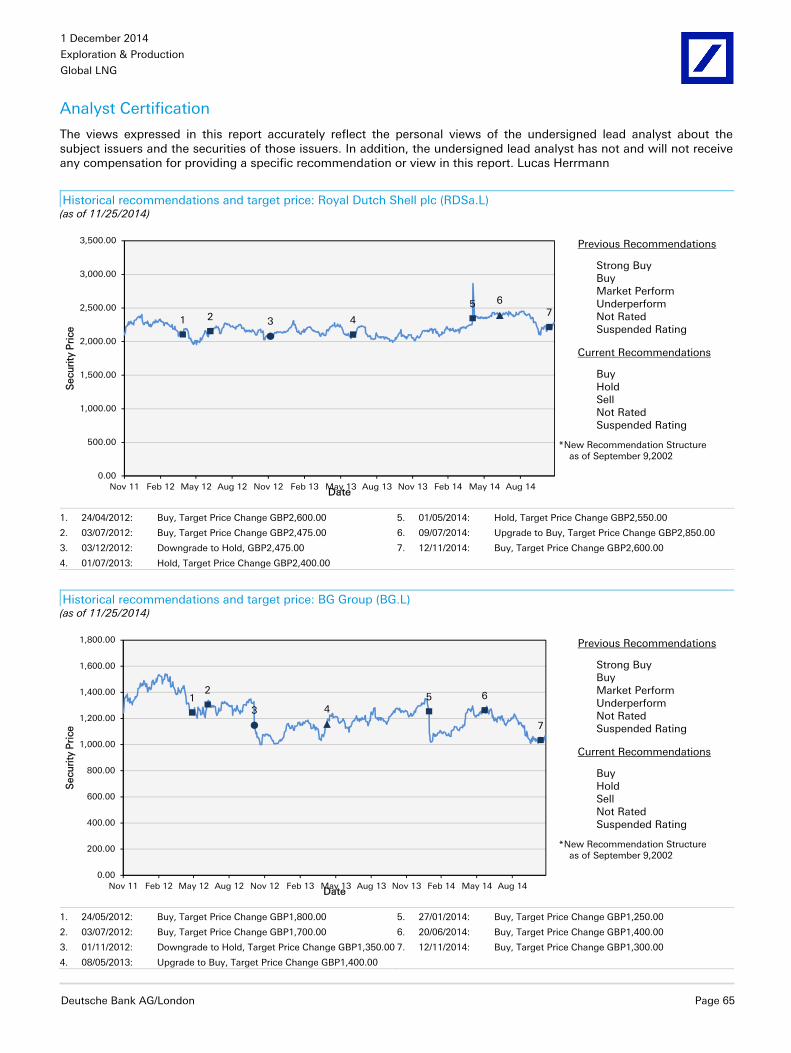
1 December 2014
Exploration & Production
Global LNG
Deutsche Bank AG/London Page 65
Analyst Certification
The views expressed in this report accurately reflect the personal views of the undersigned lead analyst about the subject issuers and the securities of those issuers. In addition, the undersigned lead analyst has not and will not receive any compensation for providing a specific recommendation or view in this report. Lucas Herrmann
Historical recommendations and target price: Royal Dutch Shell plc (RDSa.L) (as of 11/25/2014)
1 2 3 4
5 67
0.00
500.00
1,000.00
1,500.00
2,000.00
2,500.00
3,000.00
3,500.00
Nov 11 Feb 12 May 12 Aug 12 Nov 12 Feb 13 May 13 Aug 13 Nov 13 Feb 14 May 14 Aug 14
Sec
urity
Pri
ce
Date
Previous Recommendations
Strong Buy Buy Market Perform Underperform Not Rated Suspended Rating
Current Recommendations
Buy Hold Sell Not Rated Suspended Rating
*New Recommendation Structure as of September 9,2002
1. 24/04/2012: Buy, Target Price Change GBP2,600.00 5. 01/05/2014: Hold, Target Price Change GBP2,550.00
2. 03/07/2012: Buy, Target Price Change GBP2,475.00 6. 09/07/2014: Upgrade to Buy, Target Price Change GBP2,850.00
3. 03/12/2012: Downgrade to Hold, GBP2,475.00 7. 12/11/2014: Buy, Target Price Change GBP2,600.00
4. 01/07/2013: Hold, Target Price Change GBP2,400.00
Historical recommendations and target price: BG Group (BG.L) (as of 11/25/2014)
12
3 45 6
7
0.00
200.00
400.00
600.00
800.00
1,000.00
1,200.00
1,400.00
1,600.00
1,800.00
Nov 11 Feb 12 May 12 Aug 12 Nov 12 Feb 13 May 13 Aug 13 Nov 13 Feb 14 May 14 Aug 14
Sec
urit
y P
rice
Date
Previous Recommendations
Strong Buy Buy Market Perform Underperform Not Rated Suspended Rating
Current Recommendations
Buy Hold Sell Not Rated Suspended Rating
*New Recommendation Structure as of September 9,2002
1. 24/05/2012: Buy, Target Price Change GBP1,800.00 5. 27/01/2014: Buy, Target Price Change GBP1,250.00
2. 03/07/2012: Buy, Target Price Change GBP1,700.00 6. 20/06/2014: Buy, Target Price Change GBP1,400.00
3. 01/11/2012: Downgrade to Hold, Target Price Change GBP1,350.00 7. 12/11/2014: Buy, Target Price Change GBP1,300.00
4. 08/05/2013: Upgrade to Buy, Target Price Change GBP1,400.00
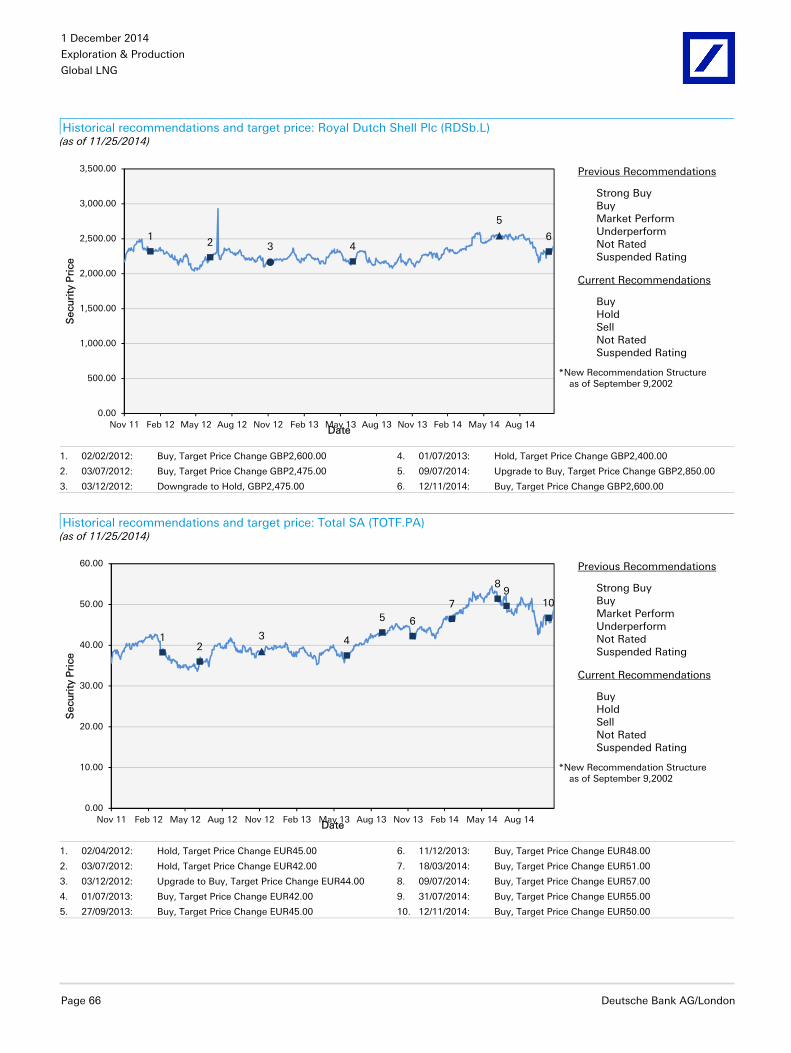
1 December 2014
Exploration & Production
Global LNG
Page 66 Deutsche Bank AG/London
Historical recommendations and target price: Royal Dutch Shell Plc (RDSb.L) (as of 11/25/2014)
12 3 4
5
6
0.00
500.00
1,000.00
1,500.00
2,000.00
2,500.00
3,000.00
3,500.00
Nov 11 Feb 12 May 12 Aug 12 Nov 12 Feb 13 May 13 Aug 13 Nov 13 Feb 14 May 14 Aug 14
Sec
uri
ty P
rice
Date
Previous Recommendations
Strong Buy Buy Market Perform Underperform Not Rated Suspended Rating
Current Recommendations
Buy Hold Sell Not Rated Suspended Rating
*New Recommendation Structure as of September 9,2002
1. 02/02/2012: Buy, Target Price Change GBP2,600.00 4. 01/07/2013: Hold, Target Price Change GBP2,400.00
2. 03/07/2012: Buy, Target Price Change GBP2,475.00 5. 09/07/2014: Upgrade to Buy, Target Price Change GBP2,850.00
3. 03/12/2012: Downgrade to Hold, GBP2,475.00 6. 12/11/2014: Buy, Target Price Change GBP2,600.00
Historical recommendations and target price: Total SA (TOTF.PA) (as of 11/25/2014)
12
3 4
5 6
7
89
10
0.00
10.00
20.00
30.00
40.00
50.00
60.00
Nov 11 Feb 12 May 12 Aug 12 Nov 12 Feb 13 May 13 Aug 13 Nov 13 Feb 14 May 14 Aug 14
Sec
urit
y P
rice
Date
Previous Recommendations
Strong Buy Buy Market Perform Underperform Not Rated Suspended Rating
Current Recommendations
Buy Hold Sell Not Rated Suspended Rating
*New Recommendation Structure as of September 9,2002
1. 02/04/2012: Hold, Target Price Change EUR45.00 6. 11/12/2013: Buy, Target Price Change EUR48.00
2. 03/07/2012: Hold, Target Price Change EUR42.00 7. 18/03/2014: Buy, Target Price Change EUR51.00
3. 03/12/2012: Upgrade to Buy, Target Price Change EUR44.00 8. 09/07/2014: Buy, Target Price Change EUR57.00
4. 01/07/2013: Buy, Target Price Change EUR42.00 9. 31/07/2014: Buy, Target Price Change EUR55.00
5. 27/09/2013: Buy, Target Price Change EUR45.00 10. 12/11/2014: Buy, Target Price Change EUR50.00
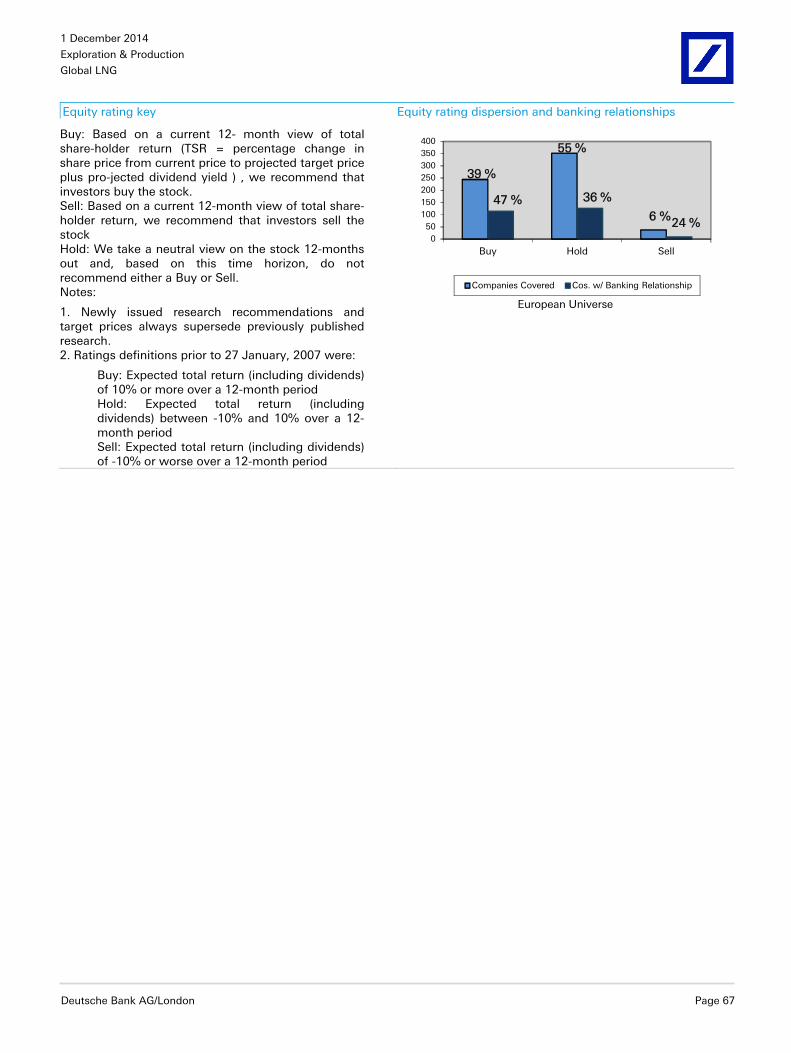
1 December 2014
Exploration & Production
Global LNG
Deutsche Bank AG/London Page 67
Equity rating key Equity rating dispersion and banking relationships
Buy: Based on a current 12- month view of total share-holder return (TSR = percentage change in share price from current price to projected target price plus pro-jected dividend yield ) , we recommend that investors buy the stock. Sell: Based on a current 12-month view of total share-holder return, we recommend that investors sell the stock Hold: We take a neutral view on the stock 12-months out and, based on this time horizon, do not recommend either a Buy or Sell. Notes:
1. Newly issued research recommendations and target prices always supersede previously published research. 2. Ratings definitions prior to 27 January, 2007 were:
Buy: Expected total return (including dividends) of 10% or more over a 12-month period Hold: Expected total return (including dividends) between -10% and 10% over a 12-month period Sell: Expected total return (including dividends) of -10% or worse over a 12-month period
39 %
55 %
6 %47 % 36 %
24 %0
50
100150
200
250300
350400
Buy Hold Sell
European Universe
Companies Covered Cos. w/ Banking Relationship
1 December 2014
Exploration & Production
Global LNG
Page 68 Deutsche Bank AG/London
Regulatory Disclosures
1. Important Additional Conflict Disclosures Aside from within this report, important conflict disclosures can also be found at https://gm.db.com/equities under the "Disclosures Lookup" and "Legal" tabs. Investors are strongly encouraged to review this information before investing. 2. Short-Term Trade Ideas Deutsche Bank equity research analysts sometimes have shorter-term trade ideas (known as SOLAR ideas) that are consistent or inconsistent with Deutsche Bank's existing longer term ratings. These trade ideas can be found at the SOLAR link at http://gm.db.com. 3. Country-Specific Disclosures Australia and New Zealand: This research, and any access to it, is intended only for "wholesale clients" within the meaning of the Australian Corporations Act and New Zealand Financial Advisors Act respectively. Brazil: The views expressed above accurately reflect personal views of the authors about the subject company(ies) and its(their) securities, including in relation to Deutsche Bank. The compensation of the equity research analyst(s) is indirectly affected by revenues deriving from the business and financial transactions of Deutsche Bank. In cases where at least one Brazil based analyst (identified by a phone number starting with +55 country code) has taken part in the preparation of this research report, the Brazil based analyst whose name appears first assumes primary responsibility for its content from a Brazilian regulatory perspective and for its compliance with CVM Instruction # 483. EU countries: Disclosures relating to our obligations under MiFiD can be found at http://www.globalmarkets.db.com/riskdisclosures. Japan: Disclosures under the Financial Instruments and Exchange Law: Company name - Deutsche Securities Inc. Registration number - Registered as a financial instruments dealer by the Head of the Kanto Local Finance Bureau (Kinsho) No. 117. Member of associations: JSDA, Type II Financial Instruments Firms Association, The Financial Futures Association of Japan, Japan Investment Advisers Association. Commissions and risks involved in stock transactions - for stock transactions, we charge stock commissions and consumption tax by multiplying the transaction amount by the commission rate agreed with each customer. Stock transactions can lead to losses as a result of share price fluctuations and other factors. Transactions in foreign stocks can lead to additional losses stemming from foreign exchange fluctuations. "Moody's", "Standard & Poor's", and "Fitch" mentioned in this report are not registered credit rating agencies in Japan unless Japan or "Nippon" is specifically designated in the name of the entity. Reports on Japanese listed companies not written by analysts of Deutsche Securities Inc. (DSI) are written by Deutsche Bank Group's analysts with the coverage companies specified by DSI. Malaysia: Deutsche Bank AG and/or its affiliate(s) may maintain positions in the securities referred to herein and may from time to time offer those securities for purchase or may have an interest to purchase such securities. Deutsche Bank may engage in transactions in a manner inconsistent with the views discussed herein. Qatar: Deutsche Bank AG in the Qatar Financial Centre (registered no. 00032) is regulated by the Qatar Financial Centre Regulatory Authority. Deutsche Bank AG - QFC Branch may only undertake the financial services activities that fall within the scope of its existing QFCRA license. Principal place of business in the QFC: Qatar Financial Centre, Tower, West Bay, Level 5, PO Box 14928, Doha, Qatar. This information has been distributed by Deutsche Bank AG. Related financial products or services are only available to Business Customers, as defined by the Qatar Financial Centre Regulatory Authority. Russia: This information, interpretation and opinions submitted herein are not in the context of, and do not constitute, any appraisal or evaluation activity requiring a license in the Russian Federation. Kingdom of Saudi Arabia: Deutsche Securities Saudi Arabia LLC Company, (registered no. 07073-37) is regulated by the Capital Market Authority. Deutsche Securities Saudi Arabia may only undertake the financial services activities that fall within the scope of its existing CMA license. Principal place of business in Saudi Arabia: King Fahad Road, Al Olaya District, P.O. Box 301809, Faisaliah Tower - 17th Floor, 11372 Riyadh, Saudi Arabia. United Arab Emirates: Deutsche Bank AG in the Dubai International Financial Centre (registered no. 00045) is regulated by the Dubai Financial Services Authority. Deutsche Bank AG - DIFC Branch may only undertake the financial services activities that fall within the scope of its existing DFSA license. Principal place of business in the DIFC: Dubai International Financial Centre, The Gate Village, Building 5, PO Box 504902, Dubai, U.A.E. This information has been distributed by Deutsche Bank AG. Related financial products or services are only available to Professional Clients, as defined by the Dubai Financial Services Authority.
GRCM2014PROD033267
David Folkerts-Landau
Group Chief Economist Member of the Group Executive Committee
Raj Hindocha
Global Chief Operating Officer Research
Marcel Cassard Global Head
FICC Research & Global Macro Economics
Richard Smith and Steve Pollard Co-Global Heads Equity Research
Michael Spencer Regional Head
Asia Pacific Research
Ralf Hoffmann Regional Head
Deutsche Bank Research, Germany
Andreas Neubauer Regional Head
Equity Research, Germany
Steve Pollard Regional Head
Americas Research
International locations
Deutsche Bank AG Deutsche Bank Place Level 16 Corner of Hunter & Phillip Streets Sydney, NSW 2000 Australia Tel: (61) 2 8258 1234
Deutsche Bank AG Große Gallusstraße 10-14 60272 Frankfurt am Main Germany Tel: (49) 69 910 00
Deutsche Bank AG Filiale Hongkong International Commerce Centre, 1 Austin Road West,Kowloon, Hong Kong Tel: (852) 2203 8888
Deutsche Securities Inc. 2-11-1 Nagatacho Sanno Park Tower Chiyoda-ku, Tokyo 100-6171 Japan Tel: (81) 3 5156 6770
Deutsche Bank AG London 1 Great Winchester Street London EC2N 2EQ United Kingdom Tel: (44) 20 7545 8000
Deutsche Bank Securities Inc. 60 Wall Street New York, NY 10005 United States of America Tel: (1) 212 250 2500
Global Disclaimer The information and opinions in this report were prepared by Deutsche Bank AG or one of its affiliates (collectively "Deutsche Bank"). The information herein is believed to be reliable and has been obtained from public sources believed to be reliable. Deutsche Bank makes no representation as to the accuracy or completeness of such information.
Deutsche Bank may engage in securities transactions, on a proprietary basis or otherwise, in a manner inconsistent with the view taken in this research report. In addition, others within Deutsche Bank, including strategists and sales staff, may take a view that is inconsistent with that taken in this research report.
Opinions, estimates and projections in this report constitute the current judgement of the author as of the date of this report. They do not necessarily reflect the opinions of Deutsche Bank and are subject to change without notice. Deutsche Bank has no obligation to update, modify or amend this report or to otherwise notify a recipient thereof in the event that any opinion, forecast or estimate set forth herein, changes or subsequently becomes inaccurate. Prices and availability of financial instruments are subject to change without notice. This report is provided for informational purposes only. It is not an offer or a solicitation of an offer to buy or sell any financial instruments or to participate in any particular trading strategy. Target prices are inherently imprecise and a product of the analyst judgement.
In August 2009, Deutsche Bank instituted a new policy whereby analysts may choose not to set or maintain a target price of certain issuers under coverage with a Hold rating. In particular, this will typically occur for "Hold" rated stocks having a market cap smaller than most other companies in its sector or region. We believe that such policy will allow us to make best use of our resources. Please visit our website at http://gm.db.com to determine the target price of any stock.
The financial instruments discussed in this report may not be suitable for all investors and investors must make their own informed investment decisions. Stock transactions can lead to losses as a result of price fluctuations and other factors. If a financial instrument is denominated in a currency other than an investor's currency, a change in exchange rates may adversely affect the investment. Past performance is not necessarily indicative of future results. Deutsche Bank may with respect to securities covered by this report, sell to or buy from customers on a principal basis, and consider this report in deciding to trade on a proprietary basis. Prices are current as of the end of the previous trading session unless otherwise indicated and are sourced from local exchanges via Reuters, Bloomberg and other vendors. Data is sourced from Deutsche Bank and subject companies.
Unless governing law provides otherwise, all transactions should be executed through the Deutsche Bank entity in the investor's home jurisdiction. In the U.S. this report is approved and/or distributed by Deutsche Bank Securities Inc., a member of the NYSE, the NASD, NFA and SIPC. In Germany this report is approved and/or communicated by Deutsche Bank AG Frankfurt authorized by the BaFin. In the United Kingdom this report is approved and/or communicated by Deutsche Bank AG London, a member of the London Stock Exchange and regulated by the Financial Conduct Authority for the conduct of investment business in the UK and authorized by the BaFin. This report is distributed in Hong Kong by Deutsche Bank AG, Hong Kong Branch, in Korea by Deutsche Securities Korea Co. This report is distributed in Singapore by Deutsche Bank AG, Singapore Branch or Deutsche Securities Asia Limited, Singapore Branch (One Raffles Quay #18-00 South Tower Singapore 048583, +65 6423 8001), and recipients in Singapore of this report are to contact Deutsche Bank AG, Singapore Branch or Deutsche Securities Asia Limited, Singapore Branch in respect of any matters arising from, or in connection with, this report. Where this report is issued or promulgated in Singapore to a person who is not an accredited investor, expert investor or institutional investor (as defined in the applicable Singapore laws and regulations), Deutsche Bank AG, Singapore Branch or Deutsche Securities Asia Limited, Singapore Branch accepts legal responsibility to such person for the contents of this report. In Japan this report is approved and/or distributed by Deutsche Securities Inc. The information contained in this report does not constitute the provision of investment advice. In Australia, retail clients should obtain a copy of a Product Disclosure Statement (PDS) relating to any financial product referred to in this report and consider the PDS before making any decision about whether to acquire the product. Deutsche Bank AG Johannesburg is incorporated in the Federal Republic of Germany (Branch Register Number in South Africa: 1998/003298/10). Additional information relative to securities, other financial products or issuers discussed in this report is available upon request. This report may not be reproduced, distributed or published by any person for any purpose without Deutsche Bank's prior written consent. Please cite source when quoting.
Copyright © 2014 Deutsche Bank AG