Embed Size (px)
Citation preview
(date, event info here?)
SHARP
Mark Love / Hydrologist / SERFC
Supplemental
Hydro-
Analysis &
Response
Program
July2007
(date, event info here?)
Background / Motivation Background / Motivation
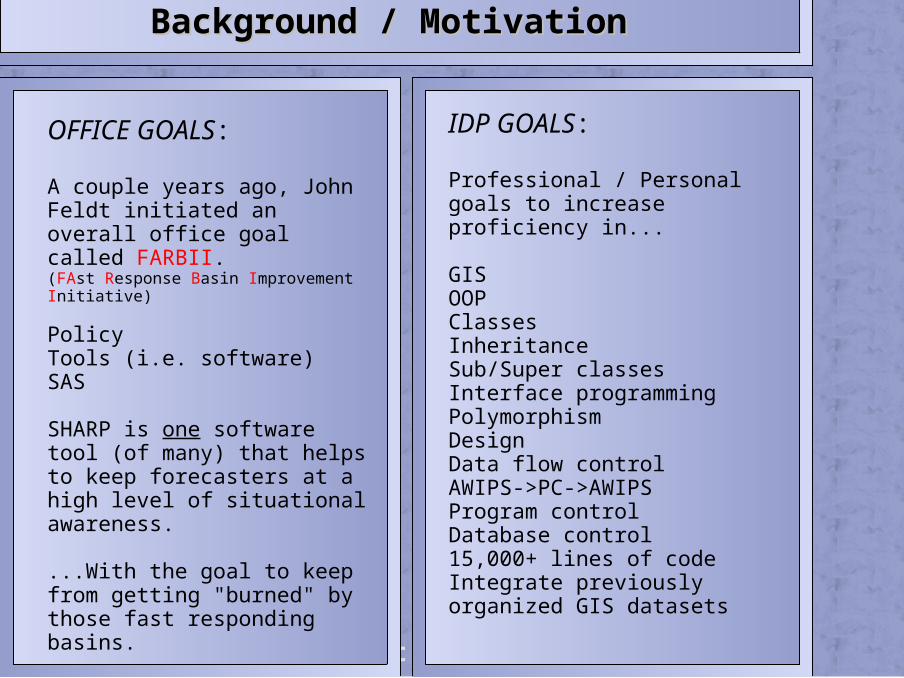
OFFICE GOALS: A couple years ago, John Feldt initiated an overall office goal called FARBII.(FAst Response Basin Improvement Initiative)
Policy Tools (i.e. software)SAS
SHARP is one software tool (of many) that helps to keep forecasters at a high level of situational awareness.
...With the goal to keep from getting "burned" by those fast responding basins.
IDP GOALS: Professional / Personal goals to increase proficiency in...
GISOOPClassesInheritanceSub/Super classesInterface programmingPolymorphismDesignData flow controlAWIPS->PC->AWIPSProgram controlDatabase control15,000+ lines of codeIntegrate previously organized GIS datasets
SHARP stands for…
S – Supplemental (to official systems) H – Hydro A – Analysis – lots of number crunching R – Looks for River Response P – Program
(date, event info here?)
The goal is to produce a "RiverWatch"-type program that will look for hydro problems and will produce alerts / products based on what it finds.
Create an alert for Segments that...
are currently flooding
are forecast to flood
are forecasts that need updating
are rising rapidly, but still below floodstage
Program GoalsProgram Goals
(date, event info here?)
Must…
Have an easy to use GUIHave a graphical display suitable for SASReal-time (up to 20min behind AWIPS) 24x7 operationAutomatic generation of hydrographs / products
for segments that satisfy “alert” criteria"On Demand" Hydrograph generation from GUIProducts sent back to AWIPS
Afterthoughts:
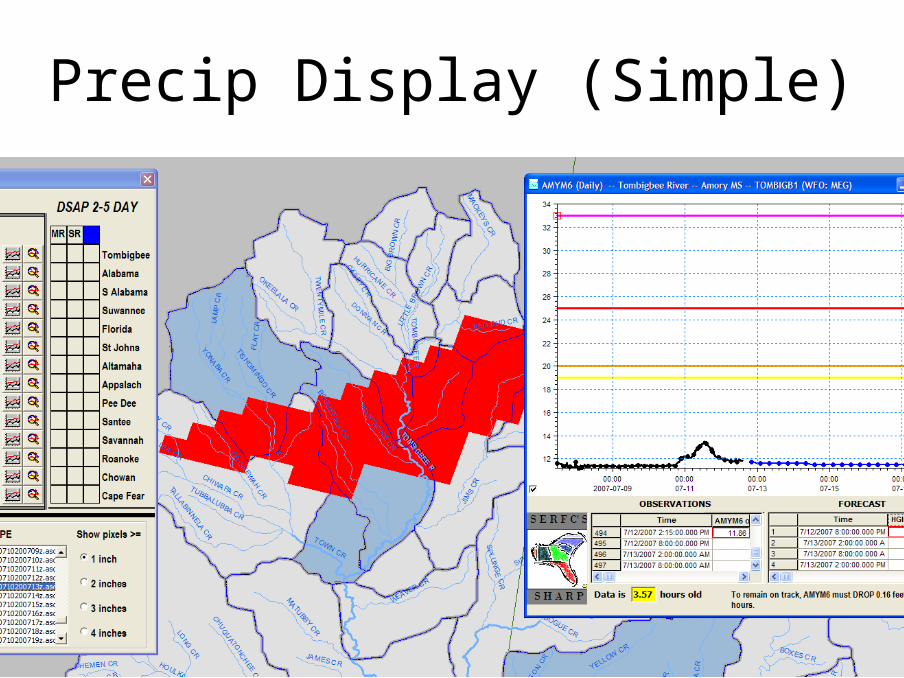
-DSAP (Daily Situational Awareness Product)-Precipitation Visualization (simple) – over fast responding basins-Web graphics (not quite there – orig meant for internal)-“Additional use” of picking up bad data
Additional GoalsAdditional Goals
(date, event info here?)
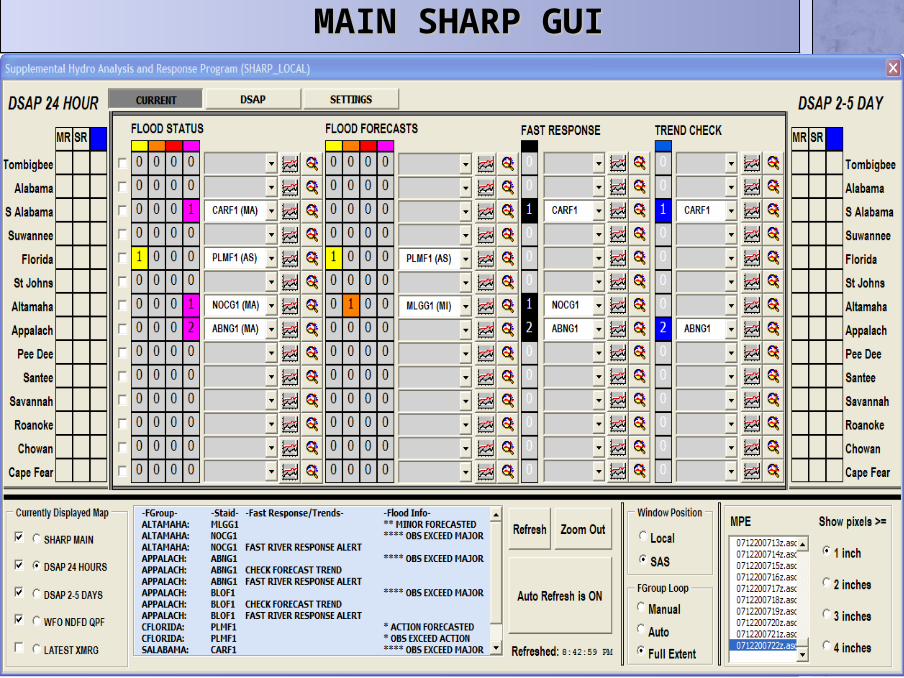
MAIN SHARP GUIMAIN SHARP GUI
(date, event info here?)
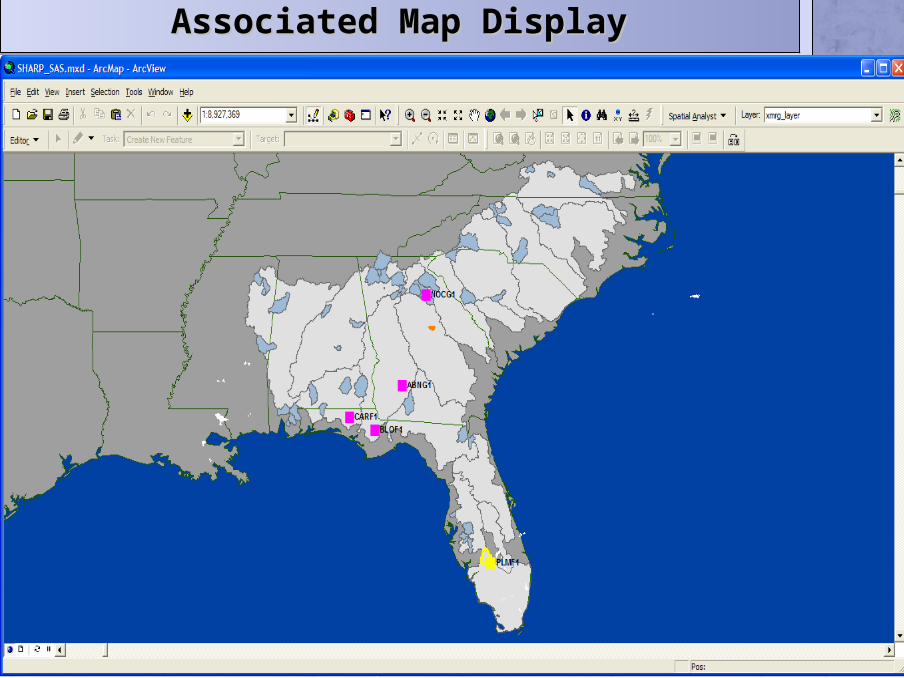
Associated Map DisplayAssociated Map Display
(date, event info here?)
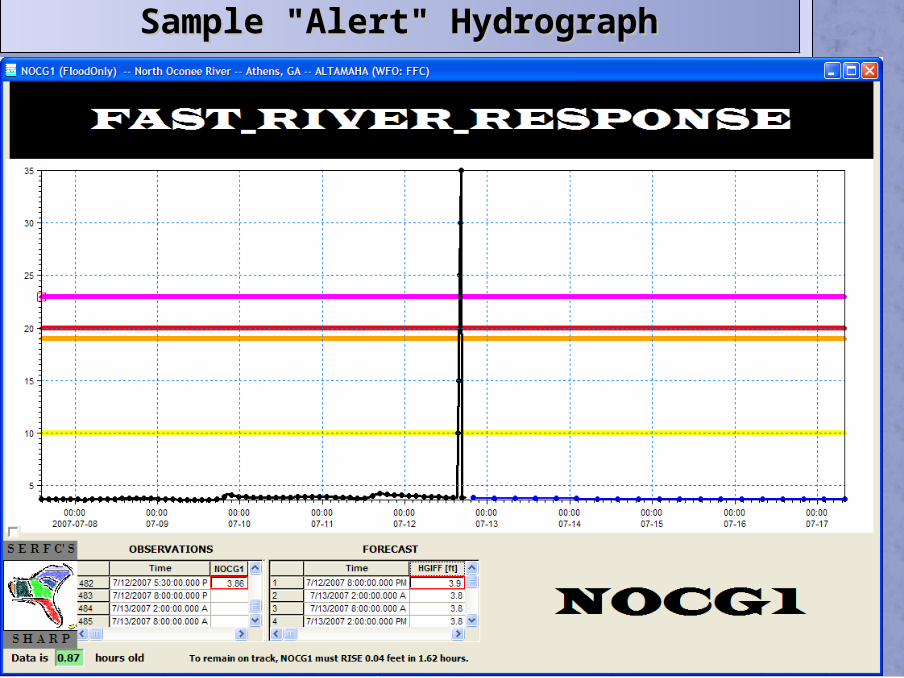
Sample "Alert" HydrographSample "Alert" Hydrograph
"MIKEOBJECTS" Timeseries Package(free objects to embed)
(date, event info here?)
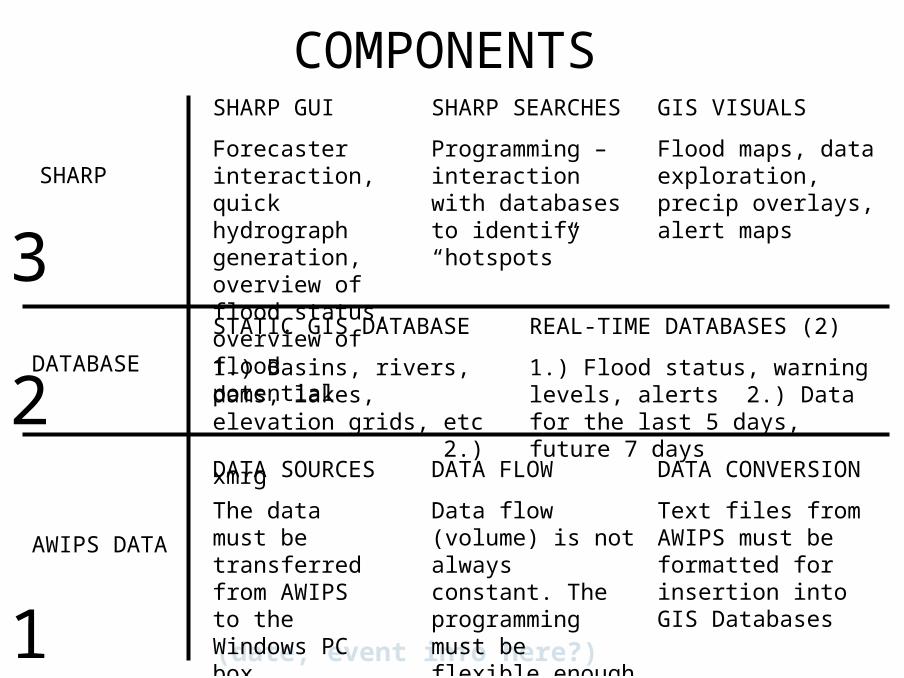
DATA SOURCES
The data must be transferred from AWIPS to the Windows PC box.
DATA FLOW
Data flow (volume) is not always constant. The programming must be flexible enough to have temporary storage.
REAL-TIME DATABASES (2)
1.) Flood status, warning levels, alerts 2.) Data for the last 5 days, future 7 days
STATIC GIS DATABASE
1.) Basins, rivers, dams, lakes, elevation grids, etc 2.) xmrg
DATA CONVERSION
Text files from AWIPS must be formatted for insertion into GIS Databases
GIS VISUALS
Flood maps, data exploration, precip overlays, alert maps
SHARP GUI
Forecaster interaction, quick hydrograph generation, overview of flood status, overview of flood potential
SHARP SEARCHES
Programming – interaction with databases to identify “hotspots”
SHARP
AWIPS DATA
DATABASE
COMPONENTS
1
3
2
(date, event info here?)
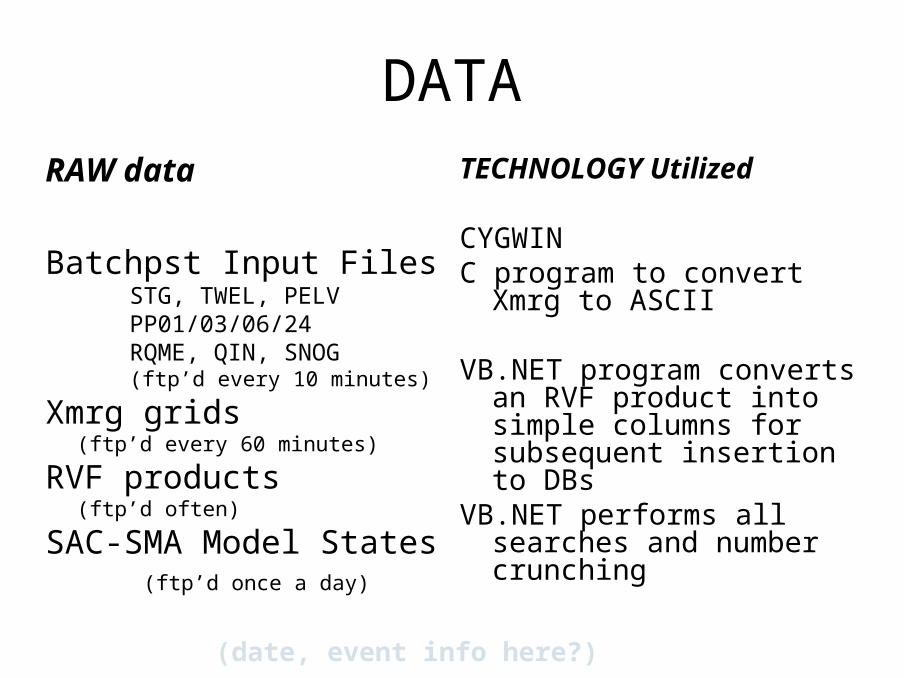
DATA
RAW data
Batchpst Input FilesSTG, TWEL, PELVPP01/03/06/24RQME, QIN, SNOG(ftp’d every 10 minutes)
Xmrg grids(ftp’d every 60 minutes)
RVF products(ftp’d often)
SAC-SMA Model States (ftp’d once a day)
TECHNOLOGY Utilized
CYGWINC program to convert Xmrg to
ASCII
VB.NET program converts an RVF product into simple columns for subsequent insertion to DBs
VB.NET performs all searches and number crunching
(date, event info here?)
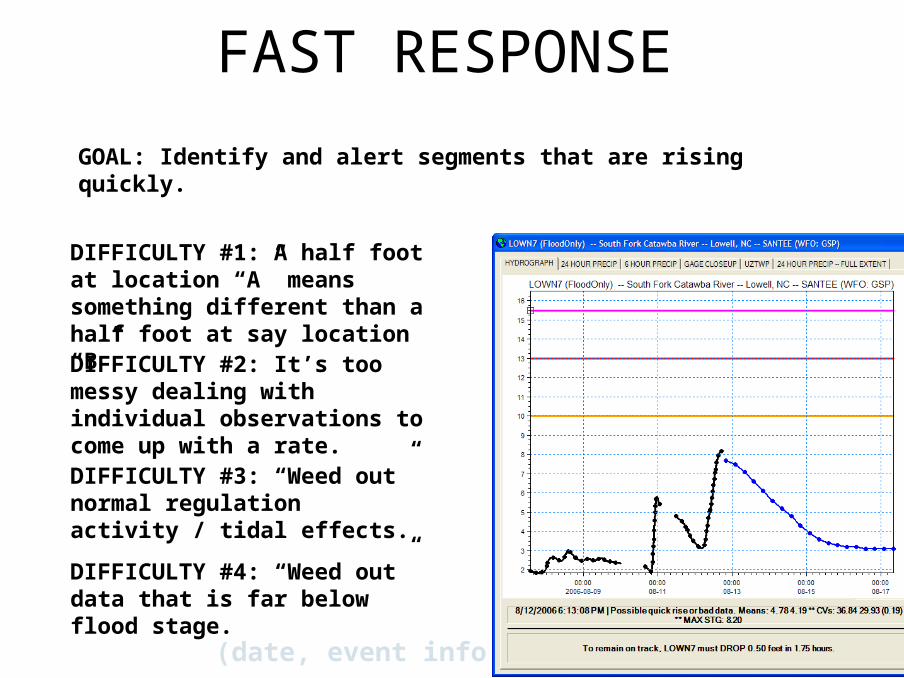
FAST RESPONSE
GOAL: Identify and alert segments that are rising quickly.
DIFFICULTY #1: A half foot at location “A” means something different than a half foot at say location “B”DIFFICULTY #2: It’s too messy dealing with individual observations to come up with a rate.DIFFICULTY #3: “Weed out” normal regulation activity / tidal effects.
DIFFICULTY #4: “Weed out” data that is far below flood stage.
(date, event info here?)
(date, event info here?)
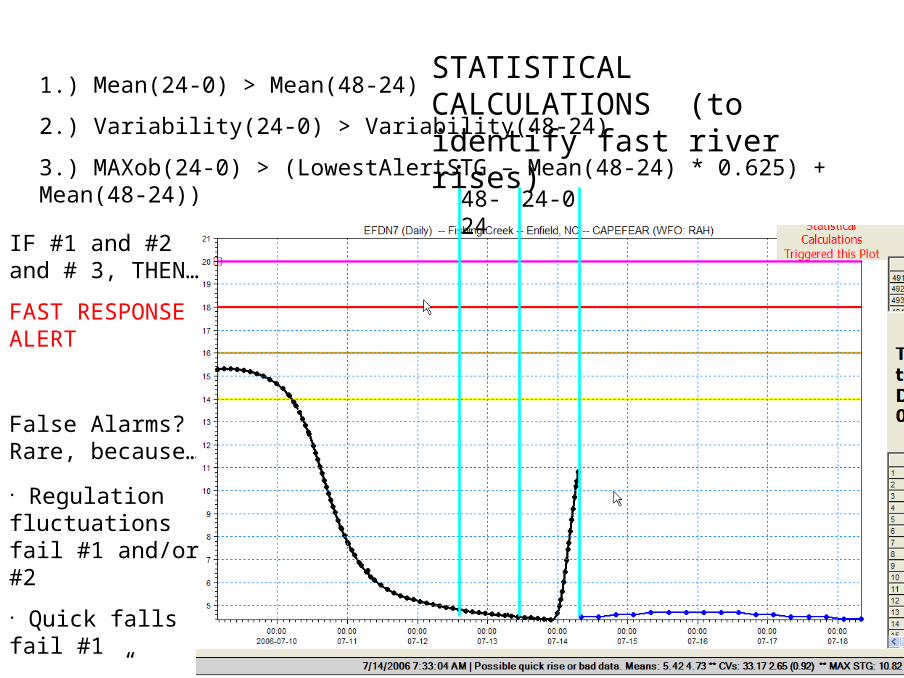
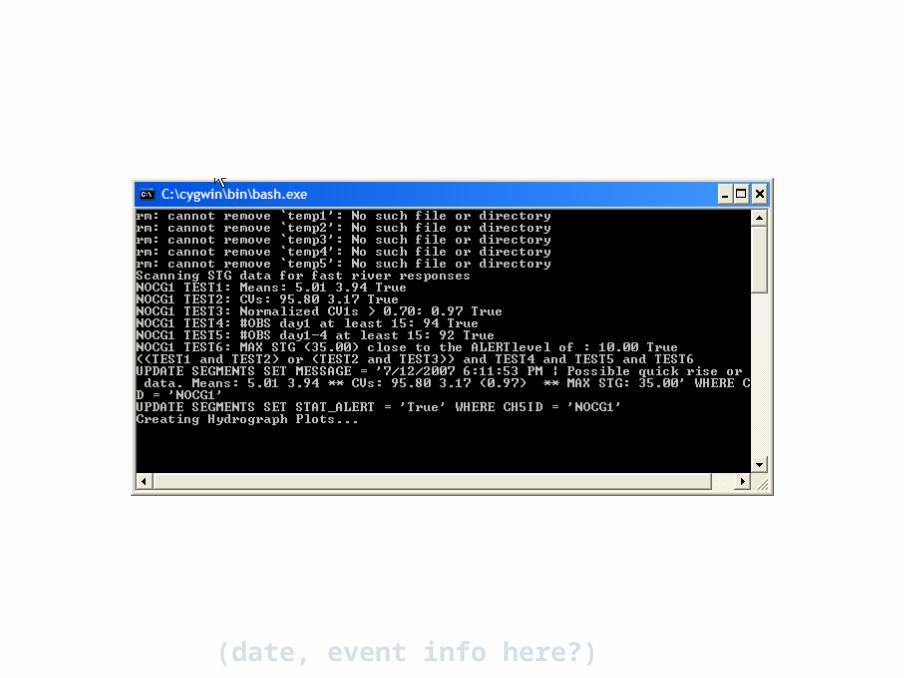
False Alarms? Rare, because…
24-048-24
1.) Mean(24-0) > Mean(48-24)
2.) Variability(24-0) > Variability(48-24)
3.) MAXob(24-0) > (LowestAlertSTG – Mean(48-24) * 0.625) + Mean(48-24))
STATISTICAL CALCULATIONS (to identify fast river rises)
• Regulation fluctuations fail #1 and/or #2
• Quick falls fail #1
• “Noise” is filtered by #3
IF #1 and #2 and # 3, THEN…
FAST RESPONSE ALERT
(date, event info here?)
(date, event info here?)
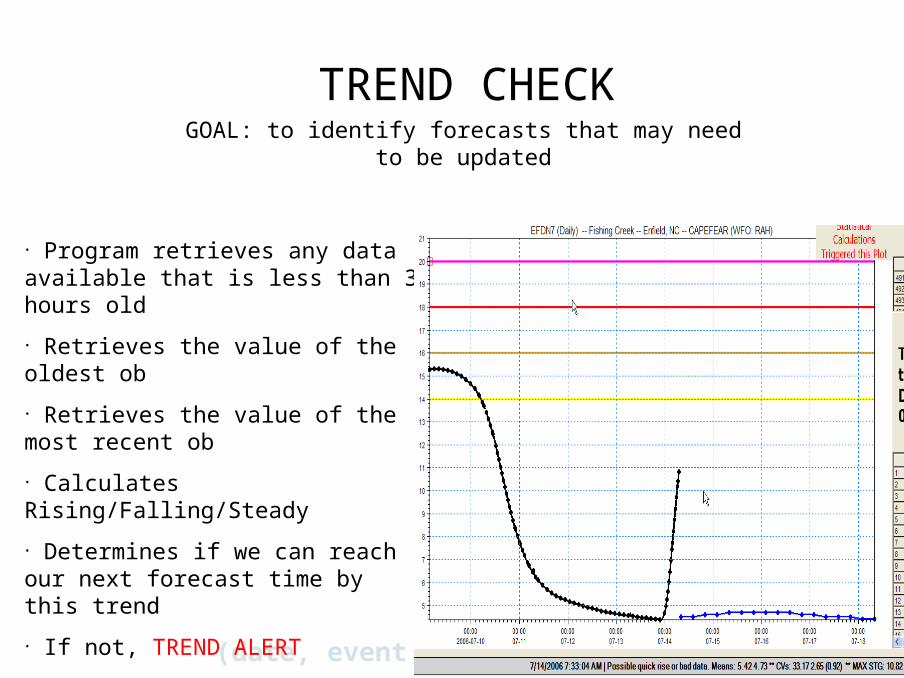
• Program retrieves any data available that is less than 3 hours old
• Retrieves the value of the oldest ob
• Retrieves the value of the most recent ob
• Calculates Rising/Falling/Steady
• Determines if we can reach our next forecast time by this trend
• If not, TREND ALERT
TREND CHECKGOAL: to identify forecasts that may need to be
updated
(date, event info here?)
Precip Display (Simple)
(date, event info here?)
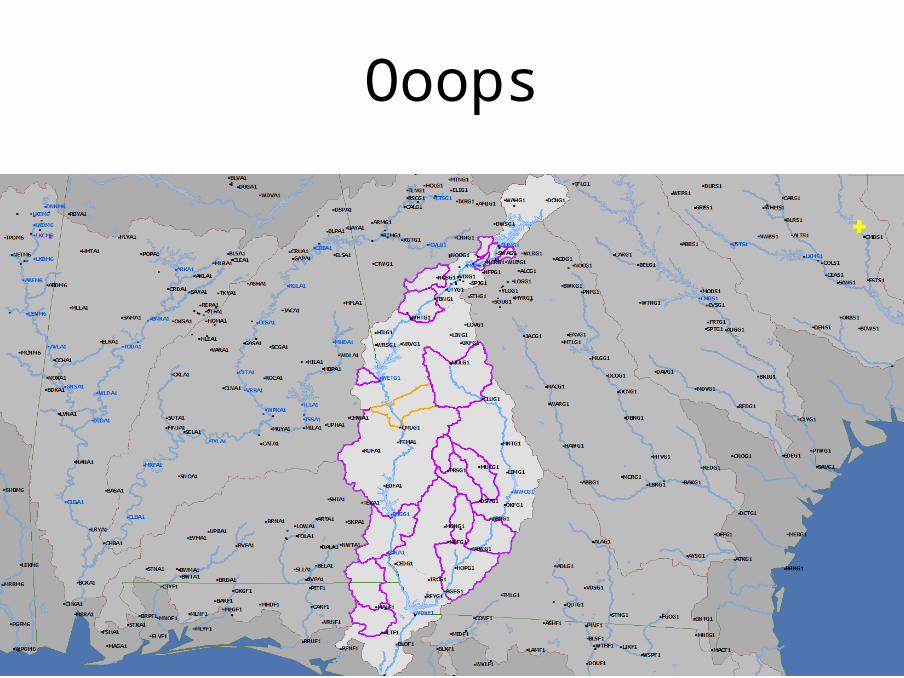
Ooops
(date, event info here?)
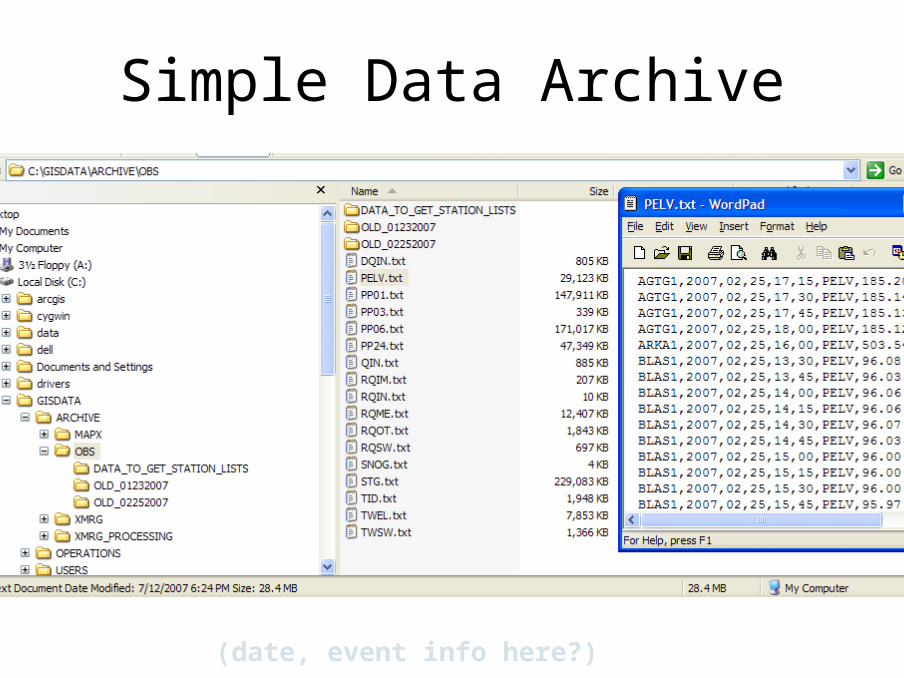
Simple Data Archive
(date, event info here?)
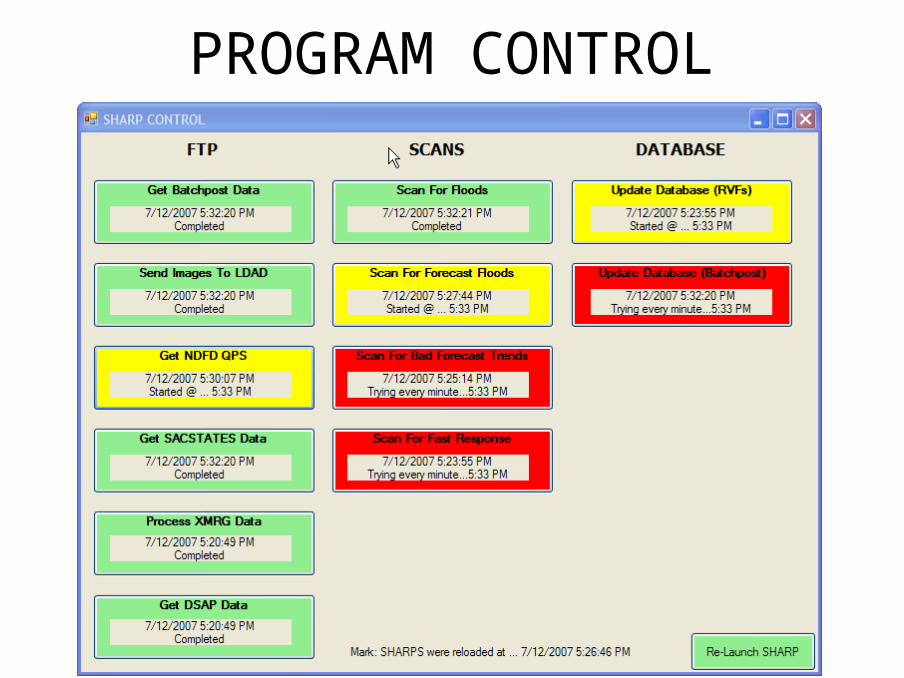
PROGRAM CONTROL
(date, event info here?)
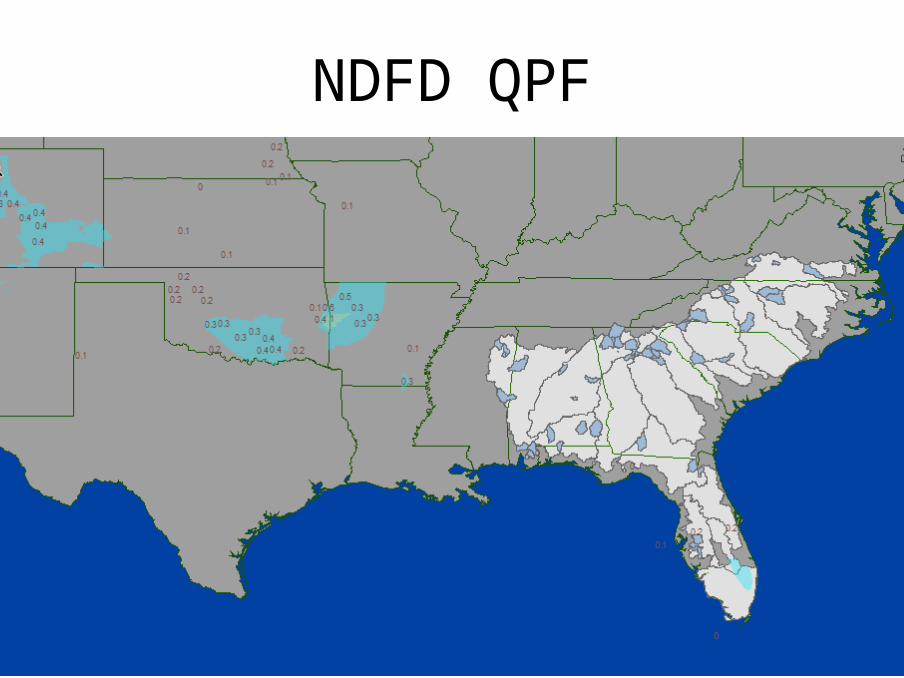
NDFD QPF

(date, event info here?)
Where to go from here?

(date, event info here?)
?