Embed Size (px)
DESCRIPTION
In this month’s issue, the editorial letter explores the influx and implications of microgrids on the power sector. The “In-Depth” article examines the history of oil since 1973. Focusing on the relations between the Middle East and Western economies, author Aiman El-Ramly shows how our present oil situation is the direct product of decades of geopolitical turmoil. Numerous short articles provide updates on EEX launching Nordic power futures, CME Group and GFI Group terminating their merger agreement, Deutsche Börse Market Data + Services becoming the exclusive licensor of PEGAS, and much more.
Citation preview

The Seven Ages of Oil:Boom and Bust, War and Peace,
Growth and Decline
By Aiman El-Ramly, C.S.O. ZE PowerGroup [email protected]
Part Two of Tw
o
New products and data sources
Delisting of products and data sources
Potential impact on data
Changes to data attributes, replacement of products
Powered by
FEBRUARY 2015

Summ
ary
February 2015
ContentsEditorial 5The Emerging Power Markets’ New Player – the Microgrid Operator 5
Power 7ICE Futures US Lists PJM, MISO, and SPP Power Futures Contracts 7EEX Launches Nordic Power Futures 8EEX Launches Online Shop for Market Data and New SFTP Server 8Italian Borders Market Coupling Launches 9Platts to Remove Descriptive Fields in North American Power CSV Files 9Platts to Discontinue UK High/Low Power Assessments 10APX and Dutch Energy Regulator Sign MOU on REMIT Implementation 10
Petroleum 11 Platts to Launch Rotterdam FOB Jet Barge Swaps 11Platts to Launch CFR India Petcoke Assessments 11Platts to Launch Weekly Turkey Mid-Sulfur Petcoke Assessment 11Platts Introduces Naptha against M3 Waterborne Gasoline Assessments 12Platts Launches Colonial Pipeline Line Space Assessments 13Argus Introduces New European Gasoil Bunker Assessments 14Argus Adds New Weekly Snapshot Value for German Diesel Barge 14Argus Launches New Petcoke Assessments 14Argus Adds New Ukrainian Diesel and Gasoline Assessments 15Argus Introduces New Paraxylene Sinopec Assessments 16Argus Adds New Gasoil Bunker Codes 16CME to List European and South Korean Trade Month Benzene Futures 17CME to Launch Crude Oil and Refined Futures 17ICE Launches New European Oil Futures 18Platts to Discontinue European and Mediterranean Low Sulfur 1% Bunker Assessments 19Platts to End No. 2 New York Harbor Cargos at London MOC 20Platts Stops Weekly DOP Assessment 20Platts Discontinues US Ketones Assessments 20Argus Stops Publishing European and Mediterranean Fuel Oil Bunker Assessments 21Argus Discontinues US Diesel and Fuel Oil Assessments 21CME Delists Two Brent Crude Oil CFD Futures Contracts 22Platts to Extend Low Sulfur Gasoil Futures Curve 22Platts Edits European Polymer Contract Price Assessment Parameters 22Platts’ Data Source Changes Petroleum Floor Trading Volumes 23
Natural Gas 24Platts Adds Cross-Fuels Data to European Gas Daily 24Argus Adds European Natural Gas Assessments 24Argus Adds New North American and European Natural Gas Codes 24CME Europe Launches Italian Natural Gas Futures 25ICE Futures US Lists Six New Natural Gas Futures 26Deutsche Börse Market Data + Services Becomes Exclusive Licensor of PEGAS 26
2
Summ
ary

Summ
ary
February 2015
Marex Spectron Trades CME Europe TTF and NBP Natural Gas Futures 26Platts to Discontinue Descriptive Fields in North American Natural Gas CSV Files 27Argus to Discontinue Propane Swap Assessments 27Argus Discontinues New York Natural Gas Assessments 28Platts’ Data Source Changes Henry Hub Floor Trading Volumes 28
Coal 29Platts to Publish CME Group Open Interest for Coal 29Platts and Fenwei to Launch CMCI Met Coal Assessment Series 29Platts Publishes Front-Month, Front-Quarter Coal Averages 30Argus Discontinues New York BTU Value Coal Assessment 30Platts to Discontinue Compliance Coal Spread 30
Softs and Metals 31SOFTS 31Platts to Launch Expanded Sugar Futures Assessments 31Platts to Decouple Two T2 German Ethanol Assessments 31CME Launches Short-Dated Crop Soybean Meal and Soybean Oil Options 32CME Europe Lists Fertilizer Cash Settled Futures 33New MGEX Calendar Spread Options Launched on CME Globex 33Marex Spectron Launches Physical Sugar Broking 34DCE Lists New Soybean, Corn, Palm Olein, Fiberboard, Blockboard, and Corn Starch Contracts 34Euronext Extends Milling Wheat Contract to Johannesburg Stock Exchange 35METALS 36Platts to Publish Iron Ore Phosphorus Differential 36Argus Launches Gadolinium Oxide Assessment 36NYMEX Lists Gold Kilo Futures for Hong Kong Deliveries 37ICE to Administer the LBMA Gold Price 38Platts Discontinues Platts Tubular Market Data File 38CME Changes FIX Tags for Metals Futures 39LME Extends Publication of Live Forward Price Curves 39
Finance 40Platts to Launch New USD-INR Forex Assessment 40 CME Introduces Ratio Calendar Spread for Treasury Bond Futures 40CME Globex Lists Second Generation Deliverable Interest Rate Swap Futures 41CME Europe Lists Euro and US Dollar Denominated Deliverable Swap Futures 41ICE Introduces Additional Euribor and Short Sterling Options 43ICE Introduces Flexible Individual Equity Option and Single Stock Futures Contracts 43DGCX Adds New Spread Contracts in Indian Rupee Futures 43Ossiam Launches New Smart Beta ETF on Xetra 44UBS AG Lists New ETF on Xetra 44ICAP Launches the ICAP Bond Correlated Call US Treasury Index 45ICAP e-Commerce Launches Scrapbook Service for the Corporate Bond Market 45TAIFEX Launches Two New EFT Futures 46Source Launches Two New Equity Index ETFs on Xetra 46
3
Summ
ary

Summ
ary
4February 2015
Summ
aryCFTC Issues Order of Registration for Bursa Malaysia Derivatives Berhad 47TickSmith Launches Chi-X Canada Historical Market Data Portal 47Amundi Launches Two New Bond Index ETFs on Xetra 48CME Group and GFI Group Terminate Merger Agreement 48DGCX Suspends Existing Spread Contracts in Indian Rupee Futures 49ICAP Partners with Wind Information Co. to Provide Data to the Chinese Market 49TOCOM Granted Registration as Foreign Board of Trade by CFTC 49Eurex Authorized to Launch Eurex Clearing Asia 50CME Amends Product Titles of Six CME FX Futures and Options 50IBA Introduces New Calculation Methodology for ISDAFIX 51
Weather and Emissions 52ICE Futures US Lists Air Pollution Allowance, Solar, and Compliance Futures 52Alternext Lists Oceasoft Sensor Technology Developer 53Platts Discontinues Clean Air Interstate Rule Allowance Assessments 53Argus Discontinues US NOx Codes in Argus Air Daily 54AccuWeather Acquires WeatherBank 54
News from Data Vendors 55ZEMA Adds Oil, Power, Natural Gas, Metals, and Weather Data Sources in February 55ZE Launches ZEMA User Community Platform 56ZE Enhances Corporate Footprint with TIBCO Spotfire 57PEGAS to Enhance Geographical Offer with NBP, ZEE, and PSV Contracts 59PEGAS Introduces Trading for New Common Market Area “TRS” in Southern France on 31 March 60Italian Borders Market Coupling to Launch on February 24, 2015 61Ten Considerations for the European Internal Energy Market 62Platts Forward Curves – Petrochemicals 63OTC Global Holdings Launches EOXLive Markets 64
Monthly Market Analysis 65Crude Oil Brent vs. WTI: Prompt-Month Contract (NYMEX) 65Crude Oil Brent vs. WTI: Forward Curve (NYMEX) 66North American Natural Gas Spot Prices (NYMEX) 67Henry Hub Natural Gas Forward Curve (NYMEX) 68Actual Weather (Accuweather) 69Electricity: Day-Ahead Prices (ICE) 70
In Depth 71Part 2 of 2: The Seven Ages of Oil: Boom and Bust, War and Peace, Growth and Decline 71 The Seven Ages Continued 711973-1994: The Middle East Shrugs its Shackles 731994–2008: Deregulation, Speculation, Manipulation, and Detonation 752008-2015: All Fracked Up 78An Implausible Future 80

Editorial
5February 2015
The concept of microgrids is gaining momentum; their share in the energy space is growing. Microgrid is not a novel concept, as in most remote communities self-containment is the only feasible approach to power supply. For many years, localities without access to major power grids have been served by diesel-fueled power generators hooked up to local distribution systems. Also, it has been almost common for hospitals to have backup, off-grid power supply systems. Nowadays, we are witnessing modernized versions of those microgrids, and this concept expands beyond just providing a backup support for live-critical operations or solving geographical constraints.
Spun off from the smart grid concept, these modern microgrids incorporate similar bells and whistles, such as smart meters, substation automation, energy storage, bidirectional electric vehicle charging, etc. In fact, they are at times being referred to by some analysts as “smart microgrids.” Meanwhile, the concept of scaling down the power supply systems and segregating them from major grids has been gaining larger ground.
Nowadays, independently-run, self-sufficient, and self-reliant grids support the operations of not only hospitals, but also jails, university campuses, and data centers. The microgrid concept is expanding from the level of buildings to municipalities; microgrids are being considered by local authorities to ensure regional sustainability and/or reliability. Thus the East Coast, heavily impacted by weather almost every winter, has been looking for solutions
EditorialThe Emerging Power Markets’ New Player – the Microgrid Operator
By Olga Gorstenko, Editor-In-Chief [email protected]

Editorialthat can ensure power supply to the communities in an “island mode” during times of major grid failures. There are currently several microgrid projects on the table in New York State, ranging from 10 to 200 MW installations.
Those who adopt goals of high penetration of renewable generation and prefer relying on local resources are also lining up for microgrids. Low carbon-based and renewable-based technologies are the main focus of California authorities. On February 3, 2015, the California Energy Commission announced winners of over $20 million that the state allocated to fund microgrid and electric vehicle (EV) charging projects that serve exactly these purposes.
The impact from microgrids on traditional utilities raises reasonable concerns. Obviously, microgrids are taking over the clientele, resulting in utilities losing large demand pockets. Some utilities, like Consolidated Edison in New York, take preventive measures and embark on developing mutually beneficial solutions together with microgrid operators. The most common approach is to view these microgrids as assets to support major grids’ operations. In fact, microgrids can be treated as a special customer class with bidirectional supply. During times of demand spikes, microgrids can become just another source of power supply to the grid.
The next step is creating technological platforms that are capable of monitoring and optimizing microgrid operations. Microsoft and Apple are couple of the first pioneers to provide software platforms and apps. GE and Siemens are working on the hardware side. But this is just a beginning. We have
yet to see what types of new contacts and services are developed between microgrid operators and utilities, as well as ISO/RTOs, and how microgrids will fit into their dispatch stacks. But there are many gaps that microgrid developers have yet to close, from finding sustainable and less expensive batteries to reducing dependence on diesel generators, which are still the most available and reliable generation source. When this happens, we will move one step closer to a new paradigm with a new type of energy markets player, the microgrid operators. In this paradigm, conventional grids and microgrids will work in sync complementing each other. <
6February 2015
EditorialEditor-In-Chief
Email: [email protected] Gorstenko
ZEMA Inquiries Bruce Colquhoun. P: 604-790-3299. E: [email protected]
Advertising & Vendor RelationshipsLaura Smyth. P: 604-790-3299. E: [email protected]
Contact DataWatchE: [email protected] Front Desk: 1-866-944-1469 Editorial Department: 778-296-4183 M: ZE PowerGroup Inc. 130-5920 No. 2 Road, Richmond, BC V7C 4R9 To search our archives: www.datawatch.ze.com
Get real-time data updates @zedatawatch
Subscribe on your iPad today

Power
7February 2015
Power
ICE Futures US Lists PJM, MISO, and SPP Power Futures ContractsOn February 16, 2015, the Intercontinental Exchange (ICE) Futures US listed the following new financial power futures:
• PJM AEP Zone Day-Ahead Peak Fixed Price Future• PJM AEP Zone Day-Ahead Off-Peak Fixed Price Future• PJM FE Ohio Day-Ahead Peak Fixed Price Future• PJM FE Ohio Day-Ahead Off-Peak Fixed Price Future• PJM AEP Zone Day-Ahead Peak Daily Fixed Price Future• PJM AEP Zone Day-Ahead Off-Peak Daily Fixed Price Future• PJM FE Ohio Day-Ahead Peak Daily Fixed Price Future• PJM FE Ohio Day-Ahead Off-Peak Daily Fixed Price Future• MISO Texas Hub Day-Ahead Peak Daily Fixed Price Future• MISO Texas Hub Day-Ahead Off-Peak Daily Fixed Price Future• SPP North Hub Day-Ahead Peak Daily Fixed Price Future• SPP North Hub Day-Ahead Off-Peak Daily Fixed Price Future• SPP South Hub Real-Time Peak Daily Fixed Price Future• SPP South Hub Real-Time Off-Peak Daily Fixed Price FutureSee the original announcement.
ZEMA, ZE’s data management solution, collects numerous records from PJM, SPP, and MISO. To learn more, book a free ZEMA demo by visiting http://www.ze.com/book-a-demo/.
The ZEMA graph below shows the day ahead LMP (Locational Marginal Price) for January 1-31, 2015, from PJM and MISO. Texas Hub prices are published by MISO, and Chicago Hub by PJM. High and low values (red points for MISO and yellow points for PJM) are determined if the points fall outside of two standard deviations of each series’ moving average. Moreover, grey crosses denote sliding correlations between the two series. Formulas for moving average, standard deviation, and sliding correlation are easily applied in ZEMA’s Market Analyzer, while graphs can be viewed instantly and customized for visual preference. To learn more, book a complimentary ZEMA demonstration.

launched exchange trading in Nordic power futures on February 16. The next day, it introduced location spreads for further market areas.
In addition, EEX plans to open an office in Oslo shortly in order to support customers on site and to better service the market’s needs for further development. EEX’s presence in the Nordic Market is supported by Geir Reigstad, who is working as a consultant for the exchange.
Concurrently with the Nordic power futures, EEX launched exchange trading for Spain and Switzerland in February.See the original announcement.
EEX Launches Online Shop for Market Data and New SFTP ServerOn February 1, 2015, EEX launched its new online shop for market data and a new sftp server. The following files provided on the new sftp server have been removed from the EEX website as of February 16:
• Phelix_Quarterly.xls• eex_trade_registration_futures_history_2014.csv• spanish_financial_power_futures_history_2014.csv• italian_financial_power_futures_history_2014.csv• ECarbix_history_YYYY.xlsSee the original announcement.
ZEMA collects a range of European power market data, including over 40 records from the EEX. These records include futures price and trading data. To learn more, visit http://www.ze.com/the-zema-solutions/.
8February 2015
Power
EEX Launches Nordic Power FuturesEffective February 16, 2015, the European Energy Exchange (EEX) reinforced its commitment on the Nordic power market with new products and a regional presence. EEX
© Graph created with ZEMA

9February 2015
Power
Italian Borders Market Coupling LaunchesOn February 24, 2015, the Italian Borders Market Coupling successfully launched. From this date onwards, capacity for the Italian-Austrian, Italian-French, and Italian-Slovenian borders will be implicitly allocated through the PCR solution for the day-ahead markets, making those borders part of the MRC.
Three of the five borders of the Italian Borders Market Coupling Project have been coupled with the Multi-Regional Coupling (MRC), thus linking the majority of EU power markets – from Finland to Portugal and Slovenia. The launch of the Italian Borders Market Coupling provides evidence of the flexibility and reliability of the Price Coupling of Regions (PCR) solution.
The day-ahead markets of MRC extended to the Italian Borders Market Coupling covers 20 European countries, accounting for about 2,800 TWh of yearly consumption. The daily average cleared volume over these countries amounts to over 4 TWh, with an average daily value of over €150m.See the original announcement.
Platts to Remove Descriptive Fields in North American Power CSV FilesEffective May 18, 2015, the descriptive fields (Commodity,Region1,Region2,Hub,TOD,Price Tp,GD Id,GD Tkr,Rel Del Pd,Del Pd,Del Yr) in North American power Market Data CSV files delivered on Platts.com (Athena) will be removed.
In June 2014, Platts Reference Standard (PRS) was launched for electric power and natural gas symbols, which provides a standardized set of reference data for each symbol. The reference data is delivered via CSV files on Platts FTP site, and through Platts Market Data Direct Excel plug-in and API.
This will also bring Platts’ North American power Market Data files in line with the standard CSV data files. For all impacted Market Data categories from which the additional descriptive fields will be removed, see page 45 of Market Data User Guide PDF.See the original announcement.

10February 2015
Power
Platts to Discontinue UK High/Low Power AssessmentsEffective May 5, 2015, Platts intends to remove the table named Platts UK Assessments (GTMA, GBP/MWh) from page 9 of European Power Daily. The table displays UK power assessments as a high/low spread.
The discontinuation of the table in European Power Daily will not affect the databasing of UK GTMA power prices. Platts will continue to publish the Platts UK Assessment Midpoints table on page 2 of European Power Daily.
The data series will continue to be published as a high/low range on European Power Alert and will remain available in Market Data category EE. See the original announcement.
APX and Dutch Energy Regulator Sign MOU on REMIT ImplementationOn January 28, 2015, APX announced the signing of a Memorandum of Understanding (MOU) with the Dutch energy regulator Autoriteit Consument & Market (ACM).
Signing of the MOU reaffirms and formalizes the agreements in place between APX and ACM for the mutual work under REMIT Article 13 and 15.
This MOU will enable APX and ACM to detect and investigate potential market manipulation and insider trading. The MOU outlines procedures and practices for the cooperation. It does not replace nor create additional obligations than those arising from REMIT or national electricity regulation. The cooperation will not restrict, extend or alter the existing powers, functions, or duties of APX or ACM.See the original announcement.

Petroleum
11February 2015
PetroleumPlatts to Launch Rotterdam FOB Jet Barge SwapsOn June 1, 2015, Platts intends to launch new assessments for FOB Rotterdam jet barge swaps at 16:30 London time. The proposal is to assess the swaps as differentials to ICE low sulfur gasoil futures three months forward.
Platts would also publish the price in outright terms, as a differential to ICE Brent crude futures (crack), as a spread to CIF NWE jet cargoes and as a spread to FOB ARA diesel barges.See the original announcement.
ZEMA, ZE’s data management solution, collects over 300 Platts records on petroleum and other liquids. To learn more about ZEMA’s vast data library, visit http://www.ze.com/the-zema-solutions/data-coverage/.
Platts to Launch CFR India Petcoke AssessmentsEffective March 11, 2015, Platts will launch two new fuel grade petroleum coke assessments to reflect the value of imports into India’s East and West coasts. The new assessments reflect the value of high-sulfur fuel grade (HSFG) petroleum coke with a sulfur content of 6.5% and a HGI of 40, delivered to India on a 50,000-mt Supramax vessel, in US$/mt, CFR Krishnapatnam (East) and Kandla (West), 30-60 days from date of publication.
Cargoes traded with more prompt or further forward laycans would be normalized to the middle of the assessment period. For assessment purposes, petcoke with 6-8% sulfur and HGI of 38-55 would be considered. See the original announcement.
ZEMA collects Platts petroleum data from all over the world, including 75 reports from the Asia-Pacific region. To learn more about ZEMA’s extensive data reach, book a complimentary demo at http://www.ze.com/book-a-demo/.
Platts to Launch Weekly Turkey Mid-Sulfur Petcoke AssessmentEffective, March 4, 2015, Platts intends to launch a new weekly CIF Turkey mid-sulfur petroleum coke assessment.
The new assessment will take into account petcoke trades done in a forward 30-60-day delivery window. Cargos traded with more prompt or further forward laycans will be normalized to the middle of the assessment period. The assessment will be normalized to the discharge port of Iskenderun, but will take into account the ports of Izmir, Marmara and Samsun.
The range of petcoke specifications for inclusion in the assessment will be: calorific value of 7,000-8,000 kcal/kg NAR, 4-5.5% sulfur content dry basis and Hardgrove Grindability Index of 30-80.
The price assessment will be normalized to reflect the price of mid-sulfur petcoke of 5% sulfur content dry basis and 50 HGI in Supramax 50,000 mt vessels on a 7,500 kcal/kg NAR calorific value basis.See the original announcement.

Petroleum
12February 2015
Platts Introduces Naptha against M3 Waterborne Gasoline AssessmentsEffective February 19, 2015, Platts began assessing standard and heavy naphtha against M3 (11.5 RVP) waterborne gasoline. Bids and offers in the Platts Market on Close assessment process that price against M3 will be normalized back to M4 based on publicly available information that Platts received up until February 18, 2015.See the original announcement.
To learn more about gasoline prices in Europe and the United States, use ZEMA to view records from Platts. To learn more, visit http://www.ze.com/the-zema-solutions/.
The following ZEMA graph represents three alternative tanker routes: TC2 Europe to the US Atlantic coast, TC 5 Ras Tanura to Yokohama, and TD3 Middle Easterm Gulf to Japan. Also included is the Average RBOB for gasoline within the same time periods. From the graph it is easy to see that the shipping lines steadily increased their rates from 2010 onwards. In 2011, we can see rates becoming increasingly competitive, creating a price war, as container lines sought to fill their new ships and defend their market share. From the graph, we can also see the price of gasoline having an impact, likely adding to the shippers’ running costs. To learn more about the ZEMA solution, please book a complimentary demonstration.
Petroleum
© Graph created with ZEMA

Petroleum
13February 2015
Platts Launches Colonial Pipeline Line Space AssessmentsAs of February 2, 2015, Platts has started assessing the value of line space for distillates and gasoline on three major Colonial Pipeline segments between Pasadena, Texas, and Linden, New Jersey.
The assessments reflect a negotiated spot market price in cents/gallon. They reflect the premium or discount paid during the exchange of product at two locations along Colonial’s Line 1 and/or Line 3, as well as Line 2 and/or Line 3.
The assessments are linked with cycle numbers on the Colonial Pipeline schedule.
The 18 new assessments are:
• AAXTA00 – Line space for gasoline on Line 1• AAXTACY – The Colonial cycle number for which Line 1 space is assessed for gasoline • AAXTA03 – The monthly average for line space for gasoline on Line 1• AAXTC00 – Line space for gasoline on Line 1 and Line 3• AAXTCCY – The Colonial cycle number for which Line 1 and Line 3 space are assessed for gasoline • AAXTC03 – The monthly average for line space for gasoline on Line 1 and Line 3• AAXTB00 – Line space for gasoline on Line 3• AAXTBCY – The Colonial cycle number for which Line 3 space is assessed for gasoline • AAXTB03 – The monthly average for line space for gasoline on Line 3• AAXTD00 – Line space for distillates on Line 2• AAXTDCY – The Colonial cycle number for which Line 2 space is assessed for distillates • AAXTD03 – The monthly average for line space for distillates on Line 2• AAXTG00 – Line space for distillates on Line 2 and Line 3• AAXTGCY – The Colonial cycle number for which Line 2 and Line 3 space are assessed for distillates • AAXTG03 – The monthly average for line space for distillates on Line 2 and Line 3• AAXTE00 – Line space for distillates on Line 3• AAXTECY – The Colonial cycle number for which Line 3 space is assessed for distillates • AAXTE03 – The monthly average for line space for distillates on Line 3
The assessments reflect the transfer of a minimum of 25,000 barrels of distillates or gasoline and are not limited to any specific product.
Frozen cycles and spur lines are not part of the assessments.See the original announcement.
Petroleum

Petroleum
14February 2015
Argus Introduces New European Gasoil Bunker AssessmentsEffective March 3, 2015, Argus introduced the following series. These series appear in the DLP files in the DEURO folder of ftp.argusmedia.com.
PA-codeTime Stamp
Price Type
Continuous Forward
Description Category Frequency
PA0011464 6 1, 2 0Gasoil bunker Antwerp
->Products->Gasoil/Diesel/Heating oil->Northwest Europe
Daily
PA0011472 6 1, 2, 6, 7 0Gasoil bunker Rotterdam
->Products->Gasoil/Diesel/Heating oil->Northwest Europe
Daily
See the original announcement.
ZEMA collects a range of Argus petroleum assessment data, including data from the European Crude (Spot Prices) record and the Argus Crude record. To learn more, visit http://www.ze.com/the-zema-solutions/.
Argus Adds New Weekly Snapshot Value for German Diesel BargeOn February 12, 2015, Argus added a new weekly snapshot value for German 10ppm diesel barge NWE. The following code is being added to the DAGM data files in the \DAGM folder of the ftp.argusmedia.com server.
PA-code Time Stamp
Price Type
Continuous Forward
Description Unit Category Frequency
PA5001478 6 8 0
Gasoil diesel 10ppm German NWE barge snapshot
USD/t
->Products-> Gasoil/Diesel/ Heating oil-> Northwest Europe
Weekly
See the original announcement.
Argus Launches New Petcoke AssessmentsOn February 11, 2015, Argus added the following new codes to Energy Argus Petroleum Coke:
PA-codeTime Stamp
Price Type
Description Unit Category Frequency
PA0015716 21 8Petroleum coke fob USWC <2.0% sulphur 45 HGI
USD/t ->Petroleum Coke->USA Weekly
PA0015717 21 8Petroleum coke cfr Turkey 4.5% 70 HGI
USD/t->Petroleum Coke->East Mediterranean
Weekly
PA0015718 21 8Petroleum coke fob Venezuela 4.5% 70 HGI
USD/t->Petroleum Coke-> Latin America
Weekly
Petroleum

Petroleum
15
PA-codeTime Stamp
Price Type
Description Unit Category Frequency
PA0015719 0 1, 2Petroleum coke fob USWC <2.0% sulphur 45 HGI month
USD/t ->Petroleum Coke->USA Monthly
PA0015720 0 1, 2Petroleum coke cfr Turkey 4.5% 70 HGI month
USD/t->Petroleum Coke-> East Mediterranean
Monthly
PA0015721 0 1, 2Petroleum coke fob Venezuela 4.5% 70 HGI month
USD/t->Petroleum Coke-> Latin America
Monthly
PA0015722 21 8
Petroleum coke fob USWC <2.0% sulphur 45 HGI 4 weeks average
USD/t ->Petroleum Coke->USA Weekly
PA0015723 21 8Petroleum coke cfr Turkey 4.5% 70 HGI 4 weeks average
USD/t->Petroleum Coke-> East Mediterranean
Weekly
PA0015724 21 8Petroleum coke fob Venezuela 4.5% 70 HGI 4 weeks average
USD/t->Petroleum Coke-> Latin America
Weekly
See the original announcement.
ZEMA collects over 100 Argus reports regularly, more than 40 of which pertain to petroleum products. To learn more about ZEMA’s vast data coverage, visit http://www.ze.com/the-zema-solutions/data-coverage/.
Argus Adds New Ukrainian Diesel and Gasoline AssessmentsEffective February 9, 2015, Argus introduced new daily assessments in Argus Ukrainian Motor Fuels. The following series will appear in DUMF module and in dumf.csv files in DUMF folder on tp.argusmedia.com server.
PA-code Time Stamp
Price Type
Continuous Forward
Description Differential Basis
Unit Category Frequency
PA0015696 0 1, 2, 6, 7
0
Gasoil die-sel 10 ppm daf Belar-us/Ukraine border (Lithuania)
Diesel NWE barges/cargo
USD/t
->Products-> Gasoil/Diesel/Heating oil->Ukraine
Daily
PA0015697 0 1, 2, 6, 7
0
Gasoil diesel 10 ppm cif Ukrainian ports
Diesel fob Med
USD/t
->Products-> Gasoil/Diesel/Heating oil->Ukraine
Daily
PA0015698 0 1, 2 0
Gasoline A-95 fca North-West Ukraine
- UAH/t ->Products-> Gasoline-> Ukraine
Daily
See the original announcement.
Petroleum
February 2015

Petroleum
16
Petroleum
Argus Introduces New Paraxylene Sinopec AssessmentsEffective February 6, 2015, Argus introduced new series to Argus DeWitt Toluene, Xylenes, and Isomers / PET. This applies to the dtxweekly data file in the DATA/DTXWeekly folder offtp.argusmedia.com.
PA-codeTime Stamp
Price Type
Continuous Forward
Description Unit Category Frequency
PA0015687 0 1, 2 1Paraxylene Sinopec delivered import parity USD/t month
USD/t->Petrochemicals-> Paraxylene-> Asia-Pacific
Weekly
PA0015688 0 1, 2 1Paraxylene Sinopec delivered CNY/t month
CNY/t->Petrochemicals-> Paraxylene-> Asia-Pacific
Weekly
See the original announcement.
ZEMA collects data on a wide range of petroleum products and other liquids from reports such as DeWitt Benzene Daily and DeWitt DTX Weekly. Learn more at http://www.ze.com/the-zema-solutions/.
Argus Adds New Gasoil Bunker CodesOn February 6, 2015, Argus added the following three gasoil bunker codes to Argus Marine Fuels:
PA-codeTime Stamp
Price Type
Description Unit Category Frequency
PA0015700 6 1, 2Gasoil bunker Rotterdam $/mnBtu
USD/mnBtu
->Products-> Gasoil/Diesel/Heating oil->Northwest Europe
Daily
PA0015701
2 1, 2Gasoil bunker Houston $/mnBtu
USD/mnBtu
->Products->Gasoil/Diesel/Heating oil->US Gulf coast
Daily
PA0015702 2 1, 2Gasoil bunker New Orleans $/mnBtu
USD/mnBtu
->Products->Gasoil/Diesel/Heating oil->US Gulf coast
Daily
See the original announcement.
February 2015

Petroleum
17
PetroleumCME to List European and South Korean Trade Month Benzene FuturesOn March 8, 2015, the following trade month Benzene futures will be listed for trading by the Chicago Mercantile Exchange (CME) on CME Globex and clearing submission via CME ClearPort:
Trade Month Benzene Futures
Futures Product NamesFIX/FAST and iLink: tag 1151-Security Group MDP 3.0: tag 6937-Asset
FIX/FAST and iLink: tag 55-Symbol MDP 3.0 tag 1151 - Security Group
European Benzene cif ARA (Argus) Trade Month Futures
BEA JR
Benzene fob South Korea (Argus) Trade Month Futures
BSA JR
See the original announcement.
Using ZEMA’s advanced data collection and analytic capabilities, market participants can easily keep track of the new data that will be generated by CME Globex. To learn more, visit http://www.ze.com/the-zema-solutions /.
CME to Launch Crude Oil and Refined FuturesEffective March 8, 2015, the following crude oil and refined futures will be listed for trading on CME Globex and clearing submission via CME ClearPort:
ProductFIX/FAST and iLink: tag 1151-Security Group MDP 3.0: tag 6937-Asset
FIX/FAST and iLink: tag 55-Symbol MDP 3.0 tag 1151 - Security Group
Futures Product Name tag 1151-SecurityGroup tag 55-Symbol
Mini 3.5% Fuel Oil Barges FOB Rdam (Platts) Crack Spread (100mt) Futures
MFR RF
Mini 1% Fuel oil Cargoes FOB NWE (Platts) Crack Spread (100mt) Futures
MNS RF
Mini Brent Financial Futures MBC PT
Mini Dated Brent (Platts) Financial Futures MDB RF
Mini East-West Fuel Oil Spread (Platts) Futures MEW PT
Mini Singapore Fuel Oil 380cst (Platts) vs. European 3.5% Fuel Oil Barges FOB Rdam (Platts) Futures
MSB RF
Mini 1% Fuel Oil Cargoes CIF NWE(Platts) Futures MFP RF
See the original announcement.
February 2015
Natural Gas
18
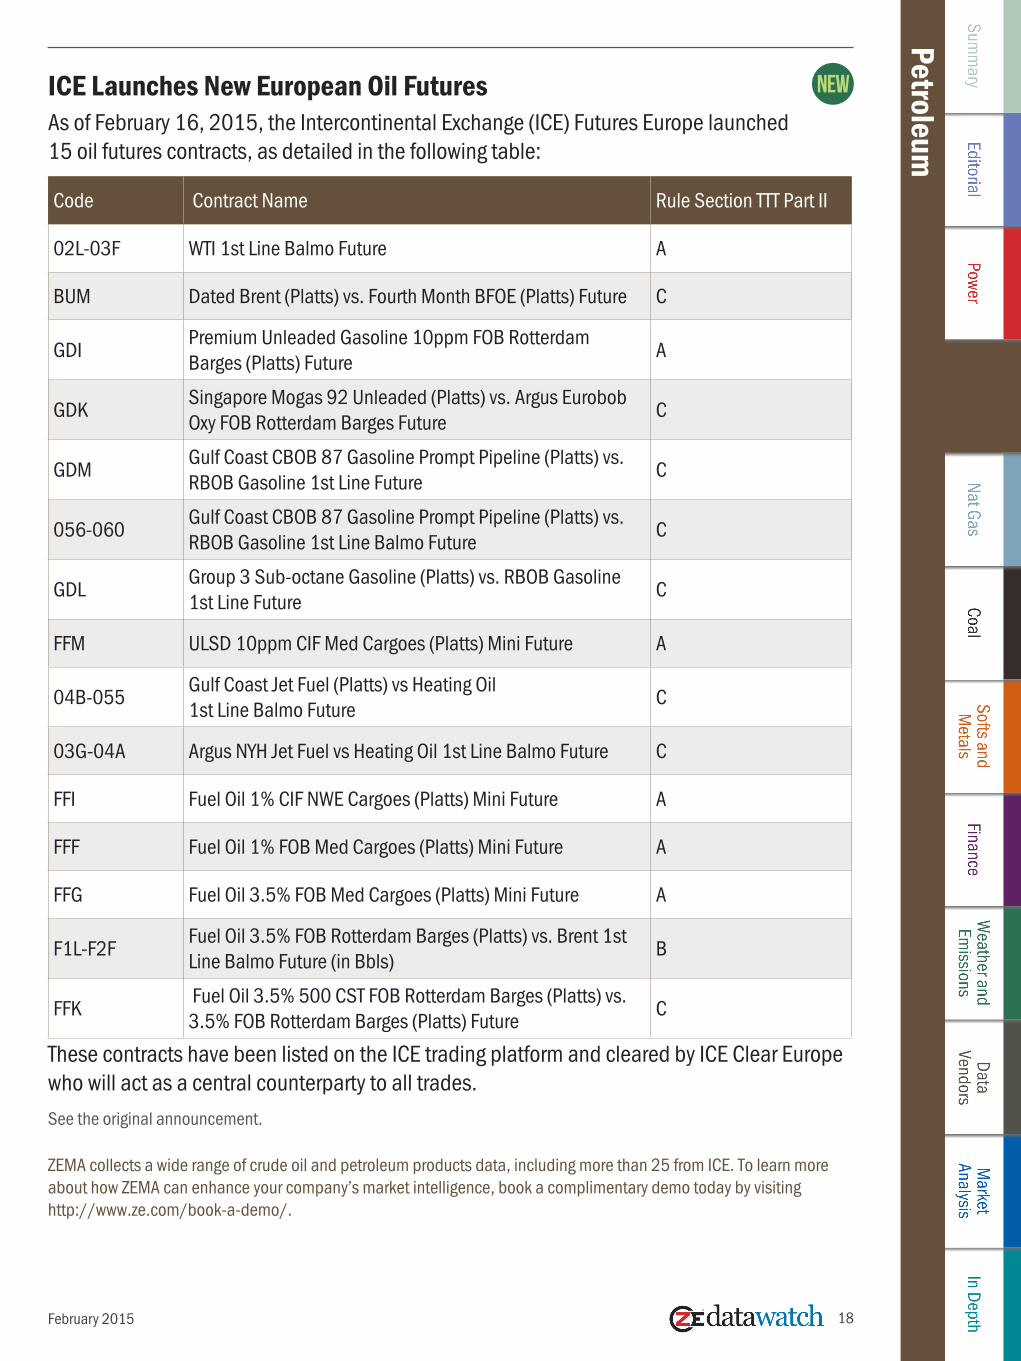
PetroleumICE Launches New European Oil FuturesAs of February 16, 2015, the Intercontinental Exchange (ICE) Futures Europe launched 15 oil futures contracts, as detailed in the following table:
Code Contract Name Rule Section TTT Part II
02L-03F WTI 1st Line Balmo Future A
BUM Dated Brent (Platts) vs. Fourth Month BFOE (Platts) Future C
GDI Premium Unleaded Gasoline 10ppm FOB Rotterdam Barges (Platts) Future
A
GDK Singapore Mogas 92 Unleaded (Platts) vs. Argus Eurobob Oxy FOB Rotterdam Barges Future
C
GDM Gulf Coast CBOB 87 Gasoline Prompt Pipeline (Platts) vs. RBOB Gasoline 1st Line Future
C
056-060 Gulf Coast CBOB 87 Gasoline Prompt Pipeline (Platts) vs. RBOB Gasoline 1st Line Balmo Future
C
GDL Group 3 Sub-octane Gasoline (Platts) vs. RBOB Gasoline 1st Line Future
C
FFM ULSD 10ppm CIF Med Cargoes (Platts) Mini Future A
04B-055 Gulf Coast Jet Fuel (Platts) vs Heating Oil 1st Line Balmo Future
C
03G-04A Argus NYH Jet Fuel vs Heating Oil 1st Line Balmo Future C
FFI Fuel Oil 1% CIF NWE Cargoes (Platts) Mini Future A
FFF Fuel Oil 1% FOB Med Cargoes (Platts) Mini Future A
FFG Fuel Oil 3.5% FOB Med Cargoes (Platts) Mini Future A
F1L-F2F Fuel Oil 3.5% FOB Rotterdam Barges (Platts) vs. Brent 1st Line Balmo Future (in Bbls)
B
FFK Fuel Oil 3.5% 500 CST FOB Rotterdam Barges (Platts) vs. 3.5% FOB Rotterdam Barges (Platts) Future
C
These contracts have been listed on the ICE trading platform and cleared by ICE Clear Europe who will act as a central counterparty to all trades.See the original announcement.
ZEMA collects a wide range of crude oil and petroleum products data, including more than 25 from ICE. To learn more about how ZEMA can enhance your company’s market intelligence, book a complimentary demo today by visiting http://www.ze.com/book-a-demo/.
February 2015

Petroleum
19
Platts to Discontinue European and Mediterranean Low Sulfur 1% Bunker AssessmentsAs of September 1, 2015, Platts will no longer publish its Northwest European, Gibraltar, Algeciras, and Malta low sulfur (1% sulfur) bunker fuel assessments. Platts will continue to assess low sulfur bunker fuel in the ports of Genoa and Piraeus, reflecting the continuation of regional coastal and domestic usage.
In January 2015, low sulfur fuel oil became largely redundant as a bunker fuel. In the wake of the January 1, 2015 implementation of legislation from the International Convention for the Prevention of Pollution from Ships (MARPOL), which further limited the sulfur emissions from ships operating within any Emission Control Area to a maximum of 0.1% from 1% previously, bunker demand for 1% sulfur fuel oil largely disappeared.
Demand for low sulfur bunker fuel has generally been replaced by demand for marine gasoil, or other similar, ultra low sulfur fuels. Pockets of demand for 1% sulfur fuel oil across Europe still exist, though demand is drastically reduced. Platts is maintaining its Genoa and Piraeus low sulfur bunker fuel assessments in order to reflect the pockets of demand specific to the two ports.
Platts will continue to publish assessments for marine gasoil (0.1% sulfur) for all of its existing European and African ports. Platts will also continue to monitor the development of the emerging supply of new ultra low sulfur bunker fuels across Europe and Africa, demand and supply patterns for these fuels, and subscriber demand for new assessments.
Platts low sulfur bunker fuel assessments are currently published in Platts Bunkerwire and on Platts Global Alert. For a complete list of all affected assessments and their PGA codes, please see the table below.
Code Assessment PGA Page Month Code Month PGA Page
AASTY00 Rotterdam LS 1% PGA1850 AASTY03 PGA1861
AASUA00 Antwerp LS 1% PGA1850 AASUA03 PGA1861
AASUM00 Dunkirk LS 1% PGA1850 AASUM03 PGA1861
AASUC00 Hamburg LS 1% PGA1850 AASUC03 PGA1861
AAVVZ00 Gothenburg 1% PGA1870 AAVVZ03 PGA1871
AASUE00 Great Belt LS 1% PGA1870 AASUE03 PGA1871
AASUG00 Gdansk LS 1% PGA1870 AASUG03 PGA1871
AASUI00 St Petersburg LS 1% PGA1870 AASUI03 PGA1871
AAVIW00 Gibraltar LS 1% PGA1860 AAVIW03 PGA1861
AAXCZ00 Algeciras LS 1% PGA1860 AAXCZ03 PGA1861
AARTD00 Malta LS 1% PGA1860 AARTD03 PGA1861See the original announcement.
February 2015
Petroleum

Petroleum
20
Platts to End No. 2 New York Harbor Cargos at London MOCAs of April 1, 2015, Platts will no longer publish its No. 2 gasoil cargo assessment at London MOC, in tandem with the discontinuation of its US Atlantic Coast distillate cargo assessments on the same day.
The proposed change is a result of evolving market conditions and state regulations in the US Northeast distillate markets and a lack of an Atlantic Coast No. 2 cargo assessment after March 2015.
As a result of this change, Platts will no longer publish assessments under database codes AAPYY10 (No. 2 at London 16:30 in cts/gal) and AAPYY00 (No. 2 at London 16:30 in Euro cts/gal).
These assessments can also be found on Platts Global Alert page 1450. Platts will continue to publish its existing New York Harbor gasoline assessment at 16:30 London time. See the original announcement.
Platts Stops Weekly DOP AssessmentOn February 9, 2015, Platts announced a proposal to discontinue its weekly US dioctyl phthalate assessment due to a change in market dynamics.
Liquidity in the US market for DOP has dropped significantly as substitute plasticizers have become more commonplace. These assessments are published on Page PCA161 and are listed under the following codes in the Platts price database: DOP FD US Domestic Weekly, PHARA00; Monthly Average, PHARB03.
These assessments are also published in the Platts Petrochemical Alert. See the original announcement.
Platts Discontinues US Ketones AssessmentsOn Feb 9, 2015, Platts announced its proposal to discontinue all methyl ethyl ketone and methyl isobutyl ketone assessments in the US due to a lack of liquidity in these markets.
Platts intends to end publication of these assessments from September 1, 2015. Affected assessments:
• MEK FOB USG Weekly PHADQ00 PHAYT03 • MEK DER US Domestic Weekly PHADT00 PHAYU03 • MIBK FOB USG Weekly PHADW00 PHAYX03 • MIBK DER US Domestic Weekly PHADZ00 PHAYY03
These assessments can be found on Platts Petrochemical Alert and in the Global Solventswire.See the original announcement.
February 2015
Petroleum

Petroleum
21
Argus Stops Publishing European and Mediterranean Fuel Oil Bunker AssessmentsOn February 27, 2015, Argus discontinued the following series. These series are in the DAMarineF files in the DAMarineF folder of ftp.argusmedia.com.
PA-codeTime Stamp
Price Type
Description Category Frequency
PA0004110 6 1, 2Fuel oil bunker low sulphur 380 cst Antwerp
->Products->Fuel oil->Northwest Europe
Daily
PA0004111 6 1, 2Fuel oil bunker low sulphur 380 cst Rotterdam
->Products->Fuel oil->Northwest Europe
Daily
PA0011459 6 1, 2Fuel oil bunker LS 380 cst Gibraltar
->Products->Fuel oil-> Mediterranean
Daily
PA0011460 6 1, 2Fuel oil bunker LS 380 cst Hamburg
->Products->Fuel oil->Northwest Europe
Daily
PA0011461 6 1, 2Fuel oil bunker LS 380 cst Malta
->Products->Fuel oil-> Mediterranean
Daily
PA0011462 6 1, 2Fuel oil bunker LS 380 cst Piraeus
->Products->Fuel oil-> Mediterranean
Daily
See the original announcement.
Argus Discontinues US Diesel and Fuel Oil AssessmentsEffective February 17, 2015, Argus stopped codes in the Argus US Products publication and data module. For FTP subscribers, these changes apply to data in the dhp .csv files in the DUSPR folder on ftp.argusmedia.com.
PA-codeTime Stamp
Price Type
Description Unit Category Frequency
PA0002192 2 8Diesel 500ppm NYH barge BTU value
USD/mnBtu
->Products->Gasoil/Diesel/Heating oil->US east coast
Daily
PA0002193 2 8Fuel oil No 6 1% NYH BTU value
USD/mnBtu
->Spark spread->North America->New York
Daily
PA0002194 2 8Fuel oil No 6 0.3% high-pour NYH BTU value
USD/mnBtu
->Spark spread->North America->New York
Daily
PA0002195 2 8Spark spread NYH Diesel barge
USD/mnBtu
->Spark spread->North America->New York
Daily
PA0002197 2 8Spark spread NYH Fuel oil No 6 1%
USD/mnBtu
->Spark spread->North America->New York
Daily
PA0002198 2 8Spark spread NYH Fuel oil No 6 0.3% high-pour
USD/mnBtu
->Spark spread->North America->New York
Daily
See the original announcement.
February 2015
Petroleum

Petroleum
22
CME Delists Two Brent Crude Oil CFD Futures ContractsOn February 2, 2015, NYMEX delisted two Brent crude oil CFD futures contracts as set out in the table below. There was no open interest in these contracts.
Product Name Commodity CodeNYMEX Rulebook Chapter Number
Brent CFD: Dated Brent (Platts) vs. Brent Front Month (Platts) Weekly Futures
CFA 1144
Brent CFD: Dated Brent (Platts) vs. Brent Front Month (Platts) Daily Futures
1C 319
As a result of the delisting, information regarding these contracts has been deleted from the respective product chapters, all other references to the contracts, and the terms and conditions contained in the Position Limit, Position Accountability, and Reportable Level Table located in the Interpretations and Special Notices Section of Chapter 5 (Trading Qualifications and Practices) of the NYMEX Rulebook were removed from the Rulebook.See the original announcement.
Platts to Extend Low Sulfur Gasoil Futures CurveEffective June 1, 2015, Platts intends to launch new assessments for ICE low sulfur gasoil futures at 16:30 London time.
Currently, Platts only assesses months one, two, and three. The proposal is to extend the ICE low sulfur gasoil futures assessments to 36 months, 12 quarters, and three years forward. See the original announcement.
Platts Edits European Polymer Contract Price Assessment ParametersEffective February 26, 2015, Platts further defined the parameters reflected in its European polymer contract price assessments. Platts defined a contract price as one negotiated against an annual commitment to supply or procure regular monthly volumes.
Platts may use information on all contractually agreed volumes to form the basis of its assessments, although assessments will be normalized to reflect contractual commitments of 3,000-6,000 mt/year.
The governing factor in the price assessments, however, reflects the negotiated and mutually agreed absolute price.See the original announcement.
February 2015
Petroleum

23February 2015
Petroleum
Platts’ Data Source Changes Petroleum Floor Trading VolumesEffective December 22, 2014, Platts’ NYMEX end of day data provider Commodity Systems Inc. has implemented a change so floor trading volume represents only pit session (RTH: regular trading hours) trading activity. Prior to this date, volume data for floor trading included trading activity from both floor trading and electronic sessions combined. The following are the floor trading contracts affected:
Floor trading contracts Symbol Prefix
NYMEX Light Crude Floor XNCL
NYMEX RBOB Floor XNRB
NYMEX NY ULSD Floor XNHO
The corresponding combined trading contracts:
Floor trading contracts Symbol Prefix
NYMEX Light Crude Combined XNCC
NYMEX RBOB Combined XNRB
NYMEX NY ULSD Combined XNHO
See the original announcement.
Natural GasNatural Gas
24February 2015
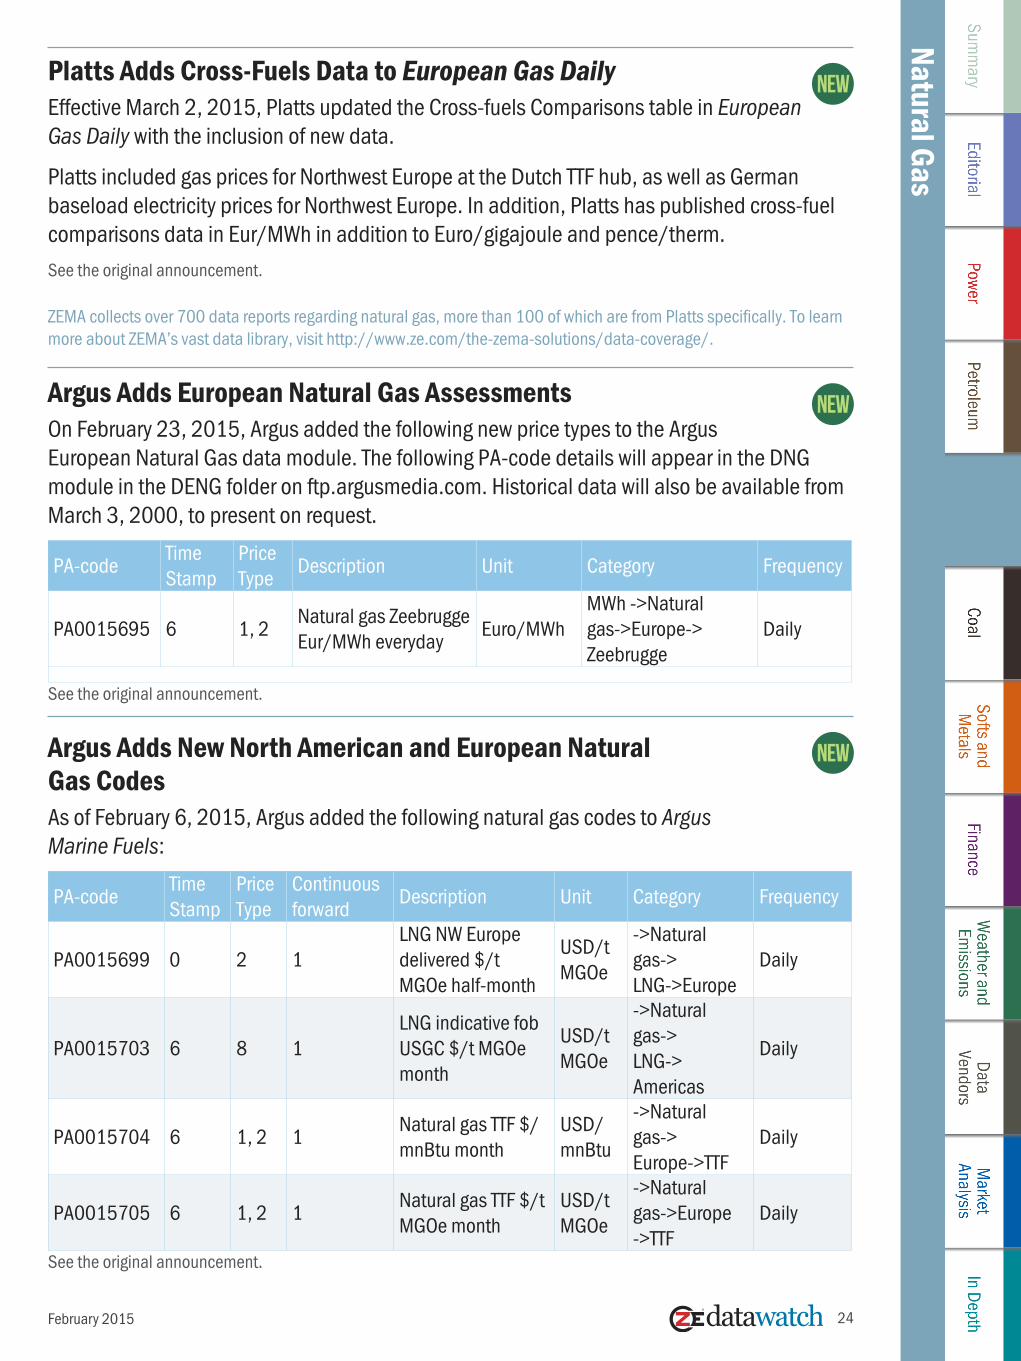
Platts Adds Cross-Fuels Data to European Gas DailyEffective March 2, 2015, Platts updated the Cross-fuels Comparisons table in European Gas Daily with the inclusion of new data.
Platts included gas prices for Northwest Europe at the Dutch TTF hub, as well as German baseload electricity prices for Northwest Europe. In addition, Platts has published cross-fuel comparisons data in Eur/MWh in addition to Euro/gigajoule and pence/therm.See the original announcement.
ZEMA collects over 700 data reports regarding natural gas, more than 100 of which are from Platts specifically. To learn more about ZEMA’s vast data library, visit http://www.ze.com/the-zema-solutions/data-coverage/.
Argus Adds European Natural Gas AssessmentsOn February 23, 2015, Argus added the following new price types to the Argus European Natural Gas data module. The following PA-code details will appear in the DNG module in the DENG folder on ftp.argusmedia.com. Historical data will also be available from March 3, 2000, to present on request.
PA-codeTime Stamp
Price Type
Description Unit Category Frequency
PA0015695 6 1, 2Natural gas Zeebrugge Eur/MWh everyday
Euro/MWhMWh ->Natural gas->Europe-> Zeebrugge
Daily
See the original announcement.
Argus Adds New North American and European Natural Gas CodesAs of February 6, 2015, Argus added the following natural gas codes to Argus Marine Fuels:
PA-codeTime Stamp
Price Type
Continuous forward
Description Unit Category Frequency
PA0015699 0 2 1LNG NW Europe delivered $/t MGOe half-month
USD/t MGOe
->Natural gas-> LNG->Europe
Daily
PA0015703 6 8 1LNG indicative fob USGC $/t MGOe month
USD/t MGOe
->Natural gas-> LNG-> Americas
Daily
PA0015704 6 1, 2 1Natural gas TTF $/mnBtu month
USD/mnBtu
->Natural gas-> Europe->TTF
Daily
PA0015705 6 1, 2 1Natural gas TTF $/t MGOe month
USD/t MGOe
->Natural gas->Europe ->TTF
Daily
See the original announcement.

Natural GasNatural Gas
25
CME Europe Launches Italian Natural Gas FuturesEffective February 1, 2015, the Chicago Mercantile Exchange (CME) Europe listed the following energy futures for trading on CME Globex and clearing submission via CME ClearPort:
ProductFIX/FAST and iLink: tag 1151-Security Group MDP 3.0: tag 6937-Asset
FIX/FAST and iLink: tag 55-SymbolMDP 3.0 tag 1151 - Security Group
Italian PSV Natural Gas (ICIS Heren) Calendar Month Future (Variable Quantity)
IPE JQ
Italian PSV Natural Gas (ICIS Heren) vs. Dutch TTF Natural Gas (ICIS Heren) Calendar Month Spread Future (Variable Quantity)
DPE JQ
These contracts are listed on, and subject to, the rules of UK RIE CME Europe Ltd.See the original announcement.
Using ZEMA’s advanced data collection and analytic capabilities, market participants can easily keep track of the new data that will be generated by CME Globex and CME Europe Ltd. To learn more, visit http://www.ze.com/the-zema-solutions/.
The ZEMA graph shows the Italian natural gas monthly future settlement with monthly shaping average and yearly average for years 2015-2016. The minimum future settlement for the whole period is about 15 Euro/MWh as of April 2015; but the price increases from that point before reaching a maximum of 17.3 Euro/MWh in October 2015. The settlements in 2015 have more fluctuations compared with those in 2016; but overall, the yearly average for the two years remains almost constant (red spots in graph). Analysis like this is easy to customize in ZEMA, due to the solution’s enhanced visualization functionalities. To learn more about the ZEMA solution, please book a complimentary demonstration.
February 2015
© Graph created with ZEMA

Natural GasNatural Gas
26
ICE Futures US Lists Six New Natural Gas FuturesEffective February 16, 2015, the Intercontinental Exchange (ICE) Futures US listed the following natural gas futures contracts:
• Transco Leidy Basis Future• Transco Leidy Swing Future• Transco Leidy Index Future• Tennessee Zone 4 300L Basis Future• Tennessee Zone 4 300L Swing Future• Tennessee Zone 4 300L Index FutureSee the original announcement.
ZEMA collects natural gas records from all over the world and from dozens of different data sources. To receive a complimentary ZEMA demonstration, visit http://www.ze.com/book-a-demo/.
Deutsche Börse Market Data + Services Becomes Exclusive Licensor of PEGASOn February 9, 2015, Deutsche Börse Market Data + Services announced that it has become the exclusive licensor of real-time market data for spot, derivatives, and spread products traded on PEGAS, as of January 1, 2015. PEGAS is the central natural gas trading platform of EEX Group, operated by Powernext.
The PEGAS real-time market data product contains prices of traded within-day, day-ahead, weekend, as well as individual days gas spot contracts. Moreover, it includes prices of traded future gas contracts and prices of traded location spreads.See the original announcement.
Marex Spectron Trades CME Europe TTF and NBP Natural Gas FuturesEffective February 2, 2015, Marex Spectron has executed the first trade of CME Europe’s new monthly Dutch (TTF) and UK (NBP) Natural Gas futures.
The TTF contract was traded for one of Marex Spectron’s major energy clients on the first day of the new products’ availability. On 20 January, Marex Spectron executed the first trade of the CME Europe’s new monthly UK (NBP) Natural Gas future, ending day two of trading in the new contract by arranging three block trades with a total of 75k Therms.
The new contracts are financial and physical cleared products that are available to trade via straight through processing on Marex Spectron’s market venue. They are:
• UK Natural Gas Daily Futures• UK Natural Gas Calendar Month Futures
February 2015

Natural GasNatural Gas
27
• Dutch Natural Gas Daily Futures• Dutch Natural Gas Calendar Month Futures
For all contracts, the front month will be March 2015, and the prompt has been available from February 2, 2015.See the original announcement.
ZEMA regularly collects more than 100 records from the Chicago Mercantile Exchange, several of which are about natural gas futures. Learn more about the ZEMA solution at http://www.ze.com/the-zema-solutions/.
Platts to Discontinue Descriptive Fields in North American Natural Gas CSV FilesEffective May 18, 2015, the descriptive fields (Commodity,Region1,Region2,Hub,TOD,Price Tp,GD Id,GD Tkr,Rel Del Pd,Del Pd,Del Yr) in North American natural gas Market Data CSV files delivered on Platts.com (Athena) will be removed.
This will also bring Platts’ North American natural gas Market Data files in line with the standard CSV data files. For all impacted Market Data categories from which the additional descriptive fields will be removed, see page 45 of Market Data User Guide PDF.See the original announcement.
Argus to Discontinue Propane Swap AssessmentsEffective March 31, 2015, Argus is stopping the following price types (high and low). These will stop for these series, but the midpoints introduced in January 2015 will continue beyond March. These series will be found in the dpgeurope and dpg data file in the \DLPG folder of ftp.argusmedia.com.
PA-codeTime Stamp
Price Type
Continuous Forward
Description Unit Category Frequency
PA0002720 6 1, 21, 2, 3, 4, 5, 6
Propane Swaps NWE month
USD/t->LPG-> Northwest Europe-> Propane
Daily
PA0002721 6 1, 2 1, 2, 3Propane Swaps NWE quarter
USD/t->LPG-> Northwest Europe-> Propane
Daily
PA0002722 6 1, 2 1, 2, 3Propane CP swap month
USD->LPG->Mideast Gulf->Propane
Daily
PA0002723 6 1, 2 1, 2, 3Propane Far East Index swap month
USD->LPG-> Asia-Pacific-> Pro-pane
Daily
See the original announcement.
February 2015

28February 2015
Natural Gas
Argus Discontinues New York Natural Gas AssessmentsAs of February 18, 2015, Argus has stopped the following code in the Argus US Products publication and data module. For FTP subscribers, these changes apply to data in the dhp .csv files in the DUSPR folder on ftp.argusmedia.com.
PA-codeTime Stamp
Price Type
Description Unit Category Frequency
PA0002204 2 8 New York gas (USP)USD/mnBtu
->Spark spread->North America->New York
Daily
PA0002205 2 8Coal New York BTU value (USP)
USD/mnBtu
->Spark spread->North America->New York
Daily
PA0002207 2 8Spark spread New York natural gas (USP)
USD/mnBtu
->Spark spread->North America->New York
Daily
See the original announcement.
Platts’ Data Source Changes Henry Hub Floor Trading VolumesOn December 22, 2014, Platts’ NYMEX end of day data provider Commodity Systems Inc. has implemented a change so floor trading volume represents only pit session trading activity. Prior to this date, volume data for floor trading included trading activity from both floor trading and electronic sessions combined:
Floor trading contract Symbol Prefix
NYMEX Henry Hub Natgas Floor XNNG
Combined trading contract Symbol Prefix
NYMEX Henry Hub Natgas Combined XNNCSee the original announcement.

Coal
29
Coal
February 2015
Platts to Publish CME Group Open Interest for CoalEffective June 26, 2015, Platts will publish the open interest for the front-month CAPP barge, CAPP rail (CSX), PRB 8,800 Btu/lb coal futures contracts as listed by the CME Group, as well as the total CME open interest for each contract and all terms, in the daily OTC Broker Index table in Platts Coal Trader.
The open interest data will lag by one day due to the fact it becomes available each day after Coal Trader’s daily publishing deadline.See the original announcement.
ZEMA regularly collects nearly 150 data reports on coal. For more information, visit http://www.ze.com/the-zema-solutions/.
Platts and Fenwei to Launch CMCI Met Coal Assessment SeriesEffective early April 2015, Platts and Shanxi Fenwei Energy Consulting Co. are proposing to launch the China Metallurgical Coal Index price assessment series, which will initially include five spot metallurgical coal assessments in the domestic Chinese spot market.
The proposed assessments are designed to reflect the daily tradable values of a range of coal specifications in the Chinese domestic spot market. Provisionally, the assessments would include two premium hard coking coal assessments (Liulin No. 4 and Liulin No. 9), a high-vol high-fluidity assessment (North China Fat Coal), a PCI coal assessment (Shanxi PCI), and a semi-soft coking coal assessment (Shandong Semi Soft).
The assessments will be assessed in yuan per metric ton on an ex-washplant, free on rail, and when applicable on a delivered duty paid Tangshan basis.
Platts and Fenwei also propose to assess four domestic logistic routes, including both rail and truck freight from Shanxi to Tangshan and Shandong. Using these new assessments, it will be possible for Platts to analyze the relationship between domestic and seaborne metallurgical coal markets, and Platts may therefore consider the publication of an implied arbitrage calculation.See the original announcement.

30February 2015
CoalPlatts Publishes Front-Month, Front-Quarter Coal AveragesOn February 2, 2015, Platts announced that it will publish a daily average of the front-month and front-quarter price assessments for each of the five over-the-counter coal products it currently assesses in the OTC Broker Index table in Platts Coal Trader.
For example, on March 5 Platts would publish the average of the April daily assessments published from February 26 through March 5. On the same date, Platts would publish the average of the front-quarter (which will be the third calendar quarter) daily assessments published from February 26 to March 5.
The daily front-month and front-quarter averages will show the direction of the underlying prices through the course of the referenced period, providing market participants with more visibility as to the direction of the final monthly settle for both terms.See the original announcement.
ZEMA collects more than 20 different coal records from Platts alone. For a complimentary demo on how ZEMA’s data coverage can be specialized for your company’s needs, visit http://www.ze.com/book-a-demo/.
Argus Discontinues New York BTU Value Coal AssessmentAs of February 18, 2015, Argus has stopped the following code in the Argus US Products publication and data module. For FTP subscribers, these changes apply to data in the dhp .csv files in the DUSPR folder on ftp.argusmedia.com.
PA-codeTime Stamp
Price Type
Continuous Forward
Description Unit Category Frequency
PA0002205 2 8 0Coal New York BTU value (USP)
USD/mnBtu
->Spark spread->North America->New York
Daily
See the original announcement.
Platts to Discontinue Compliance Coal SpreadEffective June 26, 2015, Platts will discontinue listing the CAPP 1% vs. compliance coal spread currently listed in the daily OTC Broker Index table in Platts Coal Trader.
Due to evolving market conditions, there is no longer a premium for low sulfur Central Appalachia thermal coal, as the spread was envisioned to illustrate. Over-the-counter trades for compliance coal have not been reported since February 2012, when the spread last showed a change. The affected code is CTMM001.
Additionally, Platts proposes to stop publishing the second trailing final monthly average for the over-the-counter coal products and the CAPP 1% vs. Compliance Spread listed in the daily OTC Broker Index table in Coal Trader, effective June 26. Platts would like to add in its place content it believes would be more relevant to market participants.See the original announcement.

Softs and Metals
31
Softs and Metals
Platts to Launch Expanded Sugar Futures AssessmentsEffective March 30, 2015, Platts will publish an expanded range of daily assessments for ICE White Sugar Futures (LIFFE 5) and Sugar No. 11 Futures at 16:30 London time.
The new range of assessments will include the first three contracts listed by the exchange for each futures’ contract from the date of publication. This builds upon Platts’ existing front-month contract assessments for both ICE Sugar No. 11 and White Sugar Futures.
Platts would maintain a rolling schedule in line with the ICE expiration schedules for each futures contract. These assessments will appear in a range of Platts sugar reports, and in the
Platts price database. The new symbol codes will be announced at a later date.See the original announcement.
Platts to Decouple Two T2 German Ethanol AssessmentsEffective March 9, 2015, Platts FOB Rotterdam T2 German spec ethanol assessments will include a minimum greenhouse gas saving of 50% when compared with the fossil fuel comparator, as per the European Union’s Fuel Quality Directive calculation.
The fossil fuel comparator and greenhouse gas saving reflected will be per the prevailing implementation of the Fuel Quality Directive in Germany. Currently, the existing FOB Rotterdam T2 German spec assessment is published as fixed at parity to the FOB Rotterdam T2 assessment. Effective March 9, Platts will decouple the existing relationship between the two assessments and establish two independent assessments.
Platts will monitor the activity and development of both markets and continue to review trading activity and assessments for abnormal trading indications. Platts will continue to monitor this activity in light of the change to German domestic biofuel specifications and adapt its methodology as necessary to reflect standard spot market trade flows.
No changes will be made to the Platts FOB Rotterdam T2 assessments. All other specifications will conform with the prevailing renewable energy Directive 2009/28/EC.See the original announcement.
ZEMA’s vast data coverage comprises records on many kinds of agricultural products, including ethanol. To learn more, visit http://www.ze.com/the-zema-solutions/data-coverage/.
SOFTS
February 2015

Softs and Metals
32
Softs and Metals
CME Launches Short-Dated Crop Soybean Meal and Soybean Oil OptionsOn February 22, 2015, the following short-dated crop options were listed for trading on CME Globex, open outcry and clearing submission via CME ClearPort:
Short-Dated New Crop Soybean Meal and Soybean Oil Options
ProductFIX/FAST and iLink: tag 1151-Security Group MDP 3.0: tag 6937-Asset
FIX/FAST and iLink: tag 55-Symbol MDP 3.0 tag 1151 - Security Group (Outrights)
FIX/FAST and iLink: tag 55-Symbol MDP 3.0 tag 1151 - Security Group (UDS)
Short-Dated Options on New Crop Soybean Meal Futures
OMD ML MY
Short-Dated Options on New Crop Soybean Oil Futures
OLD 0O OZ
See the original announcement.
ZEMA can help you keep you up to date on more than 100 regular CME reports, including many on softs. To find out how, book a free demo at http://www.ze.com/book-a-demo/.
February 2015

Softs and Metals
33February 2015
Softs and MetalsCME Europe Lists Fertilizer Cash Settled Futures
On February 2, 2015, CME Europe listed the following fertilizer cash settled futures for trading on CME Globex and clearing submission via CME ClearPort:
ProductFIX/FAST and iLink: tag 1151-Security Group MDP 3.0: tag 6937-Asset
FIX/FAST and iLink: tag 55-Symbol MDP 3.0 tag 1151 - Security Group
Urea (Granular) FOB US Gulf Future FNE FE
UAN FOB NOLA Future FUE FE
DAP FOB NOLA Future FLE FE
DAP FOB Tampa Future FTA FE
Urea (Granular) FOB Egypt Future FEY FE
Urea (Prilled Bulk) FOB Yuzhny Future FKE FE
Urea (Granular) FOB Middle East Future FME FE
Urea (Prilled) FOB China Future FCE FE
These contracts are listed on, and subject to, the rules of UK RIE CME Europe Ltd.See the original announcement.
New MGEX Calendar Spread Options Launched on CME GlobexEffective February 1, 2015, the following options on MGEX futures calendar spreads (CSOs) were listed for trading on CME Globex:
• One consecutive CSO (March 2015 - May 2015)• Two Annual CSOs (September 2015 - September 2016 and December 2015 -
December 2016)• Three non-Consecutive CSOs (March 2015 - July 2015, March 2015 - September 2015,
March 2015 - December 2015)
Upon March expiration, the May Non-Consecutive months will be listed for trading and so on.See the original announcement.
ZEMA collects a wide range of agricultural data, including several reports from MGEX. To learn more about ZEMA’s data coverage, visit http://www.ze.com/the-zema-solutions/data-coverage/.

Softs and Metals
34
Softs and Metals
Marex Spectron Launches Physical Sugar BrokingOn January 5, 2015, Marex Spectron launched a new service providing access to markets for physical sugar. The new service will be offered in conjunction with MB Trading, which will act as agent for Marex Spectron. This is Marex Spectron’s first brokerage service in physical agricultural products.
The new physical broking service is now live and will operate primarily through desks in London and Paris.See the original announcement.
ZEMA currently collects 11 regular data reports on sugar alone. Learn more about ZEMA’s extensive data coverage at http://www.ze.com/the-zema-solutions/data-coverage/.
DCE Lists New Soybean, Corn, Palm Olein, Fiberboard, Blockboard, and Corn Starch ContractsEffective January 19, 2015, the Dalian Commodity Exchange (DCE) has begun trading the following contracts:
• No. 1 Soybeans 1607 Contract• No. 2 Soybeans 1601 Contract, Corn 1601 Contract• Soybean Meal 1601 Contract• Soybean Oil 1601 Contract, LLDPE 1601 Contract• RBD Palm Olein 1601 Contract, Egg 1601 Contract• Egg 1601 Contract• Fiberboard 1601 Contract• Blockboard 1601 Contract• Corn Starch 1601 Contract
See the original announcement.
The ZEMA graph below shows the future contract for corn and soybean in next three years from March 2015 to November 2017 (CME data). The graph displays monthly prices for corn and soybean, which is now trading at the Dalian Commodity Exchange. For the period 2015-2017, we can see upward trend for future contracts of corn, whereas soybean contracts have high volatility in the same period. Analysis like moving average (represented by a line without points for corn and soybean in the graph) helps to remove noise from the random price fluctuations. Easily customizable graphs like this can be built in ZEMA to create simple or complex analyses and make better decisions. To learn more, book a complimentary ZEMA demonstration.
February 2015

Softs and Metals
35February 2015
Softs and Metals
Euronext Extends Milling Wheat Contract to Johannesburg Stock ExchangeOn February 16, 2015, Euronext signed a license agreement with the Johannesburg Stock Exchange (JSE) providing the JSE with the right to list the flagship Milling Wheat contract currently traded on Euronext. The aim of the agreement is to extend access to the global benchmark Milling Wheat contract by broadening its international exposure to a wider audience.
By partnering with the largest exchange in the region, the agreement also extends Euronext’s reach into Africa, which according to International Monetary Fund forecasts, will be the world’s second fastest-growing region next year, expanding 5.75%.
The license agreement signed between the two exchanges is reciprocal, enabling each exchange the right to use the settlement prices and brands for the other’s commodities contracts. JSE will initially list the Euronext Milling Wheat contract, and this agreement can be extended to include its contracts for Rapeseed and Corn.See the original announcement.
© Graph created with ZEMA

36February 2015
Softs and Metals
METALSPlatts to Publish Iron Ore Phosphorus DifferentialEffective April 1, 2015, Platts will begin publishing a daily phosphorus differential used in the normalization process for its iron ore fines assessments. This differential will be reflective of ores within the 60-63.5%-Fe range, in line with the current “per 1% Fe differential.” The differential will be monitored and updated to reflect spot market value.
This differential adjustment used in normalization will be expressed in dollars per dry metric ton for every 0.01 percentage point of phosphorus, up to and including levels of 0.12%. Platts will continue to monitor penalties and premiums for phosphorus above this level and outside of the Fe range and continue to publish this information on a case-by-case basis in market commentaries and news stories.
Platts is proposing to publish this value in the daily iron ore assessment table in SBB Steel Markets Daily on page 3 and on page MW1105 of PMA and to database the value, making it available in data products under the category SI.See the original announcement.
ZEMA collects more than 90 metals records from Platts alone. To gain a wider perspective on the metals market and find out how the ZEMA solution can enhance your company’s business processes, visit http://www.ze.com/the-zema-solutions/.
Argus Launches Gadolinium Oxide AssessmentAs of March 3, 2015, Argus introduced a new Gadolinium oxide assessment to Argus Rare Earths report and associated data feed. The following data series is available in DRareEarths data module in /DRareEarths folder on ftp.argusmedia.com.
PA-code Time Stamp
Price Type
Description Unit Category Frequency
PA0015714 0 1
Gadolinium oxide min 99.999% fob China
USD/t ->Metals - Non-ferrous-> Rare Earths->Asia-Pacific
Daily
PA0015714 0 2
Gadolinium oxide min 99.999% fob China
USD/t ->Metals - Non-ferrous-> Rare Earths->Asia-Pacific
Daily
See the original announcement.
ZEMA Collects more than 25 metals data reports from the Asia region alone. To find out more, book a free demo at http://www.ze.com/book-a-demo/.

37February 2015
Softs and Metals
NYMEX Lists Gold Kilo Futures for Hong Kong DeliveriesEffective January 26, 2015, the New York Mercantile Exchange (NYMEX) listed gold kilo futures to be physically delivered in Hong Kong. The first listed contract month shall be the April 2015 contract. The spot month limit shall be effective at the close of trading on the business day prior to the first day of the delivery month. For example, the spot month limit for the April 2015 contract month shall be effective at the close of trading on March 31, 2015.
Contract Name
Rule Chapter
Commodity Code
Contract Size and Unit
Reporting Level
Spot-Month Limit (In Net Futures Equivalents)
Single Month Account-ability Level
All Month Account- ability Level
Gold Kilo Futures
114 GCK 1 Kilogram Bar
25 6,000 6,000 6,000
The commodity codes are provided for clearing members that file reports pursuant to NYMEX Rule 561.A in a machine-readable format.See the original announcement.
The ZEMA graph below shows average monthly gold prices in years 2012, 2013, and 2014 (LBMA data). The graph clearly demonstrates that the prices have significantly dropped in June 2013 and remained at the low level ever since. Gold prices soared as high as $1,746 USD/toz in October of 2012 and fell as low as $1175 USD/toz in November 2014. NYMEX hopes to complement the existing gold benchmark with its new gold futures contract for the Hong Kong physical gold market. To learn more about the ZEMA solution, book a complimentary demonstration.
© Graph created with ZEMA

38February 2015
Softs and Metals
ICE to Administer the LBMA Gold PriceEffective March 2015, Intercontinental Exchange (ICE) and the London Bullion Market Association (LBMA) have launched the new LBMA Gold Price, which replaces the long established London Gold Fix.
As announced by the LBMA in November 2014, ICE Benchmark Administration (IBA) has officially become the administrator of the new pricing mechanism. As the administrator for the LBMA Gold Price, IBA will transition to a physically settled, electronic and tradable auction, with the ability to participate in three currencies: USD, EUR, and GBP.
Within the process, aggregated gold bids and offers will be updated in real-time with the imbalance calculated and the price updated every 30 seconds. IBA will use ICE’s widely distributed front-end, WebICE, as the technology platform which will allow direct participants, as well as sponsored clients, to manage their orders in the auction in real time via their desktops.See the original announcement.
ZEMA collects more than 200 metals records, several of which regard gold prices. To receive a complimentary ZEMA demonstration, visit http://www.ze.com/book-a-demo/.
Platts Discontinues Platts Tubular Market Data FileEffective January 1, 2015, Platts has discontinued its monthly North American pipe and tube markets data publication, Platts Tubular Market Report data file.
The publication has been discontinued due to the reconfiguration of other Platts publications and data reports that provides subscribers with similar information going forward.
As an alternative, subscribers can receive pipe and tube market data in the Platts Steel Data & Analysis product. Specifically, this data is included in the Imports 1-4 and Exports 1-3 reports.
In addition, pipe and tube data is included in the trend analyzer, also part of a Steel Data & Analysis subscription.See the original announcement.

39February 2015
Softs and Metals
CME Changes FIX Tags for Metals FuturesOn February 23, 2015, CME Group changed the values in the following FIX tags for Metals futures:
• tag 55-Symbol for FIX/FAST, and
• tag 1151-SecurityGroup for MDP 3.0
Product
Product CodeFIX/FAST and iLink: tag 1151- Security Group MDP 3.0: tag 6937-Asset
Current State FIX/FAST and iLink: tag 55-Symbol MDP 3.0 tag 1151 - Security Group
New State FIX/FAST and iLink: tag 55-Symbol MDP 3.0 tag 1151 - Security Group
E-micro Gold futures and calendar spreads
MGC QO GC
miNY Gold futures and calendar spreads
QO QO GC
E-mini Copper futures and calendar spreads
QC QC HG
miNY Silver futures and calendar spreads
QI QI SI
See the original announcement.
LME Extends Publication of Live Forward Price CurvesOn January 20, 2015, The London Metal Exchange (LME) has extended its live forward price curves for each metal as part of its commitment to further enhance the transparency of the price discovery process following last year’s review of the Ring, the Exchange’s open outcry trading platform.
The forward price curves, which were previously published for the Ring’s afternoon “kerb” trading session only, now cover all trading times in the Ring.
In addition to the new price information, the LME is providing extra granularity by publishing monthly prompt dates between three months and one year forward.See the original announcement.

Finance
40
Finance
February 2015
CME Introduces Ratio Calendar Spread for Treasury Bond FuturesOn February 17, 2015, due to unique changes in the deliverable basket affecting the upcoming March-June Treasury Bond (ZB) calendar roll, the Chicago Mercantile Exchange (CME) listed a new reduced-tick ratio calendar spread for trading on CME Globex.
This spread is a reduced tick calendar spread with the usual quarter-32nd tick, but with a leg ratio of 3:2. The details of the spread are included in the Security Definition message as defined below.
Product
FIX/FAST and iLink: tag 1151-Security Group MDP 3.0: tag 6937-Asset
FIX/FAST and iLink: tag 55-Symbol MDP 3.0 tag 1151 - Security Group
Tag 762-Security-SubType
Tag 623- LeqRatioQty
Treasury Bond Reduced-Tick Ratio Calendar Spread
ZBXH5-ZBXM5 ZB RTFront Leg: 3 Back Leg: 2
This spread will not be implied and will not be SLEDS eligible.
The ratio spread is listed alongside the current reduced tick calendar spread. Trade leg assignment and spread pricing differences are outlined in the following scenarios:
• ZBH5 is priced at 150.0 (1500)• ZBM5 is priced at 165.0 (1650)• The Reduced Tick calendar spread ZBH5-ZBM5 trades at -15.0 (-1500) • Front leg – deferred leg • (150.0 – 165.0) = -15.0
Platts to Launch New USD-INR Forex AssessmentOn February 12, 2015, Platts announced that it will be introducing a daily US Dollar-Indian Rupee currency assessment to complement its global sugar pricing coverage.
The assessment would be made basis 16:30 Singapore time, and be used as part of calculations for third-party NCDEX data for sugar prices in India. These assessments would add to Platts’ existing portfolio of currency assessments published to support a range of Platts physical commodity assessments.See the original announcement.
Also on February 12, Platts declared its intent to launch a daily US Dollar-Mexican Peso currency assessment to complement its global sugar pricing coverage.
This assessment would be made basis 14:15 Houston time, and be used as part of calculations for third-party Zafranet data for sugar prices in Mexico.See the original announcement.

Finance
41
Finance• The Reduced-Tick Ratio calendar spread ZBXH5-ZBXM5) trades at 120.0 (120000) • (Front leg*3)-(deferred leg*2) • ((150.0*3)-(165.0*2)) = 120.0See the original announcement.
ZEMA’s sophisticated market data management tools collect hundreds of financial data reports, including reports from CME. To learn how you can begin building your own library of financial data, book a complimentary ZEMA demonstration at http://www.ze.com/book-a-demo/.
CME Globex Lists Second Generation Deliverable Interest Rate Swap FuturesEffective February 8, 2015, the Second-generation 10-Year and 30-Year USD Deliverable Rate Swap futures were listed for trading on CME Globex.
The second-generation 10-Year and 30-Year USD Deliverable Rate Swap futures will be listed for:
• March 2015 quarterly expiration, and
• A different coupon rate than the existing First-generation 10-Year USD Interest Rate Swap and 30-Year USD Interest Rate Swap
ProductFIX/FAST and iLink: tag 1151-Security Group MDP 3.0: tag 6937-Asset
FIX/FAST and iLink: tag 55-Symbol MDP 3.0 tag 1151 - Security Group
Second-generation 30-Year USD Deliverable Rate Swap Futures
B2U ZY
Second-generation 10-Year USD Deliverable Rate Swap Futures
N2U ZN
These contracts were listed with, and subject to, the rules and regulations of CBOT.See the original announcement.
CME Europe Lists Euro and US Dollar Denominated Deliverable Swap FuturesOn January 26, 2015, CME Europe announced that it will list the following Euro and US Dollar Denominated Deliverable swap futures for trading on CME Globex and clearing submission via CME ClearPort for CME Clearing Europe (CMECE), in Q1 2015.
ProductFIX/FAST and iLink: tag 1151-Security Group MDP 3.0: tag 6937-Asset
FIX/FAST and iLink: tag 55-Symbol MDP 3.0 tag 1151 - Security Group
2-Year Deliverable Euro Interest Rate Swap Futures EU2 DS5-Year Deliverable Euro Interest Rate Swap Futures EU5 DS10-Year Deliverable Euro Interest Rate Swap Futures E10 DS2-Year Deliverable US Dollar Interest Rate Swap Futures
DS2 DS
February 2015

Finance
42
ProductFIX/FAST and iLink: tag 1151-Security Group MDP 3.0: tag 6937-Asset
FIX/FAST and iLink: tag 55-Symbol MDP 3.0 tag 1151 - Security Group
5-Year Deliverable US Dollar Interest Rate Swap Futures
DS5 DS
10-Year Deliverable US Dollar Interest Rate Swap Futures
D10 DS
30-Year Deliverable US Dollar Interest Rate Swap Futures
D30 DS
These contracts were listed on, and subject to, the rules of UK RIE CME Europe Ltd.See the original announcement.
ZEMA, ZE’s data management solution, excels at displaying time-series data in charts, graphs, forward curves, and more. ZEMA also collects financial derivatives data from a wide range of sources. For further information, visit http://www.ze.com/the-zema-suite/.
Below are two ZEMA graphs showing the EURO and USD interest rate swap futures, respectively. In each graph, there are three curves: those that represent two years, five years, and ten years interest rate swap futures in the specified market. The USD interest rate swap futures see a much higher volatility compared to the EURO ones. In both graphs, we can see that the price took a dive from September to October 2014. To learn more about the ZEMA solution, please book a complimentary demonstration.
Finance
February 2015
© Graph created with ZEMA
© Graph created with ZEMA

Finance
43
ICE Introduces Additional Euribor and Short Sterling OptionsEffective February 16, 2015, the Intercontinental Exchange (ICE) Futures Europe launched six new mid-curve option products on the Euribor and Short Sterling Futures Contracts. The additional contracts are detailed in the following table:
Physical Code Contract Name
KW1 Weekly One Year Mid-Curve Options on Euribor Futures (5 Weeklies listed)
MW1 Weekly One Year Mid-Curve Options on Short Sterling Futures (5 Weeklies listed)
KW2 Weekly Two Year Mid-Curve Options on Euribor Futures (5 Weeklies listed)
MW2 Weekly Two Year Mid-Curve Options on Short Sterling Futures (5 Weeklies listed)
K5 Five Year Mid-Curve Options on Euribor Futures (4 Serials, 4 Quarterlies listed)
M5 Five Year Mid-Curve Options on Short Sterling Futures (4 Serials, 4 Quarterlies listed)
These ICE Futures Europe Option Contracts will be admitted to trading on the ICE trading platform and cleared by ICE Clear Europe who will act as a central counterparty to all trades. The products will be part of the STIR Option Designated Market Maker Scheme.See the original announcement.
ZEMA collects more than 100 ICE records. To learn more about how ZEMA can collect, aggregate, and analyze data, visit http://www.ze.com/the-zema-solutions/.
ICE Introduces Flexible Individual Equity Option and Single Stock Futures ContractsOn January 26, 2015, ICE launched flexible Individual Equity Option (“flexible IEO”) and flexible Single Stock Futures (“flexible SSF”) contracts based on Indivior Plc and Reckitt Benckiser Group Plc shares for trading on ICE Block under the terms of the Contract Rules Sections KKKKK, LLLLL, UUUUU and VVVVV of the ICE Futures Europe Regulations.
The minimum volume threshold for Block Trades in these contracts is set at 1 lot.
Standard Individual Equity Option Contracts based in Indivior Plc and Reckitt Benckiser Group Plc shares were made available on WebICE and ICE Block on 23 December 2014.See the original announcement.
DGCX Adds New Spread Contracts in Indian Rupee FuturesEffective February 26, 2015, the Dubai Gold & Commodities Exchange (DGCX) listed nine new spread contracts available for trading in Indian Rupee futures:
• Third month (’M3’) versus the fourth month (’M4’) Spread (’M3 - M4‘). • Fourth month (’M4’) versus the fifth month (‘M5’) Spread (’M4 - M5’). • Fifth month (’M5’) versus the sixth month (’M6’) Spread (’M5 - M6‘).
Finance
February 2015

Finance
44
• Sixth month (’M6’) versus the seventh month (’M7’) Spread (’M6 - M7‘). • Seventh month (’M7’) versus the eighth month (‘M8’) Spread (’M7 - M8’). • Eighth month (’M8’) versus the ninth month (’M9’) Spread (’M8 - M9‘). • Ninth month (’M9’) versus the tenth month (‘M10’) Spread (’M9 - M10’). • Tenth month (’M10’) versus the eleventh month (’M11’) Spread (’M10 - M11‘). • Eleventh month (’M11’) versus the twelfth Month (‘M12’) Spread (’M11 - M12’). See the original announcement.
ZEMA collects regular reports from the National Stock Exchange of India. To find out more about ZEMA’s extensive data coverage, visit http://www.ze.com/the-zema-solutions/data-coverage/.
Ossiam Launches New Smart Beta ETF on XetraOn February 16, 2015, Ossiam issued a new equity index fund in Deutsche Börse’s XTF segment on Xetra.
ETF Name Ossiam Shiller Barclays Cape Europe Sector Value TR - UCITS ETF
Asset class equity index ETF
ISIN LU1079842321
Total expense ratio 0.65 percent
Distribution policy accumulating
Benchmark Shiller Barclays CAPE Europe Sector Value Net TR Index
The new Ossiam ETF enables investors to participate in the performance of the four most undervalued European sectors. The sectors are selected on a monthly basis, using CAPE ratio and 12-month momentum. CAPE stands for Cyclically Adjusted Price-Earnings and calculates the ratio of the share price to average inflation-adjusted earnings over the past ten years.See the original announcement.
UBS AG Lists New ETF on XetraEffective February 12, 2015, a new exchange-listed equity index fund issued by UBS AG has become tradable in Deutsche Börse’s XTF segment on Xetra:
ETF Name UBS ETF – MSCI EMU Hedged USD UCITS ETF (USD) A-dis
Asset class equity index ETF
ISIN LU0937835576
Total expense ratio 0.33 percent
Distribution policy distributing
Benchmark MSCI EMU 100% Hedged to USD Total Return Net
This ETF gives investors the opportunity for the first time to track the performance of the equity markets in the European Monetary Union (EMU) in US dollars and to benefit at the same time
Finance
February 2015

Finance
45
Finance
February 2015
from any appreciation of the US dollar against the euro. The index currently comprises 238 stock corporations from the following ten countries: Belgium, Germany, Finland, France, Ireland, Italy, the Netherlands, Austria, Portugal, and Spain.See the original announcement.
ZEMA presently collects information from Deutsche Börse about derivatives products. To learn more about how ZEMA can leverage Deutsche Börse market data, visit http://www.ze.com/the-zema-suite/.
ICAP Launches the ICAP Bond Correlated Call US Treasury IndexEffective February 2, 2015, ICAP Information Services (IIS), the information division of ICAP, has launched the ICAP Bond Correlated Call (BCC) US Treasury Index. A fixed income strategy index, it represents the enhanced income received on physical bond holdings when a product on the index is launched.
The ICAP BCC Index is based on the ICAP US Treasury 5-10 Year Maturity Index, developed by IIS three years ago using trade-backed data from ICAP’s leading electronic fixed income platform, BrokerTec. A buy-write option strategy, the ICAP BCC Index measures the performance of holding US Treasury bonds and systematically writing call options on 10yr US Treasury note futures contracts which are related to the underlying bonds.See the original announcement.
ICAP e-Commerce Launches Scrapbook Service for the Corporate Bond MarketOn January 26, 2015, ICAP announced that it is launching Scrapbook, an anonymous, session-based e-solution for the corporate bond market. The service will be operated by ICAP’s BrokerTec MTF (Multilateral Trading Facility) under the regulated entity of BrokerTec Europe Limited leveraging the ICAP e-Commerce team.
Having been launched in February, the e-solution is made possible through a strategic partnership with third-party pricing and reference data provider, Interactive Data. Scrapbook customers will have access to Interactive Data’s Continuous Fixed Income Evaluated Prices, based on a methodology which incorporates both algorithmic and human analysis.See the original announcement.
Stay current on ICAP data with ZEMA which collects more than 50 ICAP reports on a regular basis. Learn more by booking a free demo at http://www.ze.com/book-a-demo/.

46February 2015
FinanceTAIFEX Launches Two New EFT FuturesOn February 2, 2015, the Taiwan Futures Exchange (TAIFEX) launched two new ETF futures associated with China’s stock indexes, adding to its current three ETF futures offerings that began trading on October 6, 2014.
With their underlying ETFs’ high liquidity, TAIFEX added two new ETF Futures:
• Yuanta/P-shares SSE50 ETF Futures• Fuh Hwa CSI300 A Shares ETF (FH CSI300) Futures
Following the promising growth of the previously launched ETF futures, W.I.S.E. Yuanta/P-shares CSI300 ETF futures and Fubon SSE180 ETF Futures, the two new ETF futures also aim to closely track the performance of two China stock indices – the SSE50 Index (Taiwan Stock Exchange code: 006206) and the CSI300 Index (stock code: 006207), respectively.See the original announcement.
Source Launches Two New Equity Index ETFs on XetraAs of January 26, 2015, a new equity index fund from the ETF offering issued by Source has been tradable on Xetra in Deutsche Börse’s XTF segment:
ETF Name Source Goldman Sachs Equity Factor Europe UCITS ETF
Asset class equity index ETF
ISIN DE000A1161M1
Total expense ratio 0.55 percent
Distribution policy accumulating
Benchmark Goldman Sachs Equity Factor Index Europe NTR Index EUR
The Source Goldman Sachs Equity Factor Europe UCITS ETF enables investors to participate in a strategy approach based on the following five stock-picking factors: size, value, momentum, quality, and a low beta. This strategy aims for outperformance compared to traditional indexes weighted by market capitalization.
Additionally, on January 20, 2015, Source issued a new equity index fund from the ETF offering also tradable in the XTF segment on Xetra:
ETF Name Source R Equal-Risk European Equity UCITS ETF
Asset class equity index ETF
ISIN DE000A12D253
Total expense ratio 0.48 percent
Distribution policy accumulating
Benchmark R Risk-Based European Equity TRN Index

47February 2015
FinanceThe Source R Equal-Risk European Equity UCITS ETF allows investors to participate in a risk-based strategy approach, which focuses equity selection on the biggest European large-cap companies with sufficient trading liquidity. Index weighting is based on the equally-weighted risk contribution (ERC) model, which takes the two risk factors volatility and correlation into account.See the original announcement.
ZEMA collects a wide range of equity market data from a range of exchanges. To learn more, book a complimentary ZEMA demonstration at http://www.ze.com/book-a-demo/.
CFTC Issues Order of Registration for Bursa Malaysia Derivatives BerhadOn January 22, 2015, the US Commodity Futures Trading Commission (CFTC) announced that is has issued an Order of Registration to Bursa Malaysia Derivatives Berhad (BMD), a Foreign Board of Trade located in Kuala Lumpur, Malaysia. Under the Order, BMD is permitted to provide its identified members or other participants located in the US with direct access to its electronic order entry and trade matching system to trade agricultural commodity, interest rate and security index futures, and option contracts.
The CFTC issued the Order in accordance with Part 48 of the its regulations, which provides that such an Order may be issued to a foreign board of trade that possesses, among other things, the attributes of an established, organized exchange and that is subject to continued oversight by a regulator that provides comprehensive supervision and regulation that is comparable to the supervision and regulation exercised by the CFTC.
BMD submitted an application for registration that included, among other things, representations that its regulatory regime under its regulatory authority, the Malaysian Securities Commission, satisfies the requirements for registration in Commission regulation 48.7. See the original announcement.
TickSmith Launches Chi-X Canada Historical Market Data PortalOn January 22, 2015, TickSmith Corp. announced that it will now offer a Chi-X Canada ATS and CX2 Canada ATS historical market data and analytics web portal.
The web portal will allow users to access Chi-X Canada historical market data; to create user accounts; to access sample data and related documentation; and to subscribe to historical data services and reports. The portal delivers full access to book data as published by Chi-X Canada as well as formatted content such as top of book, 1 second bars and 1 minute bars. Reports on trading activity are also available; the interface supplies various options to visualize and download content.See the original announcement.
ZEMA, ZE’s enterprise data management solution, contains advanced display functionalities which enable users to easily align news updates from organizations such as NASDAQ OMX and OTC Markets next to market data, which gives users an enhanced market perspective. For further information, visit http://www.ze.com/the-zema-suite/dashboard/.

48February 2015
FinanceAmundi Launches Two New Bond Index ETFs on XetraAs of January 20, 2015, two new exchange-listed bond index funds issued by Amundi have been tradable in Deutsche Börse’s XTF segment.
Name Amundi Govt Bond Lowest Rated EuroMTS Investment Grade 1-3 UCITS ETF
Asset class bond ETF
ISIN FR0011807015
Total expense ratio 0.14 percent
Distribution policy accumulating
Benchmark EuroMTS Lowest Rated Investment Grade Government Capped 1-3 Index
The Amundi Govt Bond Lowest Rated EuroMTS Investment Grade 1-3 UCITS ETF provides investors with access to the performance of government bonds issued by euro-area countries with terms of one to three years. The bonds must have a double-digit rating below “AAA”.
Name Amundi ETF Floating Rate Euro Corporate 1-3 UCITS ETF
Asset class bond ETF
ISIN FR0012005734
Total expense ratio 0.18 percent
Distribution policy accumulating
Benchmark Markit iBoxx EUR FRN IG 1-3 Index
The underlying index, Amundi ETF Floating Rate Euro Corporate 1-3 UCITS ETF, tracks the performance of corporate bonds with a variable coupon, or floater. These bonds are investment grade bonds denominated in euros with a term of between one and three years.See the original announcement.
CME Group and GFI Group Terminate Merger AgreementOn January 30, 2015, CME Group Inc. and GFI Group Inc. announced that they have each determined to terminate their previously announced merger agreement following a special meeting of GFI shareholders.
Results from the GFI shareholder meeting indicate that GFI shareholders did not approve the proposed merger. As a result, the parties each determined that terminating the merger agreement and related transactions was in the best interest of their respective companies and shareholders at this time.
The related merger agreement by and among CME and Jersey Partners Inc. and their affiliates and purchase agreement by and among GFI Brokers Holdco Ltd., CME, Jersey Partners Inc. and their affiliates, were also terminated.See the original announcement.

49February 2015
FinanceDGCX Suspends Existing Spread Contracts in Indian Rupee FuturesOn February 26, 2015, DGCX delisted the following six spread contracts in Indian Rupee Futures:
• First month (’M1’) versus the sixth month (’M6’) Spread (’M1 - M6‘). • First month (’M1’) versus the ninth month (‘M9’) Spread (’M1 - M9’). • First month (’M1’) versus the twelfth month (’M12’) Spread (’M1 - M12‘). • Third month (’M3’) versus the sixth Month (‘M6’) Spread (’M3 - M6’). • Third month (’M3’) versus the twelfth month (’M12’) Spread (’M3 - M12‘). • Sixth month (’M6’) versus the twelfth Month (‘M12’) Spread (’M6 - M12’). See the original announcement.
ICAP Partners with Wind Information Co. to Provide Data to the Chinese MarketOn January 27, 2015, ICAP announced that ICAP IIS, the information division of ICAP, has partnered with Wind Information Co., Ltd (Wind Info), a provider of financial data, to provide offshore Chinese renminbi (CNH) and US Treasury data to the Chinese market.
As a result of the partnership, Wind Info’s clients that include securities, fund management, investment and insurance companies, banks, financial research institutions and regulatory committees, will have access to offshore market data for the first time. Clients will be able to access USD/CNH Fwd, USD/CNH Spot, USD/CNY NDF, US Treasury EOD data via Wind Financial Terminals (WFT), 24 hours a day, seven days a week.See the original announcement.
TOCOM Granted Registration as Foreign Board of Trade by CFTCOn January 21, 2015, the Tokyo Commodity Exchange, Inc. (TOCOM) announced that CFTC has issued an Order granting TOCOM’s application for registration as a Foreign Board of Trade (FBOT) under the US Commodity Exchange Act on January 20. FBOT registration permits TOCOM to provide its Members and market participants located in the United States with direct access to its electronic order entry and trade matching system.
A foreign board of trade registered with the CFTC must demonstrate that it meets regulatory requirements comparable to those required of US futures exchanges. Further, the CFTC must determine that the foreign board of trade’s regulatory authorities support and enforce regulatory objectives that are substantially equivalent to the CFTC’s objectives, in particular, with respect to market integrity, customer protection, clearing and settlement and the enforcement of the rules of the foreign board of trade and its clearing organization.See the original announcement.

50February 2015
FinanceEurex Authorized to Launch Eurex Clearing AsiaOn January 20, 2015, Deutsche Börse Group announced that it has received “in-principle” regulatory clearance from the Monetary Authority of Singapore (MAS) to set up Eurex Clearing Asia, a clearing house based in Singapore.
The new clearing house of Deutsche Börse Group is an integral part of its new trading and clearing offering for investors during Asian trading hours and is expected to commence operations in 2016. Initially, Eurex Clearing Asia will clear selected European benchmark derivatives listed at Eurex Exchange which are traded during Asian market hours. The range of products cleared will subsequently be extended to include listed derivatives based on Asian underlying assets.
Deutsche Börse Group will also seek recognition as a third-country central counterparty with the European Securities and Markets Authority (ESMA) in Europe for Eurex Clearing Asia. After approval, the Asian clearing services will also be accessible to market participants based in the European Union.
Deutsche Börse Group will combine and market all the services of its Eurex derivatives arm in Asia under the new brand “Eurex Asia.” Eurex Asia’s goal is to offer new trading opportunities, third-party clearing services, and improved post-trade efficiency across the Asian time zone.See the original announcement.
CME Amends Product Titles of Six CME FX Futures and OptionsOn February 3, 2015, CME amended the product titles of six FX futures and options contracts as described below:
Rulebook Chapter
Old Official Product Name
Clearing/PRS Code
Globex Code
New Abbreviation
New Official Product Name
Chapter 315
Euro/Czech Koruna (EUR/CZK) Cross Rate Futures
K/ECZ ECK CZK/EURCzech Koruna/Euro (CZK/EUR) Cross Rate Futures
Chapter 315A
Options on Euro/Czech Koruna (EUR/CZK) Cross Rate Futures
K/KECZ
CZK/EUROptions on Czech Koruna/Euro (CZK/EUR) Cross Rate Futures
Chapter 316
Euro/Hungarian Forint (EUR/HUF) Cross Rate Futures
R/EHU EHF HUF/EURHungarian Forint/Euro (HUF/EUR) Cross Rate Futures
Chapter 316A
Options on Euro/ Hungarian Forint (EUR/HUF) Cross Rate Futures
R/R EHU HUF/EUROptions on Hungarian Forint/Euro (HUF/EUR) Cross Rate Futures
Chapter 317
Euro/Polish Zloty (EUR/ PLN) Cross Rate Futures
Z/EPL EPZ PLN/EURPolish Zloty/Euro (PLN/EUR) Cross Rate Futures

51February 2015
FinanceRulebook Chapter
Old Official Product Name
Clearing/PRS Code
Globex Code
New Abbreviation
New Official Product Name
Chapter 317A
Options on Euro/Polish Zloty (EUR/ PLN) Cross Rate Futures
Z/Z EPL PLN/EUROptions on Polish Zloty/Euro (PLN/EUR) Cross Rate Futures
Also at this time, the Exchange implemented non-substantive amendments to the Position Limit, Position Accountability and Reportable Level Table located in the Interpretations & Special Notices Section of Chapter 5 of the CME Rulebook which were stylistic in nature. It is important to note that the title changes and all related amendments are administrative in nature and, in no manner, impact the structure of the contracts or related contracts.See the original announcement.
IBA Introduces New Calculation Methodology for ISDAFIXAs of February 16, 2015, Intercontinental Exchange Benchmark Administration (IBA) will introduce a new calculation methodology for ISDAFIX.
ISDAFIX is a global benchmark for interest rate swaps. It represents the average mid-market swap rates for three major currencies: Euro (EUR), British pound (GBP), and US dollar (USD), at selected maturities on a daily basis. Market participants use ISDAFIX to price and settle their derivatives contracts and as a reference rate for floating rate bonds.
The new calculation will determine the mid-price of where an order of Standard Market Size1 would be filled across the most liquid, electronic, multilateral trading venues and will use the best prices available on these regulated trading venues at the relevant times in the respective currencies and tenors.
The new methodology calculated from tradable quotes is designed to align ISDAFIX with the principles for financial benchmarks published by the International Organization of Securities Commissions (IOSCO) in 2013, which were subsequently endorsed by the G20 and by the Financial Stability Board. See the original announcement.

Weather and Em
issionsW
eather and Emissions
52February 2015
ICE Futures US Lists Air Pollution Allowance, Solar, and Compliance FuturesOn February 16, 2015, the Intercontinental Exchange (ICE) Futures US launched the following new physical environment futures:
• Cross State Air Pollution TR NOx Annual Allowance Future• Cross State Air Pollution TR NOx Ozone Season Allowance Future• Cross State Air Pollution TR SO2 Group 1 Allowance Future• Cross State Air Pollution TR SO2 Group 2 Allowance Future• New Jersey Solar Renewable Energy Certificate Future• PJM Tri-Qualified Energy Certificates Class 1 Future• Massachusetts Solar Renewable Certificate Future• Massachusetts Compliance REC Class 1 Vintage Future• New Jersey Compliance REC Class 1 Vintage Future• Connecticut Compliance REC Class 1 Vintage FutureSee the original announcement.
ZEMA aggregates more than 40 data reports regarding emissions from around the world. To learn more about ZEMA’s vast data library, visit http://www.ze.com/the-zema-solutions/data-coverage/.
The ZEMA graph below shows the total greenhouse emissions (CO2, SO2, and NOx) between January 2012 and June 2014 (EPA data) for Houston, Texas. The total emissions peaked at 2,500 tons in March 2012 and drastically dropped since December 2012, which declined to as low as 163 tons in March 2013. Such trend analysis can be easily performed through ZEMA, with advanced built-in formulas. To learn more, book a complimentary ZEMA demonstration.
© Graph created with ZEMA

53February 2015
Weather and Em
issionsAlternext Lists Oceasoft Sensor Technology DeveloperOn January 28, 2015, EnterNext, the Euronext subsidiary for small- and medium-sized companies, announced the listing of Oceasoft, developer of connected sensors, on Alternext in Paris.
Based in Montpellier in southern France, Oceasoft designs, calibrates, and markets smart wireless sensors for monitoring physical parameters such as temperature, humidity, differential pressure and chemical components for life science, agri-business, and environmental sectors.
Oceasoft (ticker code: ALOCA) was listed on Alternext in Paris through the admission to trading of the 2,854,334 shares making up its equity, including 958,334 new shares issued under a Global Offering that included full exercise of the extension clause and partial exercise of the over-allocation option.
The admission and issue price of Oceasoft shares was set at €9.00 per share, in the middle of the proposed range. Market capitalization was €25.7 million on the day of listing, and the transaction raised a total of €8.6 million.See the original announcement.
Platts Discontinues Clean Air Interstate Rule Allowance AssessmentsEffective March 2, 2015, Platts discontinued its daily assessments for Clean Air Interstate Rule (CAIR) allowances for each year 2014 and 2015 created by the Environmental Protection Agency.
CAIR allowances for 2015 (Platts symbol EDSO215) were discontinued on January 20, 2015, while CAIR allowances for 2014 (Platts symbol EDSO214) were discontinued on March 2 with the last daily assessment published on February 27.
These assessments were discontinued following a return to relevancy of the federal emissions program due to the lifting of a stay by the US Court of Appeals for the District of Colombia Circuit on the US Environmental Protection Agency’s Cross State Air Pollution Rule (CSAPR) in October 2014.
The assessments appeared daily in Coal Trader and Megawatt Daily. See the original announcement.

54February 2015
Weather and Em
issions
Argus Discontinues US NOx Codes in Argus Air DailyEffective February 27, 2015, Argus has stopped publishing the following codes in Argus Air Daily. These changes apply to the data files in the dusem data files in the \DADR folder on ftp.argusmedia.com.
PA-codeTime Stamp
Price Type
Continuous Forward
Description Unit Category Frequency
PA0004699 211, 2, 8
0NOx US annual assessments for year
USD/st ->Emissions->NOx Daily
PA0005200 211, 2, 8
0NOx US annual weekly index
USD/st ->Emissions->NOx Weekly
PA0005201 211, 2, 8
0NOx US annual monthly index
USD/st ->Emissions->NOx Monthly
See the original announcement.
AccuWeather Acquires WeatherBankEffective January 26, 2015, AccuWeather Inc. announced that it has acquired WeatherBank Inc., an integrated meteorology company. WeatherBank provides comprehensive weather databases, patented weather technology, and specialized programming and consulting services across major industries and leading businesses.
AccuWeather’s commercial services company, AccuWeather Enterprise Solutions Inc. (AES), will integrate WeatherBank’s specialized advancements in forecasting with its own patented capabilities to enhance its services and offerings.
WeatherBank’s specialized meteorological and environmental services include custom forecasting, ambient air quality monitoring, instrumentation and calibration, environmental system audits, and forensic weather studies.
WeatherBank operations, based in the Oklahoma City area, will be added to AccuWeather’s suite of offices and join AccuWeather Enterprise Solutions’ commercial services team. They will be a sister site with the AES Severe Weather Center in Wichita, KS.See the original announcement.

News from Data Vendors
55
ZEMA Adds Oil, Power, Natural Gas, Metals, and Weather Data Sources in FebruaryFor 20 years, ZE PowerGroup Inc. (ZE) has consistently kept up to date on the latest in energy and commodity data changes. ZE collects data from vendors spanning oil, natural gas, electricity, weather, agriculture, and finance, including Platts, Argus, the Chicago Mercantile Exchange, the New York Mercantile Exchange, the Intercontinental Exchange, and OPEC. ZE then provides its clients with access to both public (free subscription) and private data reports, including reports that are collected based on clients’ specific needs.
Since the last issue of ZE DataWatch, ZE has added numerous data reports published by Argus, NEISO, PJM, GFI, SPP, the Weather Channel, the Australian Government, CME, CAISO, SEMO, SNL, Commodity Weather Group, and Tullett Prebon. The three new Argus reports cover DeWitt Benzene Daily futures, prompts, and spots. Seven oil-related reports were added from the Australian Government, which include petroleum production, imports, exports, and sales. The five NEISO reports include day-ahead NCPC payment reports for generator credits, visual credits, settlement period summaries, and more. As well, three GFI reports were added to cover EOD German electricity reference prices as well as ferrous futures and spots. All of these expansions of ZE’s data collection have been implemented in response to a need for greater data coverage in strategic areas of the petrochemical, oil, metals, electricity, and natural gas markets.
For further information on these reports, visit:
http://www.argusmedia.com/ http://www.spp.org/http://www.caiso.com/Pages/default.aspxhttp://www.industry.gov.au/Industry/Pages/default.aspxhttp://www.cmegroup.com/trading/energy/crude-oil/light-sweet-crude.htmlhttp://www.commoditywx.com/ https://www.gfigroup.com/markets/commodities/energy-and-commodities/electricity.aspxhttp://www.iso-ne.com/markets-operations/markets/da-rt-energy-marketshttp://www.pjm.com/markets-and-operations.aspxhttp://www.sem-o.com/marketdata/Pages/default.aspxhttp://www.snl.com/Sectors/Energy/NaturalGas.aspxhttp://www.weather.com/weather/tenday/l/CAXX0518:1:CAhttp://www.tpinformation.com/
To see the full list of ZEMA data providers, visit http://www.ze.com/the-zema-solutions/ data-coverage/.
News from Data Vendors
February 2015

News from Data Vendors
56
News from Data Vendors
ZE Launches ZEMA User Community PlatformZE PowerGroup Inc. (ZE), the developer of the award-winning enterprise data management software ZEMA, has released a new interactive platform for its clients: the ZEMA User Community (the Community). The Community consolidates a wide range of ZEMA support systems and training materials to enhance clients’ overall product experience.
Through the Community site, ZEMA users can access ZEMA Support to connect with experts from the ZEMA Application Support team. Users can also engage in conversations with ZEMA staff and other clients in specialized discussion forums. The site also provides valuable information such as ZEMA news and updates, a product road map, info on new ZEMA releases, ZEMA training resources, the complete ZEMA data catalog, a ZEMA reference library, and more.
Overall, the Community functions as a single point of access for all ZEMA needs and queries. It was designed to help individuals enhance their use of ZEMA and to streamline communication between ZE and its clients.
To learn more, please visit http://community.ze.com/default.html.
February 2015

News from Data Vendors
57
News from Data Vendors
February 2015
ZE Enhances Corporate Footprint with TIBCO Spotfire Challenge
As Waleed El-Ramly, chief product officer of ZE, explains, “To stay on top, you have to be innovative, build new products and features all the time.” ZE clients were looking for self-service BI, and when ZE examined the build vs. partner equation, the answer was clear. “We knew it would take more developers, a long time to market, and a change in focus. So, we started to look at the market for something clients wanted.”
El-Ramly says that because ZE has an insatiable desire to grow; empowering clients with the best total solution was a top priority. “We want to be in more markets, in different industries, and deeper within client operations. If we can’t deliver what the client is looking for, then we’re going to lose market share.”
ZE had several requirements. “Our clients are focused on how fast data comes into our system and when it is available to downstream systems. Also, we have customers that range from one or two users to very large, globally positioned organizations. When we choose a partner, especially in the BI space, we need to know they can scale the same way—and not just in terms of the software, architecture, and technology, but also in terms of support, pricing, capability, and growth.”
Solution
The ZE team started to look at solutions that had already penetrated the market. They had known of TIBCO for a long time, but ZE customers provided the introduction. “Our customers drove us to TIBCO, but it had to also be a natural partnership, the same culture and desire to integrate and meet customer needs, and we saw that with TIBCO,” says El-Ramly.
When ZE investigated how the technologies would integrate and perform, “TIBCOZEMA integration was seamless, very easy,” says El-Ramly. “The TIBCO partnership has been great. They’re very responsive, very respectful, and they see that the value is equal.”
By focusing on integrating instead of building, ZE maintained focus on its core competencies. “We improved our product, expanded our capabilities, and saved time by integrating Spotfire self-service BI into our ZEMA dashboard,” says El-Ramly.
Benefits
LARGER FOOTPRINT WITHIN CUSTOMER OPERATIONS
With TIBCO Spotfire, ZE has increased its market share. “We have a bigger client-base, and clients are happier with what we’re delivering. They’re increasing ROI,” says El-Ramly. “There are higher excitement levels. We don’t have insight into everybody using our product because we’re delivering a flexible platform that empowers them to help themselves; however, we

News from Data Vendors
News from Data Vendors
58February 2015
know BI is already a large footprint in the organization, and we feed it. Usership of our data has easily doubled in corporations that use BI.”
BETTER CLOSE RATES
Integration with TIBCO has also helped naturally enhance sales opportunities. Says El-Ramly, “We know our close rate is better. The value to the client is much more tangible. They see a wider scope to our offering and a higher ROI because they get faster analysis, faster decision-making, and greater productivity.”
GREATER CUSTOMER PRODUCTIVITY AND SATISFACTION
El-Ramly says that ZE’s more holistic solution increases customer satisfaction. “With more components and capacity, you reach users you’ve never seen before. With a wider solution, you have a wider client-base. You have more users and higher satisfaction. Customers are saying that analysis that used to take days to build now takes just hours. Things they built before could only serve one person, now they can build something in hours that actually propagates across the organization.”
INCREASED COMPETITIVENESS
A more differentiated offering has increased ZE’s competitiveness. “When we’re at the table making proposals, the conversation goes in different directions now,” says El-Ramly. “Before we were focused on data management and integration. Now, when BI comes up, it invites more people to the table, and you gain more influence.”
Future
Because BI is a large and growing force inside most organizations, ZE has the potential to serve more customers in more markets and meet its growth goals. “BI gives us the capacity to do more with a customer without necessarily being involved. As long as our data is integrated with these tools, we are the fuel,” says El-Ramly. “This partnership with TIBCO is going to help us do that. We’re going to continue to grow our own product, make it better, and integration easier—and we’re going to look at better ways to feed downstream systems such as TIBCO. There is so much more to come for us.”

News from Data Vendors
News from Data Vendors
59February 2015
PEGAS to Enhance Geographical Offer with NBP, ZEE, and PSV ContractsLeipzig, Paris, February 3, 2015 – PEGAS, the pan-European gas trading platform operated by Powernext, will launch Spot and Futures products for the UK’s National Balancing Point (NBP) as well as for the Belgian Zeebrugge Beach (ZEE) market area on March 26. Financially settled Futures contracts (ICIS Heren) for the Italian Punto di Scambio Virtuale (PSV) will be launched at the same time.
Jean-François Conil-Lacoste , Chief Executive Officer of Powernext, mentions: “The aim of PEGAS is to offer natural gas products for all major European hubs. This is what we will further pursue with our new offering.”
Dr. Egbert Laege , Executive Director Gas Markets of EEX Group, adds: “Our members will benefit from access to all hubs via the PEGAS platform. The upcoming products and the corresponding location spreads open up completely new trading opportunities.”
The launch of products for the ZEE market area follows the successful start of Belgium’s ZTP delivery zone in 2014. On the Spot market, the offering for NBP and ZEE will include Within-Day and Day (Day-Ahead, Weekend, Saturday, Sunday and Individual Day) contracts. On the Derivatives Market, Month, Quarter, Season and Calendar Year products will be tradable. Moreover, PEGAS market participants will have the possibility to trade cleared location spread contracts between ZEE and NBP for the first time. Location spreads between the existing physical products on the Dutch TTF market area and the upcoming financially settled Futures contracts on the PSV will also be offered.
About PEGAS:
PEGAS is the central gas trading platform of EEX Group operated by Powernext. PEGAS provides its members with access to all products on one single platform and allows them to trade natural gas contracts in the Belgian, Dutch, French and German market areas. The product range of PEGAS covers spot and derivatives contracts for the major European gas hubs as well as trading in location spread products between these market areas. This setup enables market harmonization and forms the leading pan-European natural gas market. For more information: www.pegas-trading.com
About EEX Group:
EEX Group provides the central market platform for energy, energy related and commodity products and enables access to a network of over 350 trading participants. The offering of the group comprises contracts for Energy, Environmentals, Freight, Metals and Agriculturals listed at the European Energy Exchange, EPEX SPOT, Powernext, Cleartrade and Gaspoint Nordic.

News from Data Vendors
News from Data Vendors
60February 2015
Clearing and settlement of transactions concluded or registered on the exchanges is provided by the central clearing house European Commodity Clearing. EEX is part of Deutsche Börse Group. For more information: www.eex.com
About Powernext:
Powernext is a regulated market operating under AMF supervision. Powernext manages the natural gas activities of the EEX Group under the PEGAS brand throughout Europe, and operates the National Registry for electricity guarantees of origin in France. Powernext owns 50% in EPEX SPOT, 20% in EEX Power Derivatives and 1.5% in ECC. For more information: www.powernext.com
PEGAS Introduces Trading for New Common Market Area “TRS” in Southern France on 31 MarchLeipzig, Paris, February 24, 2015 – On April 1, 2015, a common market area will be implemented in southern France under the name “Trading Region South” (TRS) replacing the existing GRTgaz PEG Sud and the TIGF market areas. PEGAS, the pan-European gas trading platform operated by Powernext, announces that Spot and Futures products will be tradable on the TRS market area from March 31, 2015, replacing the existing PEG Sud and PEG TIGF contracts which have been traded on Powernext since 26 November 2008.
Thierry Trouvé, CEO of gas transmission operator GRTgaz, mentions: “The establishment of TRS will increase the attractiveness of the French gas market. This is a first step towards the creation of a single wholesale gas market in France by 2018 as encouraged by the French Energy Regulator CRE”.
Monique Delamare, CEO of gas transmission and storage operator TIGF, adds: “The main aim of TRS is to simplify client access to the wholesale gas market in southern France, introducing a common price for the settlement of imbalances. As from 1 April 2015, shippers will no longer have to subscribe capacities to the interconnection of the two networks”.
“Powernext welcomes the TRS initiative, as a more liquid southern French area will help our Members to balance their portfolio in this region where volatility is comparatively much stronger than on PEG Nord due to its strong dependency on LNG imports and regularly congested connection with PEG Nord”, comments Jean-François Conil-Lacoste, CEO of Powernext.

61February 2015
News from Data Vendors
Italian Borders Market Coupling to Launch on February 24, 2015February 2, 2015 – The Italian Borders Market Coupling Project is scheduled to launch on February 24, 2015. The Go-Live is subject to the final approval by the involved regulatory authorities. Three of the five borders of the Italian Borders Market Coupling Project will be coupled with the Multi-Regional Coupling (MRC), thus linking the majority of EU power markets - from Finland to Portugal and Slovenia. The launch of the Italian Borders Market Coupling provides evidence of the flexibility and reliability of the Price Coupling of Regions (PCR) solution.
After successful completion of all testing activities in January 2015, the launch of the Italian Borders Market Coupling will take place on February 24, 2015. From this date onwards, capacity for the Italian-Austrian, Italian-French and Italian-Slovenian borders will be implicitly allocated through the PCR solution for the Day-Ahead markets, making those borders part of the MRC.
The Day-Ahead markets of MRC extended to the Italian Borders Market Coupling will cover 20 European countries, accounting for about 2,800 TWh of yearly consumption. The daily average cleared volume over these countries will amount to over 4 TWh, with an average daily value of over €150m.
In addition, with reference to the market coupling currently in operation between Italy and Slovenia, the Gate Closure Time for the Day-Ahead Markets of Italy and Slovenia is set at 12:00 pm starting from the trading date February 10, 2015 (delivery date February, 11 2015).
Information regarding the Italian-Swiss border
Though all Swiss borders are technically ready for market coupling, their coupling is delayed in the course of ongoing bilateral negotiations between Switzerland and the EU Commission. The partners remain ready to go live within a short timeframe, as soon as the present political situation evolves.
Information regarding Italian-Greek border
The Italian-Greek border will be technically ready for market coupling at a later date. The Go-Live date of the Italian-Greek border will be decided as soon as its technical readiness to enter has been assessed within the Italian Borders Market Coupling project.
Information regarding regulatory approval
As stated in the first page, the launch of the Market Coupling remains subject to the approval of the National Regulatory Authorities of Austria, France, Italy and Slovenia. Consequently, the confirmation of the Market Coupling launch on the Italian Borders will happen when such approvals by all National Regulatory Authorities have been published.

62February 2015
News from Data Vendors
About the Projects
The Multi-Regional Coupling (MRC) is a pan-European project dedicated to the integration of power spot markets in Europe. It is a cooperation between the Power Exchanges APX, Belpex, EPEX SPOT, Nord Pool Spot and OMIE, and the Transmission System Operators 50Hertz, Amprion, Creos, Elia, Energinet.dk, Fingrid, National Grid, REE, REN, RTE, Statnett, Svenska Kraftnät, TenneT TSO B.V. (Netherlands), TenneT TSO GmbH (Germany) and TransnetBW. The cooperation operates a price coupling of the Day-Ahead wholesale electricity markets, increasing the efficiency of the allocation of interconnection capacities of the involved countries and optimising the overall social welfare. The MRC relies on one single algorithm, calculating simultaneously the electricity market prices, net positions and flows on interconnectors between bidding zones, is based on implicit auctions and facilitated through the Price Coupling of Regions solution. The MRC currently covers countries accounting for 75% of European power consumption.
Price Coupling of Regions (PCR) is the initiative of seven European Power Exchanges (APX, Belpex, EPEX SPOT, GME, Nord Pool Spot, OMIE and OTE), to develop a single price coupling solution to be used to calculate electricity prices across Europe and allocate cross-border capacity on a day-ahead basis. This is crucial to achieve the overall EU target of a harmonised European electricity market. The integrated European electricity market is expected to increase liquidity, efficiency and social welfare. PCR is open to other European Power Exchanges wishing to join. Today, PCR is used to couple the Multi-Regional Coupling, covering 75% of European consumption, and the 4M Market Coupling between the markets of Czech Republic, Hungary, Romania and Slovakia.
Italian Borders Working Table (IBWT) is a joint Market Coupling project between the Transmission System Operators (ADMIE, APG, ELES, RTE, SWISSGRID and TERNA) and Power Exchanges (BSP, GME, EPEX, EXAA and LAGIE) of Austria, France, Greece, Italy, Slovenia, and Switzerland, with the support of CASC and ECC. This project aims to define the pre-coupling, post coupling and exceptional situations processes that are necessary to allow the operation of Market Coupling between MRC and the Italian-Borders day-ahead markets.
Ten Considerations for the European Internal Energy MarketParis / Leipzig / Bern / Vienna, February 5, 2015 – The European Power Exchange EPEX SPOT has published a Policy Paper entitled “Advocacy for an Integrated and Competitive Electricity Market in Europe”. The paper outlines ten considerations by EPEX SPOT that would support and facilitate the integration of the European power market.
Recent interventions in national energy markets have set the scene for a major turning point in the European energy policy. At the same time, State and Government leaders have agreed on the new EU climate and energy framework for 2030, during the European Council of October 2014. In the coming months, decision makers and stakeholders of the energy sector will face important political choices. They should stand firm behind a European and market-based energy policy.

63February 2015
News from Data Vendors
The European Power Exchange EPEX SPOT is deeply committed towards the goals of the Internal Energy Market and the Energy Union. Accordingly, the Policy Paper outlines current challenges, discusses considerations for an efficient energy policy and explores the role of the European Power Exchange as one of the pillars of the electricity value chain. We invite European decision makers to take these considerations into account while fostering an integrated and competitive European electricity market.
The Policy Paper can be found on the website of EPEX SPOT (www.epexspot.com) or by following the link above.
The European Power Exchange EPEX SPOT SE operates the power spot markets for Germany, France, Austria and Switzerland (Day-Ahead and Intraday). Together these countries account for more than one third of the European power consumption. EPEX SPOT also acts as market operating service provider for the Hungarian Power Exchange HUPX and operates the coupling between the Czech, the Slovak, the Hungarian and the Romanian markets on behalf of the local Exchanges. It is a European company (Societas Europaea) based in Paris with branches in Leipzig, Bern and Vienna. Over 220 companies from Europe are active on EPEX SPOT. 382 TWh have been traded on EPEX SPOT’s markets in 2014.
Platts Forward Curves – PetrochemicalsFebruary 20, 2015 - Platts Forward Curves-Petrochemicals (PFC-Petchems) subscribers now have access to forward curves that are based on Platts’ long-established Market-On-Close (MOC) price assessment process and reflective of open market values every trading day in Asia, Europe and North America at market close.
The product includes 40 forward curves, spreads and differentials on a regional basis, as well as forward prices for key petrochemical inputs. Read the brochure for more information.

64February 2015
News from Data Vendors
OTC Global Holdings Launches EOXLive MarketsCommodities platform from leading IDB provides transparency, pre-trade intelligence and unmatched liquidity
HOUSTON (February 23, 2015) – OTC Global Holdings LP (OTCGH), the leading independent commodities interdealer broker, today announced the launch of EOXLive active markets.
The commodities platform provides traders and risk managers with unique information and liquidity not currently available on any screen. EOXLive and independent software vendor (ISV) screens will initially feature OTCGH pre-trade markets and last-traded prices for natural gas options. The platform will soon expand into OTCGH’s full set of commodities markets to lever-age the firm’s strong market share in natural gas, power, petrochemicals, crude, refined prod-ucts, metals, agricultural, weather and emission derivatives markets. In addition, customers will soon be able to send requests and submit orders through EOXLive.
“The EOXLive platform is bringing unprecedented transparency, pre-trade intelligence and liquidity to these commodity markets,” said Javier Loya, chairman and CEO of OTCGH. “OTCGH made a name for itself as a pioneer in this industry by daring to do things differently. The launch of EOXLive markets is the latest example of our forward thinking, technology-driven and customer-centric approach to doing business.”
The launch is part of OTCGH’s mission to provide unmatched customer service and liquidity to its customers. For more information or to receive access to EOXLive, visit http://www.otcgh.com/eox or contact EOXLive via email: [email protected], AIM: eoxops or phone: 877-737- 8511.
About OTC Global Holdings
Formed in 2007, OTC Global Holdings has become the world’s largest independent institutional broker of commodities, covering financial and physical instruments from offices in Chicago, Geneva, Houston, New Jersey, London, Louisville and New York. The company is a leading liquidity provider on CBOT, ICE and NYMEX, ranking number one amongst its peers in numerous derivatives contracts across biofuels, emissions, commodity index products, crude oil, natural gas, natural gas liquids (NGLs), metals, petrochemicals and refined products, power, proppants, soft commodities, and weather derivatives. The company serves more than 450 institutional clients, including over 70 members of the Global Fortune 500, and transacts in hundreds of different commodity delivery points in Asia, Europe and the Americas. To learn more about the company, please visit www.otcgh.com or go to https://www.youtube.com/watch?v=u5Ohwr7h3tE.

Monthly M
arket Analysis
65
According to data from NYMEX, crude oil prices for Brent and WTI more than halved between June 2014 and February 2015. The decline accelerated in November when Saudi Arabia and Gulf allies used their influence within OPEC to keep production rates stable, rather than cut-ting output to prop up prices. (Reuters)
Since Brent found its bottom on January 13, 2015, with a price set at $45 USD/ Bbl for Brent and $55 USD/ Bbl for WTI, prices have risen moving into February, as short-covering returned to a market depressed earlier by worries about euro zone stability. (Reuters) Furthermore, increased global demand and geopolitical concerns about energy supplies from Libya and Russia pushed prices up. In comparison to January 2015, the spread between WTI and Brent futures has gotten wider, from $2 USD/ Bbl in January 2015 to $7 USD/ Bbl in February 2015, resembling Brent-WTI spread differentials from early 2014. (Reuters)
In February 2015, data from NYMEX prompt-month future settlements showed that Brent and WTI oil prices traded at $52 USD/Bbl and $51 USD/Bbl below the last 12-month average. Furthermore, the last 12-month averages for Brent and WTI on NYMEX dropped to $92 USD/Bbl and $86 USD/Bbl, respectively. The Brent-WTI spread (represented by the purple area in the graph above) sat at $7 USD/Bbl this month, which was $1 USD/Bbl below the last 12-month average of $6 USD/Bbl.
Monthly M
arket Analysis
February 2015
Crude Oil Brent vs. WTI: Prompt-Month Contract (NYMEX)
© Graph created with ZEMA

Monthly M
arket Analysis
66
Monthly M
arket Analysis
February 2015
According to data from NYMEX future settlements, the Brent and WTI prices for delivery will climb over the next two years, after prices have hit the floor in January 2015. The price of WTI for delivery in March 2015 remained unchanged at $48 USD/Bbl this month, while the price of Brent increased from $50 USD/Bbl to $51 USD/bbl. The Brent-WTI spread also increased from $2 to $5 USD/Bbl (the purple area) on average for the next 24 months.
Over the next six months, WTI futures are expected to gain as much as 4% while Brent is expected to increase as much as 6%. The pace of oil rigs actively drilling in the United States slowed since February 20, 2015, as a stronger dollar and underlying concerns over a surplus in supplies as OPEC resisted calls to cut output drove prices up. The data raised worries that US crude inventories, already at record highs, could increase further. (Reuters)
Crude Oil Brent vs. WTI: Forward Curve (NYMEX)
© Graph created with ZEMA

67February 2015
Monthly M
arket AnalysisNorth American Natural Gas Spot Prices (NYMEX)
© Graph created with ZEMA
On the New York Mercantile Exchange (NYMEX), prices at Henry Hub, PG&E, and Chicago remained relatively flat and at just below $3 USD/MMBtu throughout the first three weeks of February 2015. Northeastern Gas, as represented by Transco Zone 6, was the most volatile among all observed locations with prices ranging from $3.09 USD/MMBtu on February 2 to $5.25 USD/MMBtu on February 11, dipping to $4.66 USD/MMBtu the next day and settling at $5.59 USD/MMBtu on February 20. Prices at Transco Zone 6 averaged out at $4.49 USD/MMBtu over the course the first 20 days of February 2015 as the cold spell continued, even as new storm system was expected to move into the region. (EIA)
When compared to the first 20 days of January 2015, the average prices decreased as tem-peratures warmed and demand declined. Prices fell from $4.18 USD/MMBtu in New York’s Transco Zone 6 to $1.75 USD/MMBtu, from $3.17 USD/MMBtu in Chicago to $2.84 USD/MMBtu, from $2.96 USD/MMBtu in Henry Hub to $2.73 USD/MMBtu, and from $3.28 USD/MMBtu in California’s PG&E Citygate to $2.91 USD/MMBtu. Comparing February 2015 prices to the same period last year, monthly average gas prices decreased in New York’s Z6, Chicago Citygates, Henry Hub, and PG&E by 6%, 45%, 47%, and 58%, respectively.
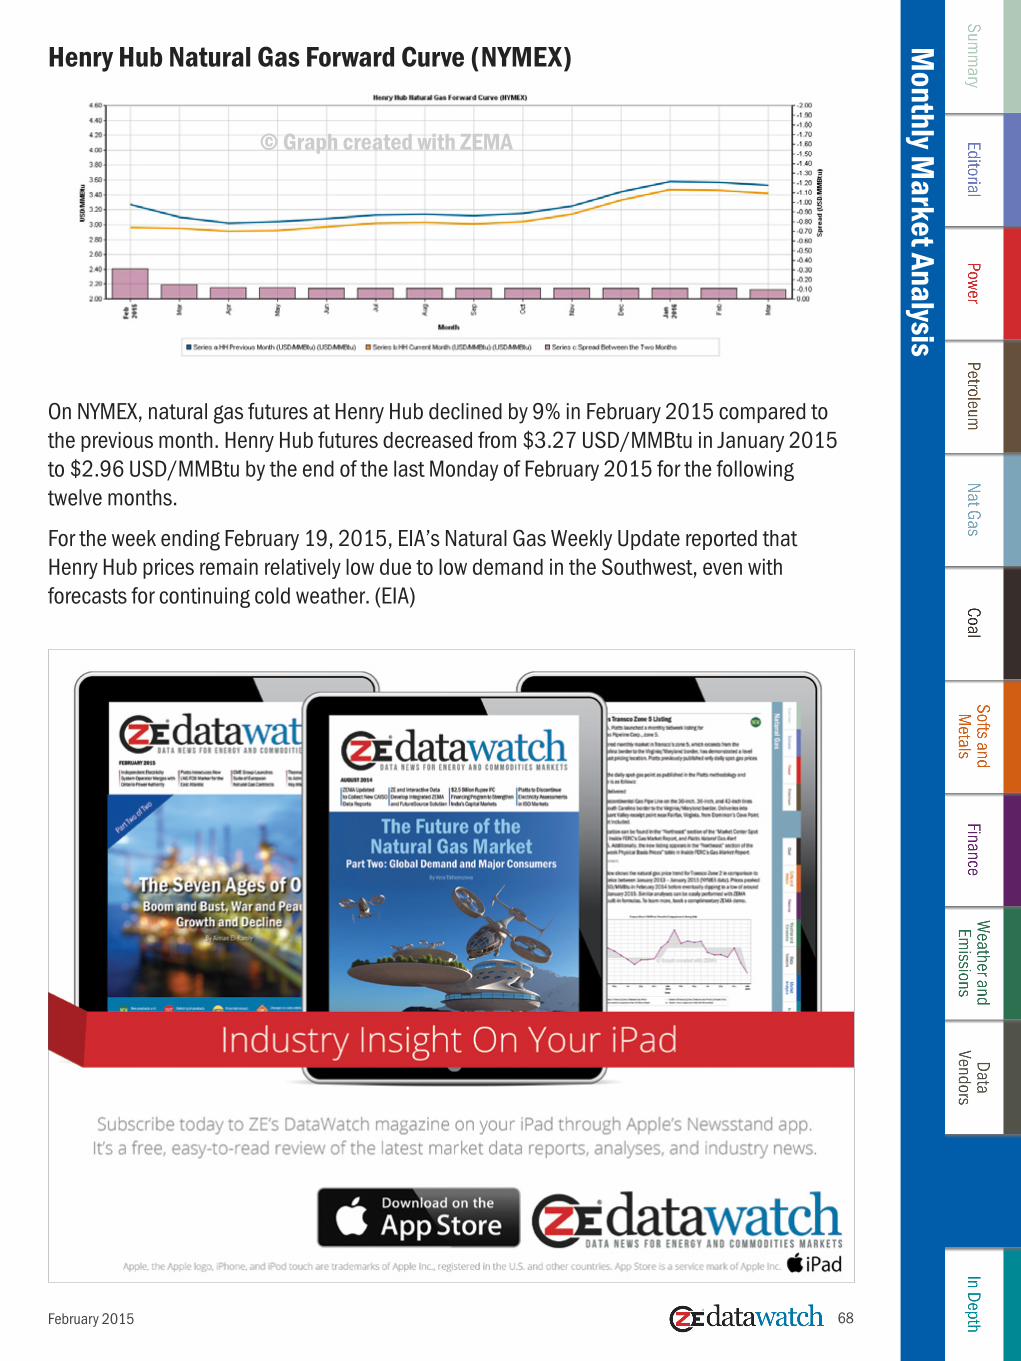
Monthly M
arket Analysis
68
Monthly M
arket Analysis
February 2015
Henry Hub Natural Gas Forward Curve (NYMEX)
© Graph created with ZEMA
On NYMEX, natural gas futures at Henry Hub declined by 9% in February 2015 compared to the previous month. Henry Hub futures decreased from $3.27 USD/MMBtu in January 2015 to $2.96 USD/MMBtu by the end of the last Monday of February 2015 for the following twelve months.
For the week ending February 19, 2015, EIA’s Natural Gas Weekly Update reported that Henry Hub prices remain relatively low due to low demand in the Southwest, even with forecasts for continuing cold weather. (EIA)
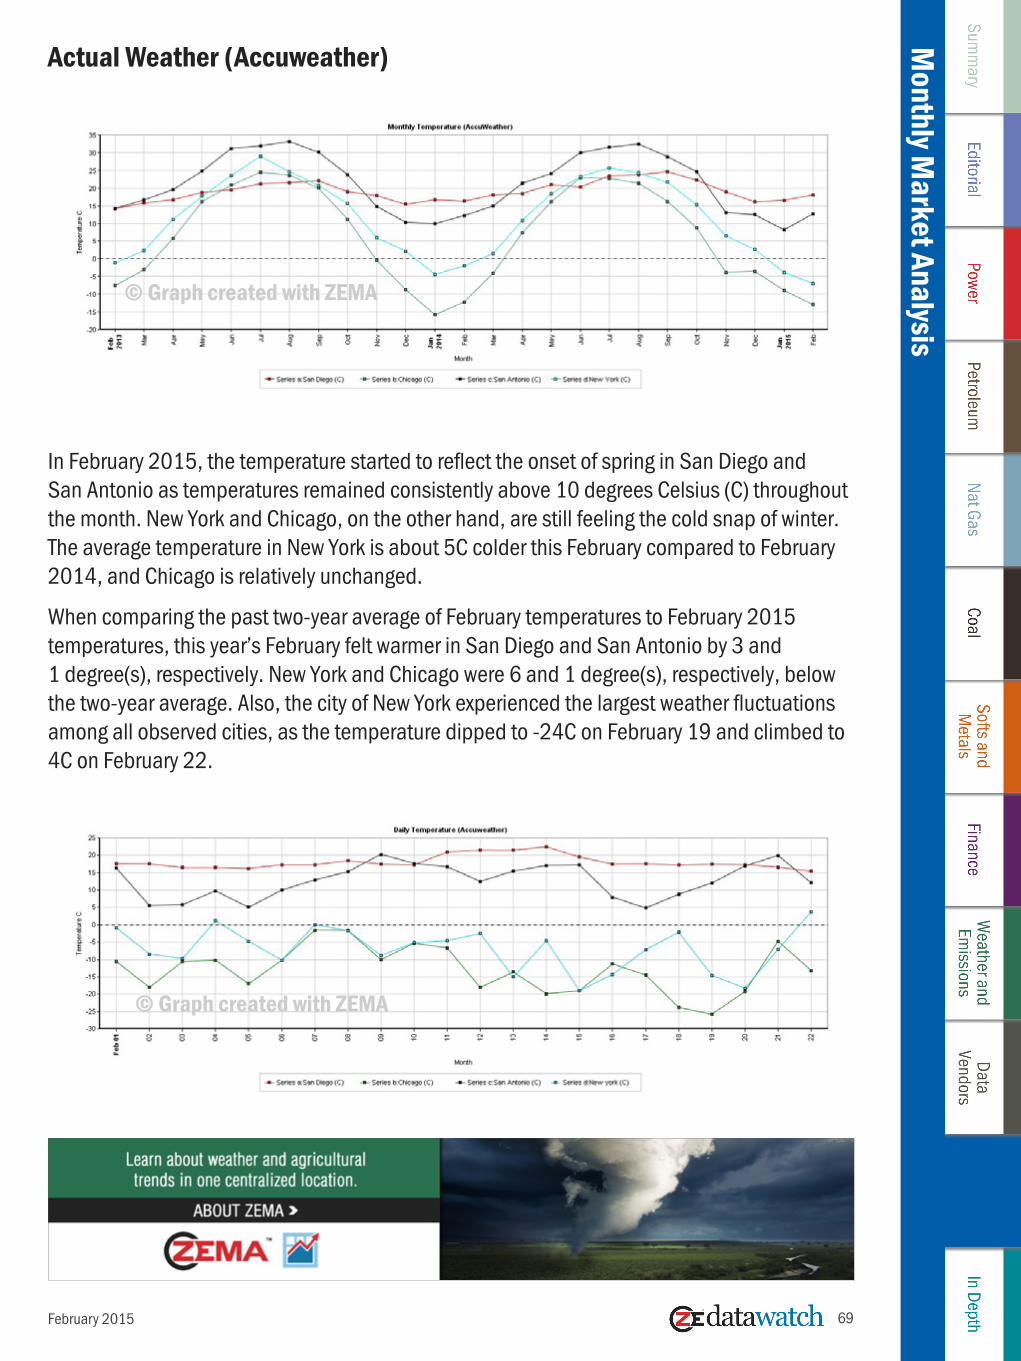
Monthly M
arket Analysis
69
Monthly M
arket Analysis
February 2015
In February 2015, the temperature started to reflect the onset of spring in San Diego and San Antonio as temperatures remained consistently above 10 degrees Celsius (C) throughout the month. New York and Chicago, on the other hand, are still feeling the cold snap of winter. The average temperature in New York is about 5C colder this February compared to February 2014, and Chicago is relatively unchanged.
When comparing the past two-year average of February temperatures to February 2015 temperatures, this year’s February felt warmer in San Diego and San Antonio by 3 and 1 degree(s), respectively. New York and Chicago were 6 and 1 degree(s), respectively, below the two-year average. Also, the city of New York experienced the largest weather fluctuations among all observed cities, as the temperature dipped to -24C on February 19 and climbed to 4C on February 22.
Actual Weather (Accuweather)
© Graph created with ZEMA
© Graph created with ZEMA

Monthly M
arket Analysis
70
Monthly M
arket Analysis
February 2015
On the ICE, day-ahead peak electricity prices have remained flat in February 2015 in ERCOT North 345 kV and CAISO SP15. NYISO, as represented by Zone A prices and PJM represented by APS Zone, illustrates an upward trend of prices as a result of a drop in temperatures in the East. While CAISO and ERCOT prices remained stable throughout the month, from $34 and $28 USD/MWh, respectively, at the beginning of the month, PJM peak power rose from $43 USD/MWh at the beginning of the month to $88 USD/MWh on February 20, with prices peaking at $50 in the middle of the month. Similarly, NYISO Zone A also experienced a sharp increase in price, rising from $43 USD/MWh at the beginning of the month to $86 USD/MWh on February 20.
A sharp decrease in temperature in New York and Chicago between February 9 and February 20 could be responsible for the spike in prices compared to the other observed cities.
Electricity: Day-Ahead Prices (ICE)
© Graph created with ZEMA

In Depth
The Seven Ages of Oil:Boom and Bust, War and Peace,
Growth and DeclineBy Aiman El-Ramly
In Depth
71February 2015
The Seven Ages ContinuedIn Part One of our feature story from last month, we covered the first four of the “seven ages of oil.”
1. 1859-1870: Illumination Births an Industry
2. 1870-1911: Rockefeller Creates the Multinational Oil Standard
3. 1911-1921: A Pax on Arabia
4. 1921-1973: Texas Oil Boom in the Gusher Age
You may recall that we defined the seven ages of oil as those periods in time that saw oil price growth followed by periods of accumulated average price decline of greater than 30% (for clarity, all prices quoted are in real 2014 inflation-adjusted dollars). Oil has taken a deep dive since its high of nearly $150/barrel in June 2008, following the implosion of SemGroup, the oil and natural gas transportation company. In the last month, oil has been dancing a fickle strut between $48 and $54, in what some may call a dead cat’s bounce from the low of $45 that we talked about last month.
You may also recall that last month we quoted predictions from Goldman Sachs of a possible decline to $30 and from an Iranian Oil Minister a decline to $25. Had we waited another month, we would have quoted Citi stating that the current surge in oil prices is just a “head-fake.” And Citi would go even further by reducing their annual forecast for Brent crude and forecasting momentary drops to $20. We are in an oil glut not seen since the East Texas
Part Two of Tw
o
By Aiman El-Ramly, C.S.O. ZE PowerGroup [email protected]

In DepthIn Depth
72February 2015
oil rush. Even with rig counts and drilling in decline, production in the United States remains at an all-time high. This is backed by EIA reports showing that the amount of oil stored by refiners, traders, and others are at the most extreme level in 80 years. And it is not only the United States in a position of flagrant over-production. The glut is so severe that the available storage may possibly become maxed out, which would obviously put incredible downward pressure on prices. US oil is on the brink of overflowing.
What is more, we are back to the heyday of a global competition reminiscent of the Cold War, when Russia and the United States went head-to-head on all fronts. The cold, hot, cold war is heating up again with strife and global posturing over events in the Crimean Peninsula and the ensuing conflict in Ukraine. Just like the United States, Russia is also pumping oil at record levels. Not to be left out, Brazil is pumping out oil feverously, and the pivotal OPEC nations are strong on production and cutting prices. Saudi Arabia, Iraq, Iran, and Kuwait are offering prices to Asia that have not been seen for fourteen years. The times are reminiscent of Rockefeller’s classic monopolistic market saturation and the price discounting ploys of Standard Oil and similar stratagems deployed during the US oil oligarchies of the Texas Oil Boom. But back then, as now, not everyone could chase the European or Asian markets, and the current prices are absolutely not sustainable. There has to be fallout. The question is: who is going to bail, or be excised, from the market?
The transformation of the United States, enabled via the innovations in fracking technology introduced by George P. Mitchell, from a net importer fighting a global war for energy security to total energy liberation by the shale boom has wholly changed international political and economic relations. The Obama Administration is actively opening up a new front on the war on oil by clearing the way for the shipment of as many as a million barrels per day of ultra-light US crude to the rest of the world.
A four-decade ban on oil exports could be lifted, thus plunging the United States headlong into the battle for Asian and European markets.
With energy independence achieved in the United States, and the world’s largest oil market effectively closed to any significant imports, everyone must be asking the question of relevance – who will be the relevant oil nations of the future? Or more specifically, can the OPEC nations have relevance in the future when they no longer form an integral part of the Pax of Western nations?It is hard to imagine a time when the Middle East was in more disarray than it is now. The crisis that exists following the Iraq War, Arab Spring, and the current rise of ISIS dwarfs the events of the Yom Kippur War and conflict with Israel. And now, with the change in the global energy play, the last ace in the Middle East may have fallen. But let us not get ahead of ourselves. How did we actually come to a point where we are asking if there is a future for OPEC? We will answer that question and others as we cover the final three of the seven ages of oil:
5. 1973-1994: The Middle East Shrugs its Shackles
6. 1994 -2008: Deregulation, Speculation, Manipulation, and Detonation
7. 2008-2015: All Fracked Up

In DepthIn Depth
73February 2015
1973-1994: The Middle East Shrugs its ShacklesIt is important to understand that the oil industry is largely a Western invention and is very much American led. When America began making overtures to King Ibn Saud of Saudi Arabia in the post-depression years, the British balked. At this time, Ibn Saud’s kingdom was a fractious collection of warring nomadic bands spread out across a desert wasteland. They were only brought together with a heavy hand. The worldwide depression reached its long fingers into the desert as well. The King was desperate for money. The American gamble won out. Quickly thereafter, with the discovery of oil, the American oil companies began transforming the Middle East into an oil economy. America had established itself firmly in the Middle East, much to the chagrin of the British.
Ironically, as the US was making headway in Arabia, establishing a firm foothold in foreign oil reserves, the rest of the world was pushing back against its former colonial masters. Nationalism was the word of the day and would be a contributing factor to the Second World War. Indeed, WWII fueled nationalistic fervor across the entire oil-producing world, most notably in Iran and Venezuela. These two countries would be critical in bringing about OPEC. While the idea initiated in Venezuela, it would be ratified in Bagdad. Ostensibly, it was the intention of the five founding members – the Islamic nations of Iran, Iraq, Kuwait, and Saudi Arabia along with Venezuela – to mitigate the price control ability of the Seven Sisters. The Seven Sisters were the global oil majors of ESSO, Shell, BP, Mobil, Chevron, Gulf, and Texaco. It was perceived, justifiably, that the Sisters were able to keep oil prices depressed to the benefit of Western growth, while exclusively benefiting from the balance of the integrated oil business. As nationalistic fervor and a reaction against what was seen as Western oppression (a greed for oil) intensified, OPEC would grow to include Qatar, Indonesia, Libya, The United Arab Emirates, Algeria, Nigeria, Ecuador, Gabon, and Angola.
With the insertion of Israel into the Middle East, resulting in the Israeli-Palestinian conflict, tensions grew. But these tensions came to a head with the overt involvement of the United States in the Yom Kippur War. Iran had previously been stung by British and American
Figure 1: US oil price fluctuations throughout the Seven Ages of Oil (1859-2015)
© Graph created with ZEMA

In DepthIn Depth
74
involvement during the Iranian coup d’état in 1953. That operation was a blatant action to retain oil concession from the Anglo-Iranian Oil Company. Recall that Anglo-Iranian Oil was the biggest foreign asset of the United Kingdom at the time, which was remarkable, given the impressive colonial reach of the British Empire. This made the oil company a massive asset, one deemed critical to the security of the Empire.
The CIA staged the overthrow, hiring local thugs and importing others to overrun the streets. The payoff to the United States was a share of concessions that would last for 26 years and the control of Iran through a puppet shah. In the preceding years, every effort was made to smother Iranian nationalism, including crippling oil embargos and subversion; however, when clandestine operations and economic throttling fail, overt force has been the traditional means of securing Western interests.
Jumping ahead to 1973, in retribution for Egypt’s humiliation at the supposed hands of the Americans, OPEC sent a decisive message: self-determination for oil-producing nations – a permanent throwing off of the colonial yoke whether in the Middle East or South America. The resulting oil embargo and price setting ignited the Middle East tinderbox. The region has been burning fiercely for four decades. The flames, bombs, and gunfire have visited every Arab country and every Western nation in the form of terrorism. Terrorism, fanatic nationalism/ Islamism, remains today the greatest threat facing the oil industry and global security.
The action by OPEC shook the very foundation of the Western Pax. The West, at least momentarily, was on its back heal. A negotiated transition to nationalism for oil producing nations was no longer a possibility. As the taps gradually closed, prices soared, resulting in 100-year highs. Rationing and long lines at the gas pump, fixtures of wartime, were revived. Energy security, and its direct association with national security and Western freedom, became the paramount issue of the 1970s. The oil crisis was upon the world. The exit from the Golden Age of prosperity for the West came at the stroke of a pen at the Kuwait meeting of OPEC on October 20, 1973. Over the next year, crude price would quadruple. World markets,
February 2015
“After 1980, hard economic times reduced demand for oil, and overproduction resulted in a glut on the world market.”
already in turmoil after the untimely (short-sighted) unilateral cessation of the Bretton Woods Accord by President Nixon, were sent into further disarray. The hope to tie oil prices to the US dollar instead of gold may have been better served at a much later date.
Recession and inflation were to be banes of the financial world well into the 1980s. After 1980, hard economic

In DepthIn Depth
75
times reduced demand for oil, and overproduction resulted in a glut on the world market. The result was a six-year slide in oil prices culminating with a 46% price drop in 1986. The 1986 oil price collapse may have benefited oil-consuming countries such as the United States, Japan, Europe, and many third-world nations, but it represented a serious loss in revenue for oil-producing countries in northern Europe, the Soviet Union, and OPEC.
The 1990 oil price spike occurred in response to the Iraqi invasion of Kuwait on August 2, 1990. Lasting only nine months, the price shock was less extreme and of shorter duration than the previous oil crises of 1973 and 1979-1980 when Russia invaded Afghanistan. Still, the spike and global fears may have been enough to trigger the recession of the early 1990s. Oil prices more than doubled in October; however, as the American-led coalition experienced rapid military success in Iraq, concerns over oil supply alleviated and prices declined. Iraq would again surface as a paramount world concern 10 years later.
The recession would last until the latter half of the 1990s, when commoditization of everything was stimulated by the rise of the Internet and the introduction of electronic trading at home. But this too would results in a series of totally unexpected, unmitigated, and disastrous market crashes: the tech bubble (dot.bomb), the California energy crisis, and the mortgage and loan debacle. From 2000 onward, it seemed that every year brought a new financial cri-sis, and truly, a new threat to world peace. The SEC and Homeland Security have been beleaguered in their attempts to keep up with the myriad threats to US and global economics, energy, and peace.
1994–2008: Deregulation, Speculation, Manipulation, and DetonationIn the opinion of the author, our most recent energy woes really begin when regulators got it into their minds that they could be as instrumental in making markets as they were in
February 2015
regulating markets in the 1990s. The result was a recession almost as devastating as that of the 1930s. The national blight of the depression-era wheat boom and bust shares a lot in common with tech boom and bust as well as the rise and virtual collapse of electric deregulation. It seems that, in oil, we must be riding towards a total collapse – a bottoming out as dramatic as any that has come before. While there may be some winners (for example Warren Buffet and the Shareholders of Berkshire Hathaway
“On July 11, 2008, as crude oil ascended to the lofty heights of $150/barrel, SemGroup of Tulsa, Oklahoma, was banking on a $5 billion payout.”

In DepthIn Depth
76
who bought distressed technology assets in the 1990s and then energy assets in the 2000s at bargain basement prices), there will surely be many more losers.
Since 2001, the United States has seen the 10 largest US bankruptcies in history: Lehman Brothers, Washington Mutual, Worldcom, General Motors, CIT Group, Enron, Conseco, MF Global, Chrysler, Thornburg Mortgage, and Pacific Gas and Electric. The cost of these bankruptcies – $1.5 trillion. The amount of money the American people paid to bail out the big US auto makers and their brethren in the American Recovery and Stimulus Act – three-quarters of a trillion dollars.
This aforementioned bankruptcy list does not even include the seminal SemGroup implosion that many attribute as the pivotal event that triggered the current oil price slide. On July 11, 2008, as crude oil ascended to the lofty heights of $150/barrel, SemGroup of Tulsa, Oklahoma, was banking on a $5 billion payout. However, not all that glitters is gold, or black gold for that matter. SemGroup had made a financial play, a massive one; and as the market sentiment turned due to a variety of social, economic, political, and physical factors, so did the price of oil.
The New York Mercantile Exchange (NYMEX) made a call on SemGroup. Boom goes the dynamite, as they say. Short on oil, SemGroup was forced to put up immediate cash as collateral to cover its losing positions. Unable to raise the necessary capital, SemGroup gave over its entire crude-oil futures position to Barclays investment bank and posted $2.4 billion to the exchange. Go straight to bankruptcy court; do not pass go; do not collect on your position. Following the demise of SemGroup, the price of oil swiftly declined by 60% to fall below $60/barrel. SemGroup gambled all on a spotted pony.
February 2015
The SemGroup story, save for the commodity, is similar to that of Enron, in that both organizations toppled due to an inability to meet a simple margin call. Management at both companies explicitly allowed traders to take positions that created massive exposure to unmitigated risk. In the case of Enron, market exposure was compounded by years of financial impropriety driven by a desire to increase stock price. Enron’s fall began with the sale of company stock in 2001 to meet margin calls. When it finally imploded, it was one of the 10 largest companies in the United States, and it became the singularly largest bankruptcy in history at the time. The dramatic death of Enron nearly took out
“The resulting plethora of regulation has made and destroyed markets, made and destroyed corporations, and made and destroyed nations …”

In DepthIn Depth
77
electricity deregulation with it, along with a whole industry. The truth is, electric deregulation stalled in 2001 and never again recovered the momentum it once had. The fervent call of FERC to deregulate the nation ceased overnight. The state of California approached bankruptcy, whilst the California Power Exchange did go bankrupt as well as one of the state’s largest electric utilities, PG&E. The electricity crisis battered the nation, much like the tech bust before it and the subprime crisis and fiscal cliff that were to follow. In hindsight, it is surprising that the Enron model is still ingrained in much of the trading operations that exist today. Like Standard Oil, what was one large, uncontrollable entity has morphed into a plethora of speculative trade shops in financialized energy and commodity markets.
Following the oil crisis, the United States went into regulation overdrive in frenetic efforts to maintain energy independence, forestall a pending peak oil crisis, maintain competitive energy advantage, and build new energy markets. The resulting plethora of regulation has made and destroyed markets, made and destroyed corporations, and made and destroyed nations – largely in the quest for the energy independence and associated economic and corporate freedoms in a globalized commodity trading market. If we look just since the 1990s, we can get a sense of the back-and-forth nature of energy regulation and its associated costs and benefits:
• 1992: Energy Policy Act (EPAct)
• 1996: FERC Orders 888/889/890
• 1996: NYMEX Electricity futures trading initiated
• 1996: Alberta Power Pool, ERCOT, PJM introduced
• 1998: Cal-PX Launched (Cal-PX bankrupt à Cal ISO)
• 1999: FERC Order 2000
• 1995: Energy Policy Act
• 2001: FASB 133 Accounting: Derivative Instruments and Hedging Activities
• 2002: Sarbanes Oxley
• 2006: FERC Order 670
• 2006: Global Solutions Warming Act of California Assembly Bill 32
• 2007: Energy Independence and Security Act
• 2007: Renewable Portfolio Standards
• 2009: Regional Greenhouse Gas Initiative (RGGI): 32
• 2009: American Recovery Act
• 2010: Dodd-Frank Wall Street Reform and Consumer Protection Act
• 2011: FERC Order 1000
February 2015

In DepthIn Depth
78
2008-2015: All Fracked UpThe current oil price situation we find ourselves enmeshed in stems both from market speculation and the realities of a world awash in an oil glut, stemming from the fracking game changer. While it could have been predicted, it seems that few accurately imagined what the reversal of the United States from a net energy importer to a potential net exporter would have on world markets. On July 11, 2008, when the price of crude oil peaked at nearly $150/bar-rel, the short-lived oil distributor out of Oklahoma, SemGroup, imploded. On the wrong side of the forward price curve, a potential $5 billion market gain instead resulted in a discounted liquidation of positions and assets. With Semgroup in bankruptcy, the industry started its tailspin. Prices spiraled by 60% before the big bounce back to north of $100. In hindsight, the volatility and recovery did not have a true basis in fundamental analysis.
The price drop was not due to either reduced demand or new supply. Rather, speculation before and after July 11 drove the price both up and down. The war for superiority in the virtual trading space can be just as fierce as that fought on the far-flung battlefields. In one case, the soldiers, rebels, and civilian casualties lie dead in the streets; in the other case, traders, financial houses, and investors stare in dead remorse at the red line across their computer screens.
In truth, since 2010, and even today, the markets have been chasing the Asian dream – the possibly misguided belief that China would be a price taker as it sought out energy sources to fuel its economic boom. The reality was, and is, that China is actually the price setter as every nation discounts its price in a courtship dance with the East. This was abundantly clear last May when Putin undercut the world and signed a $400 billion multi-year gas deal with Xi Jinping of China. Overnight, the LNG terminal aspirations of the world were put at risk. The fact is that Putin may have been the first to realize that with the concept of peak oil firmly in
February 2015
“Today is a moment in time when every friction point of the past 125 years exits at once.”
the basement, a glut of every type of energy available, and the markets in recession, only the bold get the prize. Now, every nation is price discounting in a still errant chase of the white whale. Alarmingly, there are not enough white whales to go around. And should the need arise, China has its own abundant untapped shale reserves, as does its neighbor, Russia.

In DepthIn Depth
79
The conservation and energy policies that the 1970s brought about have been for naught, given the current glut and global energy market woes. Where is the green exchange, the RPS markets, the alternative energy rebates, the demonization of oil, and Middle East Peace? They are nowhere to be found in an energy world turned on its head. These days, Obama prefers not to use the Nixonite term, War on Drugs, because drug abuse is a treatable disease. Obama also adopted the War on Terror that the junior Bush put in place post 9/11. The target was a Taliban almost as elusive as the purported weapons of mass destruction that falsely motivated the Iraq conflict 10 years after his father left the country with Kuwait oil fields blazing (but the Iraqi infrastructure intact).
Neither Bush was able to quell Iraq, even if the junior Bush hailed “mission accomplished” in a jumpsuit onboard a US aircraft carrier thousands of miles away from Iraq. Iraq is still a bloody mess. Saddam is dead. The Taliban nemesis has morphed into Al Qaeda, which has morphed into ISIS. And Obama is no closer to ending the illegal drug trade than he is at stopping terrorism. The Taliban is still strong and fighting in Afghanistan, and the country remains the world’s largest opium producer with record crops reported. Similarly, there is still rampant warfare in Iraq, and every week seems to bring a new ISIS beheading video. There is no exit from this, as there was no exit for Nixon from the energy crisis, no exit for Carter from the energy policy, no exit for Reagan for the Iran Contra affair, no exit for Clinton from strife in the Middle East (leaving Hilary to eventually deal with Hamas), no exit for either Bush from Iraq, and seemingly no exit for Obama from the Arab Spring and the revived War on Terror. And yes, all of this is about energy security and securing the price of a barrel of oil.
Today is a moment in time when every friction point of the past 125 years exits at once. There is monumental ideological conflict with Russia that has no end in sight. Almost every incumbent leader in the Middle East has been forcibly deposed (with US intervention) or died:
February 2015
Saddam Hussein (Iraq), Mohammed Zahir Shah (Afghanistan), Yasser Arafat (Palestine), Zine El Abidine Ben Ali (Tunisia), Hosni Mubarak (Egypt), Ali Abdullah Salah (Yemen), Moammar Gadhafi (Libya), and King Abdullah (Saudi Arabia). Any remaining autocrats beware.
Bashar Assad of Syria still stands, with the aid of Russia, but for how long? Sudan lies adrift in a murderous civil war that has raged too long and to which the world is largely blind. Almost every Arab nation is at war, preparing for war, or is in a war-like state. Should real conflict come to Iran, the outcome can only be disastrous, not just for the oil
“Certainly the current lower oil prices are a position much less tenable than that which existed prior to 1973.”
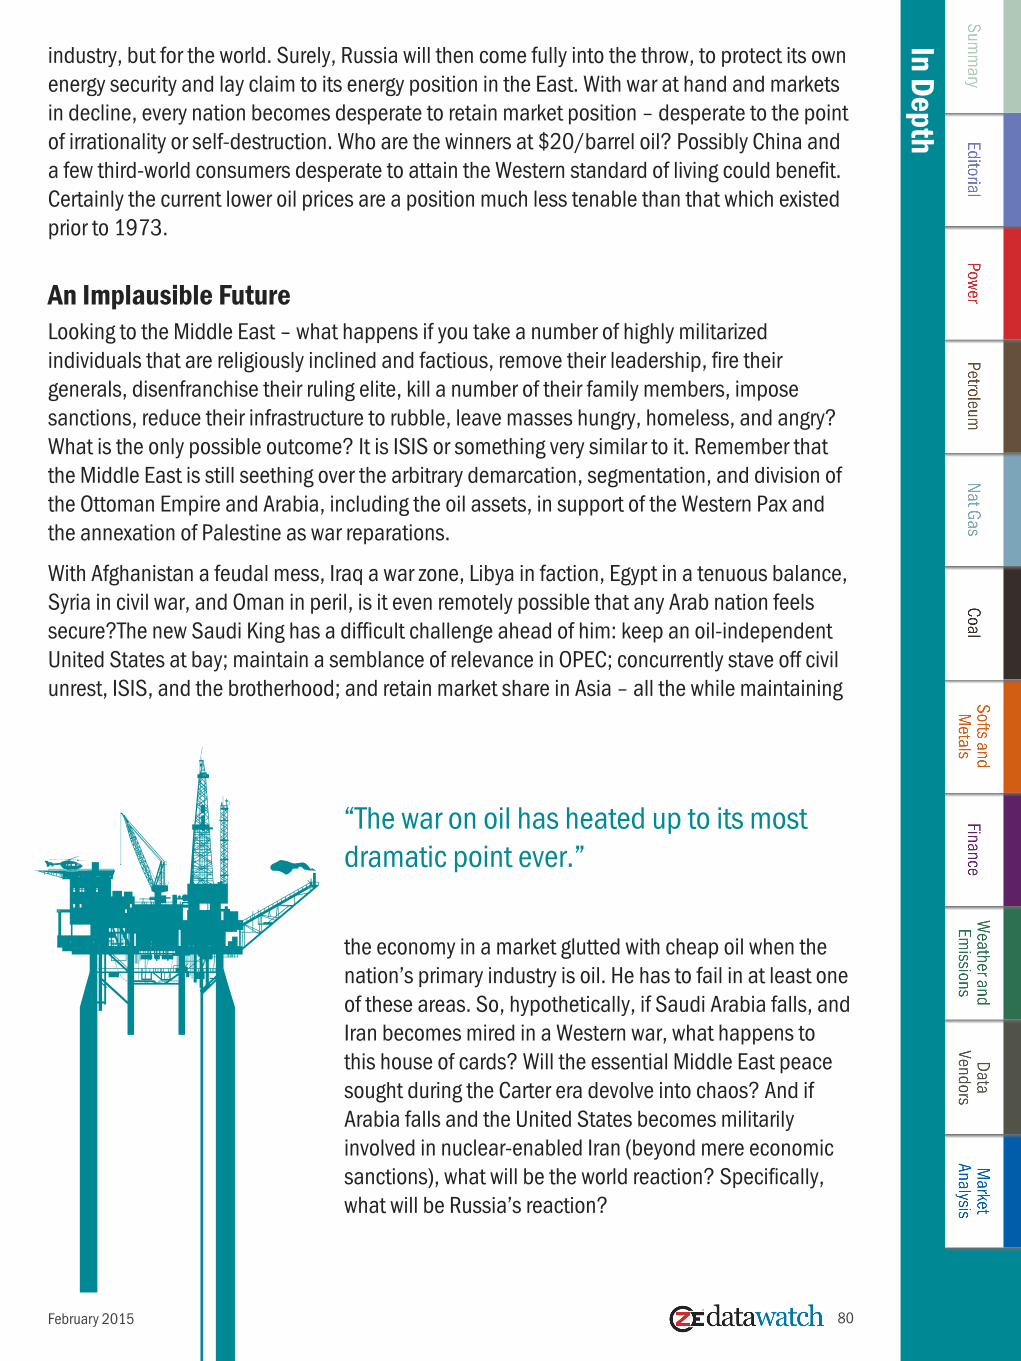
In DepthIn Depth
80February 2015
industry, but for the world. Surely, Russia will then come fully into the throw, to protect its own energy security and lay claim to its energy position in the East. With war at hand and markets in decline, every nation becomes desperate to retain market position – desperate to the point of irrationality or self-destruction. Who are the winners at $20/barrel oil? Possibly China and a few third-world consumers desperate to attain the Western standard of living could benefit. Certainly the current lower oil prices are a position much less tenable than that which existed prior to 1973.
An Implausible FutureLooking to the Middle East – what happens if you take a number of highly militarized individuals that are religiously inclined and factious, remove their leadership, fire their generals, disenfranchise their ruling elite, kill a number of their family members, impose sanctions, reduce their infrastructure to rubble, leave masses hungry, homeless, and angry? What is the only possible outcome? It is ISIS or something very similar to it. Remember that the Middle East is still seething over the arbitrary demarcation, segmentation, and division of the Ottoman Empire and Arabia, including the oil assets, in support of the Western Pax and the annexation of Palestine as war reparations.
With Afghanistan a feudal mess, Iraq a war zone, Libya in faction, Egypt in a tenuous balance, Syria in civil war, and Oman in peril, is it even remotely possible that any Arab nation feels secure?The new Saudi King has a difficult challenge ahead of him: keep an oil-independent United States at bay; maintain a semblance of relevance in OPEC; concurrently stave off civil unrest, ISIS, and the brotherhood; and retain market share in Asia – all the while maintaining
“The war on oil has heated up to its most dramatic point ever.”
the economy in a market glutted with cheap oil when the nation’s primary industry is oil. He has to fail in at least one of these areas. So, hypothetically, if Saudi Arabia falls, and Iran becomes mired in a Western war, what happens to this house of cards? Will the essential Middle East peace sought during the Carter era devolve into chaos? And if Arabia falls and the United States becomes militarily involved in nuclear-enabled Iran (beyond mere economic sanctions), what will be the world reaction? Specifically, what will be Russia’s reaction?

In DepthIn Depth
81
About ZE PowerGroup Inc.: ZE is an experienced software and strategic consulting firm that combines energy industry expertise with advanced software development capabilities. ZE is the developer of ZEMA, a sophisticated enterprise data management and analysis solution built to meet the challenges of participants in energy and commodities markets.
About ZEMA: ZEMA is an enterprise data management software designed for collecting data and performing complex analysis. ZEMA replaces fragmented data management processes with a sophisticated, unified, and automated system. Each ZEMA component is modular and scalable, giving clients greater flexibility when integrating it into their organizations. The solution is easy to use and backed by ZE’s support team around the clock. It has been ranked first in the Energy Risk Awards “Data Management House of the Year” category for five years in a row. In Energy Risk’s annual software survey and rankings, it is also consistently rated by end users as first in the “Preferred System,” “Ease of System Integration,” and “Customer Service” categories.
Disclaimer: ZE DataWatch is a report comprised of data updates and expectations for energy and commodities markets, powered by ZEMA. The news contained in ZE DataWatch is for information purposes only. Although ZE PowerGroup believes the information in this report to be correct, the organization does not warrant the accuracy or completeness of it. Information in this report is not intended to provide financial, legal, accounting, or tax advice and should not be relied upon in that regard. ZE PowerGroup is not responsible in any manner whatsoever for direct, indirect, special, or consequential damages, howsoever caused, arising out of the use of this report.
February 2015
The war on oil has heated up to its most dramatic point ever. On the surface, it may just look like another market bust, another technically based decline with some fundamental relevance. But in fact, it is s crumbling of the Pax in a new world order where every nation is trying to determine its relevance, and not just on the energy supply/demand relationship. What is more important – economic buying power and GDP growth in China or militarized might in the United States and Russia? And do the East-West conflagrations matter as tentative nuclear balance becomes unbalanced by new, less predictable entrants? With an economic blight on most of the world, including Europe and the United States, can we expect another fall of a Berlin Wall or collapse of a Moscow Kremlin? Will the Arab Spring run dry? Will political ideals and economic reality come to a head over low priced oil? Or will some new technical innovation, like the Internet or fracking, somehow create new wealth and stave off a global conflict? In the words of the immortal Yeats,
Turning and turning in the widening gyre The falcon cannot hear the falconer;
Things fall apart; the centre cannot hold; Mere anarchy is loosed upon the world,
The blood-dimmed tide is loosed, and everywhere The ceremony of innocence is drowned;
The best lack all conviction, while the worst Are full of passionate intensity.