Embed Size (px)
Citation preview

DataSnap User Manual
SDI-12 Data Recorder Part Number: ACC-AGR-D01
Acclima, Inc.
1763 W. Marcon Ln., Ste. 175Meridian, ID 83642 USA www.acclima.com

Contents Introduction ...................................................................................................................................................................................... 2 Supported Sensors ............................................................................................................................................................................ 2 Requirements .................................................................................................................................................................................... 3 Description ........................................................................................................................................................................................ 3
Connections ....................................................................................................................................................................................... 3 Status Indicators ................................................................................................................................................................................ 3
SnapView Software & Driver Installation .......................................................................................................................................... 4 Installing the SnapView Software .......................................................................................................................................................... 4 Installing the driver on Windows 7™ and Vista™ ................................................................................................................................... 4 Installing the driver on Windows XP™ ................................................................................................................................................... 5
Setting Up a New System .................................................................................................................................................................. 8 Selecting Acclima Moisture Sensor Locations ........................................................................................................................................ 9 Installing Acclima Moisture Sensors .................................................................................................................................................... 10 Wiring Sensors to the SDI-12 port ....................................................................................................................................................... 10
Using Acclima SnapView Software .................................................................................................................................................. 11 Configuration ....................................................................................................................................................................................... 11 Automatic Data Synchronization ......................................................................................................................................................... 16 Read Sensors Manually ........................................................................................................................................................................ 16 View Graphs ......................................................................................................................................................................................... 18 View Data ............................................................................................................................................................................................. 20 Export Data .......................................................................................................................................................................................... 21 Tools ..................................................................................................................................................................................................... 22
Technical Specifications ................................................................................................................................................................... 23 Physical Characteristics ........................................................................................................................................................................ 23 Environmental ...................................................................................................................................................................................... 23 Electrical Specification ......................................................................................................................................................................... 23
Developer Reference ....................................................................................................................................................................... 23
2 ©2010 Acclima, Inc. Toll Free 1-866-887-1470
Introduction The Acclima DataSnap is a simple-to-use data recorder. It provides the ability to read and log data from a variety of SDI-12 sensors using a USB port and the Acclima SnapView software. Each DataSnap supports up to 10 SDI-12 sensors. The DataSnap handles all timing requirements of the SDI-12 communications protocol, making it possible to take SDI-12 sensor readings using a simple terminal program such as HyperTerminal or PuTTy. DataSnap Hardware Features:
Data logging
USB to SDI-12 Bridge
Supports powering sensors from the USB bus (5V only)
Supports an optional 12V power adapter
Short circuit protection
Acclima SnapView software provided
Compatible with terminal software applications like HyperTerminal or PuTTy
Supports 3rd party software development
SnapView Software Features:
Automatically synchronizes all connected DataSnaps
Manual reading of sensors
Supports connecting to an unlimited number of DataSnaps
Setup wizard for simple DataSnap configuration What is in the box?
DataSnap
2 pluggable terminal blocks for the SDI-12 connection
USB cable, type A/B
AC power adapter
12V DC battery power pack
Installation CD with SnapView software and driver
Supported Sensors The Acclima DataSnap will support all SDI-12 sensors that are compatible with version 1.3 of the SDI-12 Protocol Specification when the optional 12VDC Power adapter is attached. The DataSnap is limited to 225mA. Some sensors with higher power requirements may require an external power connection. The Acclima SnapView software supports all SDI-12 sensor types.
The DataSnap is not weatherproof. If used outdoors, the DataSnap must be mounted in a weatherproof enclosure.
The DataSnap reads and records the first five data points of the SDI-12 M! command. The DataSnap’s internal data recording functions do not support reading or recording of any other data points.

Requirements
Minimum System Requirements
Microsoft Windows XP™, Windows Vista™
or Windows 7™ operating systems
300MHz processor
256MB RAM
50 MB hard drive space
Available USB port
Description
Connections The DataSnap has the following connections: USB After software installation, use the included USB cable to connect to a PC. SDI-12 The terminal block can be unplugged from the DataSnap while wiring sensors together. Multiple sensors can be wired in parallel to the same SDI-12 port. External Power Port This connection is provided should the sensor network require higher voltage or current than can be provided by the USB connection. This also allows for autonomous data logging independent of a PC.
Status Indicators The status indicators will light up to indicate activity or status of the DataSnap:
LED Status Indicators
USB Connection Port
External Power Port
SDI-12 Connection Terminal Block

4 ©2010 Acclima, Inc. Toll Free 1-866-887-1470
Activity (Green) OFF = The DataSnap is sleeping or unpowered. ON = The DataSnap is ready for use and the USB connection is established. Blinking = Data is moving in or out of the USB port or the SDI-12 Port. Error (Red) OFF = No errors ON = Short circuit or high current on SDI-12 PWR. The SDI-12 Voltage will drop until the condition is repaired.
Single Blink = SDI-12 communications failure.
SnapView Software & Driver Installation The SnapView software must be installed prior to connecting the Data Snap to the computer. The Data Snap requires a Windows™ driver to be installed before use. The driver is installed during the installation of the SnapView software. Once the software is installed, connect the Data Snap to the computer via a USB cable. Windows™ will automatically detect the new Data Snap hardware and will attempt to find the appropriate driver. This driver installation process will only occur once per Data Snap. Each new Data Snap will follow the same process.
Installing the SnapView Software
Insert the CD into the CDROM drive on the computer and click ‘Install Software’ on the window that appears. The Acclima SnapView software and all required hardware drivers will install. Follow the on screen directions and accept the default options during the installation. The first time a Data Snap is connected to the computer, the Windows™ operating system will attempt to find the appropriate driver. This process varies slightly between Windows XP™ and more recent versions of Windows™.
Installing the driver on Windows 7™ and Vista™
When the Data Snap is first connected to the computer, it will automatically be detected and the installation of the driver will begin. A popup window will be displayed indicating the device driver is being installed. Clicking on the popup window will provide additional details.
Figure 1
Windows™ will search its list of known drivers for the appropriate driver for the Data Snap. This may take a few minutes and will eventually fail because the driver is not contained in the Windows Update™. To skip this part of the process, click on the blue link at the bottom of the pop up window.
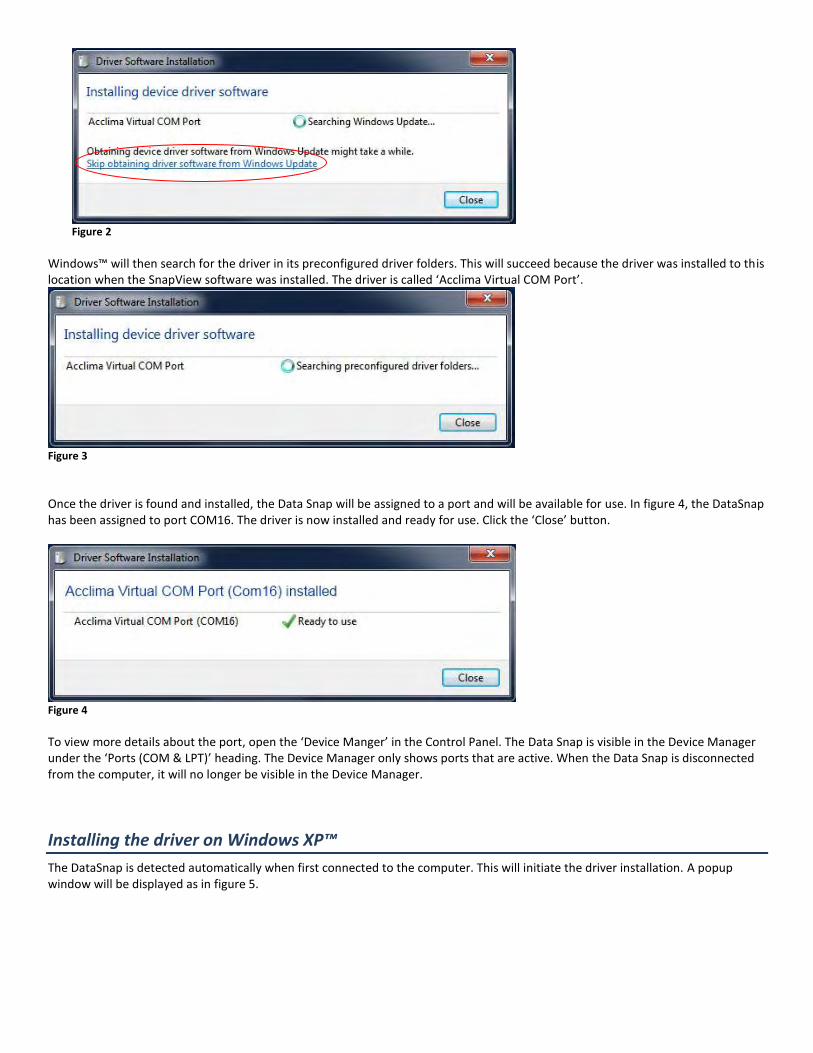
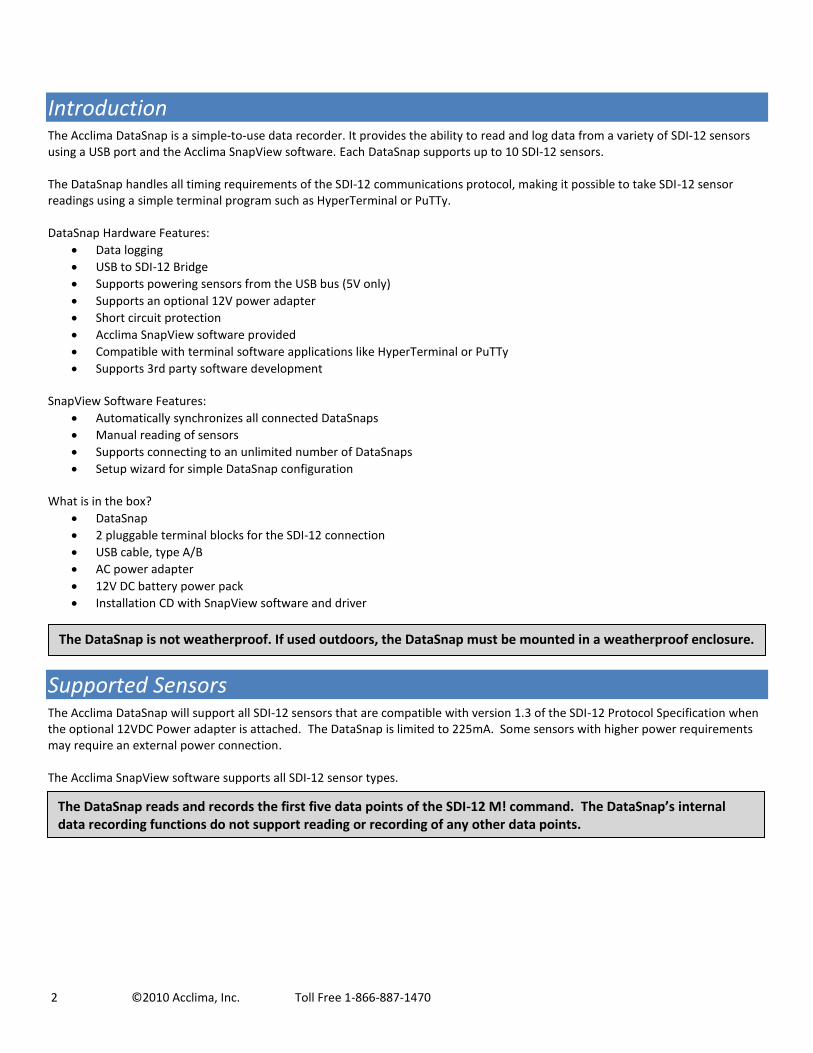
Figure 2
Windows™ will then search for the driver in its preconfigured driver folders. This will succeed because the driver was installed to this location when the SnapView software was installed. The driver is called ‘Acclima Virtual COM Port’.
Figure 3
Once the driver is found and installed, the Data Snap will be assigned to a port and will be available for use. In figure 4, the DataSnap has been assigned to port COM16. The driver is now installed and ready for use. Click the ‘Close’ button.
Figure 4
To view more details about the port, open the ‘Device Manger’ in the Control Panel. The Data Snap is visible in the Device Manager under the ‘Ports (COM & LPT)’ heading. The Device Manager only shows ports that are active. When the Data Snap is disconnected from the computer, it will no longer be visible in the Device Manager.
Installing the driver on Windows XP™
The DataSnap is detected automatically when first connected to the computer. This will initiate the driver installation. A popup window will be displayed as in figure 5.
6 ©2010 Acclima, Inc. Toll Free 1-866-887-1470
Figure 5
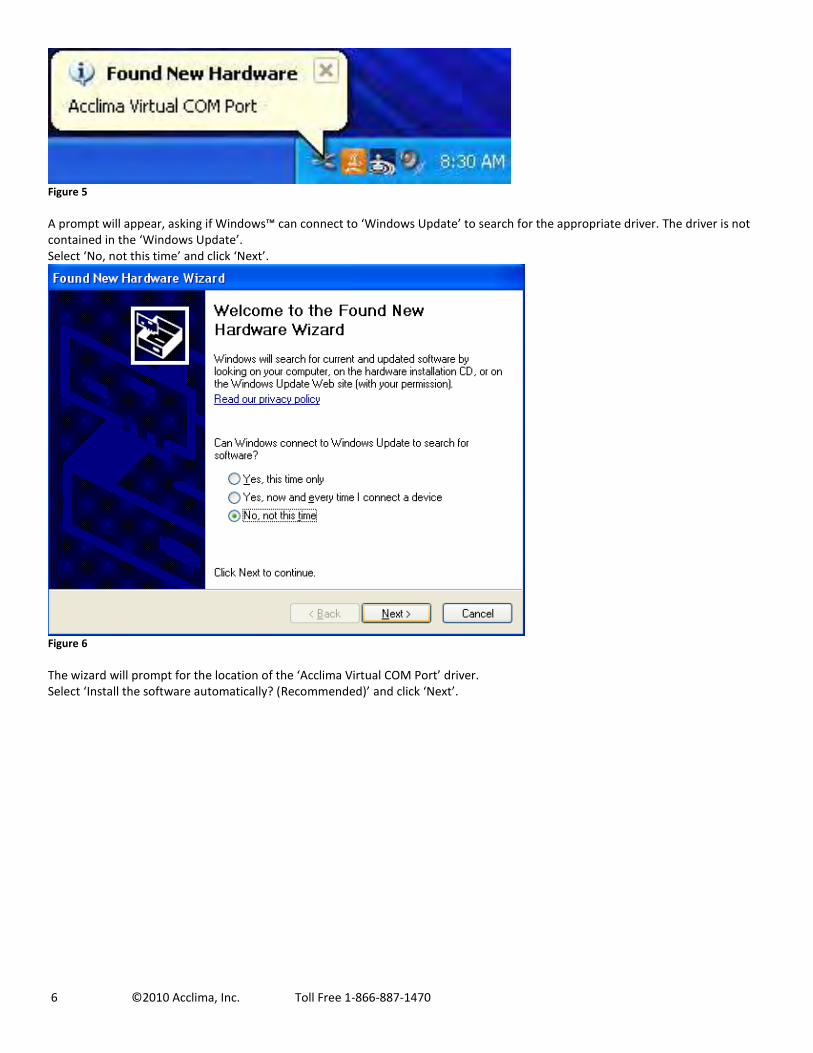
A prompt will appear, asking if Windows™ can connect to ‘Windows Update’ to search for the appropriate driver. The driver is not contained in the ‘Windows Update’. Select ‘No, not this time’ and click ‘Next’.
Figure 6
The wizard will prompt for the location of the ‘Acclima Virtual COM Port’ driver. Select ‘Install the software automatically? (Recommended)’ and click ‘Next’.
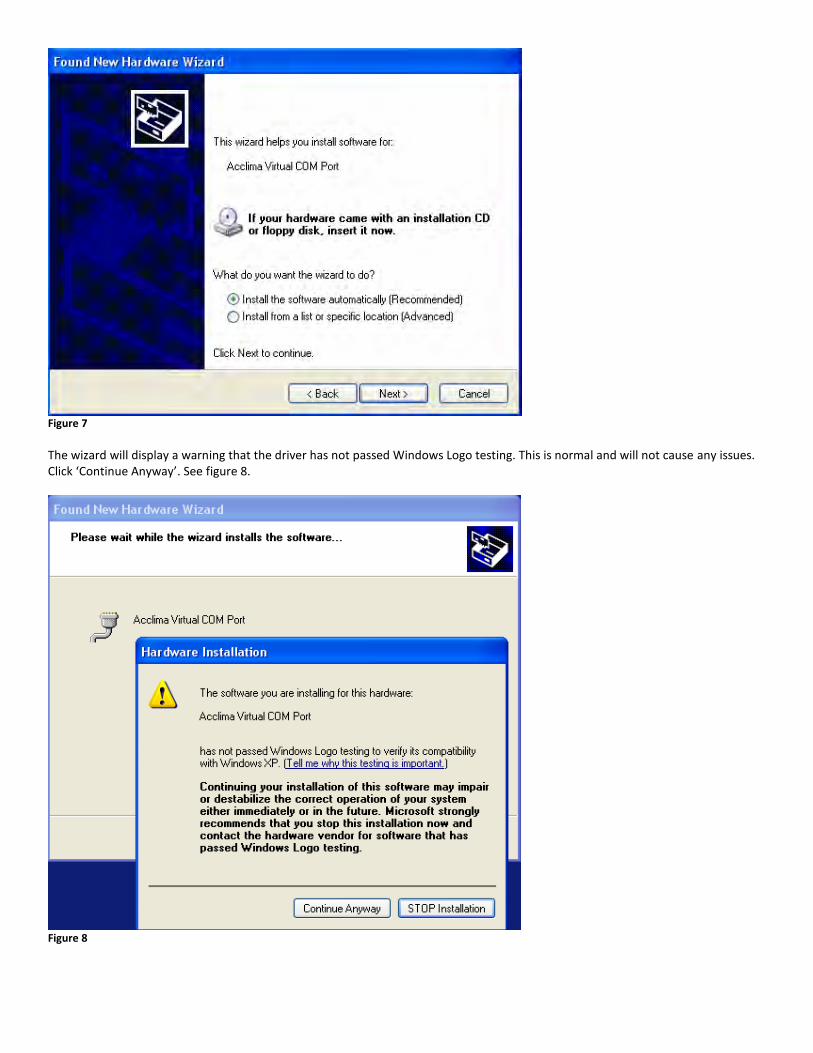
Figure 7
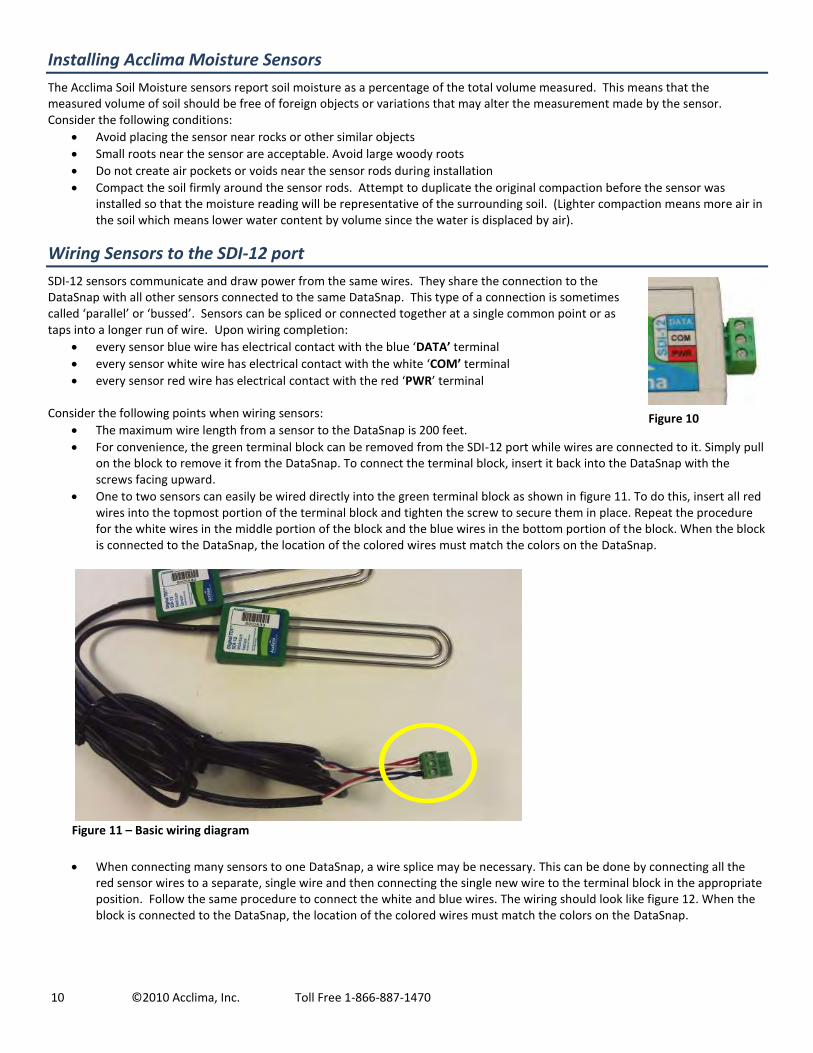
The wizard will display a warning that the driver has not passed Windows Logo testing. This is normal and will not cause any issues. Click ‘Continue Anyway’. See figure 8.
Figure 8

8 ©2010 Acclima, Inc. Toll Free 1-866-887-1470
The driver installation will begin and may take several minutes to complete. Once the driver is successfully installed, a new window will appear. The Data Snap is now assigned to a port and is available for use. Click ‘Finish’. See figure 9.
Figure 9
To view more details about the port, open the Device Manger. To do this:
Open the Windows™ Control Panel
Click the ‘System’ icon
Click the ‘Hardware’ tab
Click ‘Device Manager’ to see all devices on the system The Data Snap is visible in the Device Manager under the ‘Ports (COM & LPT)’ heading. The Device Manager only shows ports that are active. When the Data Snap is disconnected from the computer, it is longer visible in the Device Manager.
Setting Up a New System
Adding Sensors to the DataSnap
The DataSnap can communicate with and read any type of SDI-12 sensor. It is not limited to Acclima sensors. The DataSnap must be configured to know which sensors to read. This is easily done in the ‘Configuration’ section of the SnapView software. To add sensors, go to the ‘Sensors’ screen and click ‘Add Acclima Sensors’ or the ‘Add a Single Sensor’ at the bottom of the screen. The SDI-12 protocol does not provide a way to search for multiple connected sensors. Therefore, only one sensor can be connected to the DataSnap when adding a sensor. This is only true for non-Acclima sensors and requires the use of the ‘Add a Single Sensor’ option. Acclima has engineered a more efficient and intelligent way to configure multiple Acclima sensors simultaneously. This significantly simplifies the configuration process and is done using the ‘Add Acclima Sensors’ option. The process for adding sensors to a DataSnap is as follows:

Add Acclima Sensors To add one or more Acclima sensors to the DataSnap:
Wire each Acclima sensor to the DataSnap as described in the ‘Wiring Sensors to the SDI-12 Port’ section below
Click the ‘Add Acclima Sensors’ button
Each Acclima sensor is automatically detected and added to the DataSnap. Each newly added sensor is configured with a set of default properties that can be changed at any time. This is addressed later in this document.
Add non-Acclima Sensors Each non-Acclima sensor must be added individually to the DataSnap. To add a non-Acclima sensor to the DataSnap:
Physically disconnect the wires of all existing sensors from the DataSnap
Wire the new sensor to the DataSnap as described in the ‘Wiring Sensors to the SDI-12 Port’ section below
Click the ‘Add a Single Sensor’ button
The sensor is detected automatically and added to the DataSnap. The newly added sensor is configured with a set of default properties. These can be changed at any time.
Repeat the above steps for each non-Acclima sensor The DataSnap does not support duplicate serial numbers. If there are multiple sensors with the same serial number, the sensor that was configured last will be used. Modifying Sensor Settings Each sensor has its own unique set of reading descriptions which can be modified. This includes a descriptive sensor name and descriptive names for each of the 5 sensor readings. To modify sensor settings click on the sensor in the ‘Configured Sensors’ list. The details for the selected sensor will display. Make any desired changes and click the ‘Save’ button. When a sensor is added, its reading descriptions are automatically set based on the defaults for this type of sensor. These default reading descriptions can be modified or removed using the ‘Manage Reading Descriptions’ screen in the Tools menu. If there are no defaults for a particular sensor type, SnapView can automatically create them. This occurs the first time a user enters reading descriptions on the ‘Sensor Details’ window and clicks ‘Save’. For more details, see the ‘Using Acclima SnapView Software’ section later in this document.
Validating Sensors
Sensor validation is the final step in the configuration process. It provides a simple way to verify that all configured sensors are correctly wired into the DataSnap and match the DataSnap’s configuration. Connect all configured sensors to the DataSnap and click the ‘Validate’ button. The DataSnap will attempt to find and validate each of its configured sensors. Sensors that are found and match the DataSnap configuration are annotated with a green check mark. Sensors that are not found or do not match the configuration show a red X and an error description.
Selecting Acclima Moisture Sensor Locations
Sensors should be located in the region of interest where soil moisture measurements are desired. Acclima sensors measure the average volumetric water content over the length of the sensor rods. Sensors can be buried in any orientation and will produce average readings as follows:
Flat and Horizontal: Provides a moisture reading at a discrete depth. This orientation is frequently used when monitoring plants with shallow roots such as turf, or when multiple sensors are used to create a soil moisture profile vs. depth.
Vertical: Provides an average moisture reading over a depth of about 6 inches. Often used when monitoring deeper root systems such as trees.
Edge-Horizontal or diagonal: Provides an average moisture reading over a variable depth from 1 to 6 inches. When selecting a site for sensor placement, consider the following environmental factors:
Non-permeable surfaces such as rocks and roads can generate runoff and cause variation in moisture content nearby.
Depressions and the base of slopes tend to collect excess moisture.
Peaks of slopes, south or west facing hillsides, and areas where reflected light is focused tend to dry out more quickly.
If monitoring plant conditions, the sensor must be buried among the roots of the plant of interest. Otherwise, the effects of transpiration will not be measured.
10 ©2010 Acclima, Inc. Toll Free 1-866-887-1470
Figure 10
Installing Acclima Moisture Sensors
The Acclima Soil Moisture sensors report soil moisture as a percentage of the total volume measured. This means that the measured volume of soil should be free of foreign objects or variations that may alter the measurement made by the sensor. Consider the following conditions:
Avoid placing the sensor near rocks or other similar objects
Small roots near the sensor are acceptable. Avoid large woody roots
Do not create air pockets or voids near the sensor rods during installation
Compact the soil firmly around the sensor rods. Attempt to duplicate the original compaction before the sensor was installed so that the moisture reading will be representative of the surrounding soil. (Lighter compaction means more air in the soil which means lower water content by volume since the water is displaced by air).
Wiring Sensors to the SDI-12 port
SDI-12 sensors communicate and draw power from the same wires. They share the connection to the DataSnap with all other sensors connected to the same DataSnap. This type of a connection is sometimes called ‘parallel’ or ‘bussed’. Sensors can be spliced or connected together at a single common point or as taps into a longer run of wire. Upon wiring completion:
every sensor blue wire has electrical contact with the blue ‘DATA’ terminal
every sensor white wire has electrical contact with the white ‘COM’ terminal
every sensor red wire has electrical contact with the red ‘PWR’ terminal Consider the following points when wiring sensors:
The maximum wire length from a sensor to the DataSnap is 200 feet.
For convenience, the green terminal block can be removed from the SDI-12 port while wires are connected to it. Simply pull on the block to remove it from the DataSnap. To connect the terminal block, insert it back into the DataSnap with the screws facing upward.
One to two sensors can easily be wired directly into the green terminal block as shown in figure 11. To do this, insert all red wires into the topmost portion of the terminal block and tighten the screw to secure them in place. Repeat the procedure for the white wires in the middle portion of the block and the blue wires in the bottom portion of the block. When the block is connected to the DataSnap, the location of the colored wires must match the colors on the DataSnap.
Figure 11 – Basic wiring diagram
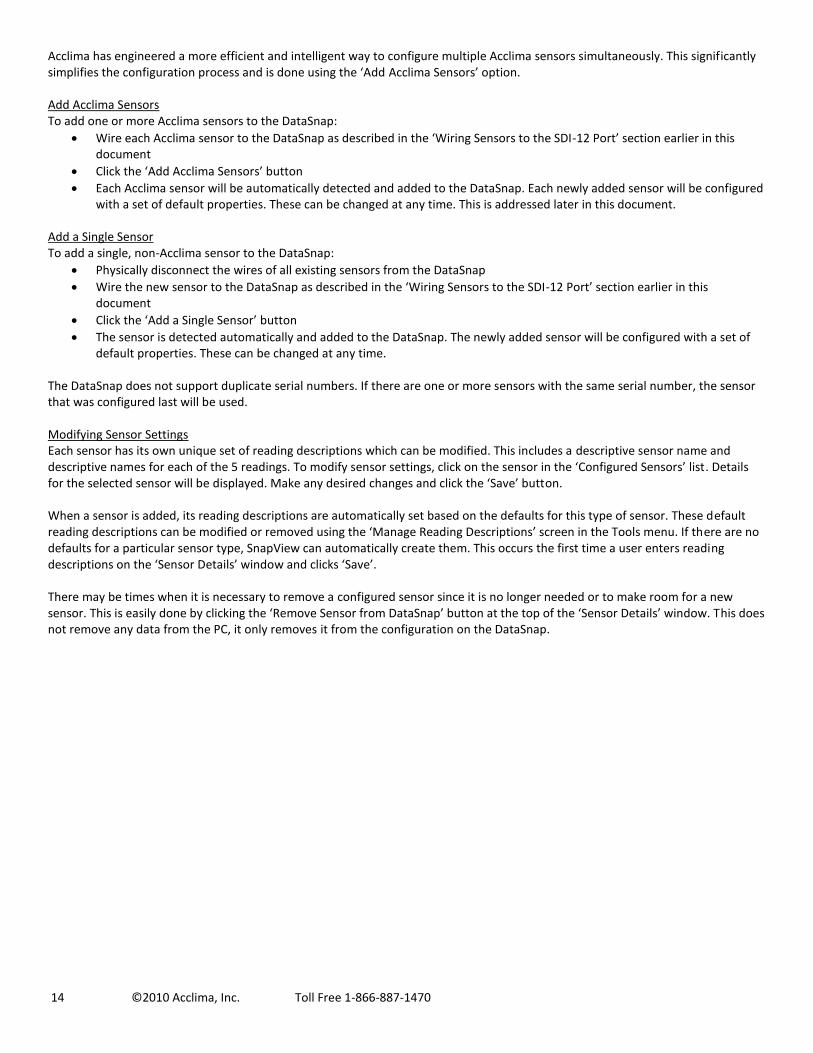
When connecting many sensors to one DataSnap, a wire splice may be necessary. This can be done by connecting all the
red sensor wires to a separate, single wire and then connecting the single new wire to the terminal block in the appropriate position. Follow the same procedure to connect the white and blue wires. The wiring should look like figure 12. When the block is connected to the DataSnap, the location of the colored wires must match the colors on the DataSnap.
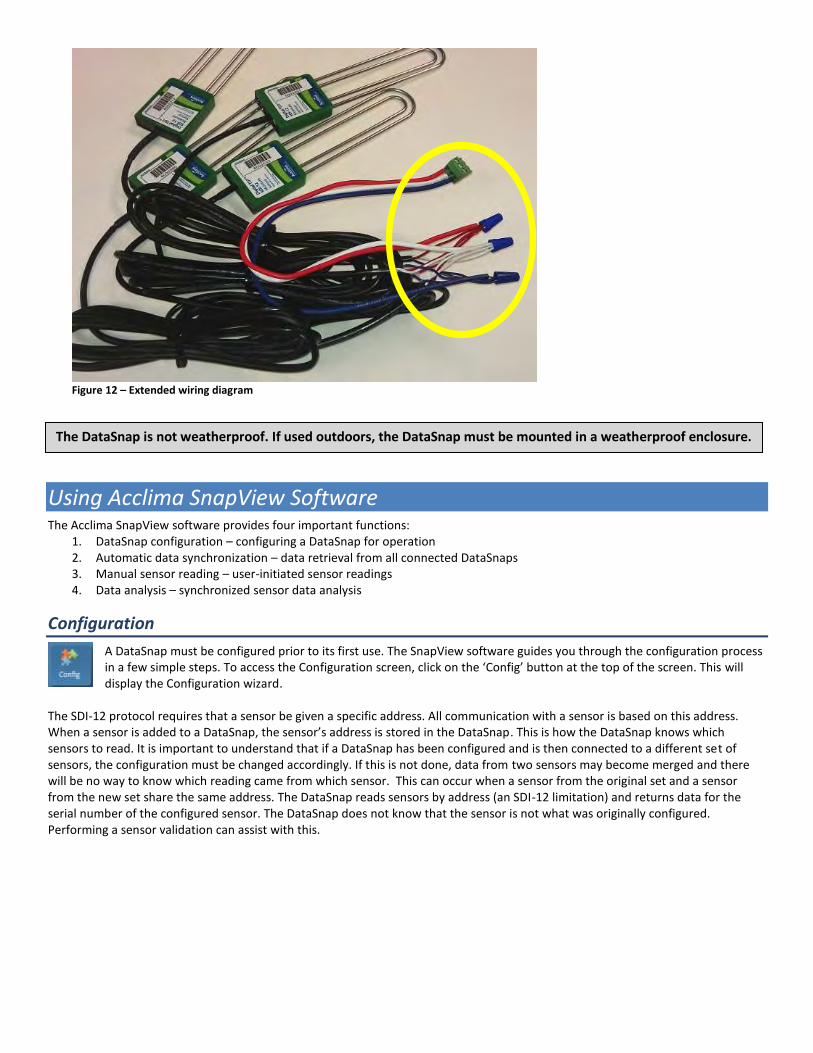
Figure 12 – Extended wiring diagram
Using Acclima SnapView Software The Acclima SnapView software provides four important functions:
1. DataSnap configuration – configuring a DataSnap for operation 2. Automatic data synchronization – data retrieval from all connected DataSnaps 3. Manual sensor reading – user-initiated sensor readings 4. Data analysis – synchronized sensor data analysis
Configuration
A DataSnap must be configured prior to its first use. The SnapView software guides you through the configuration process in a few simple steps. To access the Configuration screen, click on the ‘Config’ button at the top of the screen. This will display the Configuration wizard.
The SDI-12 protocol requires that a sensor be given a specific address. All communication with a sensor is based on this address. When a sensor is added to a DataSnap, the sensor’s address is stored in the DataSnap. This is how the DataSnap knows which sensors to read. It is important to understand that if a DataSnap has been configured and is then connected to a different set of sensors, the configuration must be changed accordingly. If this is not done, data from two sensors may become merged and there will be no way to know which reading came from which sensor. This can occur when a sensor from the original set and a sensor from the new set share the same address. The DataSnap reads sensors by address (an SDI-12 limitation) and returns data for the serial number of the configured sensor. The DataSnap does not know that the sensor is not what was originally configured. Performing a sensor validation can assist with this.
The DataSnap is not weatherproof. If used outdoors, the DataSnap must be mounted in a weatherproof enclosure.

12 ©2010 Acclima, Inc. Toll Free 1-866-887-1470
Figure 13 – Configuration
For a DataSnap to automatically take sensor readings or allow a user to read sensors manually, it must be configured. The most important step is to tell the DataSnap what sensors to read. This requires that the sensors be connected to the DataSnap during the configuration process. It is also important to provide a name for the DataSnap and to define how frequently it will take automatic readings. DataSnap configuration settings are stored on the DataSnap and are retained even when power is removed. The configuration wizard is divided into four steps:
Connect
System Configuration
Sensors
Validation
Connecting to a DataSnap
The initial configuration screen shows all DataSnaps that are currently connected to the computer. See figure 13. To begin configuring a DataSnap, click the ‘Connect’ button next to the desired DataSnap. The name of the connected DataSnap will appear on left side of the screen and the ‘Next’ button is enabled. Use the ‘Next’ and ‘Previous’ buttons to move through the configuration steps. All configuration operations will be performed on the connected DataSnap. Click the ‘Refresh List” button to scan the computer for DataSnaps and update the connection list.
System Configuration Settings
The system configuration screen allows modification of several DataSnap settings and operations. They are:
Name – This is the descriptive name for the DataSnap. This is how the DataSnap will be identified throughout the SnapView software. The DataSnap’s unique system id is also shown but it cannot be changed.
Interval - This is the number of minutes between automatic sensor readings. Figure 14 shows a DataSnap named ‘Lab Experiment’ that is configured to take a new set of readings every 20 minutes. This interval is measured from the beginning of the previous cycle to the beginning of the subsequent cycle. For example, if the first automatic reading cycle begins at 10am and takes one minute to complete. The second automatic reading cycle will begin at 10:20am.
System Time – This sets the system time on the DataSnap. The DataSnap’s current time will be displayed. Click the ‘Synchronize’ button to set the time on the DataSnap to the same time as the connected PC. See figure 15.
Advanced Options – Click on ‘Advanced Options’ to display additional operations. o Purge Logs – This will delete all logs in the memory of the DataSnap. It will not remove any logs stored on the PC.

o Factory Reset – This will delete all configuration and logs on the DataSnap, thus restoring it to its original factory settings.
Always click the ‘Save’ button to save the changes to the Name and Interval settings.
Figure 14 - System Configuration
Figure 15 - System Time
Adding Sensors
The DataSnap can communicate with and read any type of SDI-12 sensor. It is not limited to Acclima sensors. The DataSnap must be configured to know which sensors to read. This is done by adding sensors in the ‘Sensors’ screen. The current list of configured sensors is displayed on the left of the screen. To add more sensors, click the ‘Add Acclima Sensors’ or the ‘Add a Single Sensor’ at the bottom of the screen. The SDI-12 protocol does not provide a way to search for multiple connected sensors. Therefore, only one sensor can be connected to the DataSnap when adding a sensor. This is only true for non-Acclima sensors and requires the use of the ‘Add a Single Sensor’ option.
14 ©2010 Acclima, Inc. Toll Free 1-866-887-1470
Acclima has engineered a more efficient and intelligent way to configure multiple Acclima sensors simultaneously. This significantly simplifies the configuration process and is done using the ‘Add Acclima Sensors’ option. Add Acclima Sensors To add one or more Acclima sensors to the DataSnap:
Wire each Acclima sensor to the DataSnap as described in the ‘Wiring Sensors to the SDI-12 Port’ section earlier in this document
Click the ‘Add Acclima Sensors’ button
Each Acclima sensor will be automatically detected and added to the DataSnap. Each newly added sensor will be configured with a set of default properties. These can be changed at any time. This is addressed later in this document.
Add a Single Sensor To add a single, non-Acclima sensor to the DataSnap:
Physically disconnect the wires of all existing sensors from the DataSnap
Wire the new sensor to the DataSnap as described in the ‘Wiring Sensors to the SDI-12 Port’ section earlier in this document
Click the ‘Add a Single Sensor’ button
The sensor is detected automatically and added to the DataSnap. The newly added sensor will be configured with a set of default properties. These can be changed at any time.
The DataSnap does not support duplicate serial numbers. If there are one or more sensors with the same serial number, the sensor that was configured last will be used. Modifying Sensor Settings Each sensor has its own unique set of reading descriptions which can be modified. This includes a descriptive sensor name and descriptive names for each of the 5 readings. To modify sensor settings, click on the sensor in the ‘Configured Sensors’ list. Details for the selected sensor will be displayed. Make any desired changes and click the ‘Save’ button. When a sensor is added, its reading descriptions are automatically set based on the defaults for this type of sensor. These default reading descriptions can be modified or removed using the ‘Manage Reading Descriptions’ screen in the Tools menu. If there are no defaults for a particular sensor type, SnapView can automatically create them. This occurs the first time a user enters reading descriptions on the ‘Sensor Details’ window and clicks ‘Save’. There may be times when it is necessary to remove a configured sensor since it is no longer needed or to make room for a new sensor. This is easily done by clicking the ‘Remove Sensor from DataSnap’ button at the top of the ‘Sensor Details’ window. This does not remove any data from the PC, it only removes it from the configuration on the DataSnap.
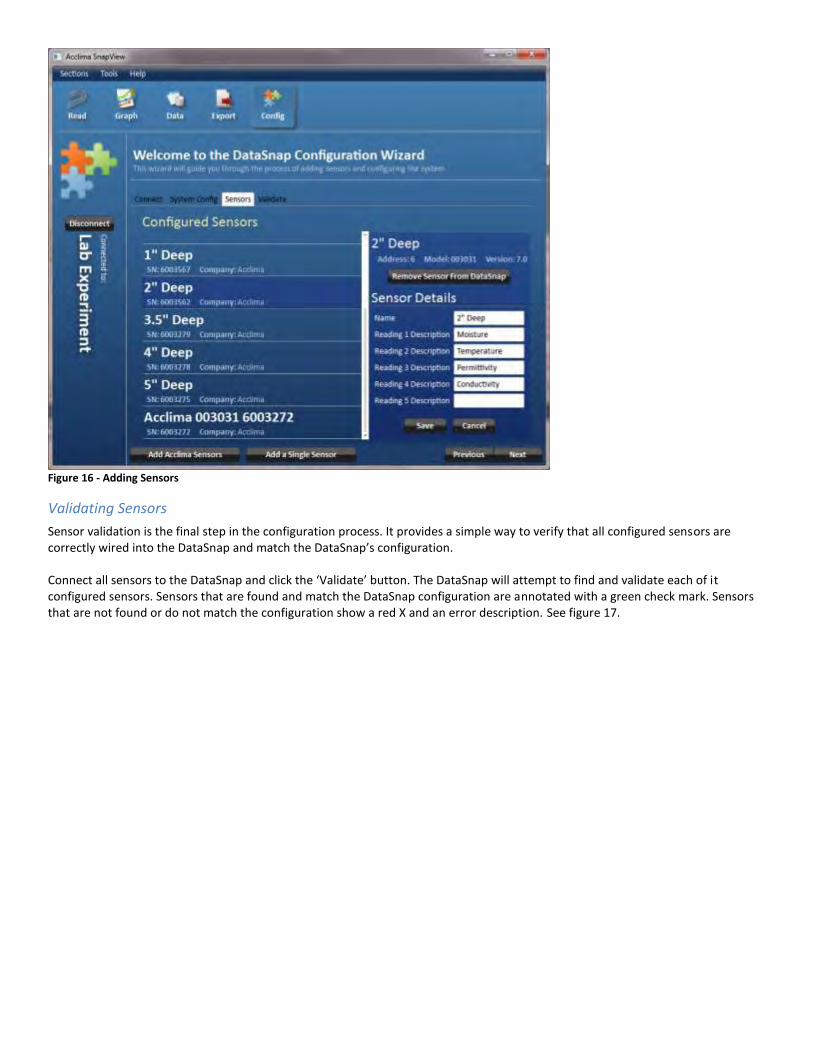
Figure 16 - Adding Sensors
Validating Sensors
Sensor validation is the final step in the configuration process. It provides a simple way to verify that all configured sensors are correctly wired into the DataSnap and match the DataSnap’s configuration. Connect all sensors to the DataSnap and click the ‘Validate’ button. The DataSnap will attempt to find and validate each of it configured sensors. Sensors that are found and match the DataSnap configuration are annotated with a green check mark. Sensors that are not found or do not match the configuration show a red X and an error description. See figure 17.

16 ©2010 Acclima, Inc. Toll Free 1-866-887-1470
Figure 18 - Synchronization
Figure 17 - Sensor Validation
Automatic Data Synchronization
The SnapView software regularly attempts to synchronize with all connected DataSnaps. This occurs in the background and is therefore no user interaction is required. During synchronization, a green status icon is displayed in the upper right corner of the screen. Hovering the mouse over the icon displays the number of logs that still need to be retrieved from the DataSnap as shown in figure 18. If one or more DataSnaps are connected via a USB port, the SnapView software will automatically find each DataSnap, connect to it and retrieve all of its configuration and sensor readings. This data is saved on the PC and is available for analysis in SnapView. While the SnapView software is downloading sensor readings from a connected DataSnap, user actions such as reading sensors and saving a new configuration to that DataSnap are still allowed. If these interruptions occur, the download will be temporarily suspended for up to 1 minute before automatically resuming again. While the synchronization is interrupted, the green status icon will stop spinning.
Read Sensors Manually
Each DataSnap can accommodate up to 10 sensors. The connected sensors can be manually read at any time. Prior to reading any sensor, the sensor must be connected to and configured on the DataSnap. This is a one-time process and is covered in detail in the ‘Configuration’ section. Manual readings do not occur automatically and are not saved for
historical analysis.
Reading Sensors
Click the ‘Read’ button at the top of the screen. A list of all connected DataSnaps and their configured sensors is displayed as seen in figure 19. By default, each DataSnap and each sensor is selected. This is denoted by a check mark next to the
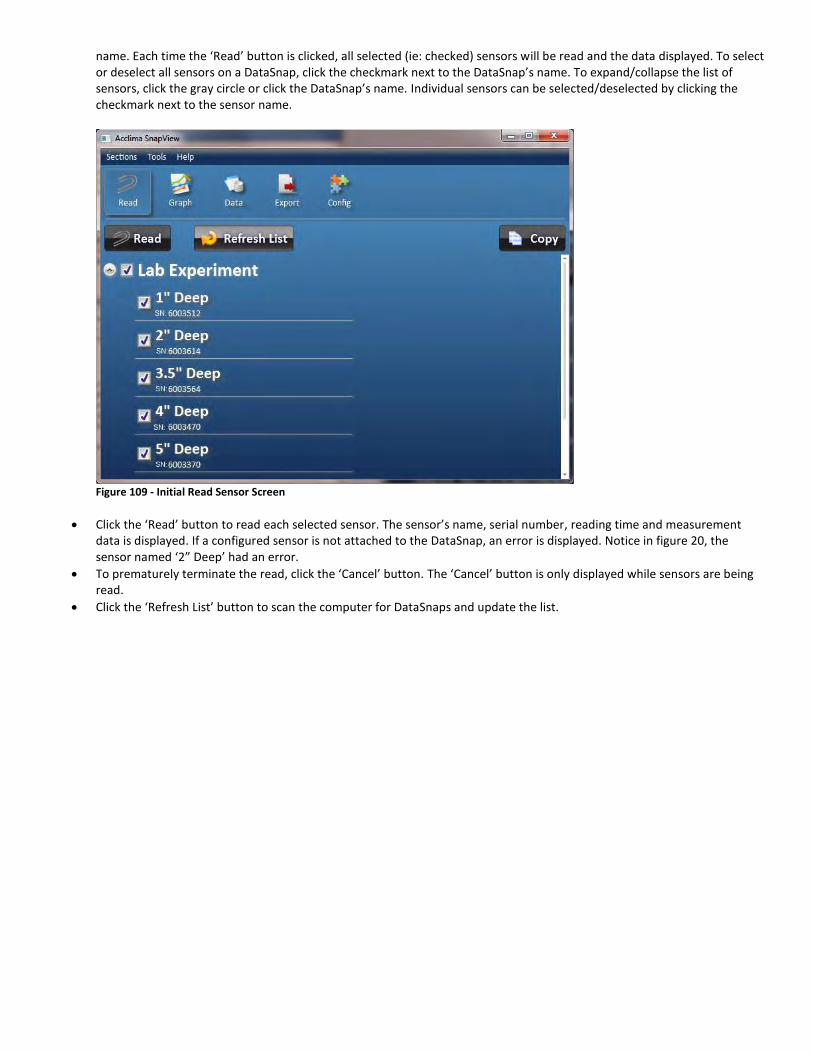
name. Each time the ‘Read’ button is clicked, all selected (ie: checked) sensors will be read and the data displayed. To select or deselect all sensors on a DataSnap, click the checkmark next to the DataSnap’s name. To expand/collapse the list of sensors, click the gray circle or click the DataSnap’s name. Individual sensors can be selected/deselected by clicking the checkmark next to the sensor name.
Figure 109 - Initial Read Sensor Screen
Click the ‘Read’ button to read each selected sensor. The sensor’s name, serial number, reading time and measurement data is displayed. If a configured sensor is not attached to the DataSnap, an error is displayed. Notice in figure 20, the sensor named ‘2” Deep’ had an error.
To prematurely terminate the read, click the ‘Cancel’ button. The ‘Cancel’ button is only displayed while sensors are being read.
Click the ‘Refresh List’ button to scan the computer for DataSnaps and update the list.

18 ©2010 Acclima, Inc. Toll Free 1-866-887-1470
Figure 20 – Read Sensors
Copying Sensor Data
Click the ‘Copy’ button to copy all sensor data to the Windows™ clipboard in a comma delimited list, one line per sensor. This allows the sensor data to be easily pasted into any Windows™ application.
View Graphs
Sensor readings for all sensors can be viewed visually through the ‘Graph’ screen. To see the ‘Graph’ screen, click on the ‘Graph’ button at the top of the screen. The graph view allows access to the historical data of each DataSnap that has ever been connected to this PC. It does not require a DataSnap to be connected.
Figure 21 – Data in Graph View
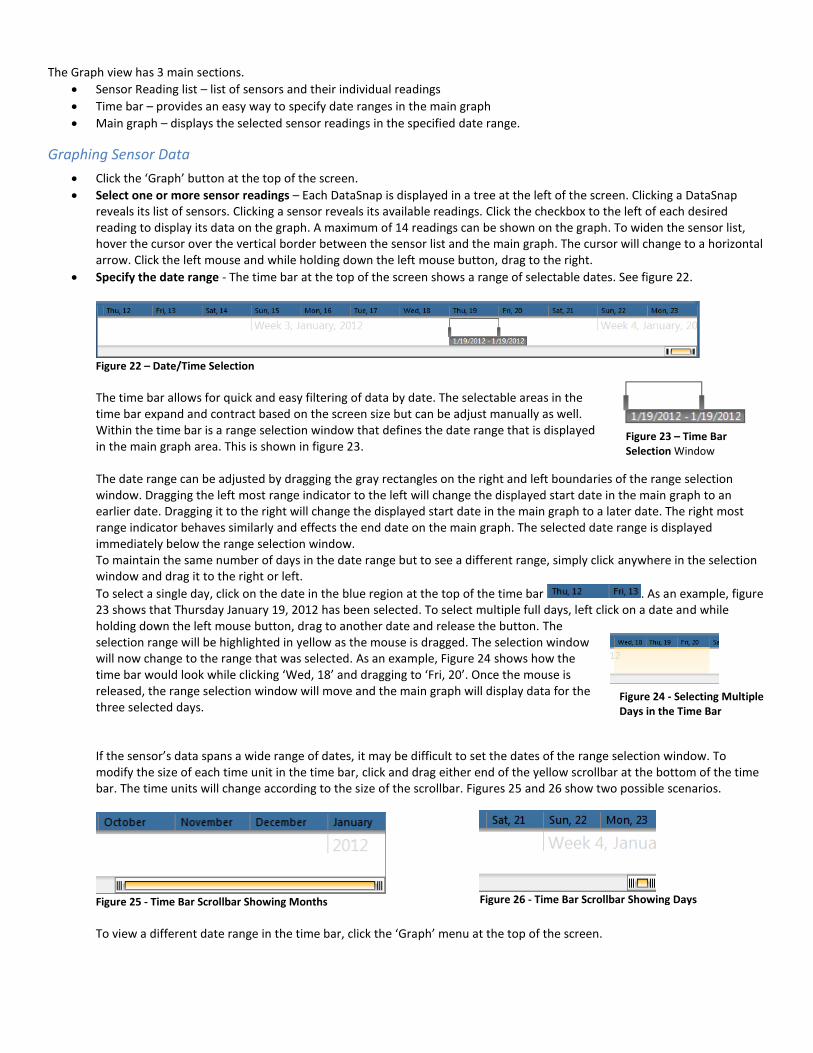
Figure 23 – Time Bar Selection Window
Figure 24 - Selecting Multiple Days in the Time Bar
Figure 26 - Time Bar Scrollbar Showing Days
The Graph view has 3 main sections.
Sensor Reading list – list of sensors and their individual readings
Time bar – provides an easy way to specify date ranges in the main graph
Main graph – displays the selected sensor readings in the specified date range.
Graphing Sensor Data
Click the ‘Graph’ button at the top of the screen.
Select one or more sensor readings – Each DataSnap is displayed in a tree at the left of the screen. Clicking a DataSnap reveals its list of sensors. Clicking a sensor reveals its available readings. Click the checkbox to the left of each desired reading to display its data on the graph. A maximum of 14 readings can be shown on the graph. To widen the sensor list, hover the cursor over the vertical border between the sensor list and the main graph. The cursor will change to a horizontal arrow. Click the left mouse and while holding down the left mouse button, drag to the right.
Specify the date range - The time bar at the top of the screen shows a range of selectable dates. See figure 22.
Figure 22 – Date/Time Selection
The time bar allows for quick and easy filtering of data by date. The selectable areas in the time bar expand and contract based on the screen size but can be adjust manually as well. Within the time bar is a range selection window that defines the date range that is displayed in the main graph area. This is shown in figure 23. The date range can be adjusted by dragging the gray rectangles on the right and left boundaries of the range selection window. Dragging the left most range indicator to the left will change the displayed start date in the main graph to an earlier date. Dragging it to the right will change the displayed start date in the main graph to a later date. The right most range indicator behaves similarly and effects the end date on the main graph. The selected date range is displayed immediately below the range selection window. To maintain the same number of days in the date range but to see a different range, simply click anywhere in the selection window and drag it to the right or left.
To select a single day, click on the date in the blue region at the top of the time bar . As an example, figure 23 shows that Thursday January 19, 2012 has been selected. To select multiple full days, left click on a date and while holding down the left mouse button, drag to another date and release the button. The selection range will be highlighted in yellow as the mouse is dragged. The selection window will now change to the range that was selected. As an example, Figure 24 shows how the time bar would look while clicking ‘Wed, 18’ and dragging to ‘Fri, 20’. Once the mouse is released, the range selection window will move and the main graph will display data for the three selected days. If the sensor’s data spans a wide range of dates, it may be difficult to set the dates of the range selection window. To modify the size of each time unit in the time bar, click and drag either end of the yellow scrollbar at the bottom of the time bar. The time units will change according to the size of the scrollbar. Figures 25 and 26 show two possible scenarios.
Figure 25 - Time Bar Scrollbar Showing Months
To view a different date range in the time bar, click the ‘Graph’ menu at the top of the screen.
20 ©2010 Acclima, Inc. Toll Free 1-866-887-1470
Main Graph - Each selected sensor reading will be displayed as a separate series in a unique color on the graph. If no data is displayed on the graph, it is likely because the date range specified in the time bar, falls outside the actual reading dates. To see details for specific readings, move the mouse around the graph. A gray vertical line will span all the visible series and a gray circle will be displayed at the intersection of the line and each series. The circle highlights the reading that is closest to the time indicated by the vertical bar. The highlighted readings are displayed in a legend to the right of the graph.
View Data
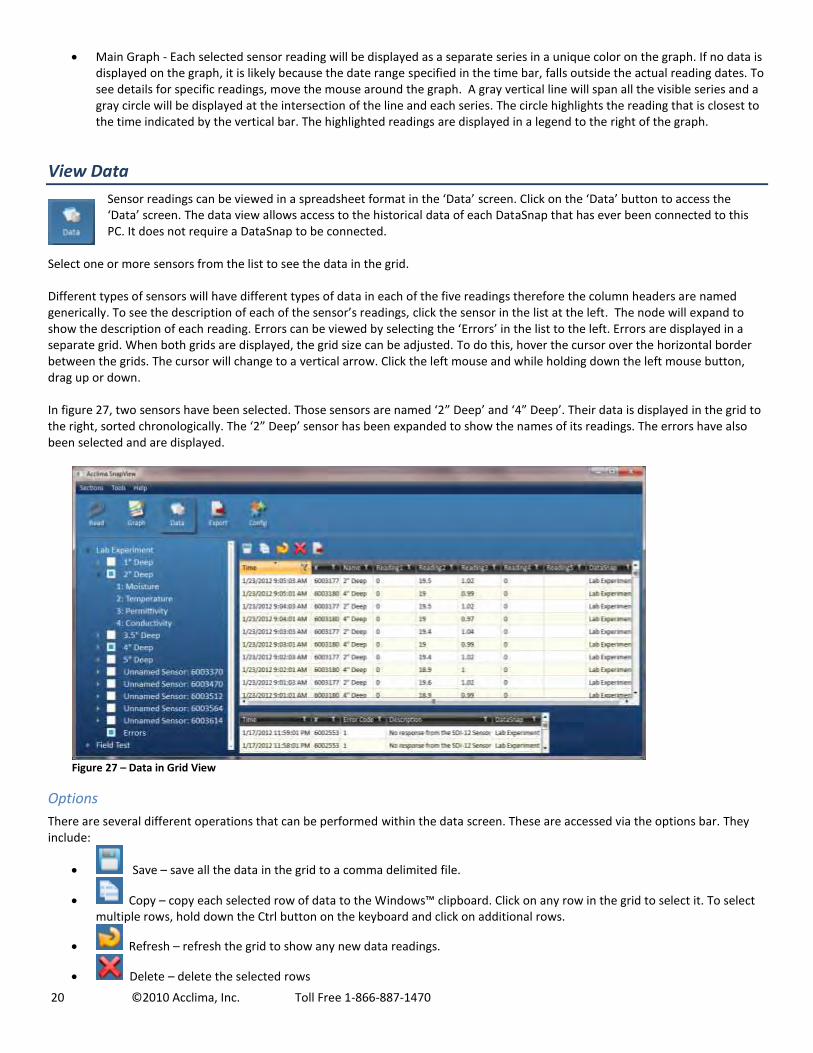
Sensor readings can be viewed in a spreadsheet format in the ‘Data’ screen. Click on the ‘Data’ button to access the ‘Data’ screen. The data view allows access to the historical data of each DataSnap that has ever been connected to this PC. It does not require a DataSnap to be connected.
Select one or more sensors from the list to see the data in the grid. Different types of sensors will have different types of data in each of the five readings therefore the column headers are named generically. To see the description of each of the sensor’s readings, click the sensor in the list at the left. The node will expand to show the description of each reading. Errors can be viewed by selecting the ‘Errors’ in the list to the left. Errors are displayed in a separate grid. When both grids are displayed, the grid size can be adjusted. To do this, hover the cursor over the horizontal border between the grids. The cursor will change to a vertical arrow. Click the left mouse and while holding down the left mouse button, drag up or down. In figure 27, two sensors have been selected. Those sensors are named ‘2” Deep’ and ‘4” Deep’. Their data is displayed in the grid to the right, sorted chronologically. The ‘2” Deep’ sensor has been expanded to show the names of its readings. The errors have also been selected and are displayed.
Figure 27 – Data in Grid View
Options
There are several different operations that can be performed within the data screen. These are accessed via the options bar. They include:
Save – save all the data in the grid to a comma delimited file.
Copy – copy each selected row of data to the Windows™ clipboard. Click on any row in the grid to select it. To select multiple rows, hold down the Ctrl button on the keyboard and click on additional rows.
Refresh – refresh the grid to show any new data readings.
Delete – delete the selected rows

Sorting Data
To sort data in each column, click anywhere on the black column header. The data will now be sorted by that column heading. Clicking the header again will sort the column in the reverse order.
Filtering Data
A filter may be applied to limit the amount of data displayed. Each column can be filtered and multiple columns may be filtered
at the same time. To specify a filter for a column, click on funnel shaped icon in the header of the column. If the icon is white, no filter has been applied. If the icon is yellow, a filter has been applied. In figure 28, a filter has been applied for the ‘Name’ and ‘Reading 1’ columns but not the ‘Reading 2’ column.
Figure 28 – Grid Filter Indicator
When the filter icon is clicked, the column filter window is displayed as shown in figure 29.
Figure 119 – Filter window for the Time column
The filter window displays a list of items that are available for display. Each item can be selected or not selected as desired. If an item is selected, it will be displayed in the grid. If it is not selected, it will be hidden in the grid. To select all items, click the ‘Select All’ option near the top of the filter window. Clicking the ‘Select All’ option a second time will deselect all items. The list of items is dependent on the data in the column. Other custom filter criteria can be specified for complex scenarios. These are defined in the lower half of the filter window. These options allow range based filtering. For instance, a filter could be set that displays all times between January 15, 2012 and January 18, 2012. To remove the filter, click the ‘Clear Filter’ button.
Export Data
Sensor readings can be saved to a file in the Data screen. However, to export data on a larger scale, it is best to use the ‘Export’ screen. To see the ‘Export’ screen, click on the ‘Export’ button at the top of the screen. This will display the Export screen. This allows the option to export sensor data into other programs allowing greater flexibility and analysis of the
22 ©2010 Acclima, Inc. Toll Free 1-866-887-1470
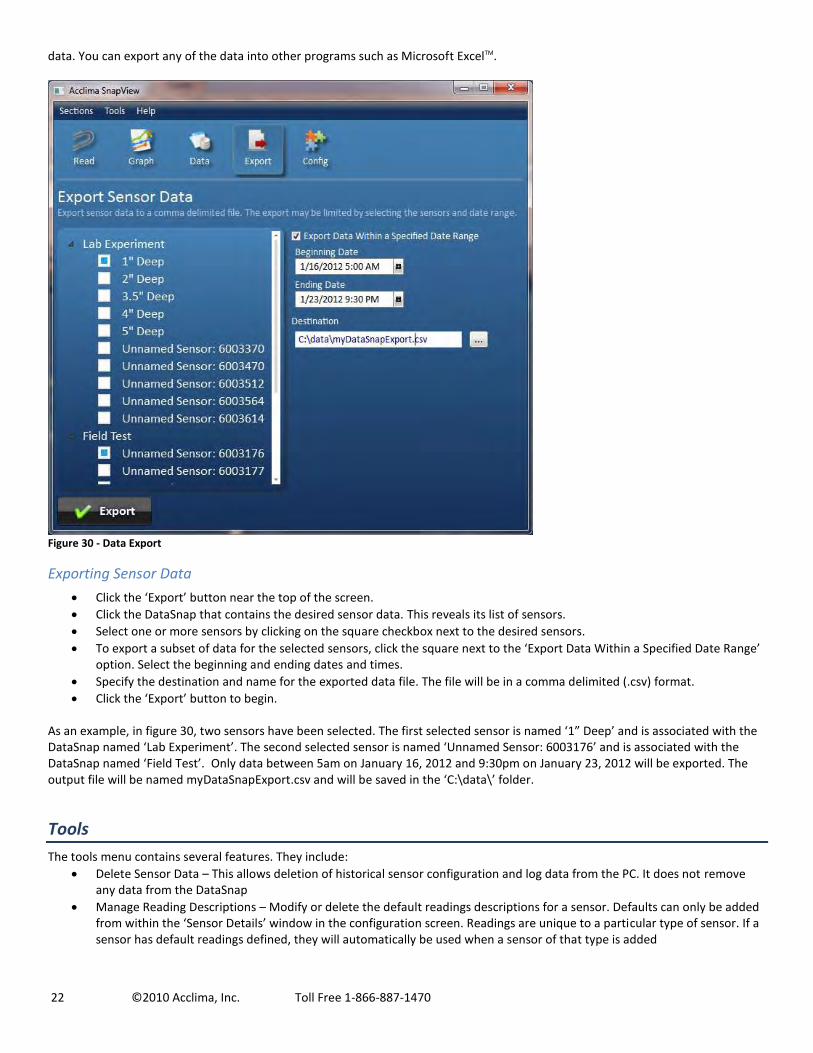
data. You can export any of the data into other programs such as Microsoft ExcelTM.
Figure 30 - Data Export
Exporting Sensor Data
Click the ‘Export’ button near the top of the screen.
Click the DataSnap that contains the desired sensor data. This reveals its list of sensors.
Select one or more sensors by clicking on the square checkbox next to the desired sensors.
To export a subset of data for the selected sensors, click the square next to the ‘Export Data Within a Specified Date Range’ option. Select the beginning and ending dates and times.
Specify the destination and name for the exported data file. The file will be in a comma delimited (.csv) format.
Click the ‘Export’ button to begin. As an example, in figure 30, two sensors have been selected. The first selected sensor is named ‘1” Deep’ and is associated with the DataSnap named ‘Lab Experiment’. The second selected sensor is named ‘Unnamed Sensor: 6003176’ and is associated with the DataSnap named ‘Field Test’. Only data between 5am on January 16, 2012 and 9:30pm on January 23, 2012 will be exported. The output file will be named myDataSnapExport.csv and will be saved in the ‘C:\data\’ folder.
Tools
The tools menu contains several features. They include:
Delete Sensor Data – This allows deletion of historical sensor configuration and log data from the PC. It does not remove any data from the DataSnap
Manage Reading Descriptions – Modify or delete the default readings descriptions for a sensor. Defaults can only be added from within the ‘Sensor Details’ window in the configuration screen. Readings are unique to a particular type of sensor. If a sensor has default readings defined, they will automatically be used when a sensor of that type is added

Upgrade Firmware – The functionality and feature set of a DataSnap is called ‘firmware’. Occasionally, Acclima engineers fix problems or enhance the functionality of the DataSnap. These changes can be applied to the DataSnap by using the ‘Upgrade Firmware’ option. Firmware upgrade files have a .WAF extension.
Theme – This allows the user to change the look of the application.
Technical Specifications
Physical Characteristics
Length: 4.1” (10.5 cm) Width: 2.1” (5.3 cm) Height: 1.0” (2.5 cm)
Environmental
Operating Temperature: -20 to +60 °C (-4 to +140 °F) Humidity: 0 to 90% RH, non-condensing
Electrical Specification
USB Port
Input Voltage: 5VDC, ±0.5V Input Current: 300mA Max
External Supply Input (optional)
Input Voltage: 6-12VDC, 15V Absolute Max Input Current: 300mA Max Connector Type: 2.1mm barrel, center positive
SDI-12 Output
Signal Voltage: Typically 0-5VDC Power Output Voltage: (Input Voltage) - 0.5V. Voltage may drop when short circuit protection is active Short Circuit Current: 225mA ±10%
Power Consumption (12V External Power Supply)
35mA USB Active, No Load/Sensors 8mA USB Disconnected, Logger Active 1.1mA USB Disconnected, Logger Sleeping, IDLE_POWER=ON (Output Active, No Sensors) 60uA USB Disconnected, Logger Sleeping, IDLE_POWER=OFF (Output Power Off)
Developer Reference When the DataSnap is properly installed on a computer USB port, it will implement a generic COM port on that computer. This COM port should be visible in Device Manager as ‘Acclima Virtual COM port’. The communications settings for this COM port are unimportant, and can be ignored, since the output of the DataSnap is fixed as the SDI-12 protocol. This means that the DataSnap will operate regardless of the BAUD rate, stop bits, parity, or Flow control settings. Interfacing with the DataSnap requires software that can open and send/receive data over a COM port.

24 ©2010 Acclima, Inc. Toll Free 1-866-887-1470
The DataSnap transfers SDI-12 commands from the USB port to the SDI-12 port without modification to the command string. However, any required Break signals, address mark, or other timing specific requirements are handled by the DataSnap. This removes the burden of SDI-12 timing from the computer, and simplifies the programming requirements for computer software, while providing a modern USB interface. Due to this architecture, all SDI-12 commands and capabilities are present when using the DataSnap, provided that the software using it is not limited. The SnapView software provided with the DataSnap can communicate with all types of SDI-12 sensors and is not limited to Acclima sensors. For more information see the ‘DataSnap Developer Reference’.