Embed Size (px)
Citation preview
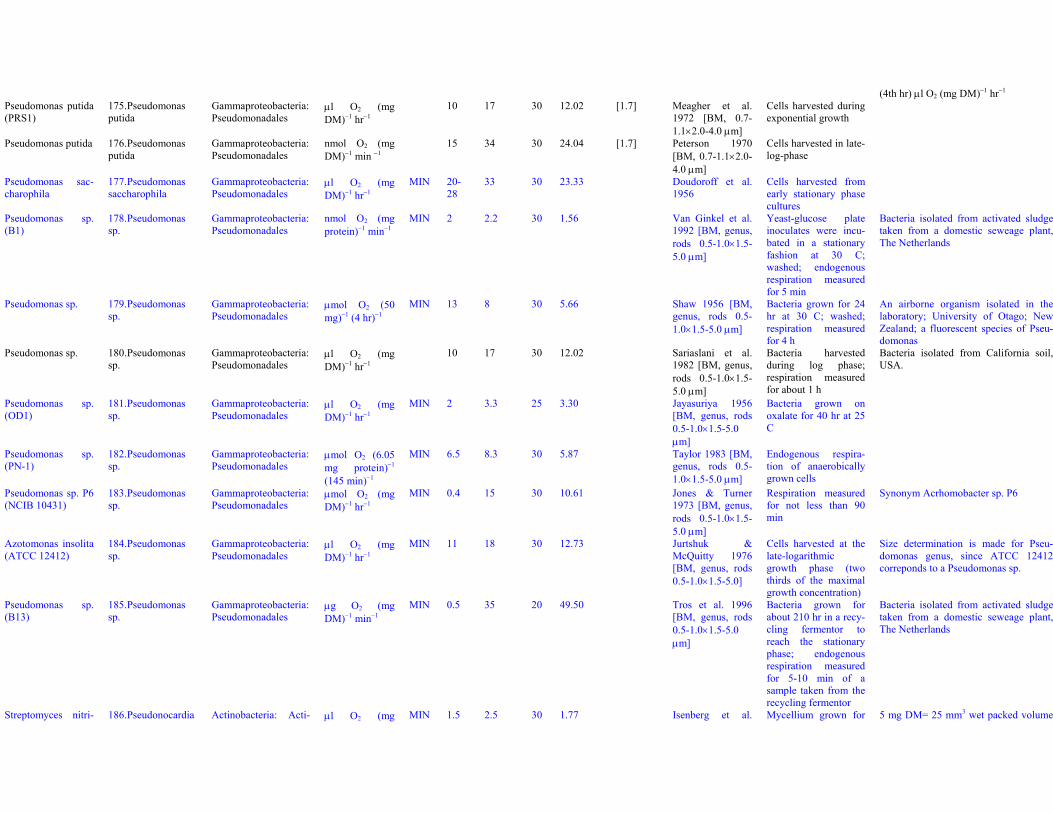
Dataset S1. Endogenous respiration rates in heterotrophic prokaryotes
Notes to Table S1a:
On data collection:Prokaryote data were compiled by searching the www.pubmedcentral.nih.gov full-text library for "bacterium" and "endogenous respiration" and sub-sequent analysis of the returned 570 documents (mostly papers in the Journal of Bacteriology and Journal of Applied and Environmental Microbiol-ogy, time period 1940-2006) and references therein.
On cell size and taxonomy:Data on endogenous respiration rates (i.e. respiration rates of non-growing cells in nutrient-deprived media) in heterotrophic eukaryotes are pre-sented. Studies of bacterial respiration very rarely report information on cell size, which had therefore to be retrieved from different sources. To doso, an attempt was made to assign the bacterial strains described in the metabolic sources to accepted species names, to futher estimate the cellsize for these species in the relevant literature. This was done using strain designations and information in the offician bacterial culture collections,like ATCC (American Type Culture Collection), NCTC (National Type Culture Collection) and others.
Column "Species (Strain)" gives the strain designation as given by the authors of the respiration data paper. Column "Valid Name" givesthe relevant valid species name for this strain, as determined from culture collections' information and/or other literature sources. Valid names followEuzéby (1997). Cell size in the "Mpg" column correspond to species indicated in the "Valid Name" column. Note that this information is of approxi-mate nature, because many respiration data come from quite old publications and it was sometimes difficult to find out the valid name of the strainused with great precision. "Class:Order" column contains the relevant taxonomic information for the species listed in the "Valid Name" column asgiven by Euzéby (1997) (http://www.bacterio.net).
For example, Hareland et al. (1975) reported respiration rate for Pseudomonas acidovorans (ATCC strain number 17455). ATCC web site(www.atcc.org) says that this strain is Delftia acidovorans originally deposited as Pseudomonas acidovorans. Cell size for Pseudomonas acido-vorans was therefore determined from the species description of Delftia acidovorans given by Wen et al. (1999). "Class:Order" for these data wasdetermined as given at http://www.bacterio.net for Delftia acidovorans.
Note that the taxonomic uncertainty exclusively relates to the cell size determination. Cell size information participates in the paper's resultsonly as a crude mean for all the 173 species studied, which is unlikely biased in any significant way. Taxonomic uncertainties, if any, do not influ-ence any of the conclusions regarding the range, mean and frequency distribution of the prokaryotic respiration rates analysed in the paper.
Abbreviations and universal conversions: DM – dry mass; WM – wet mass; N – nitrogen mass; C – carbon mass; Pr – protein mass; X/Y – X byY mass ratio in the cell, e.g. DM/WM is the ratio of dry to wet cell mass; 1 W = 1 J s−1; 1 mol O2 = 32 g O2.
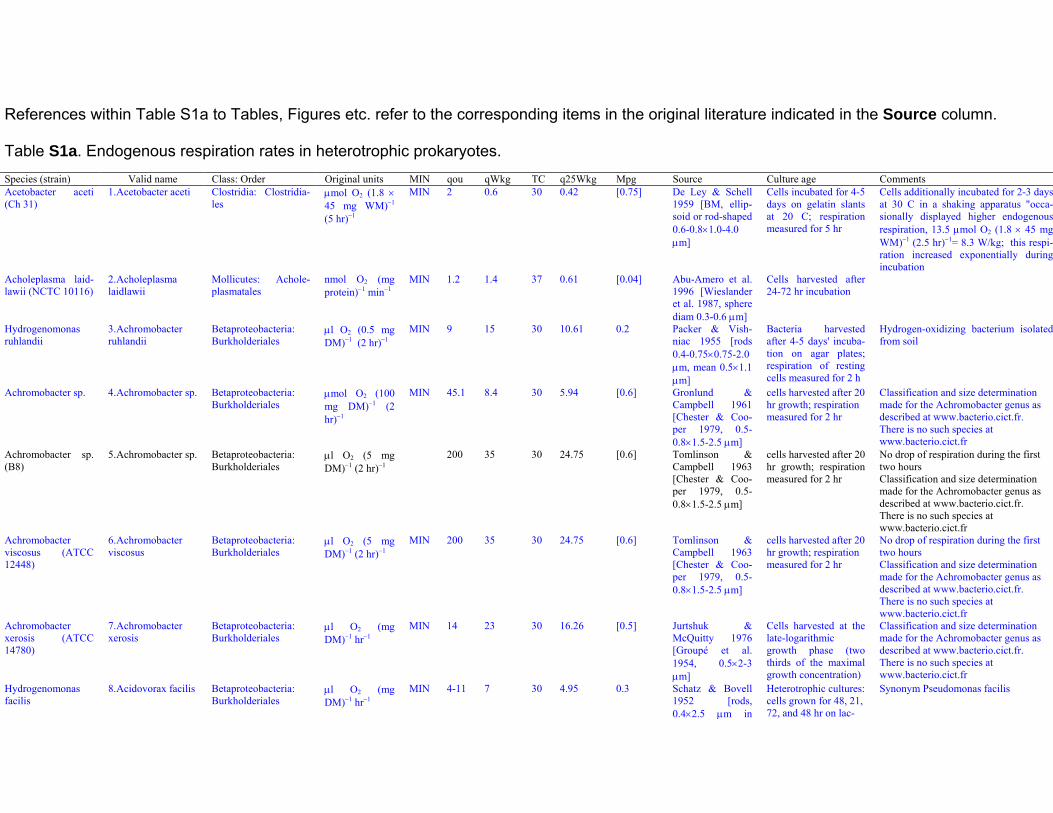
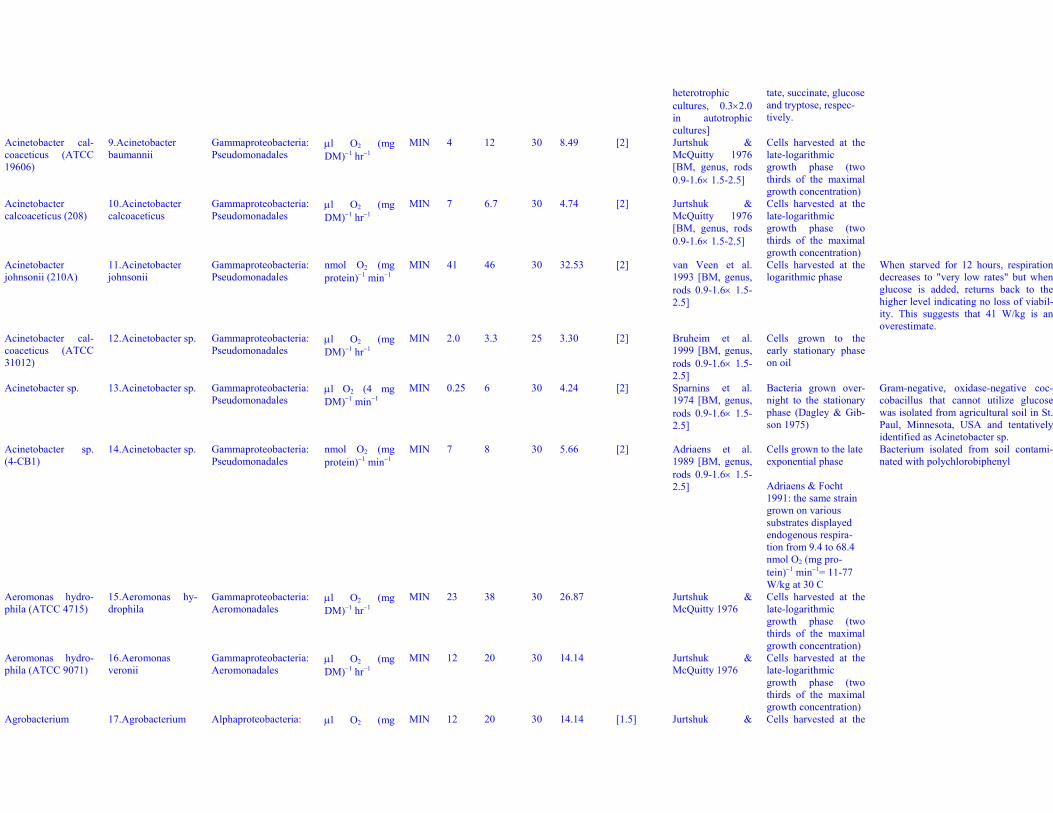
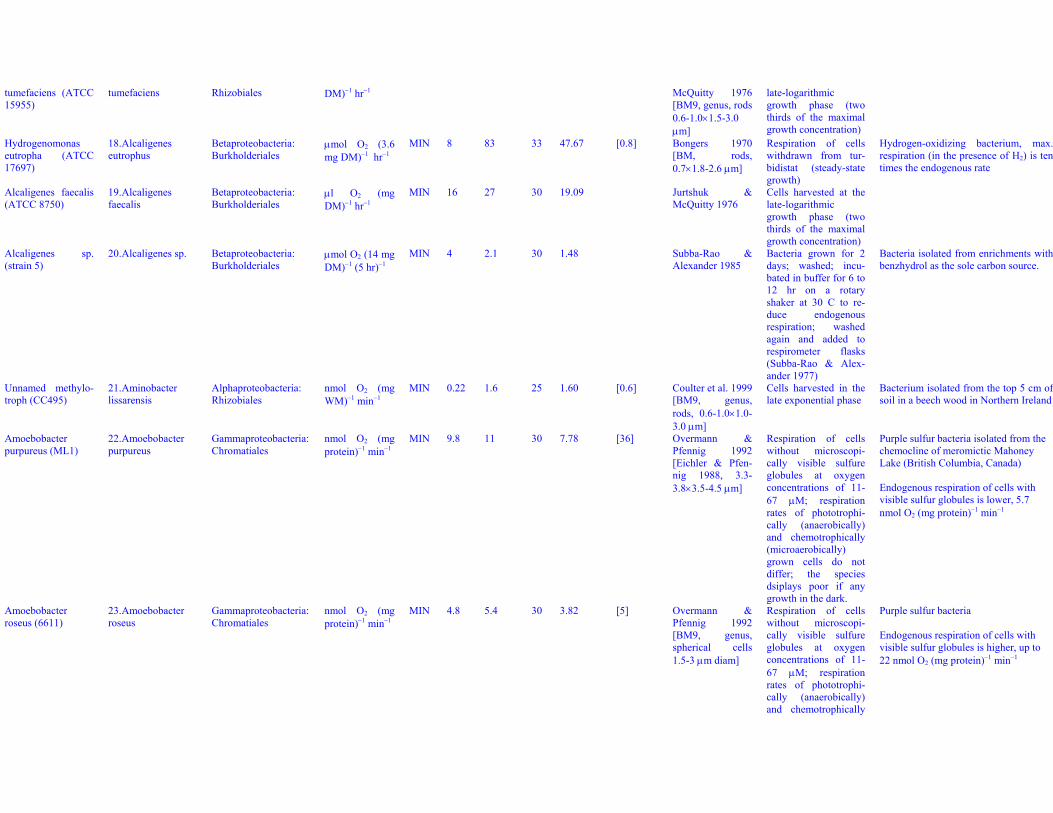
Original units are the units of endogenous respiration rate measurements as given in the original publication (Source); qou is the numeric value ofendogenous respiration rate in the original units. E.g., if it is “μl O2 (5 mg DM)−1 (2 hr)−1” in the column “Original units” and “200” in the column“qou”, this means that cells amounting to 5 mg dry mass consumed 200 microliters oxygen in two hours.
qWkg is the original endogenous respiration rate qou converted to W (kg WM)−1 (Watts per kg wet mass) using the following conversion factors:C/DM = 0.5 (Kratz & Myers 1955; Bratbak & Dundas 1984; Nagata 1986), Pr/DM = 0.5 (Gronlund & Campbell 1961; Sobek et al. 1966; Smith &Hoare 1968 (see Table S1a); Zubkov et al. 1999), N/DM = 0.1 (SI Methods, Table S12b) if not indicated otherwise, and DM/WM = 0.3 as a crudemean for all taxa applied in the analysis (SI Methods, Table S12a). Energy conversion: 1 ml O2 = 20 J. The respiratory quotent of unity was used (1mol CO2 released per 1 mol O2 consumed).
TC is ambient temperature during measurements, degrees Celsius.
q25Wkg is endogenous respiration rate converted to 25 °C using Q10 = 2, q25Wkg = qWkg × 2(25 − TC)/10, dimension W (kg WM)−1. For each speciesrows are arranged in the order of increasing q25Wkg.
Mpg: estimated cell mass, pg (1 pg = 10−12 g). In most cases it is estimated from linear dimensions (using geometric mean of the available linearsize range) assuming spherical cell shape for cocci and cylindrical shape for rods. Square brackets around the Mpg value indicate that the cell sizeinformation was obtained from a different source than the source of endogenous respiration rate data. When converting cell volume to cell mass,cell density of 1 g ml−1 was assumed.
Source: the first, unbracketed reference in this column is where the value of qou is taken from; references and data in square brackets refer to cellsize determination. Cell size reference "BM" in brackets corresponds to Bergey's Manual of Systematic Bacteriology, 1st Edition (Holt, 1984, 1986,1989); BM9 is Bergey's Manual of Determinative Bacteriology, 9th Edition (Holt et al. 1994). Word "genus" in brackets indicates that cell size is de-termined as mean for the genus. This was done for those genera where the range of minimum to maximum cell masses did not exceed a factor often. E.g. for an unknown Chromatium sp. (BM9 genus: rods 1-6×1.5-15 μm, which corresponds to cell mas range from 1.2 to 420 pg) cell mass wasleft undetermined (empty "Mpg" column).
Culture age: Information on culture age and the duration of respiration measurements, if available.
Comments: this column provides relevant information on culture conditions and cellular composition of the studied species, often including addi-tional data on respiration rates that were obtained for the same strain (species) by the same group of authors.
Log10-transformed values of q25Wkg (W (kg WM)−1), minimum for each species, were used in the analyses shown in Figures 1-3 and Table 1 in thepaper (a total of 173 values for n = 173 species). The corresponding rows are highlighted in blue.
References within Table S1a to Tables, Figures etc. refer to the corresponding items in the original literature indicated in the Source column.
Table S1a. Endogenous respiration rates in heterotrophic prokaryotes.Species (strain) Valid name Class: Order Original units MIN qou qWkg TC q25Wkg Mpg Source Culture age CommentsAcetobacter aceti(Ch 31)
1. Acetobacter aceti Clostridia: Clostridia-les
μmol O2 (1.8 ×45 mg WM)−1
(5 hr)−1
MIN 2 0.6 30 0.42 [0.75] De Ley & Schell1959 [BM, ellip-soid or rod-shaped0.6-0.8×1.0-4.0μm]
Cells incubated for 4-5days on gelatin slantsat 20 C; respirationmeasured for 5 hr
Cells additionally incubated for 2-3 daysat 30 C in a shaking apparatus "occa-sionally displayed higher endogenousrespiration, 13.5 μmol O2 (1.8 × 45 mgWM)−1 (2.5 hr)−1= 8.3 W/kg; this respi-ration increased exponentially duringincubation
Acholeplasma laid-lawii (NCTC 10116)
2. Acholeplasmalaidlawii
Mollicutes: Achole-plasmatales
nmol O2 (mgprotein)−1 min−1
MIN 1.2 1.4 37 0.61 [0.04] Abu-Amero et al.1996 [Wieslanderet al. 1987, spherediam 0.3-0.6 μm]
Cells harvested after24-72 hr incubation
Hydrogenomonasruhlandii
3. Achromobacterruhlandii
Betaproteobacteria:Burkholderiales
μl O2 (0.5 mgDM)−1 (2 hr)−1
MIN 9 15 30 10.61 0.2 Packer & Vish-niac 1955 [rods0.4-0.75×0.75-2.0μm, mean 0.5×1.1μm]
Bacteria harvestedafter 4-5 days' incuba-tion on agar plates;respiration of restingcells measured for 2 h
Hydrogen-oxidizing bacterium isolatedfrom soil
Achromobacter sp. 4. Achromobacter sp. Betaproteobacteria:Burkholderiales
μmol O2 (100mg DM)−1 (2hr)−1
MIN 45.1 8.4 30 5.94 [0.6] Gronlund &Campbell 1961[Chester & Coo-per 1979, 0.5-0.8×1.5-2.5 μm]
cells harvested after 20hr growth; respirationmeasured for 2 hr
Classification and size determinationmade for the Achromobacter genus asdescribed at www.bacterio.cict.fr.There is no such species atwww.bacterio.cict.fr
Achromobacter sp.(B8)
5. Achromobacter sp. Betaproteobacteria:Burkholderiales
μl O2 (5 mgDM)−1 (2 hr)−1
200 35 30 24.75 [0.6] Tomlinson &Campbell 1963[Chester & Coo-per 1979, 0.5-0.8×1.5-2.5 μm]
cells harvested after 20hr growth; respirationmeasured for 2 hr
No drop of respiration during the firsttwo hoursClassification and size determinationmade for the Achromobacter genus asdescribed at www.bacterio.cict.fr.There is no such species atwww.bacterio.cict.fr
Achromobacterviscosus (ATCC12448)
6. Achromobacterviscosus
Betaproteobacteria:Burkholderiales
μl O2 (5 mgDM)−1 (2 hr)−1
MIN 200 35 30 24.75 [0.6] Tomlinson &Campbell 1963[Chester & Coo-per 1979, 0.5-0.8×1.5-2.5 μm]
cells harvested after 20hr growth; respirationmeasured for 2 hr
No drop of respiration during the firsttwo hoursClassification and size determinationmade for the Achromobacter genus asdescribed at www.bacterio.cict.fr.There is no such species atwww.bacterio.cict.fr
Achromobacterxerosis (ATCC14780)
7. Achromobacterxerosis
Betaproteobacteria:Burkholderiales
μl O2 (mgDM)−1 hr−1
MIN 14 23 30 16.26 [0.5] Jurtshuk &McQuitty 1976[Groupé et al.1954, 0.5×2-3μm]
Cells harvested at thelate-logarithmicgrowth phase (twothirds of the maximalgrowth concentration)
Classification and size determinationmade for the Achromobacter genus asdescribed at www.bacterio.cict.fr.There is no such species atwww.bacterio.cict.fr
Hydrogenomonasfacilis
8. Acidovorax facilis Betaproteobacteria:Burkholderiales
μl O2 (mgDM)−1 hr−1
MIN 4-11 7 30 4.95 0.3 Schatz & Bovell1952 [rods,0.4×2.5 μm in
Heterotrophic cultures:cells grown for 48, 21,72, and 48 hr on lac-
Synonym Pseudomonas facilis
heterotrophiccultures, 0.3×2.0in autotrophiccultures]
tate, succinate, glucoseand tryptose, respec-tively.
Acinetobacter cal-coaceticus (ATCC19606)
9. Acinetobacterbaumannii
Gammaproteobacteria:Pseudomonadales
μl O2 (mgDM)−1 hr−1
MIN 4 12 30 8.49 [2] Jurtshuk &McQuitty 1976[BM, genus, rods0.9-1.6× 1.5-2.5]
Cells harvested at thelate-logarithmicgrowth phase (twothirds of the maximalgrowth concentration)
Acinetobactercalcoaceticus (208)
10. Acinetobactercalcoaceticus
Gammaproteobacteria:Pseudomonadales
μl O2 (mgDM)−1 hr−1
MIN 7 6.7 30 4.74 [2] Jurtshuk &McQuitty 1976[BM, genus, rods0.9-1.6× 1.5-2.5]
Cells harvested at thelate-logarithmicgrowth phase (twothirds of the maximalgrowth concentration)
Acinetobacterjohnsonii (210A)
11. Acinetobacterjohnsonii
Gammaproteobacteria:Pseudomonadales
nmol O2 (mgprotein)−1 min−1
MIN 41 46 30 32.53 [2] van Veen et al.1993 [BM, genus,rods 0.9-1.6× 1.5-2.5]
Cells harvested at thelogarithmic phase
When starved for 12 hours, respirationdecreases to "very low rates" but whenglucose is added, returns back to thehigher level indicating no loss of viabil-ity. This suggests that 41 W/kg is anoverestimate.
Acinetobacter cal-coaceticus (ATCC31012)
12. Acinetobacter sp. Gammaproteobacteria:Pseudomonadales
μl O2 (mgDM)−1 hr−1
MIN 2.0 3.3 25 3.30 [2] Bruheim et al.1999 [BM, genus,rods 0.9-1.6× 1.5-2.5]
Cells grown to theearly stationary phaseon oil
Acinetobacter sp. 13. Acinetobacter sp. Gammaproteobacteria:Pseudomonadales
μl O2 (4 mgDM)−1 min−1
MIN 0.25 6 30 4.24 [2] Sparnins et al.1974 [BM, genus,rods 0.9-1.6× 1.5-2.5]
Bacteria grown over-night to the stationaryphase (Dagley & Gib-son 1975)
Gram-negative, oxidase-negative coc-cobacillus that cannot utilize glucosewas isolated from agricultural soil in St.Paul, Minnesota, USA and tentativelyidentified as Acinetobacter sp.
Acinetobacter sp.(4-CB1)
14. Acinetobacter sp. Gammaproteobacteria:Pseudomonadales
nmol O2 (mgprotein)−1 min−1
MIN 7 8 30 5.66 [2] Adriaens et al.1989 [BM, genus,rods 0.9-1.6× 1.5-2.5]
Cells grown to the lateexponential phase
Adriaens & Focht1991: the same straingrown on varioussubstrates displayedendogenous respira-tion from 9.4 to 68.4nmol O2 (mg pro-tein)−1 min−1= 11-77W/kg at 30 C
Bacterium isolated from soil contami-nated with polychlorobiphenyl
Aeromonas hydro-phila (ATCC 4715)
15. Aeromonas hy-drophila
Gammaproteobacteria:Aeromonadales
μl O2 (mgDM)−1 hr−1
MIN 23 38 30 26.87 Jurtshuk &McQuitty 1976
Cells harvested at thelate-logarithmicgrowth phase (twothirds of the maximalgrowth concentration)
Aeromonas hydro-phila (ATCC 9071)
16. Aeromonasveronii
Gammaproteobacteria:Aeromonadales
μl O2 (mgDM)−1 hr−1
MIN 12 20 30 14.14 Jurtshuk &McQuitty 1976
Cells harvested at thelate-logarithmicgrowth phase (twothirds of the maximalgrowth concentration)
Agrobacterium 17. Agrobacterium Alphaproteobacteria: μl O2 (mg MIN 12 20 30 14.14 [1.5] Jurtshuk & Cells harvested at the
tumefaciens (ATCC15955)
tumefaciens Rhizobiales DM)−1 hr−1 McQuitty 1976[BM9, genus, rods0.6-1.0×1.5-3.0μm]
late-logarithmicgrowth phase (twothirds of the maximalgrowth concentration)
Hydrogenomonaseutropha (ATCC17697)
18. Alcaligeneseutrophus
Betaproteobacteria:Burkholderiales
μmol O2 (3.6mg DM)−1 hr−1
MIN 8 83 33 47.67 [0.8] Bongers 1970[BM, rods,0.7×1.8-2.6 μm]
Respiration of cellswithdrawn from tur-bidistat (steady-stategrowth)
Hydrogen-oxidizing bacterium, max.respiration (in the presence of H2) is tentimes the endogenous rate
Alcaligenes faecalis(ATCC 8750)
19. Alcaligenesfaecalis
Betaproteobacteria:Burkholderiales
μl O2 (mgDM)−1 hr−1
MIN 16 27 30 19.09 Jurtshuk &McQuitty 1976
Cells harvested at thelate-logarithmicgrowth phase (twothirds of the maximalgrowth concentration)
Alcaligenes sp.(strain 5)
20. Alcaligenes sp. Betaproteobacteria:Burkholderiales
μmol O2 (14 mgDM)−1 (5 hr)−1
MIN 4 2.1 30 1.48 Subba-Rao &Alexander 1985
Bacteria grown for 2days; washed; incu-bated in buffer for 6 to12 hr on a rotaryshaker at 30 C to re-duce endogenousrespiration; washedagain and added torespirometer flasks(Subba-Rao & Alex-ander 1977)
Bacteria isolated from enrichments withbenzhydrol as the sole carbon source.
Unnamed methylo-troph (CC495)
21. Aminobacterlissarensis
Alphaproteobacteria:Rhizobiales
nmol O2 (mgWM)−1 min−1
MIN 0.22 1.6 25 1.60 [0.6] Coulter et al. 1999[BM9, genus,rods, 0.6-1.0×1.0-3.0 μm]
Cells harvested in thelate exponential phase
Bacterium isolated from the top 5 cm ofsoil in a beech wood in Northern Ireland
Amoebobacterpurpureus (ML1)
22. Amoebobacterpurpureus
Gammaproteobacteria:Chromatiales
nmol O2 (mgprotein)−1 min−1
MIN 9.8 11 30 7.78 [36] Overmann &Pfennig 1992[Eichler & Pfen-nig 1988, 3.3-3.8×3.5-4.5 μm]
Respiration of cellswithout microscopi-cally visible sulfureglobules at oxygenconcentrations of 11-67 μM; respirationrates of phototrophi-cally (anaerobically)and chemotrophically(microaerobically)grown cells do notdiffer; the speciesdsiplays poor if anygrowth in the dark.
Purple sulfur bacteria isolated from thechemocline of meromictic MahoneyLake (British Columbia, Canada)
Endogenous respiration of cells withvisible sulfur globules is lower, 5.7nmol O2 (mg protein)−1 min−1
Amoebobacterroseus (6611)
23. Amoebobacterroseus
Gammaproteobacteria:Chromatiales
nmol O2 (mgprotein)−1 min−1
MIN 4.8 5.4 30 3.82 [5] Overmann &Pfennig 1992[BM9, genus,spherical cells1.5-3 μm diam]
Respiration of cellswithout microscopi-cally visible sulfureglobules at oxygenconcentrations of 11-67 μM; respirationrates of phototrophi-cally (anaerobically)and chemotrophically
Purple sulfur bacteria
Endogenous respiration of cells withvisible sulfur globules is higher, up to22 nmol O2 (mg protein)−1 min−1

(microaerobically)grown cells do notdiffer; the species iscapable of chemotro-phic growth in thedark.
Amoebobaeterpendens (5813)
24. Amoebobaeterpendens
Gammaproteobacteria:Chromatiales
nmol O2 (mgprotein)−1 min−1
MIN 7.6 8.5 30 6.01 [5] Overmann &Pfennig1992[BM9, genus,spherical cells1.5-3 μm diam]
Respiration of cellswithout microscopi-cally visible sulfureglobules at oxygenconcentrations of 11-67 μM; respirationrates of phototrophi-cally (anaerobically)and chemotrophically(microaerobically)grown cells do notdiffer.
Purple sulfur bacteria
Endogenous respiration of cells withvisible sulfur globules is higher, up to35 nmol O2 (mg protein)−1 min−1
Spirillum (Aquaspi-rillum) itersonii(ATCC 12639)
25. Aquaspirillumitersonii
Betaproteobacteria:Neisseriales
μl O2 (mgDM)−1 hr−1
MIN 6 10 30 7.07 [0.9] Jurtshuk &McQuitty 1976[Krieg 1976,helical shape, Fig.1E, Table 3, diam0.3-0.4 μm, fulllength ~10 μm]
Cells harvested at thelate-logarithmicgrowth phase (twothirds of the maximalgrowth concentration)
Arthrobacter crys-tallopoietes
26. Arthrobactercrystallopoietes
Actinobacteria: Acti-nomycetales
μl O2 (mgDM)−1 hr−1
MIN 0.1 0.2 30 0.14 1.7 Ensign 1970 Cells harvested duringthe exponential phaseof growth (48 hr forspherical cells, 4-8 hrfor rods); stable en-dogenous respirationduring 24 days ofstarvation at 100%viability
cell mass estimated from the dry massdata for spherical cells (0.5 mg dry massper 109 cells)
Endogenous respiration at harvest wasabout 8-9 μl O2 (mg DM)−1 hr−1 anddecreased 80-fold during the first twodays of starvation
Growing spherical cells contain about40% (dry mass) of a glycogen-likepolysaccharide; rods — 10% (Boylen &Ensign 1970)
Boylen 1973: Bacteria of this speciessurvived 6 months of extreme desicca-tion at 50% viability converting0.0005% of their carbon per hour tocarbon dioxide (≈ 10−2 W/kg)
Arthrobacter globi-formis (ATCC8010)
27. Arthrobacterglobiformis
Actinobacteria: Acti-nomycetales
μl O2 (mgDM)−1 hr−1
MIN 5 8.3 30 5.87 [0.5] Jurtshuk &McQuitty 1976[Conn & Dim-mick 1947, rods0.6-0.8×1-1.5 μm]
Cells harvested at thelate-logarithmicgrowth phase (twothirds of the maximalgrowth concentration)
Arthrobacter globi-formis (NCIB
28. Arthrobacter sp. Actinobacteria: Acti-nomycetales
μl O2 (mgDM)−1 hr−1
MIN 0.45 0.75 25 0.75 0.2 Luscombe & Gray1974
Cells harvested fromcontinuous cultures
Cocci survive better than rods; initialendogenous respiration was 1.74 and
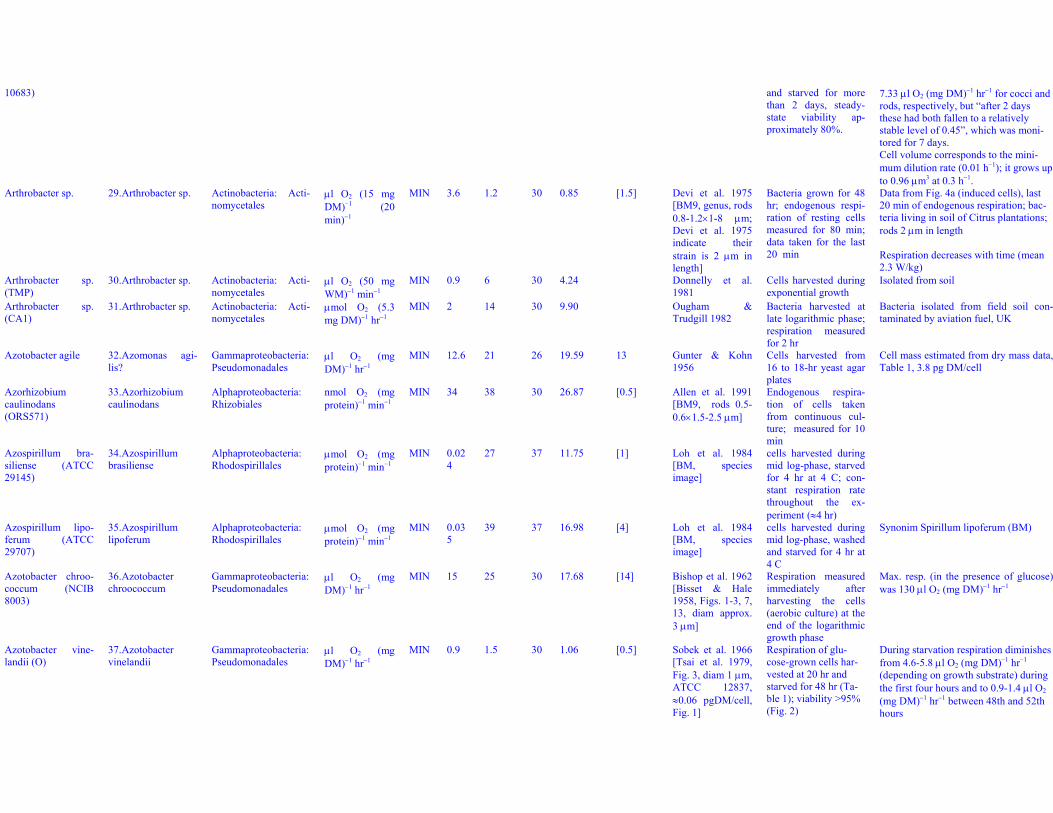
10683) and starved for morethan 2 days, steady-state viability ap-proximately 80%.
7.33 μl O2 (mg DM)−1 hr−1 for cocci androds, respectively, but “after 2 daysthese had both fallen to a relativelystable level of 0.45”, which was moni-tored for 7 days.Cell volume corresponds to the mini-mum dilution rate (0.01 h−1); it grows upto 0.96 μm3 at 0.3 h−1.
Arthrobacter sp. 29. Arthrobacter sp. Actinobacteria: Acti-nomycetales
μl O2 (15 mgDM)−1 (20min)−1
MIN 3.6 1.2 30 0.85 [1.5] Devi et al. 1975[BM9, genus, rods0.8-1.2×1-8 μm;Devi et al. 1975indicate theirstrain is 2 μm inlength]
Bacteria grown for 48hr; endogenous respi-ration of resting cellsmeasured for 80 min;data taken for the last20 min
Data from Fig. 4a (induced cells), last20 min of endogenous respiration; bac-teria living in soil of Citrus plantations;rods 2 μm in length
Respiration decreases with time (mean2.3 W/kg)
Arthrobacter sp.(TMP)
30. Arthrobacter sp. Actinobacteria: Acti-nomycetales
μl O2 (50 mgWM)−1 min−1
MIN 0.9 6 30 4.24 Donnelly et al.1981
Cells harvested duringexponential growth
Isolated from soil
Arthrobacter sp.(CA1)
31. Arthrobacter sp. Actinobacteria: Acti-nomycetales
μmol O2 (5.3mg DM)−1 hr−1
MIN 2 14 30 9.90 Ougham &Trudgill 1982
Bacteria harvested atlate logarithmic phase;respiration measuredfor 2 hr
Bacteria isolated from field soil con-taminated by aviation fuel, UK
Azotobacter agile 32. Azomonas agi-lis?
Gammaproteobacteria:Pseudomonadales
μl O2 (mgDM)−1 hr−1
MIN 12.6 21 26 19.59 13 Gunter & Kohn1956
Cells harvested from16 to 18-hr yeast agarplates
Cell mass estimated from dry mass data,Table 1, 3.8 pg DM/cell
Azorhizobiumcaulinodans(ORS571)
33. Azorhizobiumcaulinodans
Alphaproteobacteria:Rhizobiales
nmol O2 (mgprotein)−1 min−1
MIN 34 38 30 26.87 [0.5] Allen et al. 1991[BM9, rods 0.5-0.6×1.5-2.5 μm]
Endogenous respira-tion of cells takenfrom continuous cul-ture; measured for 10min
Azospirillum bra-siliense (ATCC29145)
34. Azospirillumbrasiliense
Alphaproteobacteria:Rhodospirillales
μmol O2 (mgprotein)−1 min−1
MIN 0.024
27 37 11.75 [1] Loh et al. 1984[BM, speciesimage]
cells harvested duringmid log-phase, starvedfor 4 hr at 4 C; con-stant respiration ratethroughout the ex-periment (≈4 hr)
Azospirillum lipo-ferum (ATCC29707)
35. Azospirillumlipoferum
Alphaproteobacteria:Rhodospirillales
μmol O2 (mgprotein)−1 min−1
MIN 0.035
39 37 16.98 [4] Loh et al. 1984[BM, speciesimage]
cells harvested duringmid log-phase, washedand starved for 4 hr at4 C
Synonim Spirillum lipoferum (BM)
Azotobacter chroo-coccum (NCIB8003)
36. Azotobacterchroococcum
Gammaproteobacteria:Pseudomonadales
μl O2 (mgDM)−1 hr−1
MIN 15 25 30 17.68 [14] Bishop et al. 1962[Bisset & Hale1958, Figs. 1-3, 7,13, diam approx.3 μm]
Respiration measuredimmediately afterharvesting the cells(aerobic culture) at theend of the logarithmicgrowth phase
Max. resp. (in the presence of glucose)was 130 μl O2 (mg DM)−1 hr−1
Azotobacter vine-landii (O)
37. Azotobactervinelandii
Gammaproteobacteria:Pseudomonadales
μl O2 (mgDM)−1 hr−1
MIN 0.9 1.5 30 1.06 [0.5] Sobek et al. 1966[Tsai et al. 1979,Fig. 3, diam 1 μm,ATCC 12837,≈0.06 pgDM/cell,Fig. 1]
Respiration of glu-cose-grown cells har-vested at 20 hr andstarved for 48 hr (Ta-ble 1); viability >95%(Fig. 2)
During starvation respiration diminishesfrom 4.6-5.8 μl O2 (mg DM)−1 hr−1
(depending on growth substrate) duringthe first four hours and to 0.9-1.4 μl O2
(mg DM)−1 hr−1 between 48th and 52thhours
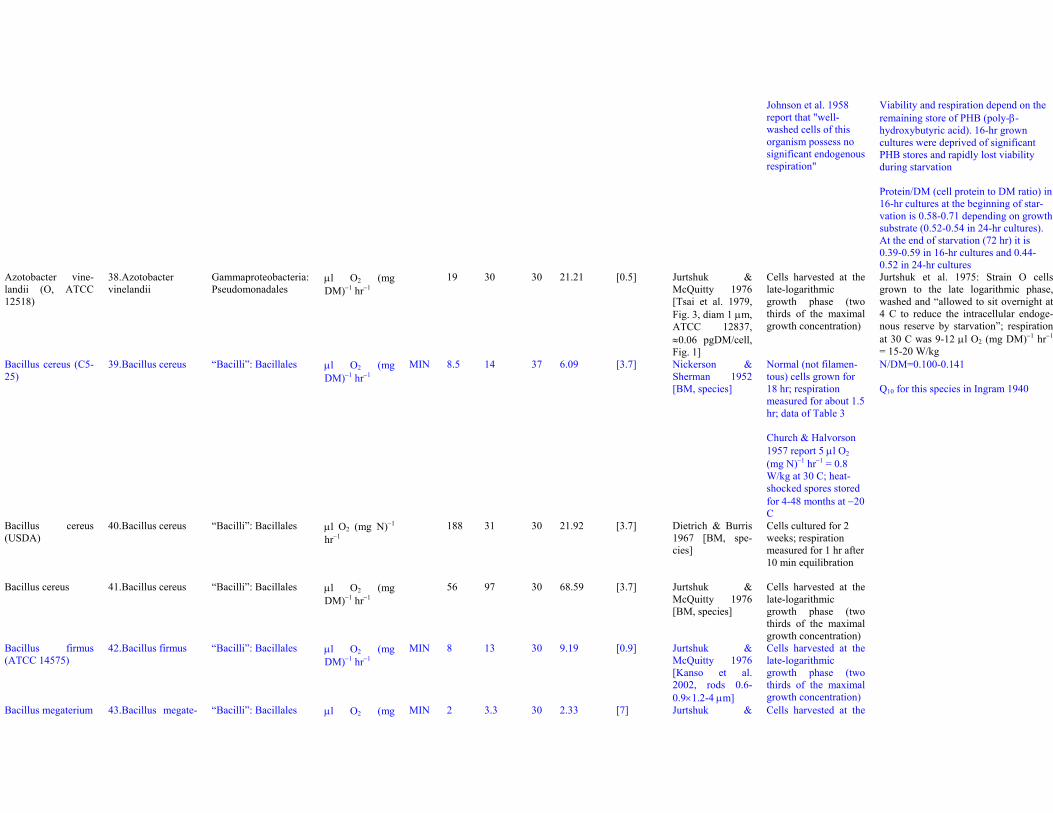
Johnson et al. 1958report that "well-washed cells of thisorganism possess nosignificant endogenousrespiration"
Viability and respiration depend on theremaining store of PHB (poly-β-hydroxybutyric acid). 16-hr growncultures were deprived of significantPHB stores and rapidly lost viabilityduring starvation
Protein/DM (cell protein to DM ratio) in16-hr cultures at the beginning of star-vation is 0.58-0.71 depending on growthsubstrate (0.52-0.54 in 24-hr cultures).At the end of starvation (72 hr) it is0.39-0.59 in 16-hr cultures and 0.44-0.52 in 24-hr cultures
Azotobacter vine-landii (O, ATCC12518)
38. Azotobactervinelandii
Gammaproteobacteria:Pseudomonadales
μl O2 (mgDM)−1 hr−1
19 30 30 21.21 [0.5] Jurtshuk &McQuitty 1976[Tsai et al. 1979,Fig. 3, diam 1 μm,ATCC 12837,≈0.06 pgDM/cell,Fig. 1]
Cells harvested at thelate-logarithmicgrowth phase (twothirds of the maximalgrowth concentration)
Jurtshuk et al. 1975: Strain O cellsgrown to the late logarithmic phase,washed and “allowed to sit overnight at4 C to reduce the intracellular endoge-nous reserve by starvation”; respirationat 30 C was 9-12 μl O2 (mg DM)−1 hr−1
= 15-20 W/kgBacillus cereus (C5-25)
39. Bacillus cereus “Bacilli”: Bacillales μl O2 (mgDM)−1 hr−1
MIN 8.5 14 37 6.09 [3.7] Nickerson &Sherman 1952[BM, species]
Normal (not filamen-tous) cells grown for18 hr; respirationmeasured for about 1.5hr; data of Table 3
Church & Halvorson1957 report 5 μl O2
(mg N)−1 hr−1 = 0.8W/kg at 30 C; heat-shocked spores storedfor 4-48 months at −20C
N/DM=0.100-0.141
Q10 for this species in Ingram 1940
Bacillus cereus(USDA)
40. Bacillus cereus “Bacilli”: Bacillales μl O2 (mg N)−1
hr−1188 31 30 21.92 [3.7] Dietrich & Burris
1967 [BM, spe-cies]
Cells cultured for 2weeks; respirationmeasured for 1 hr after10 min equilibration
Bacillus cereus 41. Bacillus cereus “Bacilli”: Bacillales μl O2 (mgDM)−1 hr−1
56 97 30 68.59 [3.7] Jurtshuk &McQuitty 1976[BM, species]
Cells harvested at thelate-logarithmicgrowth phase (twothirds of the maximalgrowth concentration)
Bacillus firmus(ATCC 14575)
42. Bacillus firmus “Bacilli”: Bacillales μl O2 (mgDM)−1 hr−1
MIN 8 13 30 9.19 [0.9] Jurtshuk &McQuitty 1976[Kanso et al.2002, rods 0.6-0.9×1.2-4 μm]
Cells harvested at thelate-logarithmicgrowth phase (twothirds of the maximalgrowth concentration)
Bacillus megaterium 43. Bacillus megate- “Bacilli”: Bacillales μl O2 (mg MIN 2 3.3 30 2.33 [7] Jurtshuk & Cells harvested at the
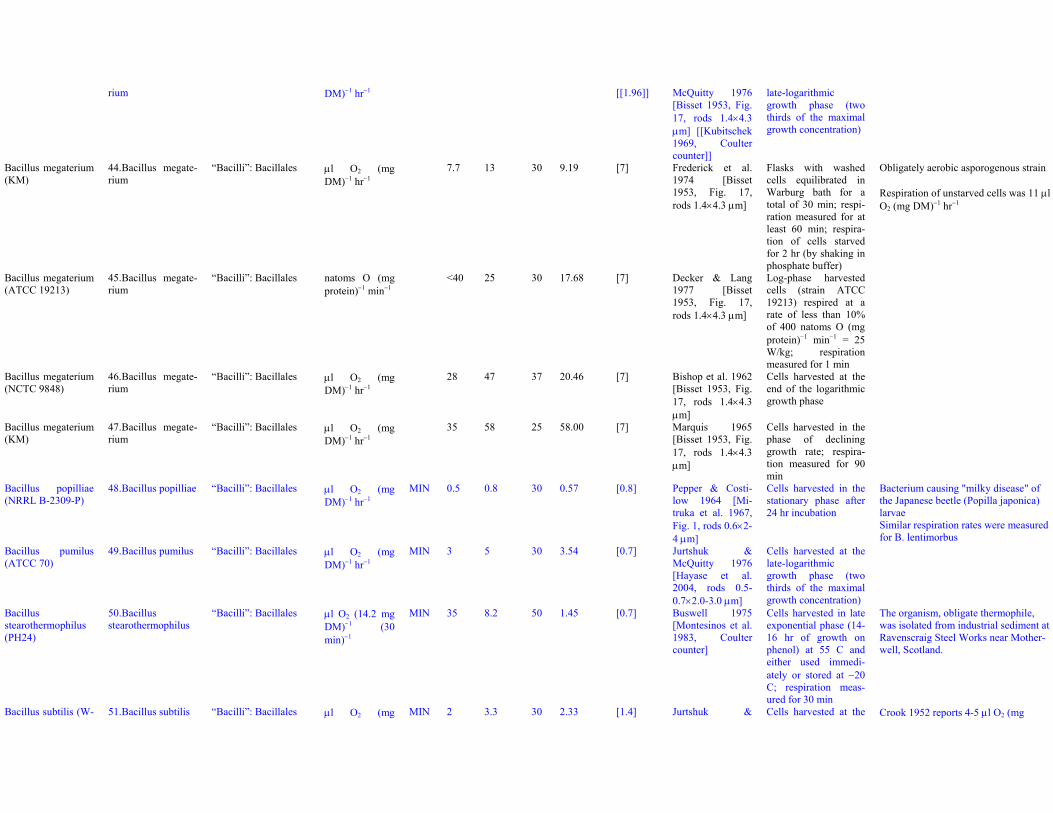
rium DM)−1 hr−1 [[1.96]] McQuitty 1976[Bisset 1953, Fig.17, rods 1.4×4.3μm] [[Kubitschek1969, Coultercounter]]
late-logarithmicgrowth phase (twothirds of the maximalgrowth concentration)
Bacillus megaterium(KM)
44. Bacillus megate-rium
“Bacilli”: Bacillales μl O2 (mgDM)−1 hr−1
7.7 13 30 9.19 [7] Frederick et al.1974 [Bisset1953, Fig. 17,rods 1.4×4.3 μm]
Flasks with washedcells equilibrated inWarburg bath for atotal of 30 min; respi-ration measured for atleast 60 min; respira-tion of cells starvedfor 2 hr (by shaking inphosphate buffer)
Obligately aerobic asporogenous strain
Respiration of unstarved cells was 11 μlO2 (mg DM)−1 hr−1
Bacillus megaterium(ATCC 19213)
45. Bacillus megate-rium
“Bacilli”: Bacillales natoms O (mgprotein)−1 min−1
<40 25 30 17.68 [7] Decker & Lang1977 [Bisset1953, Fig. 17,rods 1.4×4.3 μm]
Log-phase harvestedcells (strain ATCC19213) respired at arate of less than 10%of 400 natoms O (mgprotein)−1 min−1 = 25W/kg; respirationmeasured for 1 min
Bacillus megaterium(NCTC 9848)
46. Bacillus megate-rium
“Bacilli”: Bacillales μl O2 (mgDM)−1 hr−1
28 47 37 20.46 [7] Bishop et al. 1962[Bisset 1953, Fig.17, rods 1.4×4.3μm]
Cells harvested at theend of the logarithmicgrowth phase
Bacillus megaterium(KM)
47. Bacillus megate-rium
“Bacilli”: Bacillales μl O2 (mgDM)−1 hr−1
35 58 25 58.00 [7] Marquis 1965[Bisset 1953, Fig.17, rods 1.4×4.3μm]
Cells harvested in thephase of declininggrowth rate; respira-tion measured for 90min
Bacillus popilliae(NRRL B-2309-P)
48. Bacillus popilliae “Bacilli”: Bacillales μl O2 (mgDM)−1 hr−1
MIN 0.5 0.8 30 0.57 [0.8] Pepper & Costi-low 1964 [Mi-truka et al. 1967,Fig. 1, rods 0.6×2-4 μm]
Cells harvested in thestationary phase after24 hr incubation
Bacterium causing "milky disease" ofthe Japanese beetle (Popilla japonica)larvaeSimilar respiration rates were measuredfor B. lentimorbus
Bacillus pumilus(ATCC 70)
49. Bacillus pumilus “Bacilli”: Bacillales μl O2 (mgDM)−1 hr−1
MIN 3 5 30 3.54 [0.7] Jurtshuk &McQuitty 1976[Hayase et al.2004, rods 0.5-0.7×2.0-3.0 μm]
Cells harvested at thelate-logarithmicgrowth phase (twothirds of the maximalgrowth concentration)
Bacillusstearothermophilus(PH24)
50. Bacillusstearothermophilus
“Bacilli”: Bacillales μl O2 (14.2 mgDM)−1 (30min)−1
MIN 35 8.2 50 1.45 [0.7] Buswell 1975[Montesinos et al.1983, Coultercounter]
Cells harvested in lateexponential phase (14-16 hr of growth onphenol) at 55 C andeither used immedi-ately or stored at −20C; respiration meas-ured for 30 min
The organism, obligate thermophile,was isolated from industrial sediment atRavenscraig Steel Works near Mother-well, Scotland.
Bacillus subtilis (W- 51. Bacillus subtilis “Bacilli”: Bacillales μl O2 (mg MIN 2 3.3 30 2.33 [1.4] Jurtshuk & Cells harvested at the Crook 1952 reports 4-5 μl O2 (mg
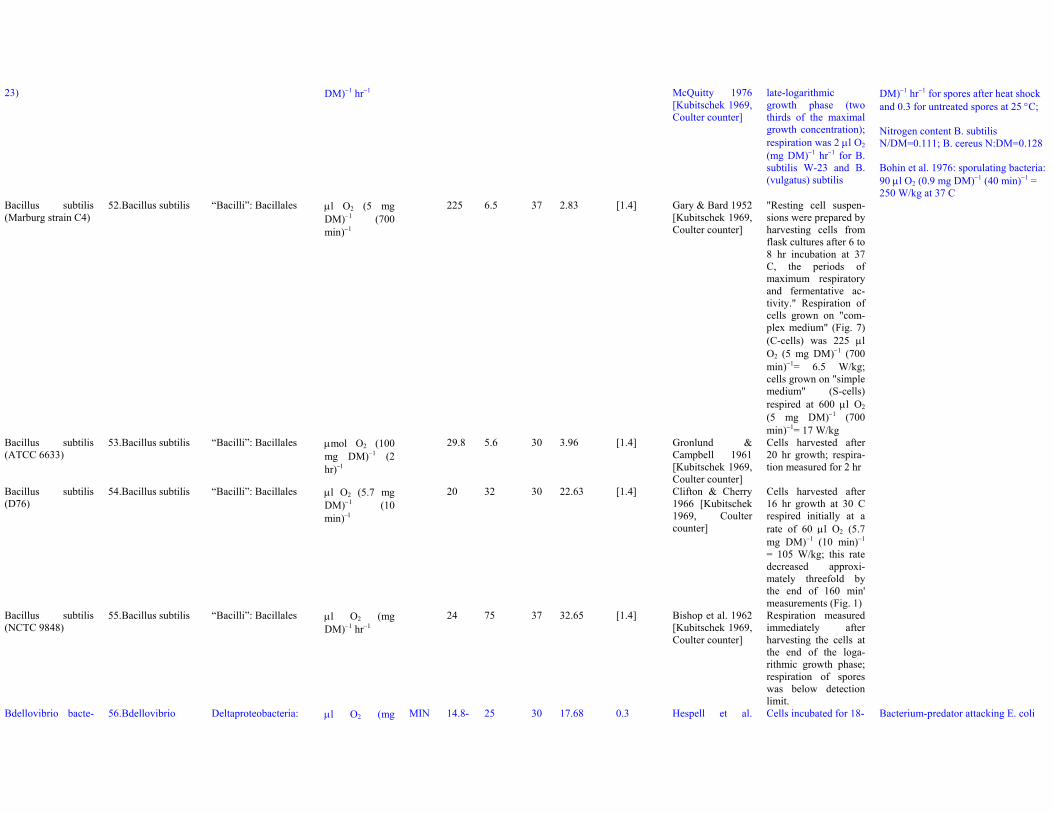
23) DM)−1 hr−1 McQuitty 1976[Kubitschek 1969,Coulter counter]
late-logarithmicgrowth phase (twothirds of the maximalgrowth concentration);respiration was 2 μl O2
(mg DM)−1 hr−1 for B.subtilis W-23 and B.(vulgatus) subtilis
DM)−1 hr−1 for spores after heat shockand 0.3 for untreated spores at 25 °C;
Nitrogen content B. subtilisN/DM=0.111; B. cereus N:DM=0.128
Bohin et al. 1976: sporulating bacteria:90 μl O2 (0.9 mg DM)−1 (40 min)−1 =250 W/kg at 37 C
Bacillus subtilis(Marburg strain C4)
52. Bacillus subtilis “Bacilli”: Bacillales μl O2 (5 mgDM)−1 (700min)−1
225 6.5 37 2.83 [1.4] Gary & Bard 1952[Kubitschek 1969,Coulter counter]
"Resting cell suspen-sions were prepared byharvesting cells fromflask cultures after 6 to8 hr incubation at 37C, the periods ofmaximum respiratoryand fermentative ac-tivity." Respiration ofcells grown on "com-plex medium" (Fig. 7)(C-cells) was 225 μlO2 (5 mg DM)−1 (700min)−1= 6.5 W/kg;cells grown on "simplemedium" (S-cells)respired at 600 μl O2
(5 mg DM)−1 (700min)−1= 17 W/kg
Bacillus subtilis(ATCC 6633)
53. Bacillus subtilis “Bacilli”: Bacillales μmol O2 (100mg DM)−1 (2hr)−1
29.8 5.6 30 3.96 [1.4] Gronlund &Campbell 1961[Kubitschek 1969,Coulter counter]
Cells harvested after20 hr growth; respira-tion measured for 2 hr
Bacillus subtilis(D76)
54. Bacillus subtilis “Bacilli”: Bacillales μl O2 (5.7 mgDM)−1 (10min)−1
20 32 30 22.63 [1.4] Clifton & Cherry1966 [Kubitschek1969, Coultercounter]
Cells harvested after16 hr growth at 30 Crespired initially at arate of 60 μl O2 (5.7mg DM)−1 (10 min)−1
= 105 W/kg; this ratedecreased approxi-mately threefold bythe end of 160 min'measurements (Fig. 1)
Bacillus subtilis(NCTC 9848)
55. Bacillus subtilis “Bacilli”: Bacillales μl O2 (mgDM)−1 hr−1
24 75 37 32.65 [1.4] Bishop et al. 1962[Kubitschek 1969,Coulter counter]
Respiration measuredimmediately afterharvesting the cells atthe end of the loga-rithmic growth phase;respiration of sporeswas below detectionlimit.
Bdellovibrio bacte- 56. Bdellovibrio Deltaproteobacteria: μl O2 (mg MIN 14.8- 25 30 17.68 0.3 Hespell et al. Cells incubated for 18- Bacterium-predator attacking E. coli
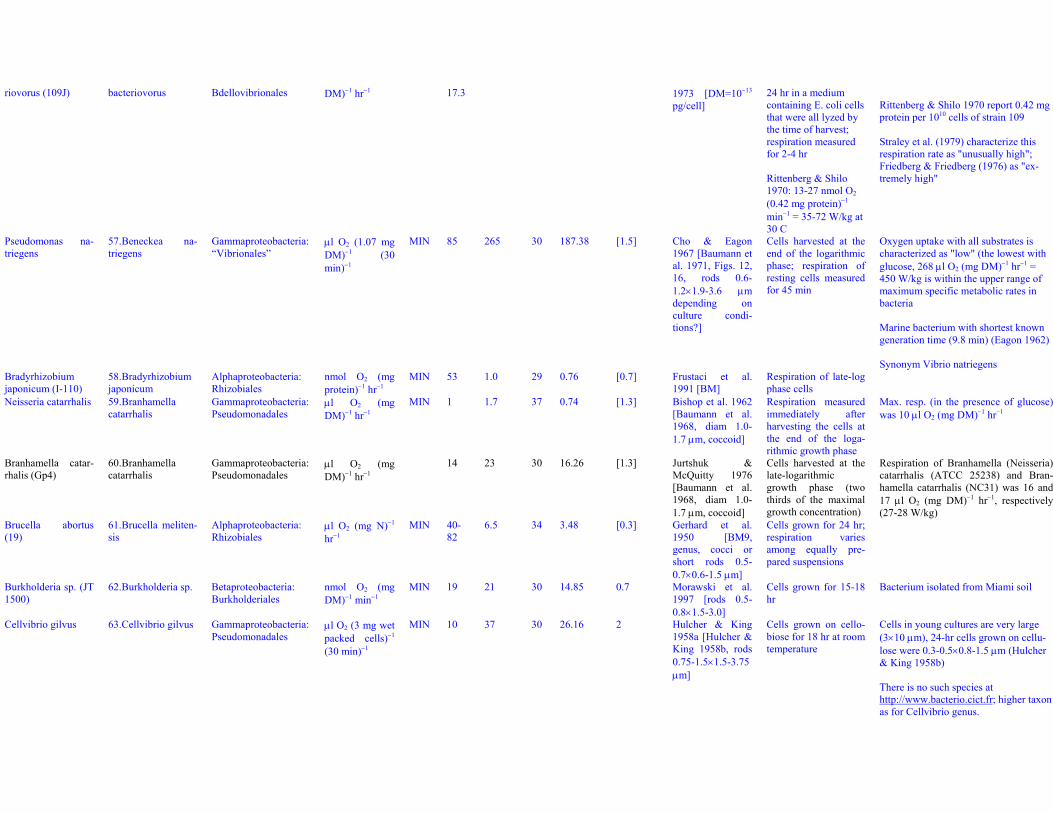
riovorus (109J) bacteriovorus Bdellovibrionales DM)−1 hr−1 17.3 1973 [DM=10−13
pg/cell]24 hr in a mediumcontaining E. coli cellsthat were all lyzed bythe time of harvest;respiration measuredfor 2-4 hr
Rittenberg & Shilo1970: 13-27 nmol O2
(0.42 mg protein)−1
min−1 = 35-72 W/kg at30 C
Rittenberg & Shilo 1970 report 0.42 mgprotein per 1010 cells of strain 109
Straley et al. (1979) characterize thisrespiration rate as "unusually high";Friedberg & Friedberg (1976) as "ex-tremely high"
Pseudomonas na-triegens
57. Beneckea na-triegens
Gammaproteobacteria:“Vibrionales”
μl O2 (1.07 mgDM)−1 (30min)−1
MIN 85 265 30 187.38 [1.5] Cho & Eagon1967 [Baumann etal. 1971, Figs. 12,16, rods 0.6-1.2×1.9-3.6 μmdepending onculture condi-tions?]
Cells harvested at theend of the logarithmicphase; respiration ofresting cells measuredfor 45 min
Oxygen uptake with all substrates ischaracterized as "low" (the lowest withglucose, 268 μl O2 (mg DM)−1 hr−1 =450 W/kg is within the upper range ofmaximum specific metabolic rates inbacteria
Marine bacterium with shortest knowngeneration time (9.8 min) (Eagon 1962)
Synonym Vibrio natriegensBradyrhizobiumjaponicum (I-110)
58. Bradyrhizobiumjaponicum
Alphaproteobacteria:Rhizobiales
nmol O2 (mgprotein)−1 hr−1
MIN 53 1.0 29 0.76 [0.7] Frustaci et al.1991 [BM]
Respiration of late-logphase cells
Neisseria catarrhalis 59. Branhamellacatarrhalis
Gammaproteobacteria:Pseudomonadales
μl O2 (mgDM)−1 hr−1
MIN 1 1.7 37 0.74 [1.3] Bishop et al. 1962[Baumann et al.1968, diam 1.0-1.7 μm, coccoid]
Respiration measuredimmediately afterharvesting the cells atthe end of the loga-rithmic growth phase
Max. resp. (in the presence of glucose)was 10 μl O2 (mg DM)−1 hr−1
Branhamella catar-rhalis (Gp4)
60. Branhamellacatarrhalis
Gammaproteobacteria:Pseudomonadales
μl O2 (mgDM)−1 hr−1
14 23 30 16.26 [1.3] Jurtshuk &McQuitty 1976[Baumann et al.1968, diam 1.0-1.7 μm, coccoid]
Cells harvested at thelate-logarithmicgrowth phase (twothirds of the maximalgrowth concentration)
Respiration of Branhamella (Neisseria)catarrhalis (ATCC 25238) and Bran-hamella catarrhalis (NC31) was 16 and17 μl O2 (mg DM)−1 hr−1, respectively(27-28 W/kg)
Brucella abortus(19)
61. Brucella meliten-sis
Alphaproteobacteria:Rhizobiales
μl O2 (mg N)−1
hr−1MIN 40-
826.5 34 3.48 [0.3] Gerhard et al.
1950 [BM9,genus, cocci orshort rods 0.5-0.7×0.6-1.5 μm]
Cells grown for 24 hr;respiration variesamong equally pre-pared suspensions
Burkholderia sp. (JT1500)
62. Burkholderia sp. Betaproteobacteria:Burkholderiales
nmol O2 (mgDM)−1 min−1
MIN 19 21 30 14.85 0.7 Morawski et al.1997 [rods 0.5-0.8×1.5-3.0]
Cells grown for 15-18hr
Bacterium isolated from Miami soil
Cellvibrio gilvus 63. Cellvibrio gilvus Gammaproteobacteria:Pseudomonadales
μl O2 (3 mg wetpacked cells)−1
(30 min)−1
MIN 10 37 30 26.16 2 Hulcher & King1958a [Hulcher &King 1958b, rods0.75-1.5×1.5-3.75μm]
Cells grown on cello-biose for 18 hr at roomtemperature
Cells in young cultures are very large(3×10 μm), 24-hr cells grown on cellu-lose were 0.3-0.5×0.8-1.5 μm (Hulcher& King 1958b)
There is no such species athttp://www.bacterio.cict.fr; higher taxonas for Cellvibrio genus.
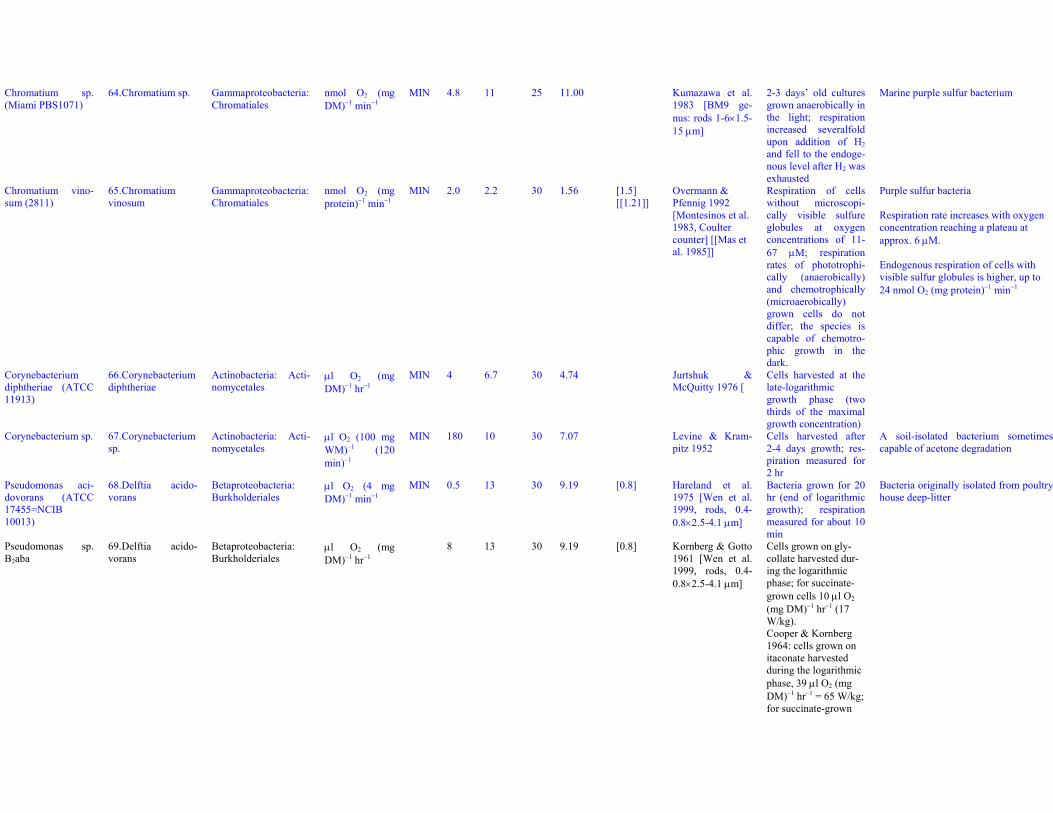
Chromatium sp.(Miami PBS1071)
64. Chromatium sp. Gammaproteobacteria:Chromatiales
nmol O2 (mgDM)−1 min−1
MIN 4.8 11 25 11.00 Kumazawa et al.1983 [BM9 ge-nus: rods 1-6×1.5-15 μm]
2-3 days’ old culturesgrown anaerobically inthe light; respirationincreased severalfoldupon addition of H2and fell to the endoge-nous level after H2 wasexhausted
Marine purple sulfur bacterium
Chromatium vino-sum (2811)
65. Chromatiumvinosum
Gammaproteobacteria:Chromatiales
nmol O2 (mgprotein)−1 min−1
MIN 2.0 2.2 30 1.56 [1.5][[1.21]]
Overmann &Pfennig 1992[Montesinos et al.1983, Coultercounter] [[Mas etal. 1985]]
Respiration of cellswithout microscopi-cally visible sulfureglobules at oxygenconcentrations of 11-67 μM; respirationrates of phototrophi-cally (anaerobically)and chemotrophically(microaerobically)grown cells do notdiffer; the species iscapable of chemotro-phic growth in thedark.
Purple sulfur bacteria
Respiration rate increases with oxygenconcentration reaching a plateau atapprox. 6 μM.
Endogenous respiration of cells withvisible sulfur globules is higher, up to24 nmol O2 (mg protein)−1 min−1
Corynebacteriumdiphtheriae (ATCC11913)
66. Corynebacteriumdiphtheriae
Actinobacteria: Acti-nomycetales
μl O2 (mgDM)−1 hr−1
MIN 4 6.7 30 4.74 Jurtshuk &McQuitty 1976 [
Cells harvested at thelate-logarithmicgrowth phase (twothirds of the maximalgrowth concentration)
Corynebacterium sp. 67. Corynebacteriumsp.
Actinobacteria: Acti-nomycetales
μl O2 (100 mgWM)−1 (120min)−1
MIN 180 10 30 7.07 Levine & Kram-pitz 1952
Cells harvested after2-4 days growth; res-piration measured for2 hr
A soil-isolated bacterium sometimescapable of acetone degradation
Pseudomonas aci-dovorans (ATCC17455=NCIB10013)
68. Delftia acido-vorans
Betaproteobacteria:Burkholderiales
μl O2 (4 mgDM)−1 min−1
MIN 0.5 13 30 9.19 [0.8] Hareland et al.1975 [Wen et al.1999, rods, 0.4-0.8×2.5-4.1 μm]
Bacteria grown for 20hr (end of logarithmicgrowth); respirationmeasured for about 10min
Bacteria originally isolated from poultryhouse deep-litter
Pseudomonas sp.B2aba
69. Delftia acido-vorans
Betaproteobacteria:Burkholderiales
μl O2 (mgDM)−1 hr−1
8 13 30 9.19 [0.8] Kornberg & Gotto1961 [Wen et al.1999, rods, 0.4-0.8×2.5-4.1 μm]
Cells grown on gly-collate harvested dur-ing the logarithmicphase; for succinate-grown cells 10 μl O2
(mg DM)−1 hr−1 (17W/kg).Cooper & Kornberg1964: cells grown onitaconate harvestedduring the logarithmicphase, 39 μl O2 (mgDM)−1 hr−1 = 65 W/kg;for succinate-grown
cells 40 μl O2 (mgDM)−1 hr−1
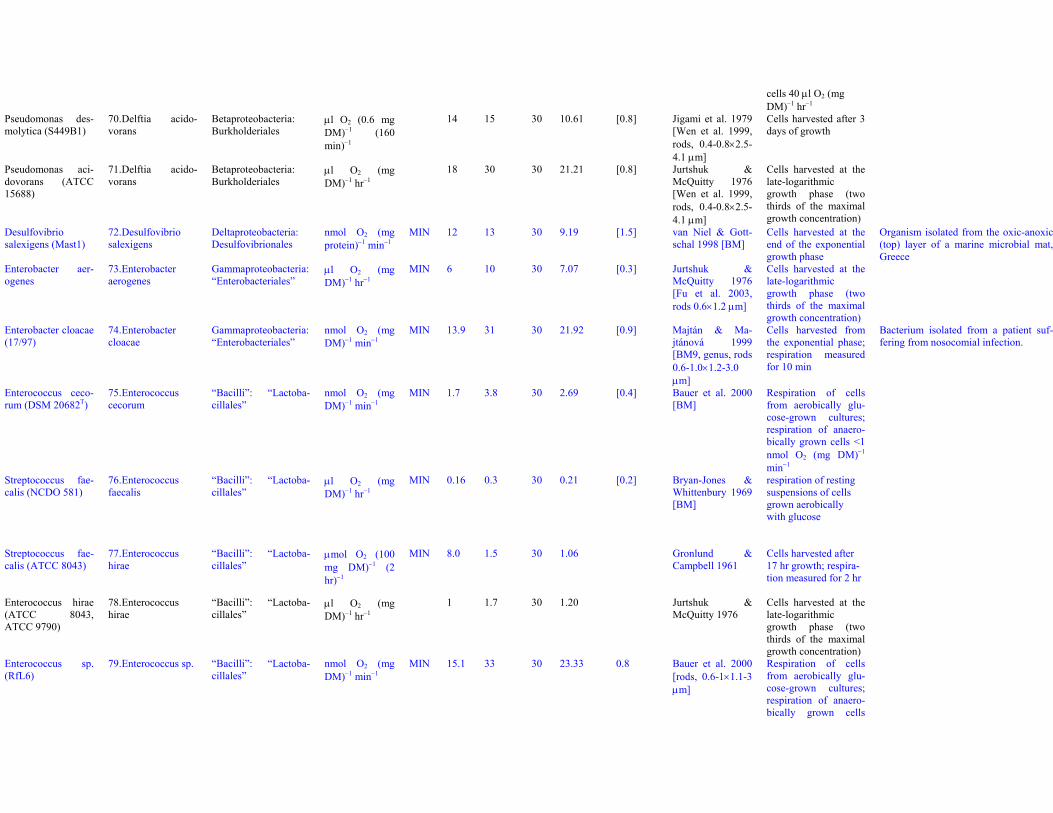
Pseudomonas des-molytica (S449B1)
70. Delftia acido-vorans
Betaproteobacteria:Burkholderiales
μl O2 (0.6 mgDM)−1 (160min)−1
14 15 30 10.61 [0.8] Jigami et al. 1979[Wen et al. 1999,rods, 0.4-0.8×2.5-4.1 μm]
Cells harvested after 3days of growth
Pseudomonas aci-dovorans (ATCC15688)
71. Delftia acido-vorans
Betaproteobacteria:Burkholderiales
μl O2 (mgDM)−1 hr−1
18 30 30 21.21 [0.8] Jurtshuk &McQuitty 1976[Wen et al. 1999,rods, 0.4-0.8×2.5-4.1 μm]
Cells harvested at thelate-logarithmicgrowth phase (twothirds of the maximalgrowth concentration)
Desulfovibriosalexigens (Mast1)
72. Desulfovibriosalexigens
Deltaproteobacteria:Desulfovibrionales
nmol O2 (mgprotein)−1 min−1
MIN 12 13 30 9.19 [1.5] van Niel & Gott-schal 1998 [BM]
Cells harvested at theend of the exponentialgrowth phase
Organism isolated from the oxic-anoxic(top) layer of a marine microbial mat,Greece
Enterobacter aer-ogenes
73. Enterobacteraerogenes
Gammaproteobacteria:“Enterobacteriales”
μl O2 (mgDM)−1 hr−1
MIN 6 10 30 7.07 [0.3] Jurtshuk &McQuitty 1976[Fu et al. 2003,rods 0.6×1.2 μm]
Cells harvested at thelate-logarithmicgrowth phase (twothirds of the maximalgrowth concentration)
Enterobacter cloacae(17/97)
74. Enterobactercloacae
Gammaproteobacteria:“Enterobacteriales”
nmol O2 (mgDM)−1 min−1
MIN 13.9 31 30 21.92 [0.9] Majtán & Ma-jtánová 1999[BM9, genus, rods0.6-1.0×1.2-3.0μm]
Cells harvested fromthe exponential phase;respiration measuredfor 10 min
Bacterium isolated from a patient suf-fering from nosocomial infection.
Enterococcus ceco-rum (DSM 20682T)
75. Enterococcuscecorum
“Bacilli”: “Lactoba-cillales”
nmol O2 (mgDM)−1 min−1
MIN 1.7 3.8 30 2.69 [0.4] Bauer et al. 2000[BM]
Respiration of cellsfrom aerobically glu-cose-grown cultures;respiration of anaero-bically grown cells <1nmol O2 (mg DM)−1
min−1
Streptococcus fae-calis (NCDO 581)
76. Enterococcusfaecalis
“Bacilli”: “Lactoba-cillales”
μl O2 (mgDM)−1 hr−1
MIN 0.16 0.3 30 0.21 [0.2] Bryan-Jones &Whittenbury 1969[BM]
respiration of restingsuspensions of cellsgrown aerobicallywith glucose
Streptococcus fae-calis (ATCC 8043)
77. Enterococcushirae
“Bacilli”: “Lactoba-cillales”
μmol O2 (100mg DM)−1 (2hr)−1
MIN 8.0 1.5 30 1.06 Gronlund &Campbell 1961
Cells harvested after17 hr growth; respira-tion measured for 2 hr
Enterococcus hirae(ATCC 8043,ATCC 9790)
78. Enterococcushirae
“Bacilli”: “Lactoba-cillales”
μl O2 (mgDM)−1 hr−1
1 1.7 30 1.20 Jurtshuk &McQuitty 1976
Cells harvested at thelate-logarithmicgrowth phase (twothirds of the maximalgrowth concentration)
Enterococcus sp.(RfL6)
79. Enterococcus sp. “Bacilli”: “Lactoba-cillales”
nmol O2 (mgDM)−1 min−1
MIN 15.1 33 30 23.33 0.8 Bauer et al. 2000[rods, 0.6-1×1.1-3μm]
Respiration of cellsfrom aerobically glu-cose-grown cultures;respiration of anaero-bically grown cells
15.1 nmol O2 (mgDM)−1 min−1
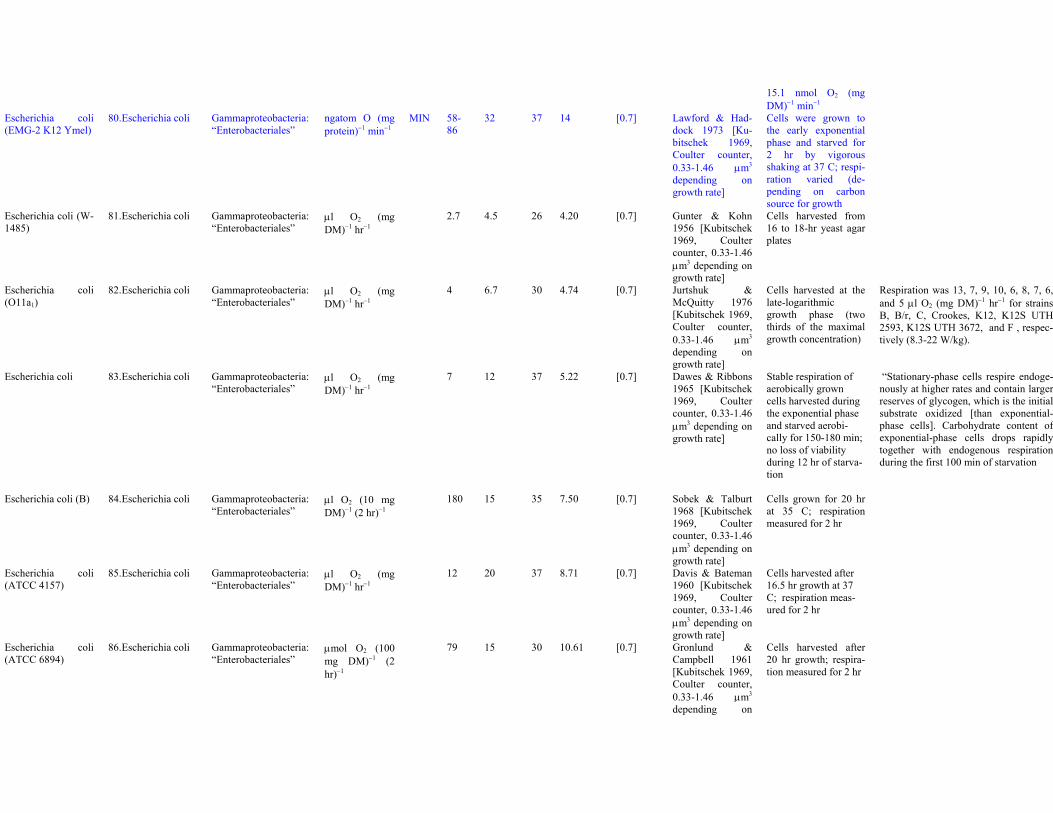
Escherichia coli(EMG-2 K12 Ymel)
80. Escherichia coli Gammaproteobacteria:“Enterobacteriales”
ngatom O (mgprotein)−1 min−1
MIN 58-86
32 37 14 [0.7] Lawford & Had-dock 1973 [Ku-bitschek 1969,Coulter counter,0.33-1.46 μm3
depending ongrowth rate]
Cells were grown tothe early exponentialphase and starved for2 hr by vigorousshaking at 37 C; respi-ration varied (de-pending on carbonsource for growth
Escherichia coli (W-1485)
81. Escherichia coli Gammaproteobacteria:“Enterobacteriales”
μl O2 (mgDM)−1 hr−1
2.7 4.5 26 4.20 [0.7] Gunter & Kohn1956 [Kubitschek1969, Coultercounter, 0.33-1.46μm3 depending ongrowth rate]
Cells harvested from16 to 18-hr yeast agarplates
Escherichia coli(O11a1)
82. Escherichia coli Gammaproteobacteria:“Enterobacteriales”
μl O2 (mgDM)−1 hr−1
4 6.7 30 4.74 [0.7] Jurtshuk &McQuitty 1976[Kubitschek 1969,Coulter counter,0.33-1.46 μm3
depending ongrowth rate]
Cells harvested at thelate-logarithmicgrowth phase (twothirds of the maximalgrowth concentration)
Respiration was 13, 7, 9, 10, 6, 8, 7, 6,and 5 μl O2 (mg DM)−1 hr−1 for strainsB, B/r, C, Crookes, K12, K12S UTH2593, K12S UTH 3672, and F , respec-tively (8.3-22 W/kg).
Escherichia coli 83. Escherichia coli Gammaproteobacteria:“Enterobacteriales”
μl O2 (mgDM)−1 hr−1
7 12 37 5.22 [0.7] Dawes & Ribbons1965 [Kubitschek1969, Coultercounter, 0.33-1.46μm3 depending ongrowth rate]
Stable respiration ofaerobically growncells harvested duringthe exponential phaseand starved aerobi-cally for 150-180 min;no loss of viabilityduring 12 hr of starva-tion
“Stationary-phase cells respire endoge-nously at higher rates and contain largerreserves of glycogen, which is the initialsubstrate oxidized [than exponential-phase cells]. Carbohydrate content ofexponential-phase cells drops rapidlytogether with endogenous respirationduring the first 100 min of starvation
Escherichia coli (B) 84. Escherichia coli Gammaproteobacteria:“Enterobacteriales”
μl O2 (10 mgDM)−1 (2 hr)−1
180 15 35 7.50 [0.7] Sobek & Talburt1968 [Kubitschek1969, Coultercounter, 0.33-1.46μm3 depending ongrowth rate]
Cells grown for 20 hrat 35 C; respirationmeasured for 2 hr
Escherichia coli(ATCC 4157)
85. Escherichia coli Gammaproteobacteria:“Enterobacteriales”
μl O2 (mgDM)−1 hr−1
12 20 37 8.71 [0.7] Davis & Bateman1960 [Kubitschek1969, Coultercounter, 0.33-1.46μm3 depending ongrowth rate]
Cells harvested after16.5 hr growth at 37C; respiration meas-ured for 2 hr
Escherichia coli(ATCC 6894)
86. Escherichia coli Gammaproteobacteria:“Enterobacteriales”
μmol O2 (100mg DM)−1 (2hr)−1
79 15 30 10.61 [0.7] Gronlund &Campbell 1961[Kubitschek 1969,Coulter counter,0.33-1.46 μm3
depending on
Cells harvested after20 hr growth; respira-tion measured for 2 hr
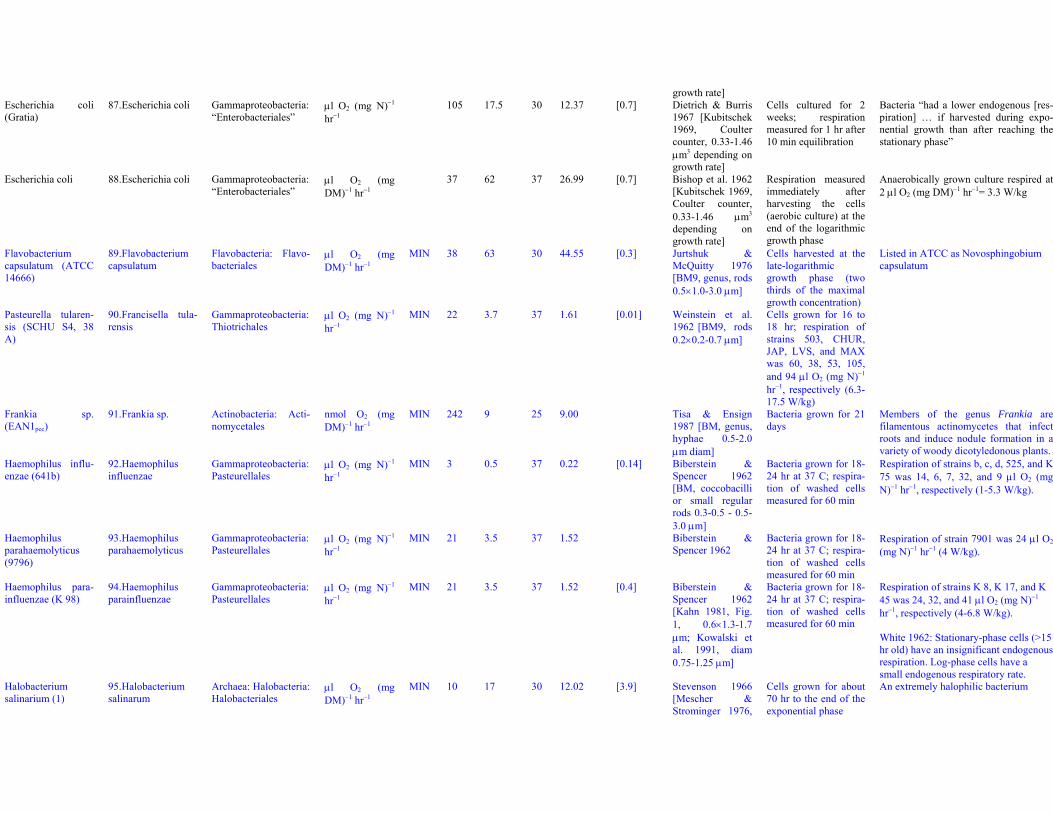
growth rate]Escherichia coli(Gratia)
87. Escherichia coli Gammaproteobacteria:“Enterobacteriales”
μl O2 (mg N)−1
hr−1105 17.5 30 12.37 [0.7] Dietrich & Burris
1967 [Kubitschek1969, Coultercounter, 0.33-1.46μm3 depending ongrowth rate]
Cells cultured for 2weeks; respirationmeasured for 1 hr after10 min equilibration
Bacteria “had a lower endogenous [res-piration] … if harvested during expo-nential growth than after reaching thestationary phase”
Escherichia coli 88. Escherichia coli Gammaproteobacteria:“Enterobacteriales”
μl O2 (mgDM)−1 hr−1
37 62 37 26.99 [0.7] Bishop et al. 1962[Kubitschek 1969,Coulter counter,0.33-1.46 μm3
depending ongrowth rate]
Respiration measuredimmediately afterharvesting the cells(aerobic culture) at theend of the logarithmicgrowth phase
Anaerobically grown culture respired at2 μl O2 (mg DM)−1 hr−1= 3.3 W/kg
Flavobacteriumcapsulatum (ATCC14666)
89. Flavobacteriumcapsulatum
Flavobacteria: Flavo-bacteriales
μl O2 (mgDM)−1 hr−1
MIN 38 63 30 44.55 [0.3] Jurtshuk &McQuitty 1976[BM9, genus, rods0.5×1.0-3.0 μm]
Cells harvested at thelate-logarithmicgrowth phase (twothirds of the maximalgrowth concentration)
Listed in ATCC as Novosphingobiumcapsulatum
Pasteurella tularen-sis (SCHU S4, 38A)
90. Francisella tula-rensis
Gammaproteobacteria:Thiotrichales
μl O2 (mg N)−1
hr−1MIN 22 3.7 37 1.61 [0.01] Weinstein et al.
1962 [BM9, rods0.2×0.2-0.7 μm]
Cells grown for 16 to18 hr; respiration ofstrains 503, CHUR,JAP, LVS, and MAXwas 60, 38, 53, 105,and 94 μl O2 (mg N)−1
hr−1, respectively (6.3-17.5 W/kg)
Frankia sp.(EAN1pec)
91. Frankia sp. Actinobacteria: Acti-nomycetales
nmol O2 (mgDM)−1 hr−1
MIN 242 9 25 9.00 Tisa & Ensign1987 [BM, genus,hyphae 0.5-2.0μm diam]
Bacteria grown for 21days
Members of the genus Frankia arefilamentous actinomycetes that infectroots and induce nodule formation in avariety of woody dicotyledonous plants.
Haemophilus influ-enzae (641b)
92. Haemophilusinfluenzae
Gammaproteobacteria:Pasteurellales
μl O2 (mg N)−1
hr−1MIN 3 0.5 37 0.22 [0.14] Biberstein &
Spencer 1962[BM, coccobacillior small regularrods 0.3-0.5 - 0.5-3.0 μm]
Bacteria grown for 18-24 hr at 37 C; respira-tion of washed cellsmeasured for 60 min
Respiration of strains b, c, d, 525, and K75 was 14, 6, 7, 32, and 9 μl O2 (mgN)−1 hr−1, respectively (1-5.3 W/kg).
Haemophilusparahaemolyticus(9796)
93. Haemophilusparahaemolyticus
Gammaproteobacteria:Pasteurellales
μl O2 (mg N)−1
hr−1MIN 21 3.5 37 1.52 Biberstein &
Spencer 1962Bacteria grown for 18-24 hr at 37 C; respira-tion of washed cellsmeasured for 60 min
Respiration of strain 7901 was 24 μl O2
(mg N)−1 hr−1 (4 W/kg).
Haemophilus para-influenzae (K 98)
94. Haemophilusparainfluenzae
Gammaproteobacteria:Pasteurellales
μl O2 (mg N)−1
hr−1MIN 21 3.5 37 1.52 [0.4] Biberstein &
Spencer 1962[Kahn 1981, Fig.1, 0.6×1.3-1.7μm; Kowalski etal. 1991, diam0.75-1.25 μm]
Bacteria grown for 18-24 hr at 37 C; respira-tion of washed cellsmeasured for 60 min
Respiration of strains K 8, K 17, and K45 was 24, 32, and 41 μl O2 (mg N)−1
hr−1, respectively (4-6.8 W/kg).
White 1962: Stationary-phase cells (>15hr old) have an insignificant endogenousrespiration. Log-phase cells have asmall endogenous respiratory rate.
Halobacteriumsalinarium (1)
95. Halobacteriumsalinarum
Archaea: Halobacteria:Halobacteriales
μl O2 (mgDM)−1 hr−1
MIN 10 17 30 12.02 [3.9] Stevenson 1966[Mescher &Strominger 1976,
Cells grown for about70 hr to the end of theexponential phase
An extremely halophilic bacterium
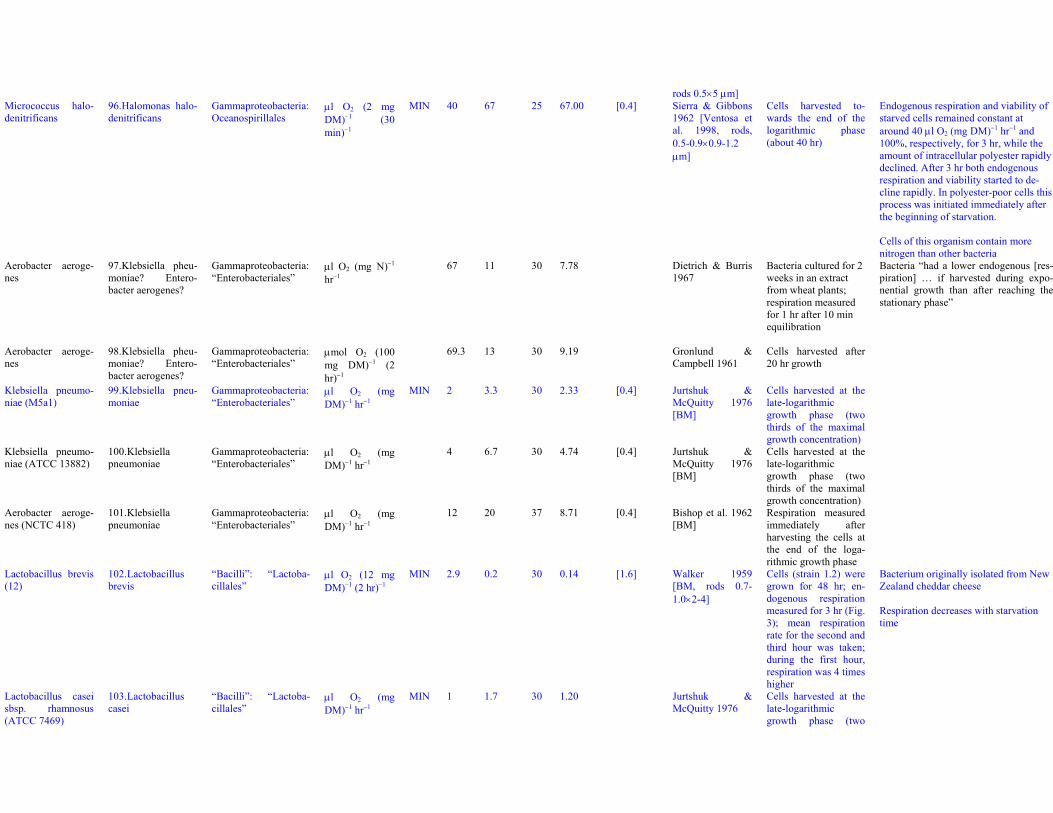
rods 0.5×5 μm]Micrococcus halo-denitrificans
96. Halomonas halo-denitrificans
Gammaproteobacteria:Oceanospirillales
μl O2 (2 mgDM)−1 (30min)−1
MIN 40 67 25 67.00 [0.4] Sierra & Gibbons1962 [Ventosa etal. 1998, rods,0.5-0.9×0.9-1.2μm]
Cells harvested to-wards the end of thelogarithmic phase(about 40 hr)
Endogenous respiration and viability ofstarved cells remained constant ataround 40 μl O2 (mg DM)−1 hr−1 and100%, respectively, for 3 hr, while theamount of intracellular polyester rapidlydeclined. After 3 hr both endogenousrespiration and viability started to de-cline rapidly. In polyester-poor cells thisprocess was initiated immediately afterthe beginning of starvation.
Cells of this organism contain morenitrogen than other bacteria
Aerobacter aeroge-nes
97. Klebsiella pheu-moniae? Entero-bacter aerogenes?
Gammaproteobacteria:“Enterobacteriales”
μl O2 (mg N)−1
hr−167 11 30 7.78 Dietrich & Burris
1967Bacteria cultured for 2weeks in an extractfrom wheat plants;respiration measuredfor 1 hr after 10 minequilibration
Bacteria “had a lower endogenous [res-piration] … if harvested during expo-nential growth than after reaching thestationary phase”
Aerobacter aeroge-nes
98. Klebsiella pheu-moniae? Entero-bacter aerogenes?
Gammaproteobacteria:“Enterobacteriales”
μmol O2 (100mg DM)−1 (2hr)−1
69.3 13 30 9.19 Gronlund &Campbell 1961
Cells harvested after20 hr growth
Klebsiella pneumo-niae (M5a1)
99. Klebsiella pneu-moniae
Gammaproteobacteria:“Enterobacteriales”
μl O2 (mgDM)−1 hr−1
MIN 2 3.3 30 2.33 [0.4] Jurtshuk &McQuitty 1976[BM]
Cells harvested at thelate-logarithmicgrowth phase (twothirds of the maximalgrowth concentration)
Klebsiella pneumo-niae (ATCC 13882)
100. Klebsiellapneumoniae
Gammaproteobacteria:“Enterobacteriales”
μl O2 (mgDM)−1 hr−1
4 6.7 30 4.74 [0.4] Jurtshuk &McQuitty 1976[BM]
Cells harvested at thelate-logarithmicgrowth phase (twothirds of the maximalgrowth concentration)
Aerobacter aeroge-nes (NCTC 418)
101. Klebsiellapneumoniae
Gammaproteobacteria:“Enterobacteriales”
μl O2 (mgDM)−1 hr−1
12 20 37 8.71 [0.4] Bishop et al. 1962[BM]
Respiration measuredimmediately afterharvesting the cells atthe end of the loga-rithmic growth phase
Lactobacillus brevis(12)
102. Lactobacillusbrevis
“Bacilli”: “Lactoba-cillales”
μl O2 (12 mgDM)−1 (2 hr)−1
MIN 2.9 0.2 30 0.14 [1.6] Walker 1959[BM, rods 0.7-1.0×2-4]
Cells (strain 1.2) weregrown for 48 hr; en-dogenous respirationmeasured for 3 hr (Fig.3); mean respirationrate for the second andthird hour was taken;during the first hour,respiration was 4 timeshigher
Bacterium originally isolated from NewZealand cheddar cheese
Respiration decreases with starvationtime
Lactobacillus caseisbsp. rhamnosus(ATCC 7469)
103. Lactobacilluscasei
“Bacilli”: “Lactoba-cillales”
μl O2 (mgDM)−1 hr−1
MIN 1 1.7 30 1.20 Jurtshuk &McQuitty 1976
Cells harvested at thelate-logarithmicgrowth phase (two
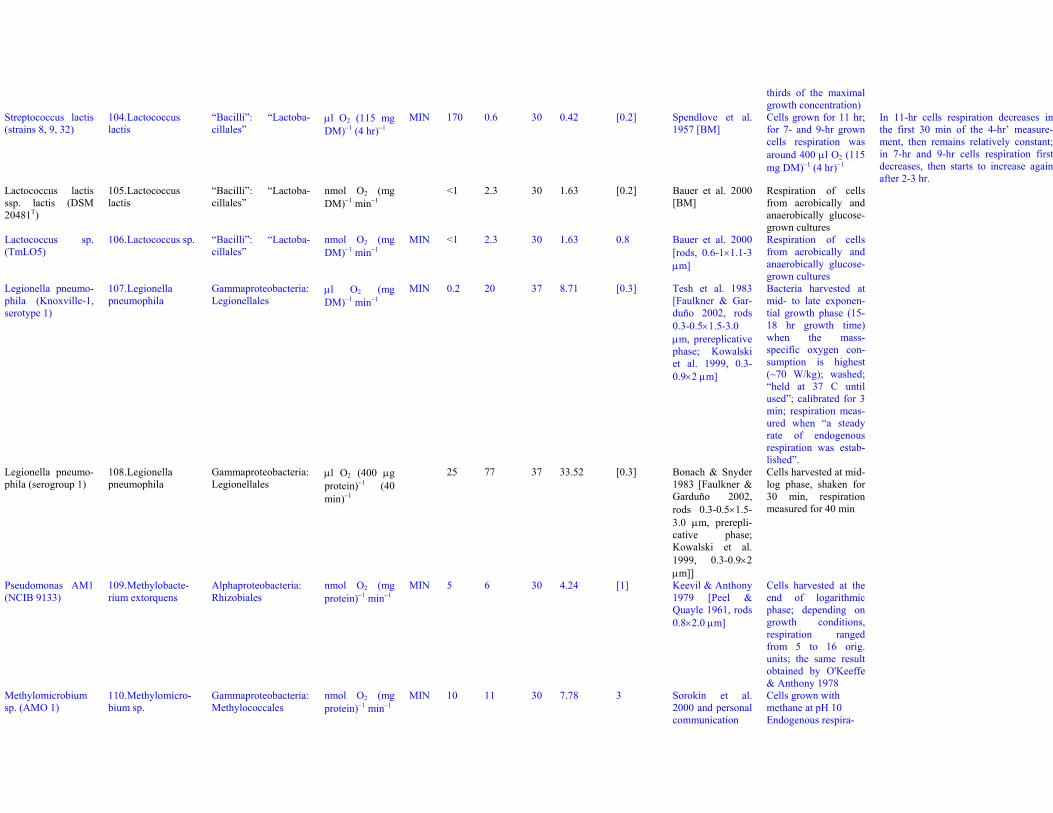
thirds of the maximalgrowth concentration)
Streptococcus lactis(strains 8, 9, 32)
104. Lactococcuslactis
“Bacilli”: “Lactoba-cillales”
μl O2 (115 mgDM)−1 (4 hr)−1
MIN 170 0.6 30 0.42 [0.2] Spendlove et al.1957 [BM]
Cells grown for 11 hr;for 7- and 9-hr growncells respiration wasaround 400 μl O2 (115mg DM)−1 (4 hr)−1
In 11-hr cells respiration decreases inthe first 30 min of the 4-hr’ measure-ment, then remains relatively constant;in 7-hr and 9-hr cells respiration firstdecreases, then starts to increase againafter 2-3 hr.
Lactococcus lactisssp. lactis (DSM20481T)
105. Lactococcuslactis
“Bacilli”: “Lactoba-cillales”
nmol O2 (mgDM)−1 min−1
<1 2.3 30 1.63 [0.2] Bauer et al. 2000[BM]
Respiration of cellsfrom aerobically andanaerobically glucose-grown cultures
Lactococcus sp.(TmLO5)
106. Lactococcus sp. “Bacilli”: “Lactoba-cillales”
nmol O2 (mgDM)−1 min−1
MIN <1 2.3 30 1.63 0.8 Bauer et al. 2000[rods, 0.6-1×1.1-3μm]
Respiration of cellsfrom aerobically andanaerobically glucose-grown cultures
Legionella pneumo-phila (Knoxville-1,serotype 1)
107. Legionellapneumophila
Gammaproteobacteria:Legionellales
μl O2 (mgDM)−1 min−1
MIN 0.2 20 37 8.71 [0.3] Tesh et al. 1983[Faulkner & Gar-duño 2002, rods0.3-0.5×1.5-3.0μm, prereplicativephase; Kowalskiet al. 1999, 0.3-0.9×2 μm]
Bacteria harvested atmid- to late exponen-tial growth phase (15-18 hr growth time)when the mass-specific oxygen con-sumption is highest(~70 W/kg); washed;“held at 37 C untilused”; calibrated for 3min; respiration meas-ured when “a steadyrate of endogenousrespiration was estab-lished”.
Legionella pneumo-phila (serogroup 1)
108. Legionellapneumophila
Gammaproteobacteria:Legionellales
μl O2 (400 μgprotein)−1 (40min)−1
25 77 37 33.52 [0.3] Bonach & Snyder1983 [Faulkner &Garduño 2002,rods 0.3-0.5×1.5-3.0 μm, prerepli-cative phase;Kowalski et al.1999, 0.3-0.9×2μm]]
Cells harvested at mid-log phase, shaken for30 min, respirationmeasured for 40 min
Pseudomonas AM1(NCIB 9133)
109. Methylobacte-rium extorquens
Alphaproteobacteria:Rhizobiales
nmol O2 (mgprotein)−1 min−1
MIN 5 6 30 4.24 [1] Keevil & Anthony1979 [Peel &Quayle 1961, rods0.8×2.0 μm]
Cells harvested at theend of logarithmicphase; depending ongrowth conditions,respiration rangedfrom 5 to 16 orig.units; the same resultobtained by O'Keeffe& Anthony 1978
Methylomicrobiumsp. (AMO 1)
110. Methylomicro-bium sp.
Gammaproteobacteria:Methylococcales
nmol O2 (mgprotein)−1 min−1
MIN 10 11 30 7.78 3 Sorokin et al.2000 and personalcommunication
Cells grown withmethane at pH 10Endogenous respira-
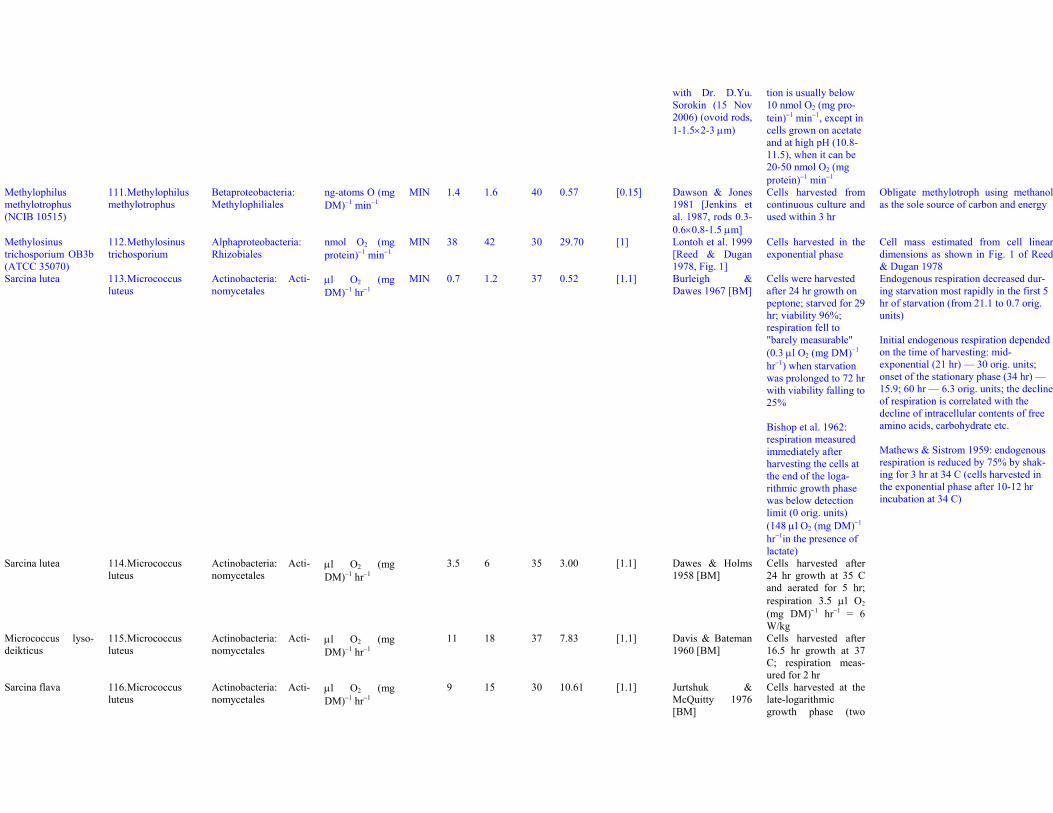
with Dr. D.Yu.Sorokin (15 Nov2006) (ovoid rods,1-1.5×2-3 μm)
tion is usually below10 nmol O2 (mg pro-tein)−1 min−1, except incells grown on acetateand at high pH (10.8-11.5), when it can be20-50 nmol O2 (mgprotein)−1 min−1
Methylophilusmethylotrophus(NCIB 10515)
111. Methylophilusmethylotrophus
Betaproteobacteria:Methylophiliales
ng-atoms O (mgDM)−1 min−1
MIN 1.4 1.6 40 0.57 [0.15] Dawson & Jones1981 [Jenkins etal. 1987, rods 0.3-0.6×0.8-1.5 μm]
Cells harvested fromcontinuous culture andused within 3 hr
Obligate methylotroph using methanolas the sole source of carbon and energy
Methylosinustrichosporium OB3b(ATCC 35070)
112. Methylosinustrichosporium
Alphaproteobacteria:Rhizobiales
nmol O2 (mgprotein)−1 min−1
MIN 38 42 30 29.70 [1] Lontoh et al. 1999[Reed & Dugan1978, Fig. 1]
Cells harvested in theexponential phase
Cell mass estimated from cell lineardimensions as shown in Fig. 1 of Reed& Dugan 1978
Sarcina lutea 113. Micrococcusluteus
Actinobacteria: Acti-nomycetales
μl O2 (mgDM)−1 hr−1
MIN 0.7 1.2 37 0.52 [1.1] Burleigh &Dawes 1967 [BM]
Cells were harvestedafter 24 hr growth onpeptone; starved for 29hr; viability 96%;respiration fell to"barely measurable"(0.3 μl O2 (mg DM)−1
hr−1) when starvationwas prolonged to 72 hrwith viability falling to25%
Bishop et al. 1962:respiration measuredimmediately afterharvesting the cells atthe end of the loga-rithmic growth phasewas below detectionlimit (0 orig. units)(148 μl O2 (mg DM)−1
hr−1in the presence oflactate)
Endogenous respiration decreased dur-ing starvation most rapidly in the first 5hr of starvation (from 21.1 to 0.7 orig.units)
Initial endogenous respiration dependedon the time of harvesting: mid-exponential (21 hr) — 30 orig. units;onset of the stationary phase (34 hr) —15.9; 60 hr — 6.3 orig. units; the declineof respiration is correlated with thedecline of intracellular contents of freeamino acids, carbohydrate etc.
Mathews & Sistrom 1959: endogenousrespiration is reduced by 75% by shak-ing for 3 hr at 34 C (cells harvested inthe exponential phase after 10-12 hrincubation at 34 C)
Sarcina lutea 114. Micrococcusluteus
Actinobacteria: Acti-nomycetales
μl O2 (mgDM)−1 hr−1
3.5 6 35 3.00 [1.1] Dawes & Holms1958 [BM]
Cells harvested after24 hr growth at 35 Cand aerated for 5 hr;respiration 3.5 μl O2
(mg DM)−1 hr−1 = 6W/kg
Micrococcus lyso-deikticus
115. Micrococcusluteus
Actinobacteria: Acti-nomycetales
μl O2 (mgDM)−1 hr−1
11 18 37 7.83 [1.1] Davis & Bateman1960 [BM]
Cells harvested after16.5 hr growth at 37C; respiration meas-ured for 2 hr
Sarcina flava 116. Micrococcusluteus
Actinobacteria: Acti-nomycetales
μl O2 (mgDM)−1 hr−1
9 15 30 10.61 [1.1] Jurtshuk &McQuitty 1976[BM]
Cells harvested at thelate-logarithmicgrowth phase (two
thirds of the maximalgrowth concentration);respiration was 16, 9and 30 μl O2 (mgDM)−1 hr−1 for Micro-coccus (Sarcina) lu-teus, M. (S. flava)luteus and M. (lyso-deikticus) luteusATCC 4698, respec-tively (27, 15 and 50W/kg)
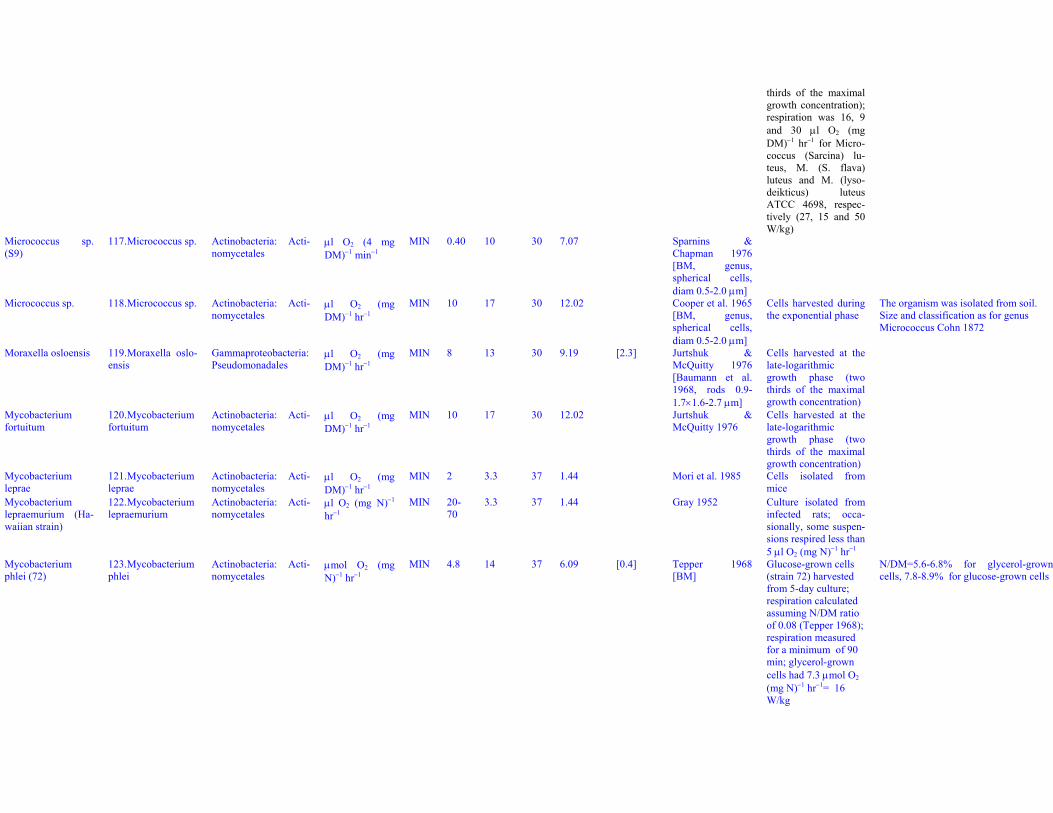
Micrococcus sp.(S9)
117. Micrococcus sp. Actinobacteria: Acti-nomycetales
μl O2 (4 mgDM)−1 min−1
MIN 0.40 10 30 7.07 Sparnins &Chapman 1976[BM, genus,spherical cells,diam 0.5-2.0 μm]
Micrococcus sp. 118. Micrococcus sp. Actinobacteria: Acti-nomycetales
μl O2 (mgDM)−1 hr−1
MIN 10 17 30 12.02 Cooper et al. 1965[BM, genus,spherical cells,diam 0.5-2.0 μm]
Cells harvested duringthe exponential phase
The organism was isolated from soil.Size and classification as for genusMicrococcus Cohn 1872
Moraxella osloensis 119. Moraxella oslo-ensis
Gammaproteobacteria:Pseudomonadales
μl O2 (mgDM)−1 hr−1
MIN 8 13 30 9.19 [2.3] Jurtshuk &McQuitty 1976[Baumann et al.1968, rods 0.9-1.7×1.6-2.7 μm]
Cells harvested at thelate-logarithmicgrowth phase (twothirds of the maximalgrowth concentration)
Mycobacteriumfortuitum
120. Mycobacteriumfortuitum
Actinobacteria: Acti-nomycetales
μl O2 (mgDM)−1 hr−1
MIN 10 17 30 12.02 Jurtshuk &McQuitty 1976
Cells harvested at thelate-logarithmicgrowth phase (twothirds of the maximalgrowth concentration)
Mycobacteriumleprae
121. Mycobacteriumleprae
Actinobacteria: Acti-nomycetales
μl O2 (mgDM)−1 hr−1
MIN 2 3.3 37 1.44 Mori et al. 1985 Cells isolated frommice
Mycobacteriumlepraemurium (Ha-waiian strain)
122. Mycobacteriumlepraemurium
Actinobacteria: Acti-nomycetales
μl O2 (mg N)−1
hr−1MIN 20-
703.3 37 1.44 Gray 1952 Culture isolated from
infected rats; occa-sionally, some suspen-sions respired less than5 μl O2 (mg N)−1 hr−1
Mycobacteriumphlei (72)
123. Mycobacteriumphlei
Actinobacteria: Acti-nomycetales
μmol O2 (mgN)−1 hr−1
MIN 4.8 14 37 6.09 [0.4] Tepper 1968[BM]
Glucose-grown cells(strain 72) harvestedfrom 5-day culture;respiration calculatedassuming N/DM ratioof 0.08 (Tepper 1968);respiration measuredfor a minimum of 90min; glycerol-growncells had 7.3 μmol O2
(mg N)−1 hr−1= 16W/kg
N/DM=5.6-6.8% for glycerol-growncells, 7.8-8.9% for glucose-grown cells
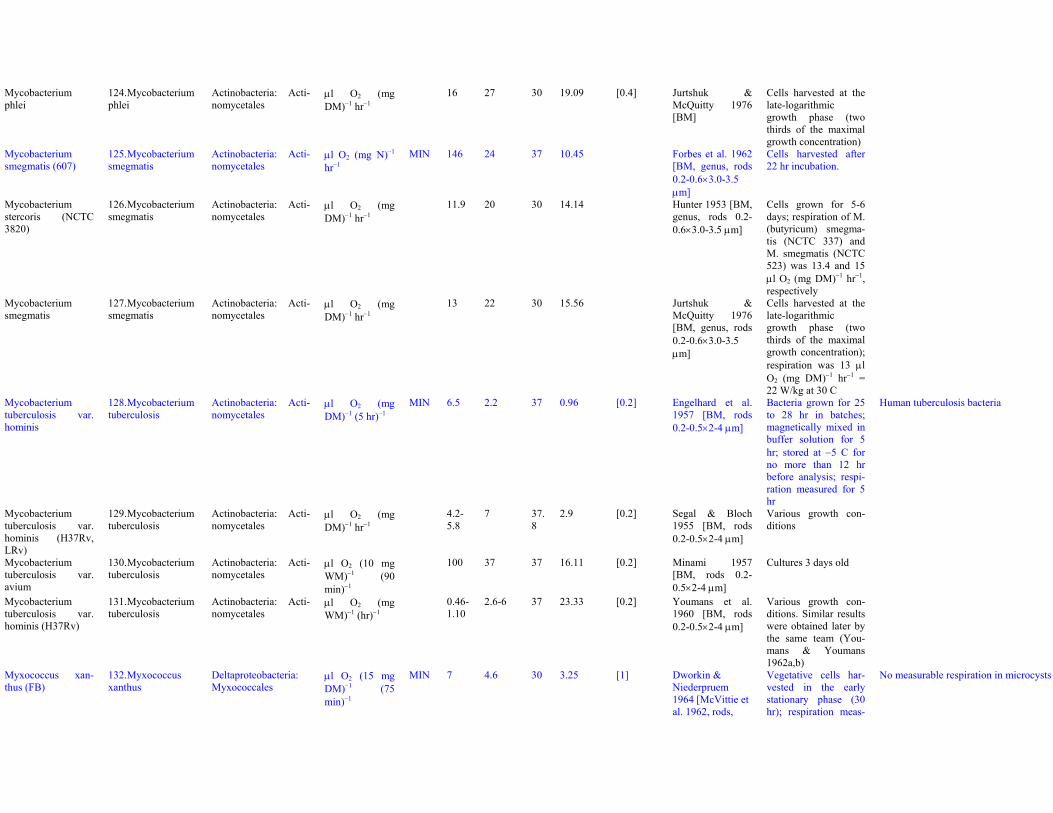
Mycobacteriumphlei
124. Mycobacteriumphlei
Actinobacteria: Acti-nomycetales
μl O2 (mgDM)−1 hr−1
16 27 30 19.09 [0.4] Jurtshuk &McQuitty 1976[BM]
Cells harvested at thelate-logarithmicgrowth phase (twothirds of the maximalgrowth concentration)
Mycobacteriumsmegmatis (607)
125. Mycobacteriumsmegmatis
Actinobacteria: Acti-nomycetales
μl O2 (mg N)−1
hr−1MIN 146 24 37 10.45 Forbes et al. 1962
[BM, genus, rods0.2-0.6×3.0-3.5μm]
Cells harvested after22 hr incubation.
Mycobacteriumstercoris (NCTC3820)
126. Mycobacteriumsmegmatis
Actinobacteria: Acti-nomycetales
μl O2 (mgDM)−1 hr−1
11.9 20 30 14.14 Hunter 1953 [BM,genus, rods 0.2-0.6×3.0-3.5 μm]
Cells grown for 5-6days; respiration of M.(butyricum) smegma-tis (NCTC 337) andM. smegmatis (NCTC523) was 13.4 and 15μl O2 (mg DM)−1 hr−1,respectively
Mycobacteriumsmegmatis
127. Mycobacteriumsmegmatis
Actinobacteria: Acti-nomycetales
μl O2 (mgDM)−1 hr−1
13 22 30 15.56 Jurtshuk &McQuitty 1976[BM, genus, rods0.2-0.6×3.0-3.5μm]
Cells harvested at thelate-logarithmicgrowth phase (twothirds of the maximalgrowth concentration);respiration was 13 μlO2 (mg DM)−1 hr−1 =22 W/kg at 30 C
Mycobacteriumtuberculosis var.hominis
128. Mycobacteriumtuberculosis
Actinobacteria: Acti-nomycetales
μl O2 (mgDM)−1 (5 hr)−1
MIN 6.5 2.2 37 0.96 [0.2] Engelhard et al.1957 [BM, rods0.2-0.5×2-4 μm]
Bacteria grown for 25to 28 hr in batches;magnetically mixed inbuffer solution for 5hr; stored at −5 C forno more than 12 hrbefore analysis; respi-ration measured for 5hr
Human tuberculosis bacteria
Mycobacteriumtuberculosis var.hominis (H37Rv,LRv)
129. Mycobacteriumtuberculosis
Actinobacteria: Acti-nomycetales
μl O2 (mgDM)−1 hr−1
4.2-5.8
7 37.8
2.9 [0.2] Segal & Bloch1955 [BM, rods0.2-0.5×2-4 μm]
Various growth con-ditions
Mycobacteriumtuberculosis var.avium
130. Mycobacteriumtuberculosis
Actinobacteria: Acti-nomycetales
μl O2 (10 mgWM)−1 (90min)−1
100 37 37 16.11 [0.2] Minami 1957[BM, rods 0.2-0.5×2-4 μm]
Cultures 3 days old
Mycobacteriumtuberculosis var.hominis (H37Rv)
131. Mycobacteriumtuberculosis
Actinobacteria: Acti-nomycetales
μl O2 (mgWM)−1 (hr)−1
0.46-1.10
2.6-6 37 23.33 [0.2] Youmans et al.1960 [BM, rods0.2-0.5×2-4 μm]
Various growth con-ditions. Similar resultswere obtained later bythe same team (You-mans & Youmans1962a,b)
Myxococcus xan-thus (FB)
132. Myxococcusxanthus
Deltaproteobacteria:Myxococcales
μl O2 (15 mgDM)−1 (75min)−1
MIN 7 4.6 30 3.25 [1] Dworkin &Niederpruem1964 [McVittie etal. 1962, rods,
Vegetative cells har-vested in the earlystationary phase (30hr); respiration meas-
No measurable respiration in microcysts
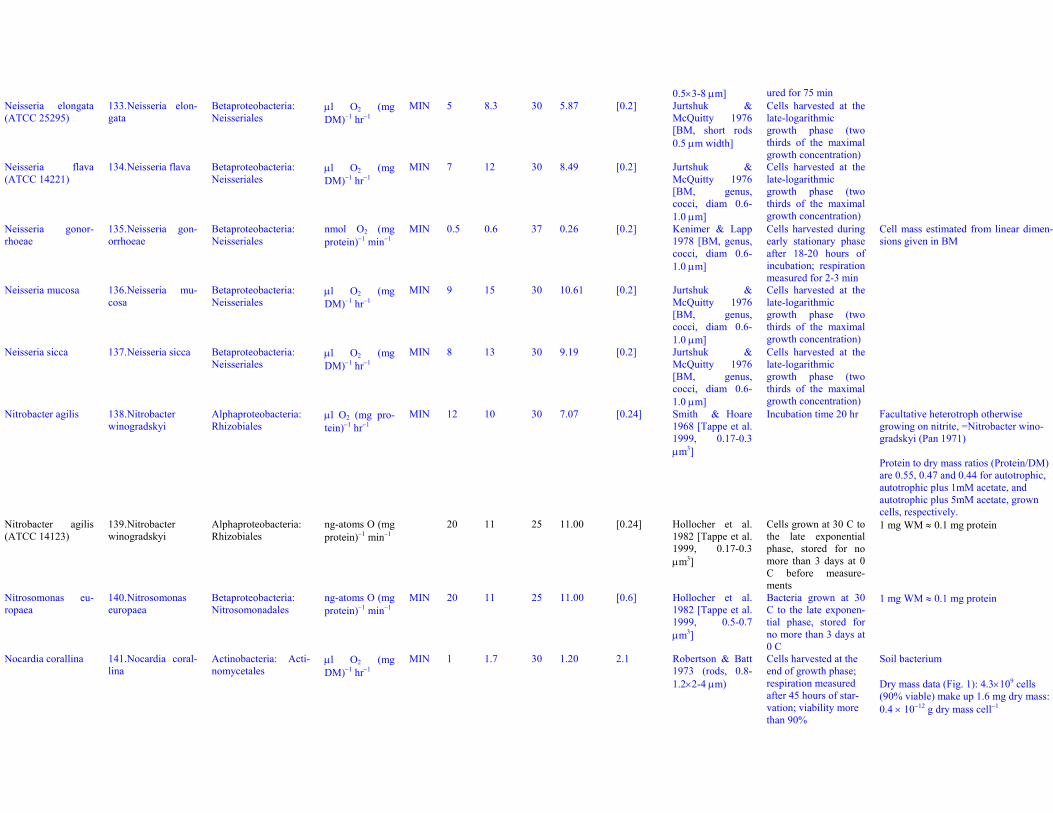
0.5×3-8 μm] ured for 75 minNeisseria elongata(ATCC 25295)
133. Neisseria elon-gata
Betaproteobacteria:Neisseriales
μl O2 (mgDM)−1 hr−1
MIN 5 8.3 30 5.87 [0.2] Jurtshuk &McQuitty 1976[BM, short rods0.5 μm width]
Cells harvested at thelate-logarithmicgrowth phase (twothirds of the maximalgrowth concentration)
Neisseria flava(ATCC 14221)
134. Neisseria flava Betaproteobacteria:Neisseriales
μl O2 (mgDM)−1 hr−1
MIN 7 12 30 8.49 [0.2] Jurtshuk &McQuitty 1976[BM, genus,cocci, diam 0.6-1.0 μm]
Cells harvested at thelate-logarithmicgrowth phase (twothirds of the maximalgrowth concentration)
Neisseria gonor-rhoeae
135. Neisseria gon-orrhoeae
Betaproteobacteria:Neisseriales
nmol O2 (mgprotein)−1 min−1
MIN 0.5 0.6 37 0.26 [0.2] Kenimer & Lapp1978 [BM, genus,cocci, diam 0.6-1.0 μm]
Cells harvested duringearly stationary phaseafter 18-20 hours ofincubation; respirationmeasured for 2-3 min
Cell mass estimated from linear dimen-sions given in BM
Neisseria mucosa 136. Neisseria mu-cosa
Betaproteobacteria:Neisseriales
μl O2 (mgDM)−1 hr−1
MIN 9 15 30 10.61 [0.2] Jurtshuk &McQuitty 1976[BM, genus,cocci, diam 0.6-1.0 μm]
Cells harvested at thelate-logarithmicgrowth phase (twothirds of the maximalgrowth concentration)
Neisseria sicca 137. Neisseria sicca Betaproteobacteria:Neisseriales
μl O2 (mgDM)−1 hr−1
MIN 8 13 30 9.19 [0.2] Jurtshuk &McQuitty 1976[BM, genus,cocci, diam 0.6-1.0 μm]
Cells harvested at thelate-logarithmicgrowth phase (twothirds of the maximalgrowth concentration)
Nitrobacter agilis 138. Nitrobacterwinogradskyi
Alphaproteobacteria:Rhizobiales
μl O2 (mg pro-tein)−1 hr−1
MIN 12 10 30 7.07 [0.24] Smith & Hoare1968 [Tappe et al.1999, 0.17-0.3μm3]
Incubation time 20 hr Facultative heterotroph otherwisegrowing on nitrite, =Nitrobacter wino-gradskyi (Pan 1971)
Protein to dry mass ratios (Protein/DM)are 0.55, 0.47 and 0.44 for autotrophic,autotrophic plus 1mM acetate, andautotrophic plus 5mM acetate, growncells, respectively.
Nitrobacter agilis(ATCC 14123)
139. Nitrobacterwinogradskyi
Alphaproteobacteria:Rhizobiales
ng-atoms O (mgprotein)−1 min−1
20 11 25 11.00 [0.24] Hollocher et al.1982 [Tappe et al.1999, 0.17-0.3μm3]
Cells grown at 30 C tothe late exponentialphase, stored for nomore than 3 days at 0C before measure-ments
1 mg WM ≈ 0.1 mg protein
Nitrosomonas eu-ropaea
140. Nitrosomonaseuropaea
Betaproteobacteria:Nitrosomonadales
ng-atoms O (mgprotein)−1 min−1
MIN 20 11 25 11.00 [0.6] Hollocher et al.1982 [Tappe et al.1999, 0.5-0.7μm3]
Bacteria grown at 30C to the late exponen-tial phase, stored forno more than 3 days at0 C
1 mg WM ≈ 0.1 mg protein
Nocardia corallina 141. Nocardia coral-lina
Actinobacteria: Acti-nomycetales
μl O2 (mgDM)−1 hr−1
MIN 1 1.7 30 1.20 2.1 Robertson & Batt1973 (rods, 0.8-1.2×2-4 μm)
Cells harvested at theend of growth phase;respiration measuredafter 45 hours of star-vation; viability morethan 90%
Soil bacterium
Dry mass data (Fig. 1): 4.3×10⁹ cells(90% viable) make up 1.6 mg dry mass:0.4 × 10⁻¹² g dry mass cell−1
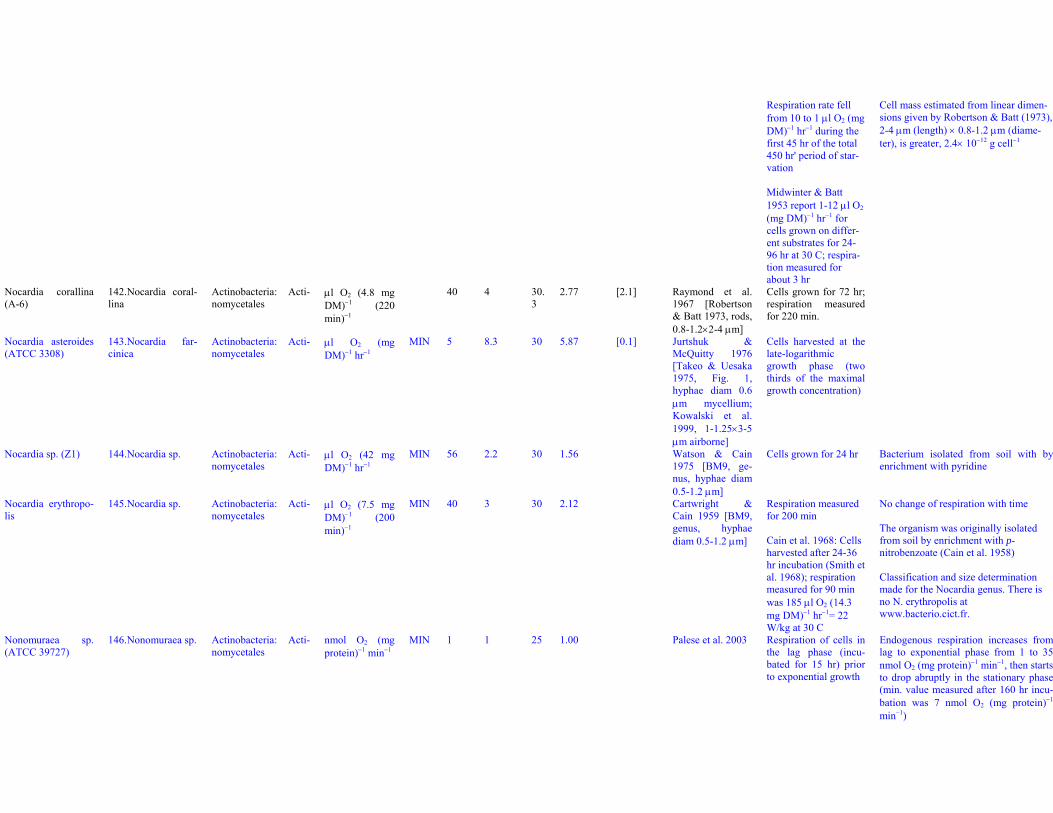
Respiration rate fellfrom 10 to 1 μl O2 (mgDM)−1 hr−1 during thefirst 45 hr of the total450 hr' period of star-vation
Midwinter & Batt1953 report 1-12 μl O2
(mg DM)−1 hr−1 forcells grown on differ-ent substrates for 24-96 hr at 30 C; respira-tion measured forabout 3 hr
Cell mass estimated from linear dimen-sions given by Robertson & Batt (1973),2-4 μm (length) × 0.8-1.2 μm (diame-ter), is greater, 2.4× 10⁻¹² g cell−1
Nocardia corallina(A-6)
142. Nocardia coral-lina
Actinobacteria: Acti-nomycetales
μl O2 (4.8 mgDM)−1 (220min)−1
40 4 30.3
2.77 [2.1] Raymond et al.1967 [Robertson& Batt 1973, rods,0.8-1.2×2-4 μm]
Cells grown for 72 hr;respiration measuredfor 220 min.
Nocardia asteroides(ATCC 3308)
143. Nocardia far-cinica
Actinobacteria: Acti-nomycetales
μl O2 (mgDM)−1 hr−1
MIN 5 8.3 30 5.87 [0.1] Jurtshuk &McQuitty 1976[Takeo & Uesaka1975, Fig. 1,hyphae diam 0.6μm mycellium;Kowalski et al.1999, 1-1.25×3-5μm airborne]
Cells harvested at thelate-logarithmicgrowth phase (twothirds of the maximalgrowth concentration)
Nocardia sp. (Z1) 144. Nocardia sp. Actinobacteria: Acti-nomycetales
μl O2 (42 mgDM)−1 hr−1
MIN 56 2.2 30 1.56 Watson & Cain1975 [BM9, ge-nus, hyphae diam0.5-1.2 μm]
Cells grown for 24 hr Bacterium isolated from soil with byenrichment with pyridine
Nocardia erythropo-lis
145. Nocardia sp. Actinobacteria: Acti-nomycetales
μl O2 (7.5 mgDM)−1 (200min)−1
MIN 40 3 30 2.12 Cartwright &Cain 1959 [BM9,genus, hyphaediam 0.5-1.2 μm]
Respiration measuredfor 200 min
Cain et al. 1968: Cellsharvested after 24-36hr incubation (Smith etal. 1968); respirationmeasured for 90 minwas 185 μl O2 (14.3mg DM)−1 hr−1= 22W/kg at 30 C
No change of respiration with time
The organism was originally isolatedfrom soil by enrichment with p-nitrobenzoate (Cain et al. 1958)
Classification and size determinationmade for the Nocardia genus. There isno N. erythropolis atwww.bacterio.cict.fr.
Nonomuraea sp.(ATCC 39727)
146. Nonomuraea sp. Actinobacteria: Acti-nomycetales
nmol O2 (mgprotein)−1 min−1
MIN 1 1 25 1.00 Palese et al. 2003 Respiration of cells inthe lag phase (incu-bated for 15 hr) priorto exponential growth
Endogenous respiration increases fromlag to exponential phase from 1 to 35nmol O2 (mg protein)−1 min−1, then startsto drop abruptly in the stationary phase(min. value measured after 160 hr incu-bation was 7 nmol O2 (mg protein)−1
min−1)
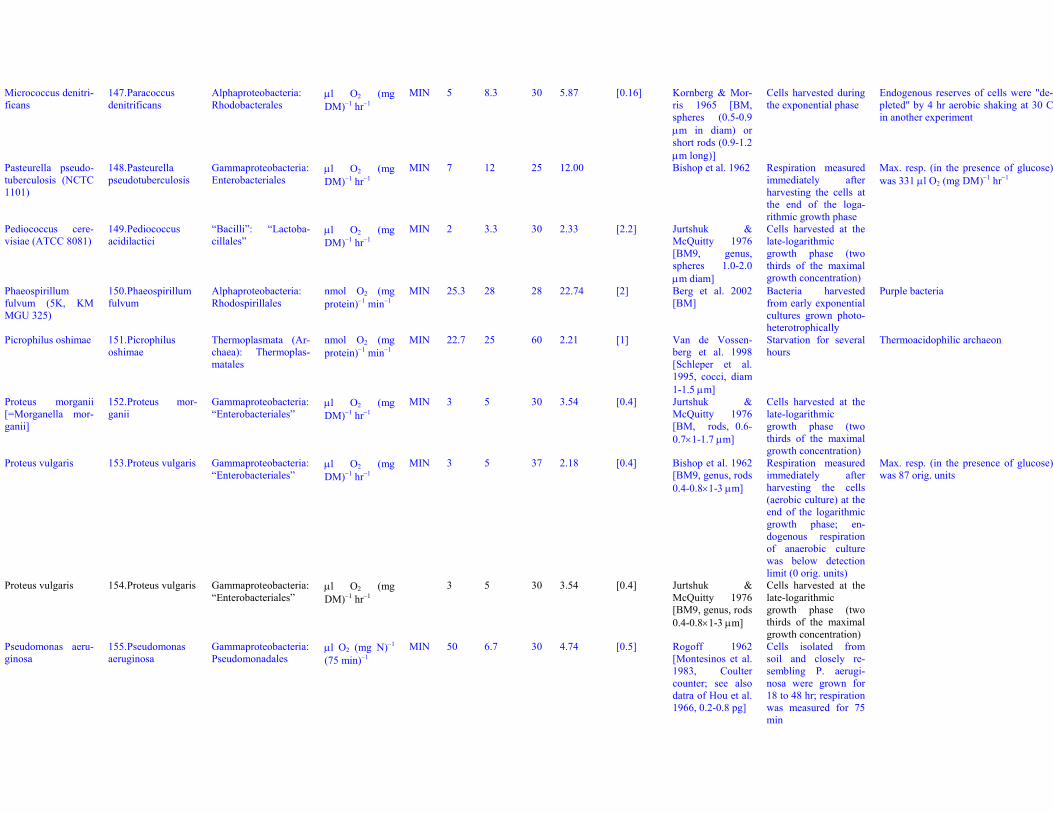
Micrococcus denitri-ficans
147. Paracoccusdenitrificans
Alphaproteobacteria:Rhodobacterales
μl O2 (mgDM)−1 hr−1
MIN 5 8.3 30 5.87 [0.16] Kornberg & Mor-ris 1965 [BM,spheres (0.5-0.9μm in diam) orshort rods (0.9-1.2μm long)]
Cells harvested duringthe exponential phase
Endogenous reserves of cells were "de-pleted" by 4 hr aerobic shaking at 30 Cin another experiment
Pasteurella pseudo-tuberculosis (NCTC1101)
148. Pasteurellapseudotuberculosis
Gammaproteobacteria:Enterobacteriales
μl O2 (mgDM)−1 hr−1
MIN 7 12 25 12.00 Bishop et al. 1962 Respiration measuredimmediately afterharvesting the cells atthe end of the loga-rithmic growth phase
Max. resp. (in the presence of glucose)was 331 μl O2 (mg DM)−1 hr−1
Pediococcus cere-visiae (ATCC 8081)
149. Pediococcusacidilactici
“Bacilli”: “Lactoba-cillales”
μl O2 (mgDM)−1 hr−1
MIN 2 3.3 30 2.33 [2.2] Jurtshuk &McQuitty 1976[BM9, genus,spheres 1.0-2.0μm diam]
Cells harvested at thelate-logarithmicgrowth phase (twothirds of the maximalgrowth concentration)
Phaeospirillumfulvum (5K, KMMGU 325)
150. Phaeospirillumfulvum
Alphaproteobacteria:Rhodospirillales
nmol O2 (mgprotein)−1 min−1
MIN 25.3 28 28 22.74 [2] Berg et al. 2002[BM]
Bacteria harvestedfrom early exponentialcultures grown photo-heterotrophically
Purple bacteria
Picrophilus oshimae 151. Picrophilusoshimae
Thermoplasmata (Ar-chaea): Thermoplas-matales
nmol O2 (mgprotein)−1 min−1
MIN 22.7 25 60 2.21 [1] Van de Vossen-berg et al. 1998[Schleper et al.1995, cocci, diam1-1.5 μm]
Starvation for severalhours
Thermoacidophilic archaeon
Proteus morganii[=Morganella mor-ganii]
152. Proteus mor-ganii
Gammaproteobacteria:“Enterobacteriales”
μl O2 (mgDM)−1 hr−1
MIN 3 5 30 3.54 [0.4] Jurtshuk &McQuitty 1976[BM, rods, 0.6-0.7×1-1.7 μm]
Cells harvested at thelate-logarithmicgrowth phase (twothirds of the maximalgrowth concentration)
Proteus vulgaris 153. Proteus vulgaris Gammaproteobacteria:“Enterobacteriales”
μl O2 (mgDM)−1 hr−1
MIN 3 5 37 2.18 [0.4] Bishop et al. 1962[BM9, genus, rods0.4-0.8×1-3 μm]
Respiration measuredimmediately afterharvesting the cells(aerobic culture) at theend of the logarithmicgrowth phase; en-dogenous respirationof anaerobic culturewas below detectionlimit (0 orig. units)
Max. resp. (in the presence of glucose)was 87 orig. units
Proteus vulgaris 154. Proteus vulgaris Gammaproteobacteria:“Enterobacteriales”
μl O2 (mgDM)−1 hr−1
3 5 30 3.54 [0.4] Jurtshuk &McQuitty 1976[BM9, genus, rods0.4-0.8×1-3 μm]
Cells harvested at thelate-logarithmicgrowth phase (twothirds of the maximalgrowth concentration)
Pseudomonas aeru-ginosa
155. Pseudomonasaeruginosa
Gammaproteobacteria:Pseudomonadales
μl O2 (mg N)−1
(75 min)−1MIN 50 6.7 30 4.74 [0.5] Rogoff 1962
[Montesinos et al.1983, Coultercounter; see alsodatra of Hou et al.1966, 0.2-0.8 pg]
Cells isolated fromsoil and closely re-sembling P. aerugi-nosa were grown for18 to 48 hr; respirationwas measured for 75min
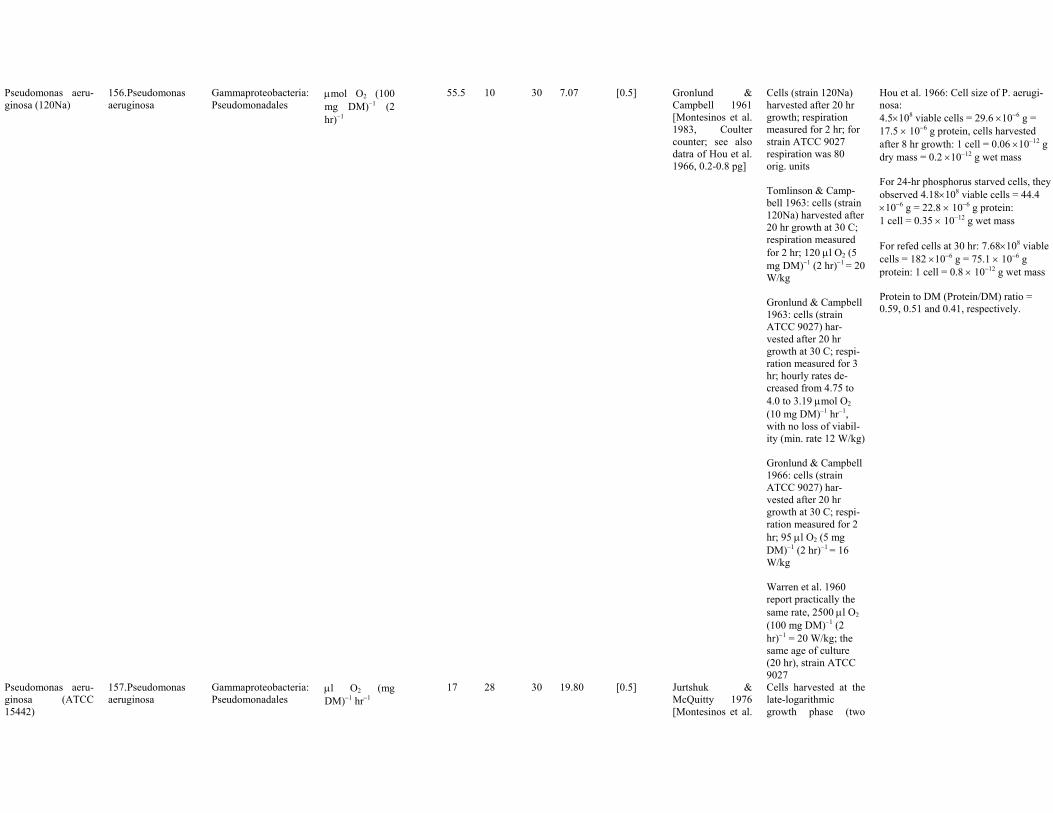
Pseudomonas aeru-ginosa (120Na)
156. Pseudomonasaeruginosa
Gammaproteobacteria:Pseudomonadales
μmol O2 (100mg DM)−1 (2hr)−1
55.5 10 30 7.07 [0.5] Gronlund &Campbell 1961[Montesinos et al.1983, Coultercounter; see alsodatra of Hou et al.1966, 0.2-0.8 pg]
Cells (strain 120Na)harvested after 20 hrgrowth; respirationmeasured for 2 hr; forstrain ATCC 9027respiration was 80orig. units
Tomlinson & Camp-bell 1963: cells (strain120Na) harvested after20 hr growth at 30 C;respiration measuredfor 2 hr; 120 μl O2 (5mg DM)−1 (2 hr)−1 = 20W/kg
Gronlund & Campbell1963: cells (strainATCC 9027) har-vested after 20 hrgrowth at 30 C; respi-ration measured for 3hr; hourly rates de-creased from 4.75 to4.0 to 3.19 μmol O2
(10 mg DM)−1 hr−1,with no loss of viabil-ity (min. rate 12 W/kg)
Gronlund & Campbell1966: cells (strainATCC 9027) har-vested after 20 hrgrowth at 30 C; respi-ration measured for 2hr; 95 μl O2 (5 mgDM)−1 (2 hr)−1 = 16W/kg
Warren et al. 1960report practically thesame rate, 2500 μl O2
(100 mg DM)−1 (2hr)−1 = 20 W/kg; thesame age of culture(20 hr), strain ATCC9027
Hou et al. 1966: Cell size of P. aerugi-nosa:4.5×10⁸ viable cells = 29.6 ×10⁻⁶ g =17.5 × 10⁻⁶ g protein, cells harvestedafter 8 hr growth: 1 cell = 0.06 ×10⁻¹² gdry mass = 0.2 ×10⁻¹² g wet mass
For 24-hr phosphorus starved cells, theyobserved 4.18×10⁸ viable cells = 44.4×10⁻⁶ g = 22.8 × 10⁻⁶ g protein:1 cell = 0.35 × 10⁻¹² g wet mass
For refed cells at 30 hr: 7.68×10⁸ viablecells = 182 ×10−6 g = 75.1 × 10⁻⁶ gprotein: 1 cell = 0.8 × 10⁻¹² g wet mass
Protein to DM (Protein/DM) ratio =0.59, 0.51 and 0.41, respectively.
Pseudomonas aeru-ginosa (ATCC15442)
157. Pseudomonasaeruginosa
Gammaproteobacteria:Pseudomonadales
μl O2 (mgDM)−1 hr−1
17 28 30 19.80 [0.5] Jurtshuk &McQuitty 1976[Montesinos et al.
Cells harvested at thelate-logarithmicgrowth phase (two
1983, Coultercounter; see alsodatra of Hou et al.1966, 0.2-0.8 pg]
thirds of the maximalgrowth concentration)
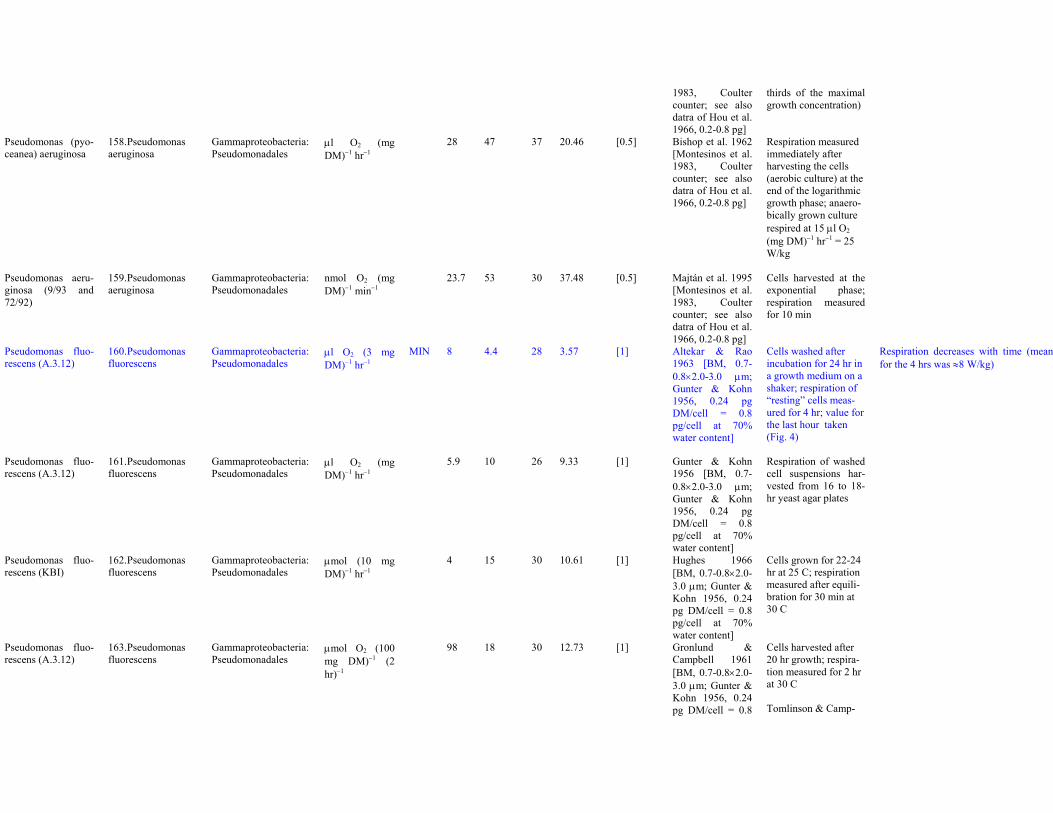
Pseudomonas (pyo-ceanea) aeruginosa
158. Pseudomonasaeruginosa
Gammaproteobacteria:Pseudomonadales
μl O2 (mgDM)−1 hr−1
28 47 37 20.46 [0.5] Bishop et al. 1962[Montesinos et al.1983, Coultercounter; see alsodatra of Hou et al.1966, 0.2-0.8 pg]
Respiration measuredimmediately afterharvesting the cells(aerobic culture) at theend of the logarithmicgrowth phase; anaero-bically grown culturerespired at 15 μl O2
(mg DM)−1 hr−1 = 25W/kg
Pseudomonas aeru-ginosa (9/93 and72/92)
159. Pseudomonasaeruginosa
Gammaproteobacteria:Pseudomonadales
nmol O2 (mgDM)−1 min−1
23.7 53 30 37.48 [0.5] Majtán et al. 1995[Montesinos et al.1983, Coultercounter; see alsodatra of Hou et al.1966, 0.2-0.8 pg]
Cells harvested at theexponential phase;respiration measuredfor 10 min
Pseudomonas fluo-rescens (A.3.12)
160. Pseudomonasfluorescens
Gammaproteobacteria:Pseudomonadales
μl O2 (3 mgDM)−1 hr−1
MIN 8 4.4 28 3.57 [1] Altekar & Rao1963 [BM, 0.7-0.8×2.0-3.0 μm;Gunter & Kohn1956, 0.24 pgDM/cell = 0.8pg/cell at 70%water content]
Cells washed afterincubation for 24 hr ina growth medium on ashaker; respiration of“resting” cells meas-ured for 4 hr; value forthe last hour taken(Fig. 4)
Respiration decreases with time (meanfor the 4 hrs was ≈8 W/kg)
Pseudomonas fluo-rescens (A.3.12)
161. Pseudomonasfluorescens
Gammaproteobacteria:Pseudomonadales
μl O2 (mgDM)−1 hr−1
5.9 10 26 9.33 [1] Gunter & Kohn1956 [BM, 0.7-0.8×2.0-3.0 μm;Gunter & Kohn1956, 0.24 pgDM/cell = 0.8pg/cell at 70%water content]
Respiration of washedcell suspensions har-vested from 16 to 18-hr yeast agar plates
Pseudomonas fluo-rescens (KBI)
162. Pseudomonasfluorescens
Gammaproteobacteria:Pseudomonadales
μmol (10 mgDM)−1 hr−1
4 15 30 10.61 [1] Hughes 1966[BM, 0.7-0.8×2.0-3.0 μm; Gunter &Kohn 1956, 0.24pg DM/cell = 0.8pg/cell at 70%water content]
Cells grown for 22-24hr at 25 C; respirationmeasured after equili-bration for 30 min at30 C
Pseudomonas fluo-rescens (A.3.12)
163. Pseudomonasfluorescens
Gammaproteobacteria:Pseudomonadales
μmol O2 (100mg DM)−1 (2hr)−1
98 18 30 12.73 [1] Gronlund &Campbell 1961[BM, 0.7-0.8×2.0-3.0 μm; Gunter &Kohn 1956, 0.24pg DM/cell = 0.8
Cells harvested after20 hr growth; respira-tion measured for 2 hrat 30 C
Tomlinson & Camp-
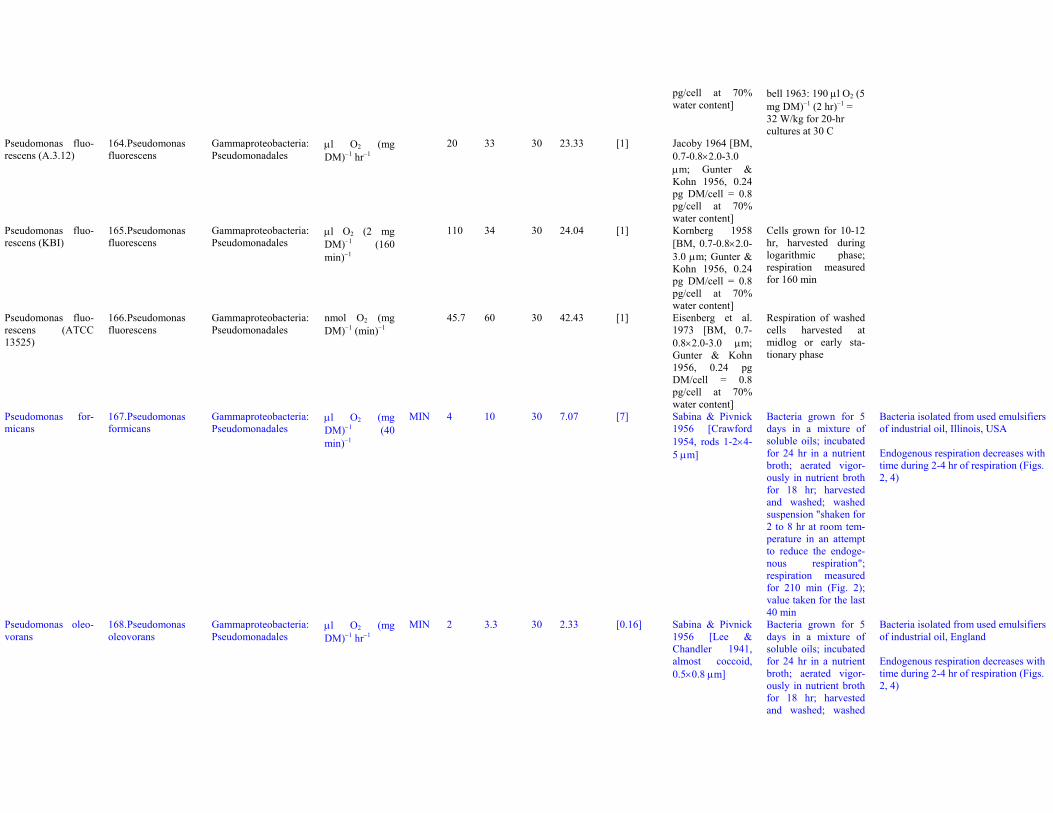
pg/cell at 70%water content]
bell 1963: 190 μl O2 (5mg DM)−1 (2 hr)−1 =32 W/kg for 20-hrcultures at 30 C
Pseudomonas fluo-rescens (A.3.12)
164. Pseudomonasfluorescens
Gammaproteobacteria:Pseudomonadales
μl O2 (mgDM)−1 hr−1
20 33 30 23.33 [1] Jacoby 1964 [BM,0.7-0.8×2.0-3.0μm; Gunter &Kohn 1956, 0.24pg DM/cell = 0.8pg/cell at 70%water content]
Pseudomonas fluo-rescens (KBI)
165. Pseudomonasfluorescens
Gammaproteobacteria:Pseudomonadales
μl O2 (2 mgDM)−1 (160min)−1
110 34 30 24.04 [1] Kornberg 1958[BM, 0.7-0.8×2.0-3.0 μm; Gunter &Kohn 1956, 0.24pg DM/cell = 0.8pg/cell at 70%water content]
Cells grown for 10-12hr, harvested duringlogarithmic phase;respiration measuredfor 160 min
Pseudomonas fluo-rescens (ATCC13525)
166. Pseudomonasfluorescens
Gammaproteobacteria:Pseudomonadales
nmol O2 (mgDM)−1 (min)−1
45.7 60 30 42.43 [1] Eisenberg et al.1973 [BM, 0.7-0.8×2.0-3.0 μm;Gunter & Kohn1956, 0.24 pgDM/cell = 0.8pg/cell at 70%water content]
Respiration of washedcells harvested atmidlog or early sta-tionary phase
Pseudomonas for-micans
167. Pseudomonasformicans
Gammaproteobacteria:Pseudomonadales
μl O2 (mgDM)−1 (40min)−1
MIN 4 10 30 7.07 [7] Sabina & Pivnick1956 [Crawford1954, rods 1-2×4-5 μm]
Bacteria grown for 5days in a mixture ofsoluble oils; incubatedfor 24 hr in a nutrientbroth; aerated vigor-ously in nutrient brothfor 18 hr; harvestedand washed; washedsuspension "shaken for2 to 8 hr at room tem-perature in an attemptto reduce the endoge-nous respiration";respiration measuredfor 210 min (Fig. 2);value taken for the last40 min
Bacteria isolated from used emulsifiersof industrial oil, Illinois, USA
Endogenous respiration decreases withtime during 2-4 hr of respiration (Figs.2, 4)
Pseudomonas oleo-vorans
168. Pseudomonasoleovorans
Gammaproteobacteria:Pseudomonadales
μl O2 (mgDM)−1 hr−1
MIN 2 3.3 30 2.33 [0.16] Sabina & Pivnick1956 [Lee &Chandler 1941,almost coccoid,0.5×0.8 μm]
Bacteria grown for 5days in a mixture ofsoluble oils; incubatedfor 24 hr in a nutrientbroth; aerated vigor-ously in nutrient brothfor 18 hr; harvestedand washed; washed
Bacteria isolated from used emulsifiersof industrial oil, England
Endogenous respiration decreases withtime during 2-4 hr of respiration (Figs.2, 4)
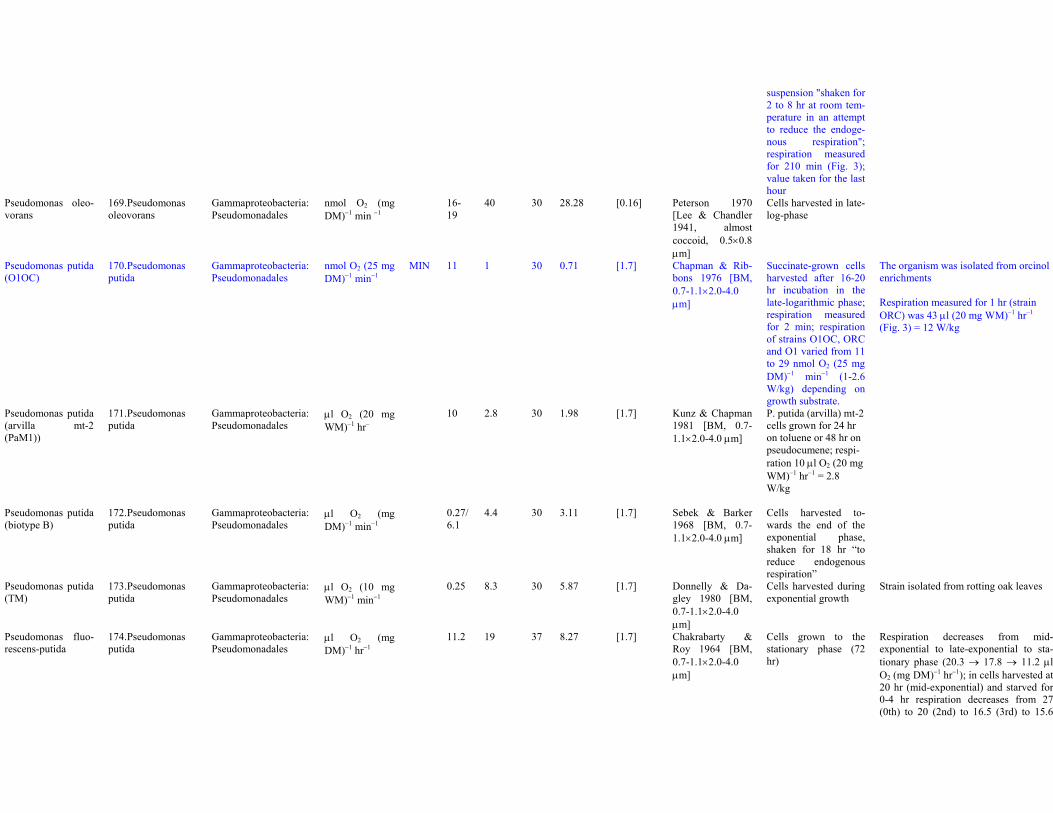
suspension "shaken for2 to 8 hr at room tem-perature in an attemptto reduce the endoge-nous respiration";respiration measuredfor 210 min (Fig. 3);value taken for the lasthour
Pseudomonas oleo-vorans
169. Pseudomonasoleovorans
Gammaproteobacteria:Pseudomonadales
nmol O2 (mgDM)−1 min −1
16-19
40 30 28.28 [0.16] Peterson 1970[Lee & Chandler1941, almostcoccoid, 0.5×0.8μm]
Cells harvested in late-log-phase
Pseudomonas putida(O1OC)
170. Pseudomonasputida
Gammaproteobacteria:Pseudomonadales
nmol O2 (25 mgDM)−1 min−1
MIN 11 1 30 0.71 [1.7] Chapman & Rib-bons 1976 [BM,0.7-1.1×2.0-4.0μm]
Succinate-grown cellsharvested after 16-20hr incubation in thelate-logarithmic phase;respiration measuredfor 2 min; respirationof strains O1OC, ORCand O1 varied from 11to 29 nmol O2 (25 mgDM)−1 min−1 (1-2.6W/kg) depending ongrowth substrate.
The organism was isolated from orcinolenrichments
Respiration measured for 1 hr (strainORC) was 43 μl (20 mg WM)−1 hr−1
(Fig. 3) = 12 W/kg
Pseudomonas putida(arvilla mt-2(PaM1))
171. Pseudomonasputida
Gammaproteobacteria:Pseudomonadales
μl O2 (20 mgWM)−1 hr−
10 2.8 30 1.98 [1.7] Kunz & Chapman1981 [BM, 0.7-1.1×2.0-4.0 μm]
P. putida (arvilla) mt-2cells grown for 24 hron toluene or 48 hr onpseudocumene; respi-ration 10 μl O2 (20 mgWM)−1 hr−1 = 2.8W/kg
Pseudomonas putida(biotype B)
172. Pseudomonasputida
Gammaproteobacteria:Pseudomonadales
μl O2 (mgDM)−1 min−1
0.27/6.1
4.4 30 3.11 [1.7] Sebek & Barker1968 [BM, 0.7-1.1×2.0-4.0 μm]
Cells harvested to-wards the end of theexponential phase,shaken for 18 hr “toreduce endogenousrespiration”
Pseudomonas putida(TM)
173. Pseudomonasputida
Gammaproteobacteria:Pseudomonadales
μl O2 (10 mgWM)−1 min−1
0.25 8.3 30 5.87 [1.7] Donnelly & Da-gley 1980 [BM,0.7-1.1×2.0-4.0μm]
Cells harvested duringexponential growth
Strain isolated from rotting oak leaves
Pseudomonas fluo-rescens-putida
174. Pseudomonasputida
Gammaproteobacteria:Pseudomonadales
μl O2 (mgDM)−1 hr−1
11.2 19 37 8.27 [1.7] Chakrabarty &Roy 1964 [BM,0.7-1.1×2.0-4.0μm]
Cells grown to thestationary phase (72hr)
Respiration decreases from mid-exponential to late-exponential to sta-tionary phase (20.3 → 17.8 → 11.2 μlO2 (mg DM)−1 hr−1); in cells harvested at20 hr (mid-exponential) and starved for0-4 hr respiration decreases from 27(0th) to 20 (2nd) to 16.5 (3rd) to 15.6
(4th hr) μl O2 (mg DM)−1 hr−1
Pseudomonas putida(PRS1)
175. Pseudomonasputida
Gammaproteobacteria:Pseudomonadales
μl O2 (mgDM)−1 hr−1
10 17 30 12.02 [1.7] Meagher et al.1972 [BM, 0.7-1.1×2.0-4.0 μm]
Cells harvested duringexponential growth
Pseudomonas putida 176. Pseudomonasputida
Gammaproteobacteria:Pseudomonadales
nmol O2 (mgDM)−1 min −1
15 34 30 24.04 [1.7] Peterson 1970[BM, 0.7-1.1×2.0-4.0 μm]
Cells harvested in late-log-phase
Pseudomonas sac-charophila
177. Pseudomonassaccharophila
Gammaproteobacteria:Pseudomonadales
μl O2 (mgDM)−1 hr−1
MIN 20-28
33 30 23.33 Doudoroff et al.1956
Cells harvested fromearly stationary phasecultures
Pseudomonas sp.(B1)
178. Pseudomonassp.
Gammaproteobacteria:Pseudomonadales
nmol O2 (mgprotein)−1 min−1
MIN 2 2.2 30 1.56 Van Ginkel et al.1992 [BM, genus,rods 0.5-1.0×1.5-5.0 μm]
Yeast-glucose plateinoculates were incu-bated in a stationaryfashion at 30 C;washed; endogenousrespiration measuredfor 5 min
Bacteria isolated from activated sludgetaken from a domestic seweage plant,The Netherlands
Pseudomonas sp. 179. Pseudomonassp.
Gammaproteobacteria:Pseudomonadales
μmol O2 (50mg)−1 (4 hr)−1
MIN 13 8 30 5.66 Shaw 1956 [BM,genus, rods 0.5-1.0×1.5-5.0 μm]
Bacteria grown for 24hr at 30 C; washed;respiration measuredfor 4 h
An airborne organism isolated in thelaboratory; University of Otago; NewZealand; a fluorescent species of Pseu-domonas
Pseudomonas sp. 180. Pseudomonassp.
Gammaproteobacteria:Pseudomonadales
μl O2 (mgDM)−1 hr−1
10 17 30 12.02 Sariaslani et al.1982 [BM, genus,rods 0.5-1.0×1.5-5.0 μm]
Bacteria harvestedduring log phase;respiration measuredfor about 1 h
Bacteria isolated from California soil,USA.
Pseudomonas sp.(OD1)
181. Pseudomonassp.
Gammaproteobacteria:Pseudomonadales
μl O2 (mgDM)−1 hr−1
MIN 2 3.3 25 3.30 Jayasuriya 1956[BM, genus, rods0.5-1.0×1.5-5.0μm]
Bacteria grown onoxalate for 40 hr at 25C
Pseudomonas sp.(PN-1)
182. Pseudomonassp.
Gammaproteobacteria:Pseudomonadales
μmol O2 (6.05mg protein)−1
(145 min)−1
MIN 6.5 8.3 30 5.87 Taylor 1983 [BM,genus, rods 0.5-1.0×1.5-5.0 μm]
Endogenous respira-tion of anaerobicallygrown cells
Pseudomonas sp. P6(NCIB 10431)
183. Pseudomonassp.
Gammaproteobacteria:Pseudomonadales
μmol O2 (mgDM)−1 hr−1
MIN 0.4 15 30 10.61 Jones & Turner1973 [BM, genus,rods 0.5-1.0×1.5-5.0 μm]
Respiration measuredfor not less than 90min
Synonym Acrhomobacter sp. P6
Azotomonas insolita(ATCC 12412)
184. Pseudomonassp.
Gammaproteobacteria:Pseudomonadales
μl O2 (mgDM)−1 hr−1
MIN 11 18 30 12.73 Jurtshuk &McQuitty 1976[BM, genus, rods0.5-1.0×1.5-5.0]
Cells harvested at thelate-logarithmicgrowth phase (twothirds of the maximalgrowth concentration)
Size determination is made for Pseu-domonas genus, since ATCC 12412correponds to a Pseudomonas sp.
Pseudomonas sp.(B13)
185. Pseudomonassp.
Gammaproteobacteria:Pseudomonadales
μg O2 (mgDM)−1 min−1
MIN 0.5 35 20 49.50 Tros et al. 1996[BM, genus, rods0.5-1.0×1.5-5.0μm]
Bacteria grown forabout 210 hr in a recy-cling fermentor toreach the stationaryphase; endogenousrespiration measuredfor 5-10 min of asample taken from therecycling fermentor
Bacteria isolated from activated sludgetaken from a domestic seweage plant,The Netherlands
Streptomyces nitri- 186. Pseudonocardia Actinobacteria: Acti- μl O2 (mg MIN 1.5 2.5 30 1.77 Isenberg et al. Mycellium grown for 5 mg DM= 25 mm3 wet packed volume
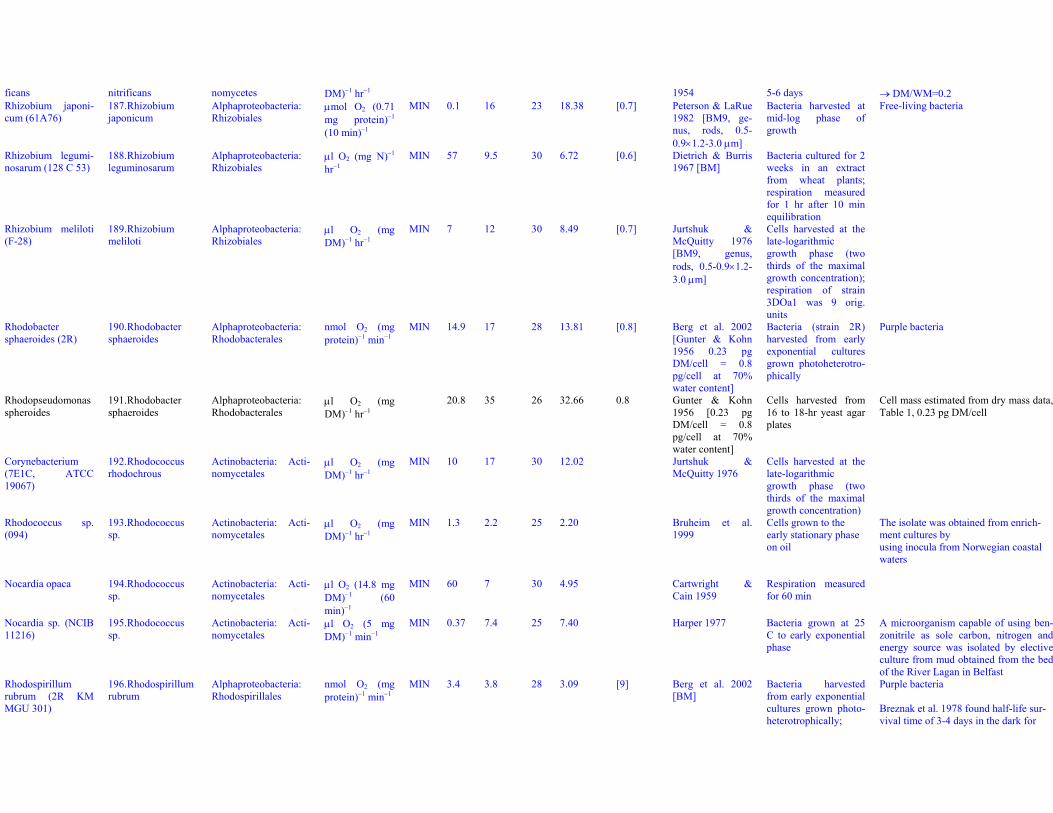
ficans nitrificans nomycetes DM)−1 hr−1 1954 5-6 days → DM/WM=0.2Rhizobium japoni-cum (61A76)
187. Rhizobiumjaponicum
Alphaproteobacteria:Rhizobiales
μmol O2 (0.71mg protein)−1
(10 min)−1
MIN 0.1 16 23 18.38 [0.7] Peterson & LaRue1982 [BM9, ge-nus, rods, 0.5-0.9×1.2-3.0 μm]
Bacteria harvested atmid-log phase ofgrowth
Free-living bacteria
Rhizobium legumi-nosarum (128 C 53)
188. Rhizobiumleguminosarum
Alphaproteobacteria:Rhizobiales
μl O2 (mg N)−1
hr−1MIN 57 9.5 30 6.72 [0.6] Dietrich & Burris
1967 [BM]Bacteria cultured for 2weeks in an extractfrom wheat plants;respiration measuredfor 1 hr after 10 minequilibration
Rhizobium meliloti(F-28)
189. Rhizobiummeliloti
Alphaproteobacteria:Rhizobiales
μl O2 (mgDM)−1 hr−1
MIN 7 12 30 8.49 [0.7] Jurtshuk &McQuitty 1976[BM9, genus,rods, 0.5-0.9×1.2-3.0 μm]
Cells harvested at thelate-logarithmicgrowth phase (twothirds of the maximalgrowth concentration);respiration of strain3DOa1 was 9 orig.units
Rhodobactersphaeroides (2R)
190. Rhodobactersphaeroides
Alphaproteobacteria:Rhodobacterales
nmol O2 (mgprotein)−1 min−1
MIN 14.9 17 28 13.81 [0.8] Berg et al. 2002[Gunter & Kohn1956 0.23 pgDM/cell = 0.8pg/cell at 70%water content]
Bacteria (strain 2R)harvested from earlyexponential culturesgrown photoheterotro-phically
Purple bacteria
Rhodopseudomonasspheroides
191. Rhodobactersphaeroides
Alphaproteobacteria:Rhodobacterales
μl O2 (mgDM)−1 hr−1
20.8 35 26 32.66 0.8 Gunter & Kohn1956 [0.23 pgDM/cell = 0.8pg/cell at 70%water content]
Cells harvested from16 to 18-hr yeast agarplates
Cell mass estimated from dry mass data,Table 1, 0.23 pg DM/cell
Corynebacterium(7E1C, ATCC19067)
192. Rhodococcusrhodochrous
Actinobacteria: Acti-nomycetales
μl O2 (mgDM)−1 hr−1
MIN 10 17 30 12.02 Jurtshuk &McQuitty 1976
Cells harvested at thelate-logarithmicgrowth phase (twothirds of the maximalgrowth concentration)
Rhodococcus sp.(094)
193. Rhodococcussp.
Actinobacteria: Acti-nomycetales
μl O2 (mgDM)−1 hr−1
MIN 1.3 2.2 25 2.20 Bruheim et al.1999
Cells grown to theearly stationary phaseon oil
The isolate was obtained from enrich-ment cultures byusing inocula from Norwegian coastalwaters
Nocardia opaca 194. Rhodococcussp.
Actinobacteria: Acti-nomycetales
μl O2 (14.8 mgDM)−1 (60min)−1
MIN 60 7 30 4.95 Cartwright &Cain 1959
Respiration measuredfor 60 min
Nocardia sp. (NCIB11216)
195. Rhodococcussp.
Actinobacteria: Acti-nomycetales
μl O2 (5 mgDM)−1 min−1
MIN 0.37 7.4 25 7.40 Harper 1977 Bacteria grown at 25C to early exponentialphase
A microorganism capable of using ben-zonitrile as sole carbon, nitrogen andenergy source was isolated by electiveculture from mud obtained from the bedof the River Lagan in Belfast
Rhodospirillumrubrum (2R KMMGU 301)
196. Rhodospirillumrubrum
Alphaproteobacteria:Rhodospirillales
nmol O2 (mgprotein)−1 min−1
MIN 3.4 3.8 28 3.09 [9] Berg et al. 2002[BM]
Bacteria harvestedfrom early exponentialcultures grown photo-heterotrophically;
Purple bacteria
Breznak et al. 1978 found half-life sur-vival time of 3-4 days in the dark for
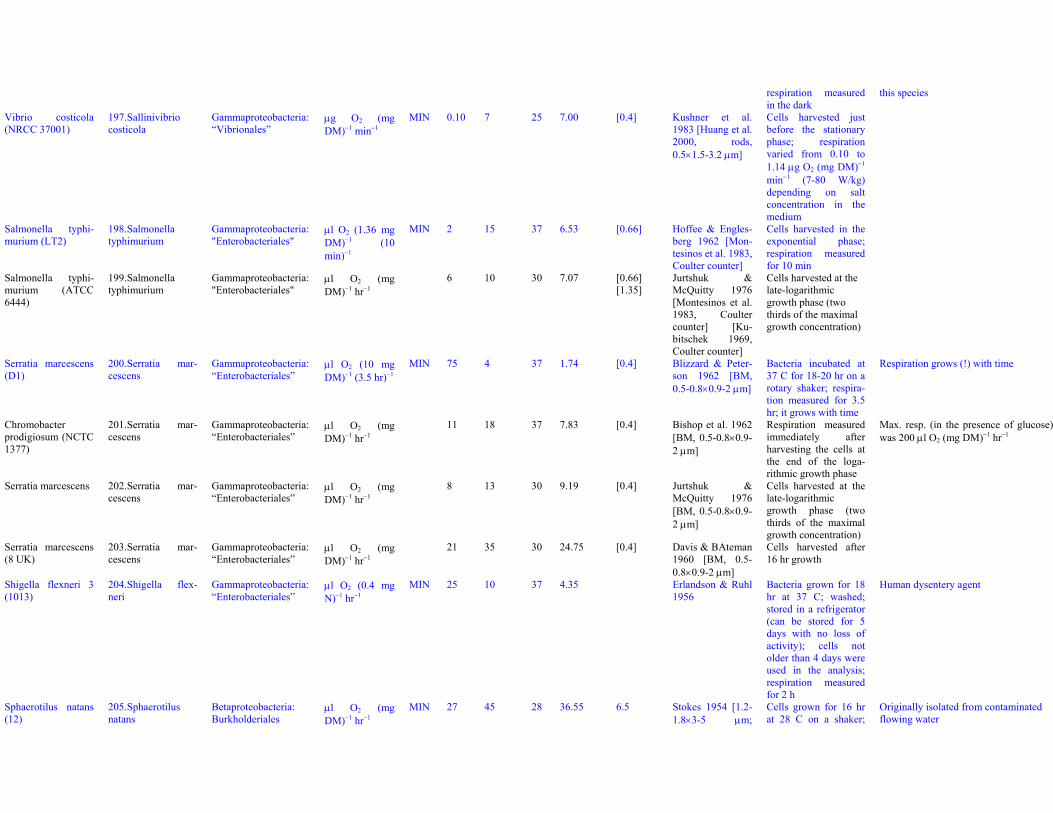
respiration measuredin the dark
this species
Vibrio costicola(NRCC 37001)
197. Sallinivibriocosticola
Gammaproteobacteria:“Vibrionales”
μg O2 (mgDM)−1 min−1
MIN 0.10 7 25 7.00 [0.4] Kushner et al.1983 [Huang et al.2000, rods,0.5×1.5-3.2 μm]
Cells harvested justbefore the stationaryphase; respirationvaried from 0.10 to1.14 μg O2 (mg DM)−1
min−1 (7-80 W/kg)depending on saltconcentration in themedium
Salmonella typhi-murium (LT2)
198. Salmonellatyphimurium
Gammaproteobacteria:"Enterobacteriales"
μl O2 (1.36 mgDM)−1 (10min)−1
MIN 2 15 37 6.53 [0.66] Hoffee & Engles-berg 1962 [Mon-tesinos et al. 1983,Coulter counter]
Cells harvested in theexponential phase;respiration measuredfor 10 min
Salmonella typhi-murium (ATCC6444)
199. Salmonellatyphimurium
Gammaproteobacteria:"Enterobacteriales"
μl O2 (mgDM)−1 hr−1
6 10 30 7.07 [0.66][1.35]
Jurtshuk &McQuitty 1976[Montesinos et al.1983, Coultercounter] [Ku-bitschek 1969,Coulter counter]
Cells harvested at thelate-logarithmicgrowth phase (twothirds of the maximalgrowth concentration)
Serratia marcescens(D1)
200. Serratia mar-cescens
Gammaproteobacteria:“Enterobacteriales”
μl O2 (10 mgDM)−1 (3.5 hr)−1
MIN 75 4 37 1.74 [0.4] Blizzard & Peter-son 1962 [BM,0.5-0.8×0.9-2 μm]
Bacteria incubated at37 C for 18-20 hr on arotary shaker; respira-tion measured for 3.5hr; it grows with time
Respiration grows (!) with time
Chromobacterprodigiosum (NCTC1377)
201. Serratia mar-cescens
Gammaproteobacteria:“Enterobacteriales”
μl O2 (mgDM)−1 hr−1
11 18 37 7.83 [0.4] Bishop et al. 1962[BM, 0.5-0.8×0.9-2 μm]
Respiration measuredimmediately afterharvesting the cells atthe end of the loga-rithmic growth phase
Max. resp. (in the presence of glucose)was 200 μl O2 (mg DM)−1 hr−1
Serratia marcescens 202. Serratia mar-cescens
Gammaproteobacteria:“Enterobacteriales”
μl O2 (mgDM)−1 hr−1
8 13 30 9.19 [0.4] Jurtshuk &McQuitty 1976[BM, 0.5-0.8×0.9-2 μm]
Cells harvested at thelate-logarithmicgrowth phase (twothirds of the maximalgrowth concentration)
Serratia marcescens(8 UK)
203. Serratia mar-cescens
Gammaproteobacteria:“Enterobacteriales”
μl O2 (mgDM)−1 hr−1
21 35 30 24.75 [0.4] Davis & BAteman1960 [BM, 0.5-0.8×0.9-2 μm]
Cells harvested after16 hr growth
Shigella flexneri 3(1013)
204. Shigella flex-neri
Gammaproteobacteria:“Enterobacteriales”
μl O2 (0.4 mgN)−1 hr−1
MIN 25 10 37 4.35 Erlandson & Ruhl1956
Bacteria grown for 18hr at 37 C; washed;stored in a refrigerator(can be stored for 5days with no loss ofactivity); cells notolder than 4 days wereused in the analysis;respiration measuredfor 2 h
Human dysentery agent
Sphaerotilus natans(12)
205. Sphaerotilusnatans
Betaproteobacteria:Burkholderiales
μl O2 (mgDM)−1 hr−1
MIN 27 45 28 36.55 6.5 Stokes 1954 [1.2-1.8×3-5 μm;
Cells grown for 16 hrat 28 C on a shaker;
Originally isolated from contaminatedflowing water
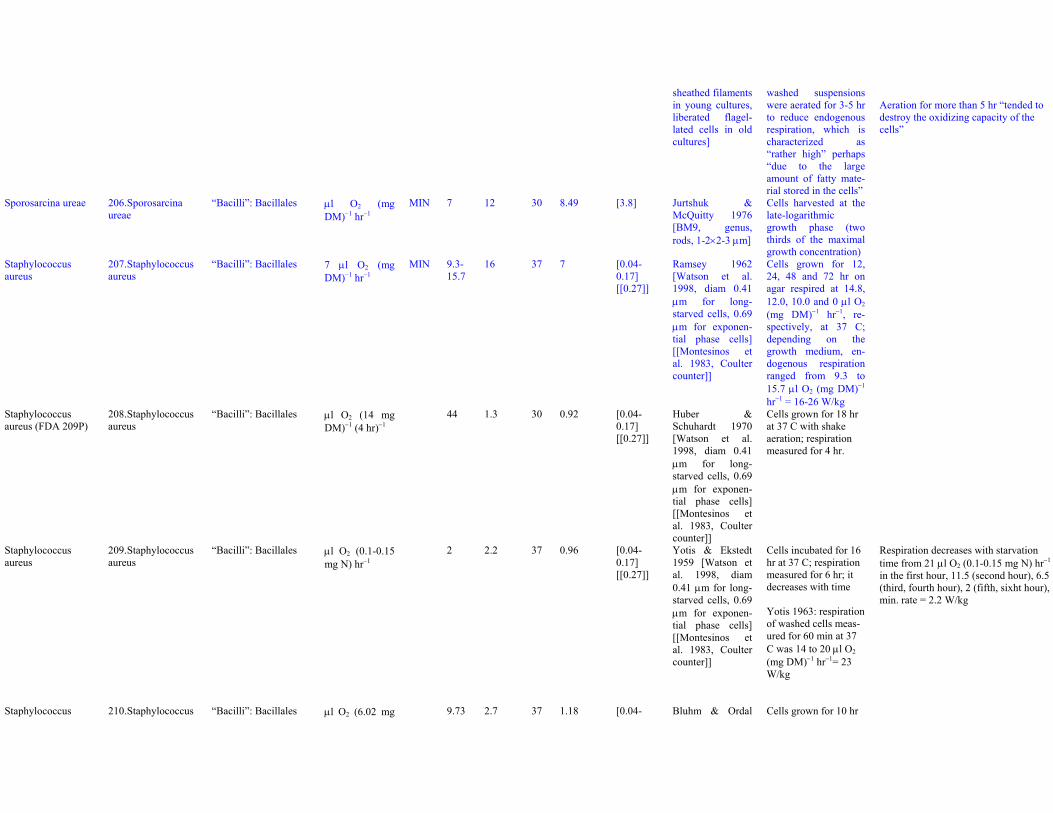
sheathed filamentsin young cultures,liberated flagel-lated cells in oldcultures]
washed suspensionswere aerated for 3-5 hrto reduce endogenousrespiration, which ischaracterized as“rather high” perhaps“due to the largeamount of fatty mate-rial stored in the cells”
Aeration for more than 5 hr “tended todestroy the oxidizing capacity of thecells”
Sporosarcina ureae 206. Sporosarcinaureae
“Bacilli”: Bacillales μl O2 (mgDM)−1 hr−1
MIN 7 12 30 8.49 [3.8] Jurtshuk &McQuitty 1976[BM9, genus,rods, 1-2×2-3 μm]
Cells harvested at thelate-logarithmicgrowth phase (twothirds of the maximalgrowth concentration)
Staphylococcusaureus
207. Staphylococcusaureus
“Bacilli”: Bacillales 7 μl O2 (mgDM)−1 hr−1
MIN 9.3-15.7
16 37 7 [0.04-0.17][[0.27]]
Ramsey 1962[Watson et al.1998, diam 0.41μm for long-starved cells, 0.69μm for exponen-tial phase cells][[Montesinos etal. 1983, Coultercounter]]
Cells grown for 12,24, 48 and 72 hr onagar respired at 14.8,12.0, 10.0 and 0 μl O2
(mg DM)−1 hr−1, re-spectively, at 37 C;depending on thegrowth medium, en-dogenous respirationranged from 9.3 to15.7 μl O2 (mg DM)−1
hr−1 = 16-26 W/kgStaphylococcusaureus (FDA 209P)
208. Staphylococcusaureus
“Bacilli”: Bacillales μl O2 (14 mgDM)−1 (4 hr)−1
44 1.3 30 0.92 [0.04-0.17][[0.27]]
Huber &Schuhardt 1970[Watson et al.1998, diam 0.41μm for long-starved cells, 0.69μm for exponen-tial phase cells][[Montesinos etal. 1983, Coultercounter]]
Cells grown for 18 hrat 37 C with shakeaeration; respirationmeasured for 4 hr.
Staphylococcusaureus
209. Staphylococcusaureus
“Bacilli”: Bacillales μl O2 (0.1-0.15mg N) hr−1
2 2.2 37 0.96 [0.04-0.17][[0.27]]
Yotis & Ekstedt1959 [Watson etal. 1998, diam0.41 μm for long-starved cells, 0.69μm for exponen-tial phase cells][[Montesinos etal. 1983, Coultercounter]]
Cells incubated for 16hr at 37 C; respirationmeasured for 6 hr; itdecreases with time
Yotis 1963: respirationof washed cells meas-ured for 60 min at 37C was 14 to 20 μl O2
(mg DM)−1 hr−1= 23W/kg
Respiration decreases with starvationtime from 21 μl O2 (0.1-0.15 mg N) hr−1
in the first hour, 11.5 (second hour), 6.5(third, fourth hour), 2 (fifth, sixht hour),min. rate = 2.2 W/kg
Staphylococcus 210. Staphylococcus “Bacilli”: Bacillales μl O2 (6.02 mg 9.73 2.7 37 1.18 [0.04- Bluhm & Ordal Cells grown for 10 hr
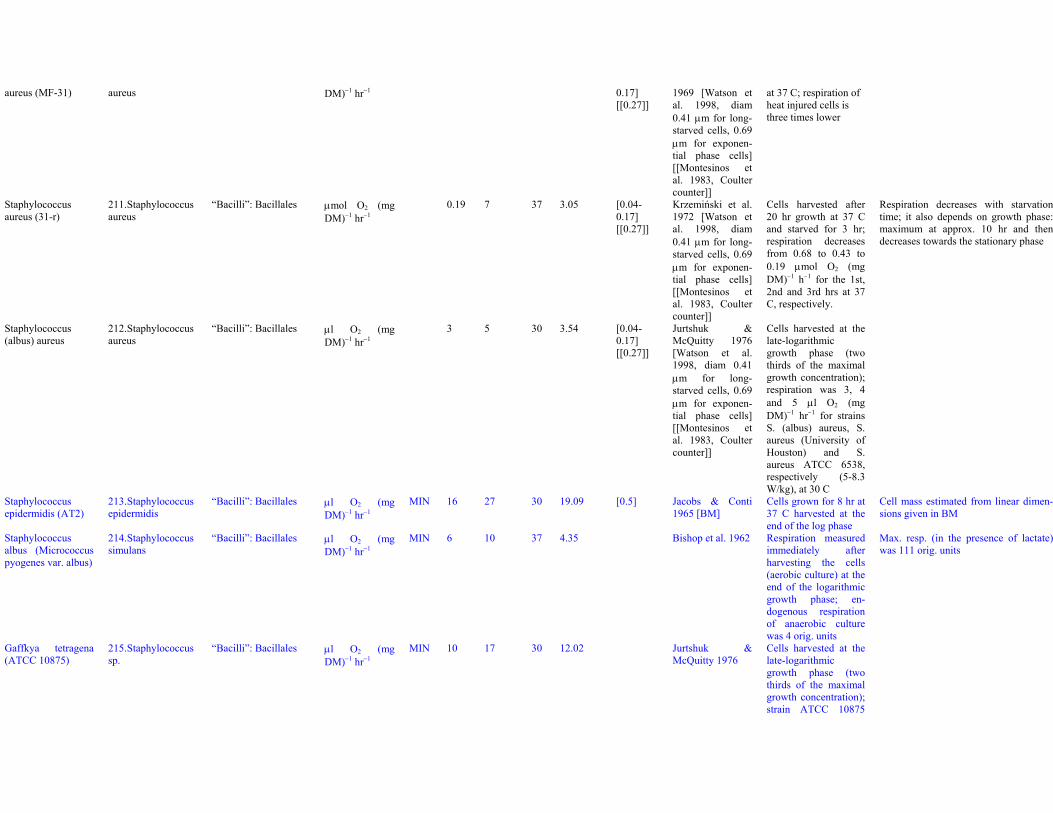
aureus (MF-31) aureus DM)−1 hr−1 0.17][[0.27]]
1969 [Watson etal. 1998, diam0.41 μm for long-starved cells, 0.69μm for exponen-tial phase cells][[Montesinos etal. 1983, Coultercounter]]
at 37 C; respiration ofheat injured cells isthree times lower
Staphylococcusaureus (31-r)
211. Staphylococcusaureus
“Bacilli”: Bacillales μmol O2 (mgDM)−1 hr−1
0.19 7 37 3.05 [0.04-0.17][[0.27]]
Krzemiński et al.1972 [Watson etal. 1998, diam0.41 μm for long-starved cells, 0.69μm for exponen-tial phase cells][[Montesinos etal. 1983, Coultercounter]]
Cells harvested after20 hr growth at 37 Cand starved for 3 hr;respiration decreasesfrom 0.68 to 0.43 to0.19 μmol O2 (mgDM)−1 h−1 for the 1st,2nd and 3rd hrs at 37C, respectively.
Respiration decreases with starvationtime; it also depends on growth phase:maximum at approx. 10 hr and thendecreases towards the stationary phase
Staphylococcus(albus) aureus
212. Staphylococcusaureus
“Bacilli”: Bacillales μl O2 (mgDM)−1 hr−1
3 5 30 3.54 [0.04-0.17][[0.27]]
Jurtshuk &McQuitty 1976[Watson et al.1998, diam 0.41μm for long-starved cells, 0.69μm for exponen-tial phase cells][[Montesinos etal. 1983, Coultercounter]]
Cells harvested at thelate-logarithmicgrowth phase (twothirds of the maximalgrowth concentration);respiration was 3, 4and 5 μl O2 (mgDM)−1 hr−1 for strainsS. (albus) aureus, S.aureus (University ofHouston) and S.aureus ATCC 6538,respectively (5-8.3W/kg), at 30 C
Staphylococcusepidermidis (AT2)
213. Staphylococcusepidermidis
“Bacilli”: Bacillales μl O2 (mgDM)−1 hr−1
MIN 16 27 30 19.09 [0.5] Jacobs & Conti1965 [BM]
Cells grown for 8 hr at37 C harvested at theend of the log phase
Cell mass estimated from linear dimen-sions given in BM
Staphylococcusalbus (Micrococcuspyogenes var. albus)
214. Staphylococcussimulans
“Bacilli”: Bacillales μl O2 (mgDM)−1 hr−1
MIN 6 10 37 4.35 Bishop et al. 1962 Respiration measuredimmediately afterharvesting the cells(aerobic culture) at theend of the logarithmicgrowth phase; en-dogenous respirationof anaerobic culturewas 4 orig. units
Max. resp. (in the presence of lactate)was 111 orig. units
Gaffkya tetragena(ATCC 10875)
215. Staphylococcussp.
“Bacilli”: Bacillales μl O2 (mgDM)−1 hr−1
MIN 10 17 30 12.02 Jurtshuk &McQuitty 1976
Cells harvested at thelate-logarithmicgrowth phase (twothirds of the maximalgrowth concentration);strain ATCC 10875
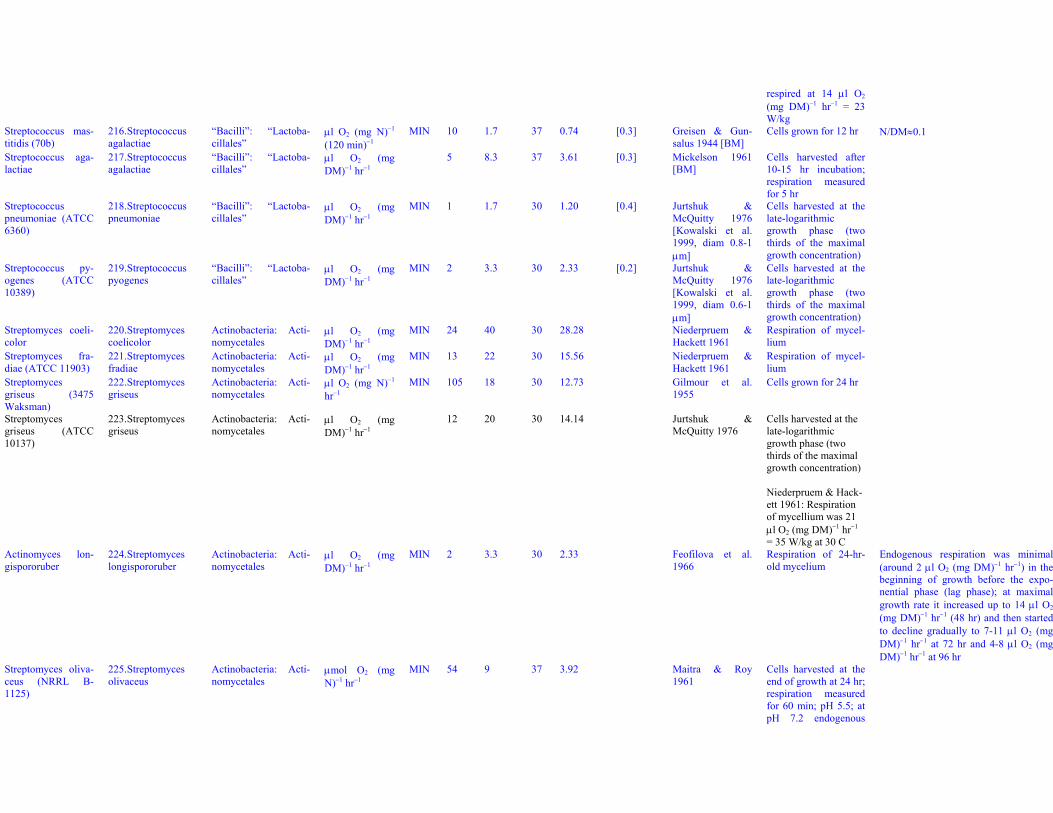
respired at 14 μl O2
(mg DM)−1 hr−1 = 23W/kg
Streptococcus mas-titidis (70b)
216. Streptococcusagalactiae
“Bacilli”: “Lactoba-cillales”
μl O2 (mg N)−1
(120 min)−1MIN 10 1.7 37 0.74 [0.3] Greisen & Gun-
salus 1944 [BM]Cells grown for 12 hr N/DM≈0.1
Streptococcus aga-lactiae
217. Streptococcusagalactiae
“Bacilli”: “Lactoba-cillales”
μl O2 (mgDM)−1 hr−1
5 8.3 37 3.61 [0.3] Mickelson 1961[BM]
Cells harvested after10-15 hr incubation;respiration measuredfor 5 hr
Streptococcuspneumoniae (ATCC6360)
218. Streptococcuspneumoniae
“Bacilli”: “Lactoba-cillales”
μl O2 (mgDM)−1 hr−1
MIN 1 1.7 30 1.20 [0.4] Jurtshuk &McQuitty 1976[Kowalski et al.1999, diam 0.8-1μm]
Cells harvested at thelate-logarithmicgrowth phase (twothirds of the maximalgrowth concentration)
Streptococcus py-ogenes (ATCC10389)
219. Streptococcuspyogenes
“Bacilli”: “Lactoba-cillales”
μl O2 (mgDM)−1 hr−1
MIN 2 3.3 30 2.33 [0.2] Jurtshuk &McQuitty 1976[Kowalski et al.1999, diam 0.6-1μm]
Cells harvested at thelate-logarithmicgrowth phase (twothirds of the maximalgrowth concentration)
Streptomyces coeli-color
220. Streptomycescoelicolor
Actinobacteria: Acti-nomycetales
μl O2 (mgDM)−1 hr−1
MIN 24 40 30 28.28 Niederpruem &Hackett 1961
Respiration of mycel-lium
Streptomyces fra-diae (ATCC 11903)
221. Streptomycesfradiae
Actinobacteria: Acti-nomycetales
μl O2 (mgDM)−1 hr−1
MIN 13 22 30 15.56 Niederpruem &Hackett 1961
Respiration of mycel-lium
Streptomycesgriseus (3475Waksman)
222. Streptomycesgriseus
Actinobacteria: Acti-nomycetales
μl O2 (mg N)−1
hr−1MIN 105 18 30 12.73 Gilmour et al.
1955Cells grown for 24 hr
Streptomycesgriseus (ATCC10137)
223. Streptomycesgriseus
Actinobacteria: Acti-nomycetales
μl O2 (mgDM)−1 hr−1
12 20 30 14.14 Jurtshuk &McQuitty 1976
Cells harvested at thelate-logarithmicgrowth phase (twothirds of the maximalgrowth concentration)
Niederpruem & Hack-ett 1961: Respirationof mycellium was 21μl O2 (mg DM)−1 hr−1
= 35 W/kg at 30 CActinomyces lon-gispororuber
224. Streptomyceslongispororuber
Actinobacteria: Acti-nomycetales
μl O2 (mgDM)−1 hr−1
MIN 2 3.3 30 2.33 Feofilova et al.1966
Respiration of 24-hr-old mycelium
Endogenous respiration was minimal(around 2 μl O2 (mg DM)−1 hr−1) in thebeginning of growth before the expo-nential phase (lag phase); at maximalgrowth rate it increased up to 14 μl O2
(mg DM)−1 hr−1 (48 hr) and then startedto decline gradually to 7-11 μl O2 (mgDM)−1 hr−1 at 72 hr and 4-8 μl O2 (mgDM)−1 hr−1 at 96 hr
Streptomyces oliva-ceus (NRRL B-1125)
225. Streptomycesolivaceus
Actinobacteria: Acti-nomycetales
μmol O2 (mgN)−1 hr−1
MIN 54 9 37 3.92 Maitra & Roy1961
Cells harvested at theend of growth at 24 hr;respiration measuredfor 60 min; pH 5.5; atpH 7.2 endogenous
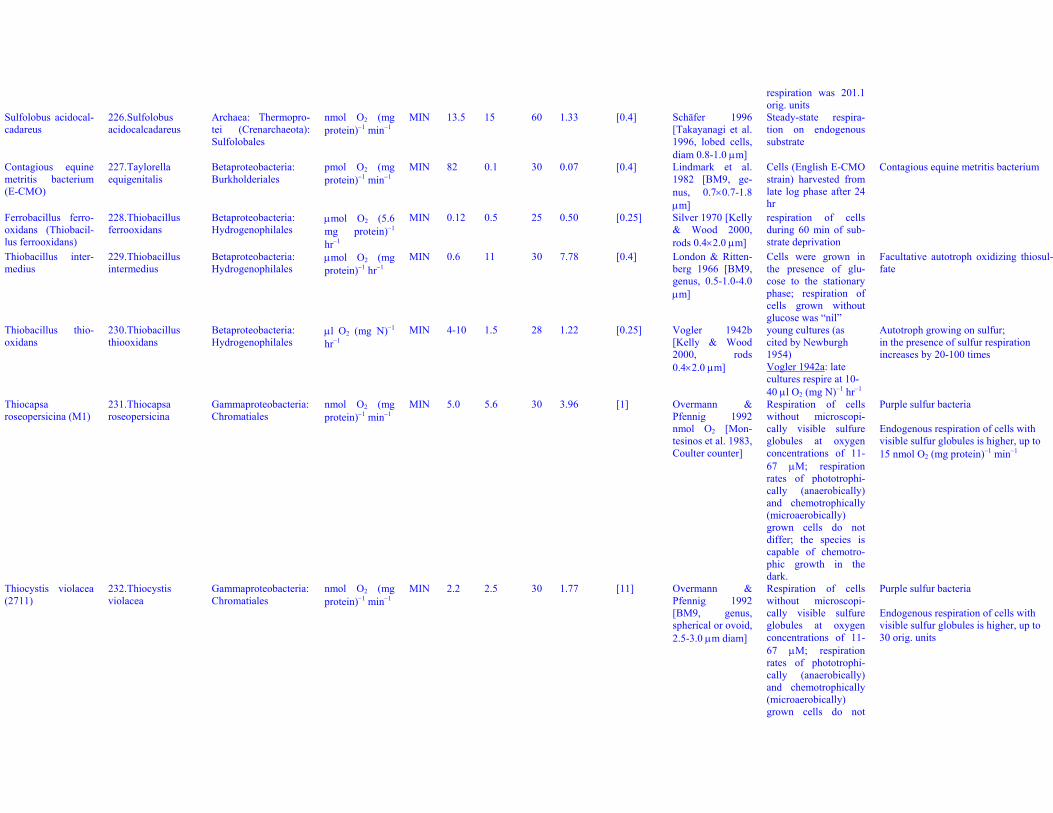
respiration was 201.1orig. units
Sulfolobus acidocal-cadareus
226. Sulfolobusacidocalcadareus
Archaea: Thermopro-tei (Crenarchaeota):Sulfolobales
nmol O2 (mgprotein)−1 min−1
MIN 13.5 15 60 1.33 [0.4] Schäfer 1996[Takayanagi et al.1996, lobed cells,diam 0.8-1.0 μm]
Steady-state respira-tion on endogenoussubstrate
Contagious equinemetritis bacterium(E-CMO)
227. Taylorellaequigenitalis
Betaproteobacteria:Burkholderiales
pmol O2 (mgprotein)−1 min−1
MIN 82 0.1 30 0.07 [0.4] Lindmark et al.1982 [BM9, ge-nus, 0.7×0.7-1.8μm]
Cells (English E-CMOstrain) harvested fromlate log phase after 24hr
Contagious equine metritis bacterium
Ferrobacillus ferro-oxidans (Thiobacil-lus ferrooxidans)
228. Thiobacillusferrooxidans
Betaproteobacteria:Hydrogenophilales
μmol O2 (5.6mg protein)−1
hr−1
MIN 0.12 0.5 25 0.50 [0.25] Silver 1970 [Kelly& Wood 2000,rods 0.4×2.0 μm]
respiration of cellsduring 60 min of sub-strate deprivation
Thiobacillus inter-medius
229. Thiobacillusintermedius
Betaproteobacteria:Hydrogenophilales
μmol O2 (mgprotein)−1 hr−1
MIN 0.6 11 30 7.78 [0.4] London & Ritten-berg 1966 [BM9,genus, 0.5-1.0-4.0μm]
Cells were grown inthe presence of glu-cose to the stationaryphase; respiration ofcells grown withoutglucose was “nil”
Facultative autotroph oxidizing thiosul-fate
Thiobacillus thio-oxidans
230. Thiobacillusthiooxidans
Betaproteobacteria:Hydrogenophilales
μl O2 (mg N)−1
hr−1MIN 4-10 1.5 28 1.22 [0.25] Vogler 1942b
[Kelly & Wood2000, rods0.4×2.0 μm]
young cultures (ascited by Newburgh1954)Vogler 1942a: latecultures respire at 10-40 μl O2 (mg N)−1 hr−1
Autotroph growing on sulfur;in the presence of sulfur respirationincreases by 20-100 times
Thiocapsaroseopersicina (M1)
231. Thiocapsaroseopersicina
Gammaproteobacteria:Chromatiales
nmol O2 (mgprotein)−1 min−1
MIN 5.0 5.6 30 3.96 [1] Overmann &Pfennig 1992nmol O2 [Mon-tesinos et al. 1983,Coulter counter]
Respiration of cellswithout microscopi-cally visible sulfureglobules at oxygenconcentrations of 11-67 μM; respirationrates of phototrophi-cally (anaerobically)and chemotrophically(microaerobically)grown cells do notdiffer; the species iscapable of chemotro-phic growth in thedark.
Purple sulfur bacteria
Endogenous respiration of cells withvisible sulfur globules is higher, up to15 nmol O2 (mg protein)−1 min−1
Thiocystis violacea(2711)
232. Thiocystisviolacea
Gammaproteobacteria:Chromatiales
nmol O2 (mgprotein)−1 min−1
MIN 2.2 2.5 30 1.77 [11] Overmann &Pfennig 1992[BM9, genus,spherical or ovoid,2.5-3.0 μm diam]
Respiration of cellswithout microscopi-cally visible sulfureglobules at oxygenconcentrations of 11-67 μM; respirationrates of phototrophi-cally (anaerobically)and chemotrophically(microaerobically)grown cells do not
Purple sulfur bacteria
Endogenous respiration of cells withvisible sulfur globules is higher, up to30 orig. units
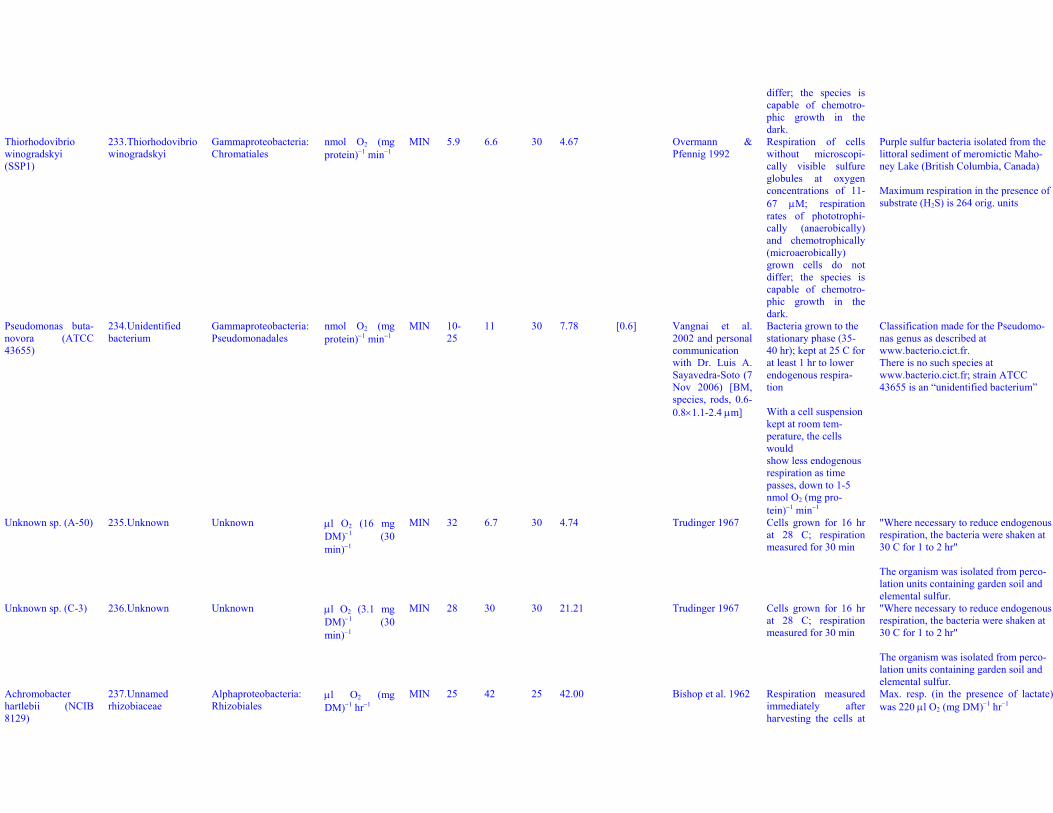
differ; the species iscapable of chemotro-phic growth in thedark.
Thiorhodovibriowinogradskyi(SSP1)
233. Thiorhodovibriowinogradskyi
Gammaproteobacteria:Chromatiales
nmol O2 (mgprotein)−1 min−1
MIN 5.9 6.6 30 4.67 Overmann &Pfennig 1992
Respiration of cellswithout microscopi-cally visible sulfureglobules at oxygenconcentrations of 11-67 μM; respirationrates of phototrophi-cally (anaerobically)and chemotrophically(microaerobically)grown cells do notdiffer; the species iscapable of chemotro-phic growth in thedark.
Purple sulfur bacteria isolated from thelittoral sediment of meromictic Maho-ney Lake (British Columbia, Canada)
Maximum respiration in the presence ofsubstrate (H2S) is 264 orig. units
Pseudomonas buta-novora (ATCC43655)
234. Unidentifiedbacterium
Gammaproteobacteria:Pseudomonadales
nmol O2 (mgprotein)−1 min−1
MIN 10-25
11 30 7.78 [0.6] Vangnai et al.2002 and personalcommunicationwith Dr. Luis A.Sayavedra-Soto (7Nov 2006) [BM,species, rods, 0.6-0.8×1.1-2.4 μm]
Bacteria grown to thestationary phase (35-40 hr); kept at 25 C forat least 1 hr to lowerendogenous respira-tion
With a cell suspensionkept at room tem-perature, the cellswouldshow less endogenousrespiration as timepasses, down to 1-5nmol O2 (mg pro-tein)−1 min−1
Classification made for the Pseudomo-nas genus as described atwww.bacterio.cict.fr.There is no such species atwww.bacterio.cict.fr; strain ATCC43655 is an “unidentified bacterium”
Unknown sp. (A-50) 235. Unknown Unknown μl O2 (16 mgDM)−1 (30min)−1
MIN 32 6.7 30 4.74 Trudinger 1967 Cells grown for 16 hrat 28 C; respirationmeasured for 30 min
"Where necessary to reduce endogenousrespiration, the bacteria were shaken at30 C for 1 to 2 hr"
The organism was isolated from perco-lation units containing garden soil andelemental sulfur.
Unknown sp. (C-3) 236. Unknown Unknown μl O2 (3.1 mgDM)−1 (30min)−1
MIN 28 30 30 21.21 Trudinger 1967 Cells grown for 16 hrat 28 C; respirationmeasured for 30 min
"Where necessary to reduce endogenousrespiration, the bacteria were shaken at30 C for 1 to 2 hr"
The organism was isolated from perco-lation units containing garden soil andelemental sulfur.
Achromobacterhartlebii (NCIB8129)
237. Unnamedrhizobiaceae
Alphaproteobacteria:Rhizobiales
μl O2 (mgDM)−1 hr−1
MIN 25 42 25 42.00 Bishop et al. 1962 Respiration measuredimmediately afterharvesting the cells at
Max. resp. (in the presence of lactate)was 220 μl O2 (mg DM)−1 hr−1
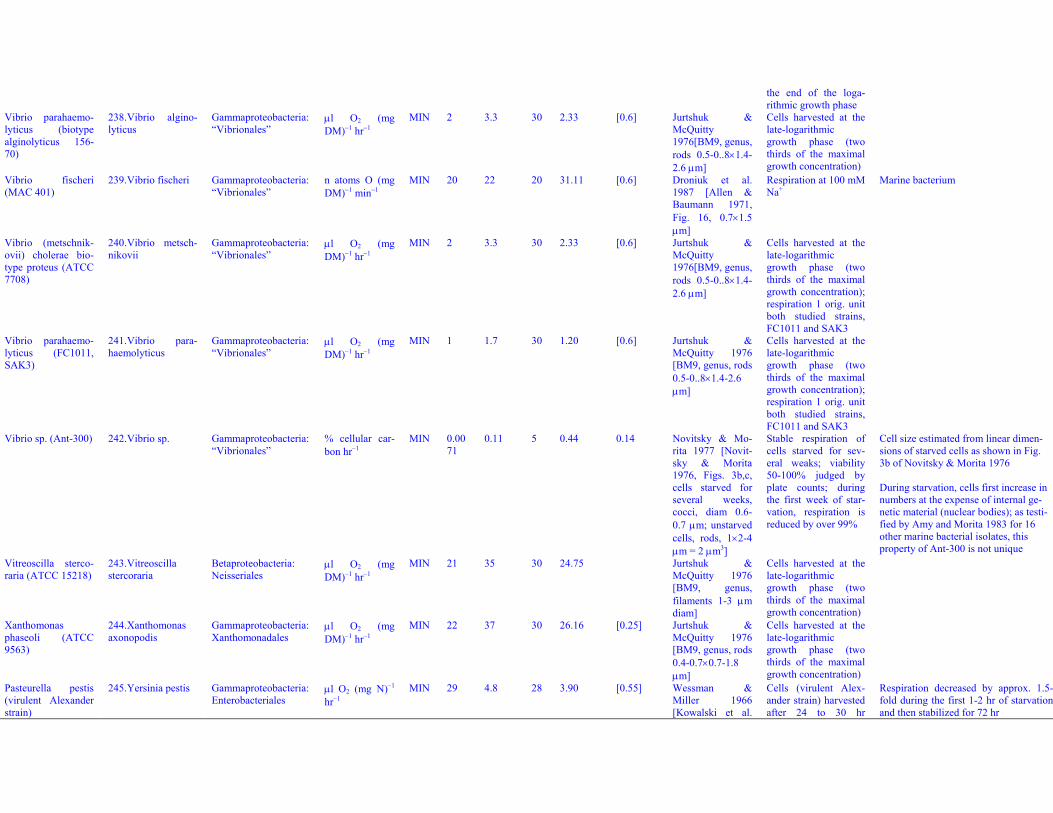
the end of the loga-rithmic growth phase
Vibrio parahaemo-lyticus (biotypealginolyticus 156-70)
238. Vibrio algino-lyticus
Gammaproteobacteria:“Vibrionales”
μl O2 (mgDM)−1 hr−1
MIN 2 3.3 30 2.33 [0.6] Jurtshuk &McQuitty1976[BM9, genus,rods 0.5-0..8×1.4-2.6 μm]
Cells harvested at thelate-logarithmicgrowth phase (twothirds of the maximalgrowth concentration)
Vibrio fischeri(MAC 401)
239. Vibrio fischeri Gammaproteobacteria:“Vibrionales”
n atoms O (mgDM)−1 min−1
MIN 20 22 20 31.11 [0.6] Droniuk et al.1987 [Allen &Baumann 1971,Fig. 16, 0.7×1.5μm]
Respiration at 100 mMNa+
Marine bacterium
Vibrio (metschnik-ovii) cholerae bio-type proteus (ATCC7708)
240. Vibrio metsch-nikovii
Gammaproteobacteria:“Vibrionales”
μl O2 (mgDM)−1 hr−1
MIN 2 3.3 30 2.33 [0.6] Jurtshuk &McQuitty1976[BM9, genus,rods 0.5-0..8×1.4-2.6 μm]
Cells harvested at thelate-logarithmicgrowth phase (twothirds of the maximalgrowth concentration);respiration 1 orig. unitboth studied strains,FC1011 and SAK3
Vibrio parahaemo-lyticus (FC1011,SAK3)
241. Vibrio para-haemolyticus
Gammaproteobacteria:“Vibrionales”
μl O2 (mgDM)−1 hr−1
MIN 1 1.7 30 1.20 [0.6] Jurtshuk &McQuitty 1976[BM9, genus, rods0.5-0..8×1.4-2.6μm]
Cells harvested at thelate-logarithmicgrowth phase (twothirds of the maximalgrowth concentration);respiration 1 orig. unitboth studied strains,FC1011 and SAK3
Vibrio sp. (Ant-300) 242. Vibrio sp. Gammaproteobacteria:“Vibrionales”
% cellular car-bon hr−1
MIN 0.0071
0.11 5 0.44 0.14 Novitsky & Mo-rita 1977 [Novit-sky & Morita1976, Figs. 3b,c,cells starved forseveral weeks,cocci, diam 0.6-0.7 μm; unstarvedcells, rods, 1×2-4μm = 2 μm3]
Stable respiration ofcells starved for sev-eral weaks; viability50-100% judged byplate counts; duringthe first week of star-vation, respiration isreduced by over 99%
Cell size estimated from linear dimen-sions of starved cells as shown in Fig.3b of Novitsky & Morita 1976
During starvation, cells first increase innumbers at the expense of internal ge-netic material (nuclear bodies); as testi-fied by Amy and Morita 1983 for 16other marine bacterial isolates, thisproperty of Ant-300 is not unique
Vitreoscilla sterco-raria (ATCC 15218)
243. Vitreoscillastercoraria
Betaproteobacteria:Neisseriales
μl O2 (mgDM)−1 hr−1
MIN 21 35 30 24.75 Jurtshuk &McQuitty 1976[BM9, genus,filaments 1-3 μmdiam]
Cells harvested at thelate-logarithmicgrowth phase (twothirds of the maximalgrowth concentration)
Xanthomonasphaseoli (ATCC9563)
244. Xanthomonasaxonopodis
Gammaproteobacteria:Xanthomonadales
μl O2 (mgDM)−1 hr−1
MIN 22 37 30 26.16 [0.25] Jurtshuk &McQuitty 1976[BM9, genus, rods0.4-0.7×0.7-1.8μm]
Cells harvested at thelate-logarithmicgrowth phase (twothirds of the maximalgrowth concentration)
Pasteurella pestis(virulent Alexanderstrain)
245. Yersinia pestis Gammaproteobacteria:Enterobacteriales
μl O2 (mg N)−1
hr−1MIN 29 4.8 28 3.90 [0.55] Wessman &
Miller 1966[Kowalski et al.
Cells (virulent Alex-ander strain) harvestedafter 24 to 30 hr
Respiration decreased by approx. 1.5-fold during the first 1-2 hr of starvationand then stabilized for 72 hr

1999, 0.5-1×1-2μm]
growth; stable respira-tion after 1.5 hr ofstarvation
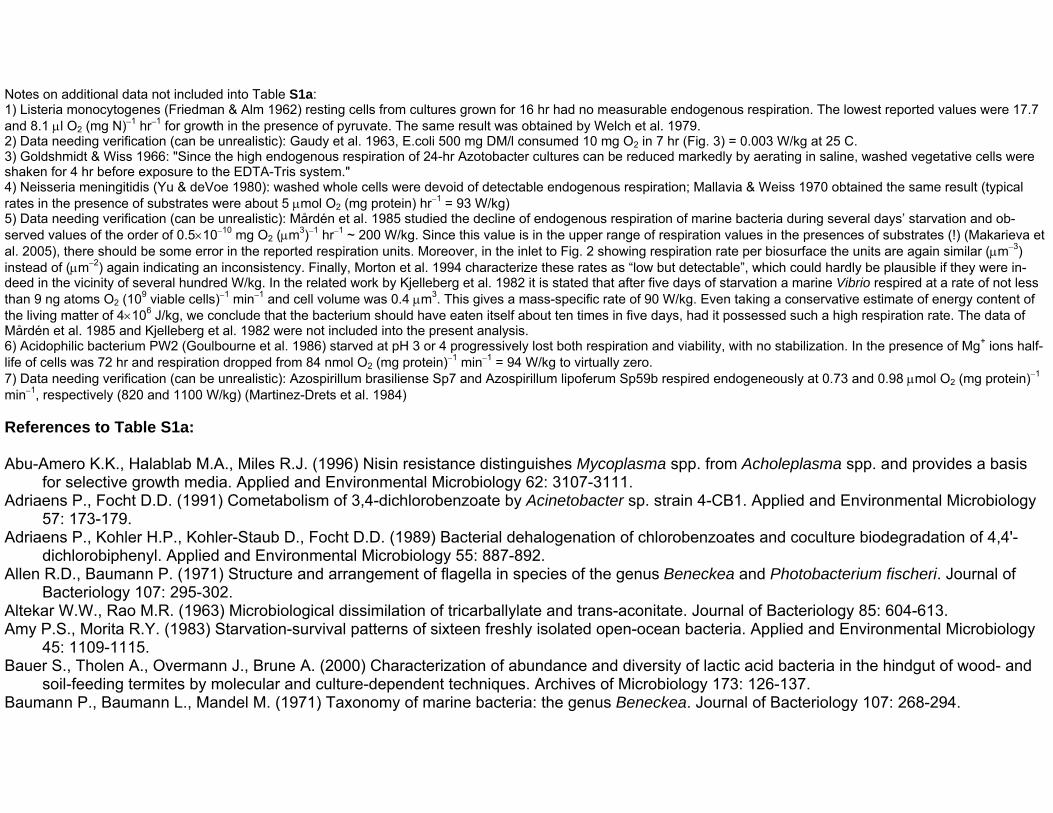
Notes on additional data not included into Table S1a:1) Listeria monocytogenes (Friedman & Alm 1962) resting cells from cultures grown for 16 hr had no measurable endogenous respiration. The lowest reported values were 17.7and 8.1 μl O2 (mg N)−1 hr−1 for growth in the presence of pyruvate. The same result was obtained by Welch et al. 1979.2) Data needing verification (can be unrealistic): Gaudy et al. 1963, E.coli 500 mg DM/l consumed 10 mg O2 in 7 hr (Fig. 3) = 0.003 W/kg at 25 C.3) Goldshmidt & Wiss 1966: "Since the high endogenous respiration of 24-hr Azotobacter cultures can be reduced markedly by aerating in saline, washed vegetative cells wereshaken for 4 hr before exposure to the EDTA-Tris system."4) Neisseria meningitidis (Yu & deVoe 1980): washed whole cells were devoid of detectable endogenous respiration; Mallavia & Weiss 1970 obtained the same result (typicalrates in the presence of substrates were about 5 μmol O2 (mg protein) hr−1 = 93 W/kg)5) Data needing verification (can be unrealistic): Mårdén et al. 1985 studied the decline of endogenous respiration of marine bacteria during several days’ starvation and ob-served values of the order of 0.5×10⁻¹⁰ mg O2 (μm3)−1 hr−1 ~ 200 W/kg. Since this value is in the upper range of respiration values in the presences of substrates (!) (Makarieva etal. 2005), there should be some error in the reported respiration units. Moreover, in the inlet to Fig. 2 showing respiration rate per biosurface the units are again similar (μm−3)instead of (μm−2) again indicating an inconsistency. Finally, Morton et al. 1994 characterize these rates as “low but detectable”, which could hardly be plausible if they were in-deed in the vicinity of several hundred W/kg. In the related work by Kjelleberg et al. 1982 it is stated that after five days of starvation a marine Vibrio respired at a rate of not lessthan 9 ng atoms O2 (109 viable cells)−1 min−1 and cell volume was 0.4 μm3. This gives a mass-specific rate of 90 W/kg. Even taking a conservative estimate of energy content ofthe living matter of 4×10⁶ J/kg, we conclude that the bacterium should have eaten itself about ten times in five days, had it possessed such a high respiration rate. The data ofMårdén et al. 1985 and Kjelleberg et al. 1982 were not included into the present analysis.6) Acidophilic bacterium PW2 (Goulbourne et al. 1986) starved at pH 3 or 4 progressively lost both respiration and viability, with no stabilization. In the presence of Mg+ ions half-life of cells was 72 hr and respiration dropped from 84 nmol O2 (mg protein)−1 min−1 = 94 W/kg to virtually zero.7) Data needing verification (can be unrealistic): Azospirillum brasiliense Sp7 and Azospirillum lipoferum Sp59b respired endogeneously at 0.73 and 0.98 μmol O2 (mg protein)−1
min−1, respectively (820 and 1100 W/kg) (Martinez-Drets et al. 1984)
References to Table S1a:
Abu-Amero K.K., Halablab M.A., Miles R.J. (1996) Nisin resistance distinguishes Mycoplasma spp. from Acholeplasma spp. and provides a basisfor selective growth media. Applied and Environmental Microbiology 62: 3107-3111.
Adriaens P., Focht D.D. (1991) Cometabolism of 3,4-dichlorobenzoate by Acinetobacter sp. strain 4-CB1. Applied and Environmental Microbiology57: 173-179.
Adriaens P., Kohler H.P., Kohler-Staub D., Focht D.D. (1989) Bacterial dehalogenation of chlorobenzoates and coculture biodegradation of 4,4'-dichlorobiphenyl. Applied and Environmental Microbiology 55: 887-892.
Allen R.D., Baumann P. (1971) Structure and arrangement of flagella in species of the genus Beneckea and Photobacterium fischeri. Journal ofBacteriology 107: 295-302.
Altekar W.W., Rao M.R. (1963) Microbiological dissimilation of tricarballylate and trans-aconitate. Journal of Bacteriology 85: 604-613.Amy P.S., Morita R.Y. (1983) Starvation-survival patterns of sixteen freshly isolated open-ocean bacteria. Applied and Environmental Microbiology
45: 1109-1115.Bauer S., Tholen A., Overmann J., Brune A. (2000) Characterization of abundance and diversity of lactic acid bacteria in the hindgut of wood- and
soil-feeding termites by molecular and culture-dependent techniques. Archives of Microbiology 173: 126-137.Baumann P., Baumann L., Mandel M. (1971) Taxonomy of marine bacteria: the genus Beneckea. Journal of Bacteriology 107: 268-294.
Baumann P., Doudoroff M., Stanier R.Y. (1968) Study of the Moraxella Group. I. Genus Moraxella and the Neisseria catarrhalis group. Journal ofBacteriology 95: 58-73.
Berg I.A., Filatova L.V., Ivanovsky R.N. (2002) Inhibition of acetate and propionate assimilation by itaconate via propionyl-CoA carboxylase in iso-citrate lyase-negative purple bacterium Rhodospirillum rubrum. FEMS Microbiology Letters 216: 49-54.
Biberstein E.L., Spencer P.D. (1962) Oxidative metabolism of Haemophilus species grown at different levels of hemin supplementation. Journal ofBacteriology 84: 916-920.
Bishop D.H., Pandya K.P., King H.K. (1962) Ubiquinone and vitamin K in bacteria. Biochemical Journal 83: 606-614.Bisset K.A. (1953) Do bacteria have mitotic spindles, fusion tubes and mitochondria? Journal of General Microbiology 8: 50-57.Blizzard J.L., Peterson G.E. (1963) Selective inhibition of proline-induced pigmentation in washed cells of Serratia marcescens. Journal of Bacteri-
ology 85: 1136-1140.Bluhm L., Ordal Z.J. (1969) Effect of sublethal heat on the metabolic activity of Staphylococcus aureus. Journal of Bacteriology 97: 140-150.Bohach G.A., Snyder I.S. (1983) Cyanobacterial stimulation of growth and oxygen uptake by Legionella pneumophila. Applied and Environmental
Microbiology 46: 528-531.Bohin J.P., Rigomier D., Schaeffer P. (1976) Ethanol sensitivity of sporulation in Bacillus subtilis: a new tool for the analysis of the sporulation proc-
ess. Journal of Bacteriology 127: 934-940.Bongers L. (1970) Energy generation and utilization in hydrogen bacteria. Journal of Bacteriology 104: 145-151.Boylen C.W. (1973) Survival of Arthrobacter crystallopoietes during prolonged periods of extreme desiccation. Journal of Bacteriology 113: 33-37.Boylen C.W., Ensign J.C. (1970) Intracellular substrates for endogenous metabolism during long-term starvation of rod and spherical cells of Ar-
throbacter crystallopoietes. Journal of Bacteriology 103: 578-587.Breznak J.A., Potrikus C.J., Pfennig N., Ensign J.C. (1978) Viability and endogenous substrates used during starvation survival of Rhodospirillum
rubrum. Journal of Bacteriology 134: 381-388.Bruheim P., Bredholt H., Eimhjellen K. (1999) Effects of surfactant mixtures, including Corexit 9527, on bacterial oxidation of acetate and alkanes in
crude oil. Applied and Environmental Microbiology 65: 1658-1661.Bryan-Jones D.G., Whittenbury R. (1969) Haematin-dependent oxidative phosphorylation in Streptococcus faecalis. Journal of General Microbiol-
ogy 58: 247-260.Burleigh I.G., Dawes E.A. (1967) Studies on the endogenous metabolism and senescence of starved Sarcina lutea. Biochemical Journal 102: 236-
250.Buswell J.A. (1975) Metabolism of phenol and cresols by Bacillus stearothermophilus. Journal of Bacteriology 124: 1077-1083.Cain R.B., Tranter E.K., Darrah J.A. (1968) The utilization of some halogenated aromatic acids by Nocardia. Oxidation and metabolism. Journal of
Bacteriology 106: 211-227.Cartwright N.J., Cain R.B. Bacterial degradation of the nitrobenzoic acids. Biochemical Journal 71: 248-261.Chakrabarty A.M., Roy S.C. (1964) Nature of endogenous reserve material in a strain of Pseudomonas fluorescens-putida intermediate. Biochemi-
cal Journal 92: 105-112.
Chapman P.J., Ribbons D.W. (1976) Metabolism of resorcinylic compounds by bacteria: alternative pathways for resorcinol catabolism in Pseu-domonas putida. Journal of Bacteriology 125: 985-998.
Chester B., Cooper L.H. (1979) Achromobacter species (CDC group Vd): morphological and biochemical characterization. Journal of Clinical Micro-biology 9: 425-436.
Cho H.W., Eagon R.G. (1967) Factors affecting the pathways of glucose catabolism and the tricarboxylic acid cycle in Pseudomonas natriegens.Journal of Bacteriology 93: 866-873.
Church B.D., Halvorson H. (1957) Intermediate metabolism of aerobic spores: I. Activation of glucose oxidation in spores of Bacillus cereus var ter-minalis. Journal of Bacteriology 73: 470-476.
Clifton C.E., Cherry J. (1966) Influence of glutamic acid on the endogenous respiration of Bacillus subtilis. Journal of Bacteriology 91: 546-550.Conn H.J., Dimmick I.J. (1947) Soil bacteria similar in morphology to Mycobacterium and Corynebacterium. Journal of Bacteriology 54: 291-303.
Luscombe B.M., Gray T.R.G. (1974) Characteristics of Arthrobacter grown in continuous culture. Journal of General Microbiology 82: 213-222.Cooper R.A., Itiaba K., Kornberg H.L. (1965) The utilization of aconate and itaconate by Micrococcus sp. Biochemical Journal 94: 25-31.Cooper R.A., Kornberg H.L. (1964) The utilization of itaconate by Pseudomonas sp. Biochemical Journal 91: 82-91.Coulter C., Hamilton J.T., McRoberts W.C., Kulakov L., Larkin M.J., Harper D.B. (1999) Halomethane:bisulfide/halide ion methyltransferase, an un-
usual corrinoid enzyme of environmental significance isolated from an aerobic methylotroph using chloromethane as the sole carbon source.Applied and Environmental Microbiology 65: 4301-4312.
Crawford I.P. (1954) A new fermentative pseudomonad, Pseudomonas formicans, n. sp. Journal of Bacteriology 68: 734-738.Crook P.G. (1952) The effect of heat and glucose on endogenous endospore respiration utilizing a modified Scholander microrespirometer. Journal
of Bacteriology 63: 193-198.Dagley S., Gibson D.T. (1965) The bacterial degradation of catechol. Biochemical Journal 95: 466-474.Davis M.S., Bateman J.B. (1960) Relative humidity and the killing of bacteria II. Selective changes in oxidative activity associated with death. Jour-
nal of Bacteriology 80: 580-584.Dawes E.A., Holms W.H. (1958) Metabolism of Sarcina lutea I. Carbohydrate oxidation and terminal respiration. Journal of Bacteriology 75: 390-
399.Dawes E.A., Ribbons D.W. (1965) Studies on the endogenous metabolism of Escherichia coli. Biochemical Journal 95: 332-343.Dawson M.J., Jones C.W. (1981) Respiration-linked proton translocation in the obligate methylotroph Methylophilus methylotrophus. Journal of Bio-
chemical Journal 194: 915-924.De Ley J., Schell J. (1959) Oxidation of several substrates by Acetobacter aceti. Journal of Bacteriology 77: 445-451.Decker S.J., Lang D.R. (1977) Bacillus megaterium mutant deficient in membrane-bound adenosine triphosphatase activity. Journal of Bacteriology
131: 98-104.Devi N.A., Kutty R.K., Vasantharajan V.N., Rao P.V.S. (1975) Microbial metabolism of phenolic amines: Degradation of dl-synephrine by an uniden-
tified arthrobacter. Journal of Bacteriology 122: 866-873.Dietrich S.M., Burris R.H. (1967) Effect of exogenous substrates on the endogenous respiration of bacteria. Journal of Bacteriology 93: 1467-1470.
Donnelly M.I., Chapman P.J., Dagley S. (1981) Bacterial degradation of 3,4,5-trimethoxyphenylacetic and 3-ketoglutaric acids. Journal of Bacteriol-ogy 147: 477-481.
Donnelly M.I., Dagley S. (1980) Production of methanol from aromatic acids by Pseudomonas putida. Journal of Bacteriology 142: 916-924.Doudoroff M., Palleroni N.J., MacGee J., Ohara M. (1956) Metabolism of carbohydrates by Pseudomonas saccharophila I. Oxidation of fructose by
intact cells and crude cell-free preparations. Journal of Bacteriology 71: 196-201.Droniuk R., Wong P.T., Wisse G., MacLeod R.A. (1987) Variation in quantitative requirements for Na+ for transport of metabolizable compounds by
the marine bacteria Alteromonas haloplanktis 214 and Vibrio fischeri. Applied and Environmental Microbiology 53: 1487-1495.Dworkin M., Niederpruem D.J. (1964) Electron transport system in vegetative cells and microcysts of Myxococcus xanthus. Journal of Bacteriology
87: 316-322.Eagon R.G. (1962) Pseudomonas natriegens, a marine bacterium with a generation time of less than 10 minutes. Journal of Bacteriology 83: 736-
737.Eisenberg R.C., Butters S.J., Quay S.C., Friedman S.B. (1974) Glucose uptake and phosphorylation in Pseudomonas fluorescens. Journal of Bac-
teriology 120: 147-153.Engelhard W.E., Uyeno S., Pivnick H. (1957) Some modifications of mycobacteria effected with trypsin. Journal of Bacteriology 73: 206-210.Ensign J.C. (1970) Long-term starvation survival of rod and spherical cells of Arthrobacter crystallopoietes. Journal of Bacteriology 103: 569-577.Erlandson A.L. Jr., Ruhl R.F. (1956) Oxidative dissimilation of amino acids and related compounds by Shigella flexneri. Journal of Bacteriology 72:
708-712.Euzéby J.P. (1997) List of bacterial names with standing in nomenclature: a folder available on the Internet. International Journal of Systematic
Bacteriology (List of prokaryotic names with standing in nomenclature. Last full update November 03, 2006. URL: http://www.bacterio.net).Faulkner G., Garduño R.A. (2002) Ultrastructural analysis of differentiation in Legionella pneumophila. Journal of Bacteriology 184: 7025-7041.Feofilova E.P., Lebedeva N.E., Taptykova S.D., Kirillova N.F. (1966) Study on respiration of pigmented and leuco-variants of Actinomyces longispo-
roruber. Mikrobiologija 35: 651-659.Forbes M., Kuck N.A., Peets E.A. (1962) Mode of action of ethambutol. Journal of Bacteriology 84: 1099-1103.Frederick J.J., Corner T.R., Gerhardt P. (1974) Antimicrobial actions of hexachlorophene: inhibition of respiration in Bacillus megaterium. Antimicro-
bial Agents and Chemotherapy 6: 712-721.Friedberg D., Friedberg I. (1976) Membrane-associated, energy-linked reactions in Bdellovibrio bacteriovorus. Journal of Bacteriology 127: 1382-
1388.Friedman M.E., Alm W.L. (1962) Effect of glucose concentration in the growth medium on some metabolic activities of Listeria monocytogenes.
Journal of Bacteriology 84: 375-376.Frustaci J.M., Sangwan I., O'Brian M.R. (1991) Aerobic growth and respiration of a δ-aminolevulinic acid synthase (hemA) mutant of Bradyrhizo-
bium japonicum. Journal of Bacteriology 173: 1145-1150.Fu Y., O’Kelly C., Sieracki M., Distel D.L. (2003) Protistan grazing analysis by flow cytometry using prey labeled by in vivo expression of fluorescent
proteins. Applied and Environmental Microbiology 69: 6848-6855.Gary N.D., Bard R.C. (1952) Effect of nutrition on the growth and metabolism of Bacillus subtilis. Journal of Bacteriology 64: 501-512.

Gaudy A.F. Jr., Gaudy E.T., Komolrit K. (1963) Multicomponent substrate utilization by natural populations and a pure culture of Escherichia coli.Applied Microbiology 11: 157-162.
Gerhardt P., Levine H.B., Wilson J.B. (1950) The oxidative dissimilation of amino acids and related compounds by Brucella abortus. Journal ofBacteriology 60: 459-467.
Gilmour C.M., Butterworth E.M., Noble E.P., Wang C.H. (1955) Studies on the biochemistry of the streptomyces I. Terminal oxidative metabolism inStreptomyces griseus. Journal of Bacteriology 69: 719-724.
Goldschmidt M.C., Wyss O. (1966) Chelation effects on Azotobacter cells and cysts. Journal of Bacteriology 91: 120-124.Goulbourne E. Jr., Matin M., Zychlinsky E., Matin A. (1986) Mechanism of ΔpH maintenance in active and inactive cells of an obligately acidophilic
bacterium. Journal of Bacteriology 166: 59-65.Gray C.T. (1952) The respiratory metabolism of murine leprosy bacilli. Journal of Bacteriology 64: 305-313.Greisen E.C., Gunsalus I.C. (1944) An alcohol oxidation system in streptococci which functions without hydrogen peroxide accumulation. Journal of
Bacteriology 48: 515-525.Gronlund A.F., Campbell J.J. (1961) Nitrogenous compounds as substrates for endogenous respiration in microorganisms. Journal of Bacteriology
81: 721-724.Gronlund A.F., Campbell J.J. (1963) Nitrogenous substrates of endogenous respiration in Pseudomonas aeruginosa. Journal of Bacteriology 86:
58-66.Gronlund A.F., Campbell J.J. (1966) Influence of exogenous substrates on the endogenous respiration of Pseudomonas aeruginosa. Journal of
Bacteriology 91: 1577-1581.Groupé V., Pugh L.H., Levine A.S., Herrmann E.C. Jr. (1954) Suppression of certain viral lesions by a microbial product, xerosin, lacking in demon-
strable antiviral properties and produced by Achromobacter xerosis, n. sp. Journal of Bacteriology 68: 10-18.Gunter S.E., Kohn H.I. (1956) Effect of X-rays on the survival of bacteria and yeast II. Relation of cell concentration and endogenous respiration to
sensitivity. Journal of Bacteriology 72: 422-428.Gunter S.E., Kohn H.I. (1956) Effect of X-rays on the survival of bacteria and yeast II. Relation of cell concentration and endogenous respiration to
sensitivity. Journal of Bacteriology 72: 422-428.Hareland W.A., Crawford R.L., Chapman P.J., Dagley S. (1975) Metabolic function and properties of 4-hydroxyphenylacetic acid 1-hydroxylase from
Pseudomonas acidovorans. Journal of Bacteriology 121: 272-285.Harper D.B. (1977) Microbial metabolism of aromatic nitriles. Enzymology of C-N cleavage by Nocardia sp. (Rhodochrous group) N.C.I.B. 11216.
Biochemical Journal 165: 309-319.Hayase N., Yano H., Kudoh E., Tsutsumi C., Ushio K., Miyahara Y., Tanaka S., Katsuhiko N. (2004) Isolation and characterization of poly(butylene
succinate-co-butylene adipate)-degrading microorganism. Journal of Bioscience and Bioengineering 97: 131-133.Hespell R.B., Rosson R.A., Thomashow M.F., Rittenberg S.C. (1973) Respiration of Bdellovibrio bacteriovorus strain 109J and its energy substrates
for intraperiplasmic growth. Journal of Bacteriology 113: 1280-1288.Hoffee P., Englesberg E. (1962) Effect of metabolic activity of the glucose permease of bacterial cells. Proceedings of the National Academy of Sci-
ences USA 48: 1759-1765.
Hollocher T.C., Kumar S., Nicholas D.J. (1982) Respiration-dependent proton translocation in Nitrosomonas europaea and its apparent absence inNitrobacter agilis during inorganic oxidations. Journal of Bacteriology 149: 1013-1020.
Holt J.G. (ed.) (1984, 1986, 1989) Bergey’s Manual of Systematic Bacteriology, Vols. 1-4. Williams & Wilkins, Baltimore.Holt J.G., Krieg N.R., Sneath P.H.A., Staley J.T., Williams S.T. (eds.) (1994) Bergey's Manual of Determinative Bacteriology, Ninth Edition. Williams
& Wilkins, Baltimore.Hou C.I., Gronlund A.F., Campbell J.J. (1966) Influence of phosphate starvation on cultures of Pseudomonas aeruginosa. Journal of Bacteriology
92: 851-855.Huang C.-Y., Garcia J.-L., Patel B.K.C., Cayol J.-L., Baresi L., Mah R.A. (2000) Salinivibrio costicola subsp. vallismortis subsp. nov., a halotolerant
facultative anaerobe from Death Valley, and emended description of Salinivibrio costicola. International Journal of Systematic and EvolutionaryMicrobiology 50: 615-622
Huber T.W., Schuhardt V.T. (1970) Lysostaphin-induced, osmotically fragile Staphylococcus aureus cells. Journal of Bacteriology 103: 116-119.Hughes D.E. (1965) The metabolism of halogen-substituted benzoic acids by Pseudomonas fluorescens. Biochemical Journal 96: 181-188.Hulcher F.H., King K.W. (1958a) Metabolic basis for disaccharide preference in a Cellvibrio. Journal of Bacteriology 76: 571-577.Hulcher F.H., King K.W. (1958b) Disaccharide preference of an aerobic cellulolytic bacterium, Cellvibrio gilvus n. sp. Journal of Bacteriology 76:
565-570.Hunter G.J. (1953) The oxidation of glycerol by mycobacteria. Biochemical Journal 55: 320-328.Ingram M. (1940) The endogenous respiration of Bacillus cereus: III. The changes in the rate of respiration caused by sodium chloride, in relation to
hydrogen-ion concentration. Journal of Bacteriology 40: 683-694.Isenberg H.D., Schatz A., Angrist A.A., Schatz V., Trelawny G.S. (1954) Microbial metabolism of carbamates II.Nitrification of urethan by Strepto-
myces nitrificans. Journal of Bacteriology 68: 5-9.Jacobs N.J., Conti S.F. (1965) Effect of hemin on the formation of the cytochrome system of anaerobically grown Staphylococcus epidermidis.
Journal of Bacteriology 89: 675-679.Jacoby GA. (1964) The induction and repression of amino acid oxidation in Pseudomonas fluorescens. Biochemical Journal 92: 1-8.Jenkins O., Byrom D., Jones D. (1987) Methylophilus: a new genus of methanol-utilizing bacteria. International Journal of Systematic Bacteriology
37: 446-448.Jigami Y., Kawasaki Y., Omori T., Minoda Y. (1979) Coexistence of different pathways in the metabolism of n-propylbenzene by Pseudomonas sp.
Applied and Environmental Microbiology 38: 783-788.Johnson E.J., Sobek J.M., Clifton C.E. (1958) Oxidative assimilation by Azotobacter agilis. Journal of Bacteriology 76: 658-661.Jones A., Turner J.M. (1979) Microbial metabolism of amino alcohols. 1-Aminopropan-2-ol and ethanolamine metabolism via propionaldehyde and
acetaldehyde in a species of Pseudomonas. Biochemical Journal 134: 167-182.Jurtshuk P. Jr., Marcucci O.M., McQuitty D.N. (1975) Tetramethyl-p-phenylenediamine oxidase reaction in Azotobacter vinelandii. Applied Microbi-
ology 30: 951-958.Jurtshuk P. Jr., McQuitty D.N. (1976) Use of a quantitative oxidase test for characterizing oxidative metabolism in bacteria. Applied and Environ-
mental Microbiology 31: 668-679.
Kahn M.E., Gromkova R. (1981) Occurrence of pili on and adhesive properties of Haemophilus parainfluenzae. Journal of Bacteriology 145: 1075-1078.
Kanso S., Greene A.C., Patel B.K.C. (2002) Bacillus subterraneus sp. nov., an iron- and manganese-reducing bacterium from a deep subsurfaceAustralian thermal aquifer. International Journal of Systematic and Evolutionary Microbiology 52: 869-874.
Keevil C.W., Anthony C. (1979) Effect of growth conditions on the involvement of cytochrome c in electron transport, proton translocation and ATPsynthesis in the facultative methylotroph Pseudomonas AM1. Biochemical Journal 182: 71-79.
Kelly D.P., Wood A.P. (2000) Reclassification of some species of Thiobacillus to the newly designated genera Acidithiobacillus gen. nov., Halothio-bacillus gen. nov. and Thermithiobacillus gen. nov. International Journal of Systematic and Evolutionary Microbiology 50: 511-516.
Kenimer E.A., Lapp D.F. (1978) Effects of elected inhibitors on electron transport in Neisseria gonorrhoeae. Journal of Bacteriology 134: 537-545.Kjelleberg S. Humphrey B.A. Marshall K.C. (1982) Effect of interfaces on small, starved marine bacteria. Applied and Environmental Microbiology
43: 1166-1172.Kornberg H.L. (1958) The metabolism of C2 compounds in micro-organisms. 1. The incorporation of 2-14Cacetate by Pseudomonas fluorescens,
and by a Corynebacterium, grown on ammonium acetate. Biochemical Journal 68: 535-542.Kornberg H.L., Gotto A.M. (1961) The metabolism of C2 compounds in micro-organisms. 6. Synthesis of cell constituents from glycollate by Pseu-
domonas sp. Biochemical Journal 78: 69-82.Kornberg H.L., Morris J.G. (1965) The utilization of glycollate by Micrococcus denitrificans: the β-hydroxyaspartate pathway. Biochemical Journal
95: 577-586.Kowalski W., Bahnfleth W., Whittam T. (1999) Filtration of airborne microorganisms: modeling and prediction. ASHRAE Transactions 105: 4-17.Kratz W.A., Myers J. (1955) Photosynthesis and respiration of three blue-green algae. Plant Physiology 30: 275-280.Krieg R. (1976) Biology of the chemoheterotrophic spirilla. Bacteriological Reviews 40: 55-115.Krzemiński Z., Mikucki J., Szarapińska-Kwaszewska J. (1972) Endogenous metabolism of Staphylococcus aureus. Folia Microbiologica 17: 46-54.Kubitschek H.E. (1969) Growth during the bacterial cell cycle: analysis of cell size distribution. Biophysical Journal 9: 792-809.Kumazawa S., Izawa S., Mitsui A. (1983) Proton efflux coupled to dark H2 oxidation in whole cells of a marine sulfur photosynthetic bacterium
(Chromatium sp. strain Miami PBS1071). Journal of Bacteriology 154: 185-191.Kunz D.A., Chapman P.J. (1981) Catabolism of pseudocumene and 3-ethyltoluene by Pseudomonas putida (arvilla) mt-2: evidence for new func-
tions of the TOL (pWWO) plasmid. Journal of Bacteriology 146: 179-191.Kushner D.J., Hamaide F., MacLeod R.A. (1983) Development of salt-resistant active transport in a moderately halophilic bacterium. Journal of
Bacteriology 153: 1163-1171.Lawford H.G., Haddock B.A. (1973) Respiration-driven proton translocation in Escherichia coli. Biochemical Journal 136: 217-220.Lee M., Chandler A.C. (1941) A study of the nature, growth and control of bacteria in cutting compounds. Journal of Bacteriology 41: 373-386.Levine S., Krampitz L.O. (1952) The oxidation of acetone by a soil diphtheroid. Journal of Bacteriology 64: 645-650.Lindmark D.G., Jarroll E.L., Timoney P.J., Shin S.J. (1982) Energy metabolism of the contagious equine metritis bacterium. Infection and Immunity
36: 531-534.Loh W.H.-T. (1984) Intermediary carbon metabolism of Azospirillum braziliense. Journal of Bacteriology 158: 264-268.
London J., Rittenberg S.C. (1966) Effects of organic matter on the growth of Thiobacillus intermedius. Journal of Bacteriology 91: 1062-1069.Lontoh S., DiSpirito A.A., Semrau J.D. (1999) Dichloromethane and trichloroethylene inhibition of methane oxidation by the membrane-associated
methane monooxygenase of Methylosinus trichosporium OB3b. Archives of Microbiology 171: 301-308.Maitra P.K., Roy S.C. (1961) Tricarboxylic acid-cycle activity in Streptomyces olivaceus. Biochemical Journal 79: 446-456.Majtán V., Majtánová Ľ. (1999) The effect of new disinfectant substances on the metabolism of Enterobacter cloacae. International Journal of Anti-
microbial Agents 11: 59-64.Majtán V., Majtánová Ľ., Hoštacká A., Hybenová D., Mlynarčik D. (1995) Effect of quaternary ammonium salts and amine oxides on Pseudomonas
aeruginosa. Microbios 84: 41-51.Makarieva A.M., Gorshkov V.G., Li B.-L. (2005) Energetics of the smallest: Do bacteria breathe at the same rate as whales? Proceedings of the
Royal Society of London, Biological Series 272: 2219-2224.Mallavia L.P., Weiss E. (1970) Catabolic activities of Neisseria meningitidis: Utilization of glutamate. Journal of Bacteriology 101: 127-132.Mårdén P., Tunlid A., Malmcrona-Friberg K., Odham G., Kjelleberg S. (1985) Physiological and morphological changes during short term starvation
of marine bacterial isolates. Archives of Microbiology 142: 326-332.Marquis R.E. (1965) Nature of the bactericidal action of antimycin A for Bacillus megaterium. Journal of Bacteriology 89: 1453-1459.Martinez-Drets G., Del Gallo M., Burpee C., Burris R.H. (1984) Catabolism of carbohydrates and organic acids and expression of nitrogenase by
Azospirilla. Journal of Bacteriology 159: 80-85.Mas J., Pedrós-Alió C., Guerrero R. (1985) Mathematical model for determining the effects of intracytoplasmic inclusions on volume and density of
microorganisms. Journal of Bacteriology 164: 749-756.Mathews M.M., Sistrom W.R. (1959) Intracellular location of carotenoid pigments and some respiratory enzymes in Sarcina lutea. Journal of Bacte-
riology 78: 778-787.McVittie A., Messik F., Zahler S.A. (1962) Developmental biology of Myxococcus. Journal of Bacteriology 84: 546-551.Meagher R.B., McCorkle G.M., Ornston M.K., Ornston L.N. (1972) Inducible uptake system for β-carboxy-cis, cis-muconate in a permeability mutant
of Pseudomonas putida. Journal of Bacteriology 111: 465-473.Mescher M.F., Strominger J.L. (1976) Structural (shape-maintaining) role of the cell surface glycoprotein of Halobacterium salinarium. Proceedings
of the National Academy of Sciences of the United States of America 73: 2687-2691.Mickelson M.N. (1967) Aerobic metabolism of Streptococcus agalactiae. Journal of Bacteriology 94: 184-191.Midwinter G.G., Batt R.D. (1960) Endogenous respiration and oxidative assimilation in Nocardia corallina. Journal of Bacteriology 79: 9-17.Minami K. (1957) Bactericidal action of oleic acid for tubercle bacilli: I. Quantitative and analytical survey of the action. Journal of Bacteriology 73:
338-344.Jayasuriya G.C.N. (1956) The oxidative properties of an oxalate-decomposing organism, Pseudomonas OD1, with particular reference to thesynthesis of citrate from glycollate. Biochemical Journal 64: 469-477.
Mitruka B.M., Costilow R.N., Black S.H., Pepper R.E. (1967) Comparisons of cells, refractile bodies, and spores of Bacillus popilliae. Journal ofBacteriology 94: 759-765.
Montesinos E., Esteve I., Guerrero R. (1983) Comparison between direct methods for determination of microbial cell volume: electron microscopyand electronic particle sizing. Applied and Environmental Microbiology 45: 1651-1658.
Morawski B., Eaton R.W., Rossiter J.T., Guoping S., Griengl H., Ribbons D.W. (1997) 25: 2-Naphthoate catabolic pathway in Burkholderia strain JT1500. Journal of Bacteriology 179: 115-121.
Mori T., Miyata Y., Kohsaka K., Makino M. (1985) Respiration in Mycobacterium leprae. International Journal of Leprosy 53: 600-609.Morton D.S., Oliver J.D. (1994) Induction of carbon starvation-induced proteins in Vibrio vulnificus. Applied and Environmental Microbiology 60:
3653-3659.Nagata T. (1986) Carbon and nitrogen content of natural planktonic bacteria. Applied and Environmental Microbiology 52: 28-32.Nickerson W.J., Sherman F.G. (1952) Metabolic aspects of bacterial growth in the absence of cell division II. Respiration of normal and filamentous
cells of Bacillus cerrus. Journal of Bacteriology 64: 667-678.Niederpruem D.J., Hackett D.P. (1961) Respiratory chain of Streptomyces. Journal of Bacteriology 81: 557-563.Novitsky J.A., Morita R.Y. (1976) Morphological characterization of small cells resulting from nutrient starvation of a pyschrophilic marine vibrio. Ap-
plied and Environmental Microbiology 32: 617-622.Novitsky J.A., Morita R.Y. (1977) Survival of a psychrophilic marine vibrio under long-term nutrient starvation. Applied and Environmental Microbiol-
ogy 33: 635-641.O'Keeffe D.T., Anthony C. (1978) The microbial metabolism of C1 compounds. The stoicheiometry of respiration-driven proton translocation in
Pseudomonas AM1 and in a mutant lacking cytochrome c. Biochemical Journal 170: 561-567.Ougham H.J., Trudgill P.W. (1982) Metabolism of cyclohexaneacetic acid and cyclohexanebutyric acid by Arthrobacter sp. strain CA1. Journal of
Bacteriology 150: 1172-1182.Overmann J., Pfennig N. (1992) Continuous chemotrophic growth and respiration of Chromatiaceae species at low oxygen concentrations. Archives
of Microbiology 158: 59-67.Packer L., Vishniac W. (1955) Chemosynthetic fixation of carbon dioxide and characteristics of hydrogenase in resting cell suspensions of Hydro-
genomonas ruhlandii nov. spec. Journal of Bacteriology 70: 216-223.Palese L.L., Gaballo A., Technikova-Dobrova Z., Labonia N., Abbrescia A., Scacco S., Micelli L., Papa S. (2003) Characterization of plasma mem-
brane respiratory chain and ATPase in the actinomycete Nonomuraea sp. ATCC 39727. FEMS Microbiology Letters 228: 233-239.Yu E.K., DeVoe I.W. (1980) Terminal branching of the respiratory electron transport chain in Neisseria meningitidis. Journal of Bacteriology142: 879-887.
Pan P.H.C. (1971) Lack of distinction between Nitrobacter agilis and Nitrobacter winogradskyi. Journal of Bacteriology 108: 1416-1418.Peel D., Quayle J.R. (1961) Microbial growth on C1 compounds. 1. Isolation and characterization of Pseudomonas AM1. Biochemical Journal 81:
465-469.Pepper R.E., Costilow R.N. (1964) Glucose catabolism by Bacillus popilliae and Bacillus lentimorbus. Journal of Bacteriology 87: 303-310.Peterson J.A. (1970) Cytochrome content of two pseudomonads containing mixed-function oxidase systems. Journal of Bacteriology 103: 714-721.Peterson J.B., LaRue T.A. (1982) Soluble aldehyde dehydrogenase and metabolism of aldehydes by soybean bacteroids. Journal of Bacteriology
151: 1473-1484.

Ramsey H.H. (1962) Endogenous respiration of Staphylococcus aureus. Journal of Bacteriology 83: 507-514.Raymond R.L., Jamison V.W., Hudson J.O. (1967) Microbial hydrocarbon co-oxidation: I. Oxidation of mono- and dicyclic hydrocarbons by soil iso-
lates of the genus Nocardia. Applied Microbiology 15: 857-865.Reed W.M., Dugan P.R. (1979) Study of developmental stages of Methylosinus trichosporium with the aid of fluorescent-antibody staining tech-
niques. Applied and Environmental Microbiology 38: 1179-1183.Rittenberg SC, Shilo M. (1970) Early host damage in the infection cycle of Bdellovibrio bacteriovorus. Journal of Bacteriology 102: 149-160.Robertson J.G., Batt R.D. (1973) Survival of Nocardia corallina and degradation of constituents during starvation. Journal of General Microbiology
78: 109-117.Rogoff M.H. (1962) Chemistry of oxidation of polycyclic aromatic hydrocarbons by soil pseudomonads. Journal of Bacteriology 83: 998-1004.Sabina L.R., Pivnick H. (1956) Oxidation of soluble oil emulsions and emulsifiers by Pseudomonas oleovorans and Pseudomonas formicans. Ap-
plied Microbiology 4: 171-175.Sariaslani F.S., Sudmeier T.J.L., Focht D.D. (1982) Degradation of 3-phenylbutyric acid by Pseudomonas sp. Journal of Bacteriology 152: 411-421.Schatz A., Bovell C. Jr. (1952) Growth and hydrogenase activity of a new bacterium, Hydrogenomonas facilis. Journal of Bacteriology 63: 87-98.Schleper C., Puehler G., Holz I., Gambacorta A., Janekovic D., Santarius U., Klenk H.-P., Zillig W. (1995) Picrophilus gen. nov., fam. nov.: a novel
aerobic, heterotrophic, thermoacidophilic genus and family comprising archaea capable of growth around pH 0. Journal of Bacteriology 177:7050-7059.
Sebek O.K., Barker H.A. (1968) Metabolism of β-methylaspartate by a pseudomonad. Journal of Bacteriology 96: 2094-2098.Segal W., Bloch H. (1956) Biochemical differentiation of Mycobacterium tuberculosis grown in vivo and in vitro. Journal of Bacteriology 72: 132-141.Shaw DR. (1956) Polyol dehydrogenases. 3. Galactitol dehydrogenase and D-iditol dehydrogenase. Biochemical Journal 64: 394-405.Sierra G., Gibbons N.E. (1962) Role and oxidation pathway of poly-β-hydroxybutyric acid in Micrococcus halodenitrificans. Canadian Journal of Mi-
crobiology 8: 255-269.Silver M. (1970) Oxidation of elemental sulfur and sulfur compounds and CO2 fixation by Ferrobacillus ferrooxidans (Thiobacillus thiooxidans). Ca-
nadian Journal of Microbiology 16: 845-848.Smith A., Tranter E.K., Cain R.B. (1968) The utilization of some halogenated aromatic acids by Nocardia. Effects on the growth and enzyme induc-
tion. Journal of Bacteriology 106: 203-209.Smith A.J., Hoare D.S. (1968) Acetate assimilation by Nitrobacter agilis in relation to its "obligate autotrophy". Journal of Bacteriology 95: 844-855.Sobek J.M., Charba J.F., Foust W.N. (1966) Endogenous metabolism of Azotobacter agilis. Journal of Bacteriology 92: 687-695.Sobek J.M., Talburt D.E. (1968) Effects of the rare earth cerium on Escherichia coli. Journal of Bacteriology 95: 47-51.Sorokin D.Y., Jones B.E., Kuenen J.G. (2000) An obligate methylotrophic, methane-oxidizing Methylomicrobium species from a highly alkaline envi-
ronment. Extremophiles 4: 145-155.Sparnins V.L., Chapman P.J. (1976) Catabolism of L-tyrosine by the homoprotocatechuate pathway in gram-positive bacteria. Journal of Bacteriol-
ogy 127: 362-366.Sparnins V.L., Chapman P.J., Dagley S. (1974) Bacterial degradation of 4-hydroxyphenylacetic acid and homoprotocatechuic acid. Journal of Bac-
teriology 120: 159-167.
Spendlove R., Weiser H.H., Harper W.J. (1957) Factors affecting the initiation of respiration of Streptococcus lactis. Applied Microbiology 5: 281-285.
Stevenson J. (1966) The specific requirement for sodium chloride for the active uptake of l-glutamate by Halobacterium salinarium. Journal of Bac-teriology 99: 257-260.
Stokes J.L. (1954) Studies on the filamentous sheathed iron bacterium Sphaerotilus natans. Journal of Bacteriology 67: 278-291.Straley S.C., LaMarre A.G., Lawrence L.J., Conti S.F. (1979) Chemotaxis of Bdellovibrio bacteriovorus toward pure compounds. Journal of Bacteri-
ology 140: 634-642.Subba-Rao R.V., Alexander M. (1977) Products formed from analogues of 1,1,1-trichloro-2,2-bis(p-chlorophenyl)ethane (DDT) metabolites by
Pseudomonas putida. Applied and Environmental Microbiology 33: 101-108.Subba-Rao R.V., Alexander M. (1985) Bacterial and fungal cometabolism of 1,1,1-trichloro-2,2-bis(4-chlorophenyl)ethane (DDT) and its breakdown
products. Applied and Environmental Microbiology 49: 509-516.Takayanagi S., Kawasaki H., Sugimori K., Yamada T., Sugai A., Ito T., Yamasato K., Shioda M. (1996) Sulfolobus hakonensis sp. nov., a novel
species of acidothermophilic archaeon. International Journal of Systematic Bacteriology 46: 377-382.Takeo K., Uesaka I. (1975) Existence of a simple configuration in the wall surface of Nocardia mycellium. Journal of General Microbiology 87: 373-
376.Tappe W., Laverman A., Bohland M., Braster M., Rittershaus S., Groeneweg J., van Verseveld H.W. (1999) Maintenance energy demand and star-
vation recovery dynamics of Nitrosomonas europaea and Nitrobacter winogradskyi cultivated in a retentostat with complete biomass retention.Applied and Environmental Microbiology 65: 2471-2477.
Taylor B.F. (1983) Aerobic and anaerobic catabolism of vanillic acid and some other methoxy-aromatic compounds by Pseudomonas sp. strain PN-1. Applied and Environmental Microbiology 46: 1286-1292.
Tepper B.S. (1968) Differences in the utilization of glycerol and glucose by Mycobacterium phlei. Journal of Bacteriology 95: 1713-1717.Tesh M.J., Morse S.A., Miller R.D. (1983) Intermediary metabolism in Legionella pneumophila: Utilization of amino acids and other compounds as
energy sources. Journal of Bacteriology 154: 1104-1109.Tisa L.S., Ensign J.C. (1987) Isolation and nitrogenase activity of vesicles from Frankia sp. strain EANlpec. Journal of Bacteriology 169: 5054-5059.Tomlinson G.A., Campbell J.J. (1963) Patterns of oxidative assimilation in strains of Pseudomonas and Achromobacter. Journal of Bacteriology 86:
434-444.Tros M.E., Bosma T.N.P., Schraa G., Zehnder A.J.B. (1996) Measurement of minimum substrate concentration (Smin) in a recycling fermentor and
its prediction from the kinetic parameters of Pseudomonas sp. strain B13 from batch and chemostat cultures. Applied and Environmental Mi-crobiology 62: 3655-3661.
Trudinger P.A. (1967) Metabolism of thiosulfate and tetrathionate by heterotrophic bacteria from soil. Journal of Bacteriology 93: 550-559.Tsai J.C., Aladegbami S.L., Vela G.R. (1979) Phosphate-limited culture of Azotobacter vinelandii. Journal of Bacteriology 139: 639-645.Van de Vossenberg J.L.C.M., Driessen A.J.M., Zillig W., Konings W.N. (1998) Bioenergetics and cytoplasmic membrane stability of the extreme
acidophilic thermophilic archaeon Picrophilus oshimae. Extremophiles 2: 67-74.
Van Ginkel C.G., Van Dijk J.B., Kroon A.G.M. (1992) Metabolism of hexadecyltrimethylammonium chloride in Pseudomonas strain B1. Applied andEnvironmental Microbiology 58: 3083-3087.
Van Niel E.W.J., Gottschal J.C. (1998) Oxygen consumption by Desulfovibrio strains with and without polyglucose. Applied and Environmental Mi-crobiology 64: 1034-1039.
Van Veen H.W., Abee T., Kortstee G.J., Konings W.N., Zehnder A.J. (1993) Characterization of two phosphate transport systems in Acinetobacterjohnsonii 210A. Journal of Bacteriology 175: 200-206.
Vangnai A.S., Sayavedra-Soto S.A., Arp D.J. (2002) Roles for the two 1-butanol dehydrogenases of Pseudomonas butanovora in butane and 1-butanol metabolism. Journal of Bacteriology 184: 4343-4350.
Ventosa A., Nieto J.N.J., Oren A. (1998) Biology of moderately halophilic aerobic bacteria. Microbiology and Molecular Biology Reviews 62: 504-544.
Vogler K.G. (1942a) The presence of an endogenous respiration in the autotrophic bacteria. Journal of General Physiology 25: 617-622.Vogler K.G. (1942b) Studies on the metabolism of autotrophic bacteria. II. The nature of the chemosynthetic reaction. Journal of General Physiology
26: 103-117.Walker J.R. (1959) Pyruvate metabolism in Lactobacillus brevis. Biochemical Journal 72: 188-192.Warren R.A., Ells A.F., Campbell J.J. (1960) Endogenous respiration of Pseudomonas aeruginosa. Journal of Bacteriology 79: 875-879.Watson G.K., Cain R.B. (1975) Microbial metabolism of the pyridine ring. Metabolic pathways of pyridine biodegradation by soil bacteria. Biochemi-
cal Journal 146: 157-172.Weinstein I., Guss M.L., Altenbern R.A. (1962) Pyruvate oxidation by Pasteurella tularensis strains of graded virulence. Journal of Bacteriology 83:
1010-1016.Welch D.F., Sword C.P., Brehm S., Dusanic D. (1979) Relationship between superoxide dismutase and pathogenic mechanisms of Listeria mono-
cytogenes. Infection and Immunity 23: 863-872.Wen A., Fegan M., Hayward C., Chakraborty S., Sly L.I. (1999) Phylogenetic relationships among members of the Comamonadaceae, and descrip-
tion of Delftia acidovorans (den Dooren de Jong 1926 and Tamaoka et al. 1987) gen. nov., comb. nov. International Journal of SystematicBacteriology 49: 567-576.
Wessman G.E., Miller D.J. (1966) Biochemical and physical changes in shaken suspensions of Pasteurella pestis. Applied Microbiology 14: 636-642.
White D.C. (1962) Cytochrome and catalase patterns during growth of Haemophilus parainfluenzae. Journal of Bacteriology 83: 851-859.Wieslander A., Nordström S., Dahlqvist A., Rilfors L., Lindblom G. (1987) Membrane lipid composition and cell size of Acholeplasma laidlawii strain
A are strongly influenced by lipid acyl chain length. European Journal of Biochemistry 227: 734-744.Yotis W.W. (1963) Absorption of the antibacterial serum factor by staphylococci. Journal of Bacteriology 85: 911-917.Yotis W.W., Ekstedt R.D. (1959) Studies on staphylococci I. Effect of serum and coagulase on the metabolism of coagulase positive and coagulase
negative strains. Journal of Bacteriology 78: 567-574.Youmans A.S., Youmans G.P. (1962a) Effect of mycosuppressin on the course of experimental tuberculosis in mice. Journal of Bacteriology 84:
701-707.
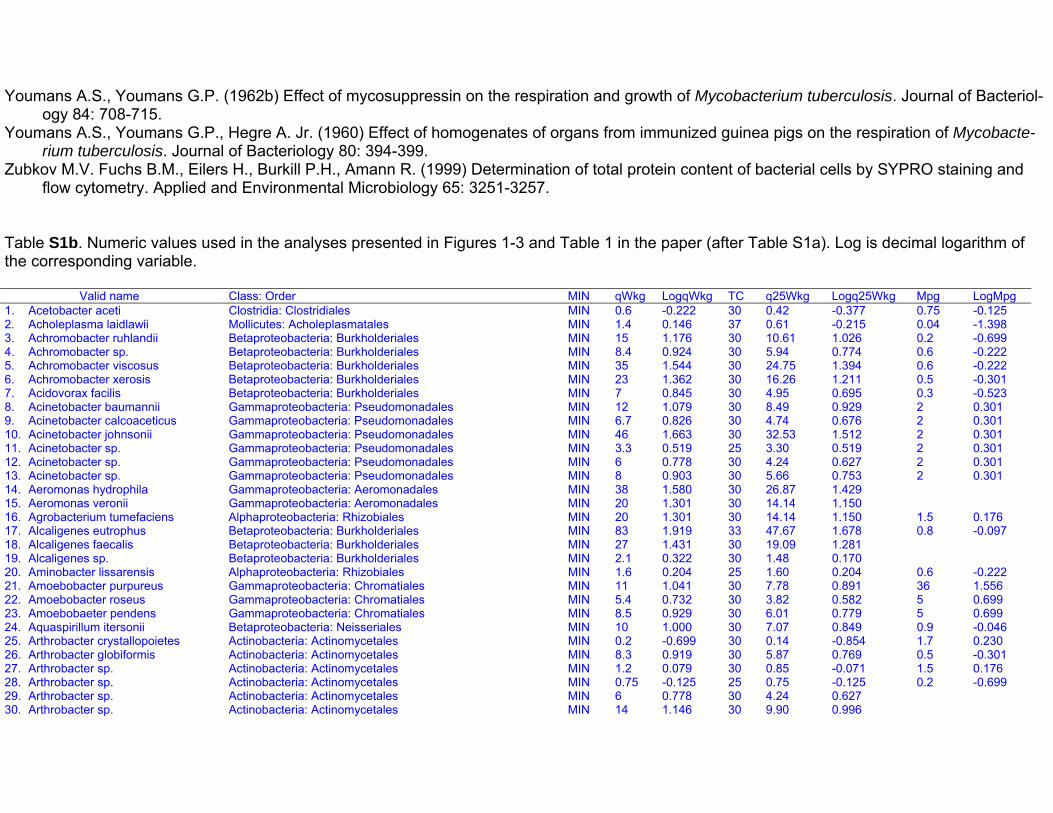
Youmans A.S., Youmans G.P. (1962b) Effect of mycosuppressin on the respiration and growth of Mycobacterium tuberculosis. Journal of Bacteriol-ogy 84: 708-715.
Youmans A.S., Youmans G.P., Hegre A. Jr. (1960) Effect of homogenates of organs from immunized guinea pigs on the respiration of Mycobacte-rium tuberculosis. Journal of Bacteriology 80: 394-399.
Zubkov M.V. Fuchs B.M., Eilers H., Burkill P.H., Amann R. (1999) Determination of total protein content of bacterial cells by SYPRO staining andflow cytometry. Applied and Environmental Microbiology 65: 3251-3257.
Table S1b. Numeric values used in the analyses presented in Figures 1-3 and Table 1 in the paper (after Table S1a). Log is decimal logarithm ofthe corresponding variable.
Valid name Class: Order MIN qWkg LogqWkg TC q25Wkg Logq25Wkg Mpg LogMpg1. Acetobacter aceti Clostridia: Clostridiales MIN 0.6 -0.222 30 0.42 -0.377 0.75 -0.1252. Acholeplasma laidlawii Mollicutes: Acholeplasmatales MIN 1.4 0.146 37 0.61 -0.215 0.04 -1.3983. Achromobacter ruhlandii Betaproteobacteria: Burkholderiales MIN 15 1.176 30 10.61 1.026 0.2 -0.6994. Achromobacter sp. Betaproteobacteria: Burkholderiales MIN 8.4 0.924 30 5.94 0.774 0.6 -0.2225. Achromobacter viscosus Betaproteobacteria: Burkholderiales MIN 35 1.544 30 24.75 1.394 0.6 -0.2226. Achromobacter xerosis Betaproteobacteria: Burkholderiales MIN 23 1.362 30 16.26 1.211 0.5 -0.3017. Acidovorax facilis Betaproteobacteria: Burkholderiales MIN 7 0.845 30 4.95 0.695 0.3 -0.5238. Acinetobacter baumannii Gammaproteobacteria: Pseudomonadales MIN 12 1.079 30 8.49 0.929 2 0.3019. Acinetobacter calcoaceticus Gammaproteobacteria: Pseudomonadales MIN 6.7 0.826 30 4.74 0.676 2 0.30110. Acinetobacter johnsonii Gammaproteobacteria: Pseudomonadales MIN 46 1.663 30 32.53 1.512 2 0.30111. Acinetobacter sp. Gammaproteobacteria: Pseudomonadales MIN 3.3 0.519 25 3.30 0.519 2 0.30112. Acinetobacter sp. Gammaproteobacteria: Pseudomonadales MIN 6 0.778 30 4.24 0.627 2 0.30113. Acinetobacter sp. Gammaproteobacteria: Pseudomonadales MIN 8 0.903 30 5.66 0.753 2 0.30114. Aeromonas hydrophila Gammaproteobacteria: Aeromonadales MIN 38 1.580 30 26.87 1.42915. Aeromonas veronii Gammaproteobacteria: Aeromonadales MIN 20 1.301 30 14.14 1.15016. Agrobacterium tumefaciens Alphaproteobacteria: Rhizobiales MIN 20 1.301 30 14.14 1.150 1.5 0.17617. Alcaligenes eutrophus Betaproteobacteria: Burkholderiales MIN 83 1.919 33 47.67 1.678 0.8 -0.09718. Alcaligenes faecalis Betaproteobacteria: Burkholderiales MIN 27 1.431 30 19.09 1.28119. Alcaligenes sp. Betaproteobacteria: Burkholderiales MIN 2.1 0.322 30 1.48 0.17020. Aminobacter lissarensis Alphaproteobacteria: Rhizobiales MIN 1.6 0.204 25 1.60 0.204 0.6 -0.22221. Amoebobacter purpureus Gammaproteobacteria: Chromatiales MIN 11 1.041 30 7.78 0.891 36 1.55622. Amoebobacter roseus Gammaproteobacteria: Chromatiales MIN 5.4 0.732 30 3.82 0.582 5 0.69923. Amoebobaeter pendens Gammaproteobacteria: Chromatiales MIN 8.5 0.929 30 6.01 0.779 5 0.69924. Aquaspirillum itersonii Betaproteobacteria: Neisseriales MIN 10 1.000 30 7.07 0.849 0.9 -0.04625. Arthrobacter crystallopoietes Actinobacteria: Actinomycetales MIN 0.2 -0.699 30 0.14 -0.854 1.7 0.23026. Arthrobacter globiformis Actinobacteria: Actinomycetales MIN 8.3 0.919 30 5.87 0.769 0.5 -0.30127. Arthrobacter sp. Actinobacteria: Actinomycetales MIN 1.2 0.079 30 0.85 -0.071 1.5 0.17628. Arthrobacter sp. Actinobacteria: Actinomycetales MIN 0.75 -0.125 25 0.75 -0.125 0.2 -0.69929. Arthrobacter sp. Actinobacteria: Actinomycetales MIN 6 0.778 30 4.24 0.62730. Arthrobacter sp. Actinobacteria: Actinomycetales MIN 14 1.146 30 9.90 0.996
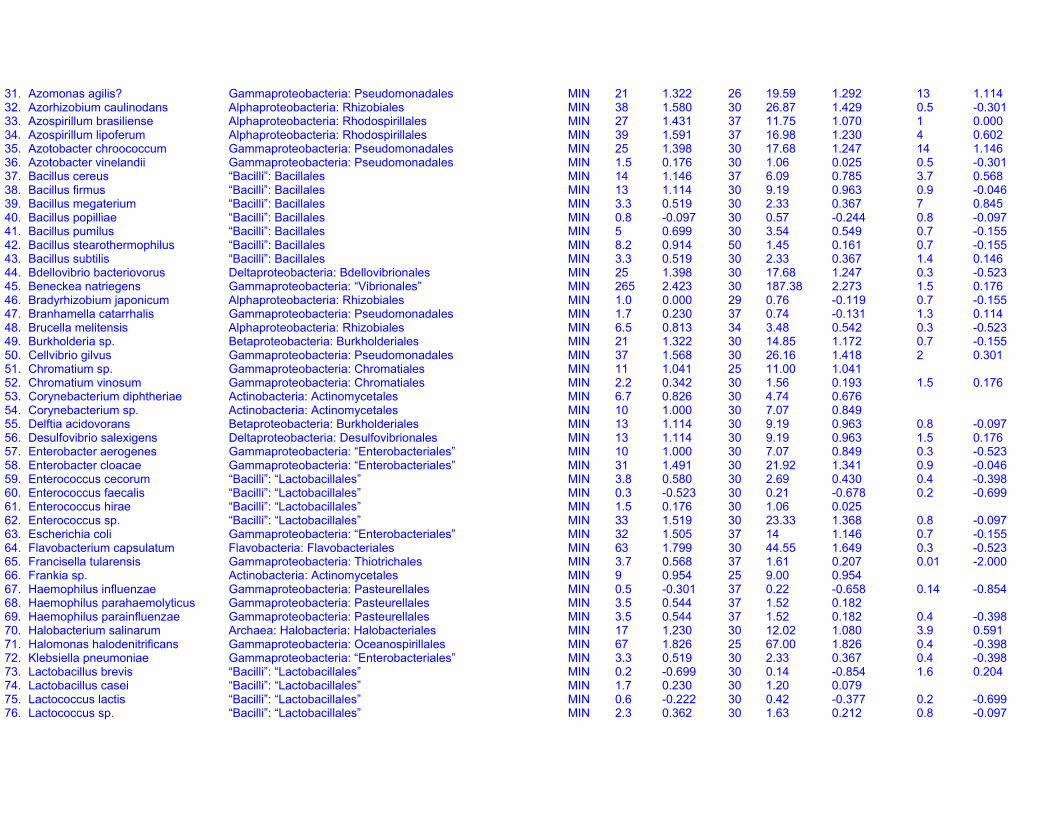
31. Azomonas agilis? Gammaproteobacteria: Pseudomonadales MIN 21 1.322 26 19.59 1.292 13 1.11432. Azorhizobium caulinodans Alphaproteobacteria: Rhizobiales MIN 38 1.580 30 26.87 1.429 0.5 -0.30133. Azospirillum brasiliense Alphaproteobacteria: Rhodospirillales MIN 27 1.431 37 11.75 1.070 1 0.00034. Azospirillum lipoferum Alphaproteobacteria: Rhodospirillales MIN 39 1.591 37 16.98 1.230 4 0.60235. Azotobacter chroococcum Gammaproteobacteria: Pseudomonadales MIN 25 1.398 30 17.68 1.247 14 1.14636. Azotobacter vinelandii Gammaproteobacteria: Pseudomonadales MIN 1.5 0.176 30 1.06 0.025 0.5 -0.30137. Bacillus cereus “Bacilli”: Bacillales MIN 14 1.146 37 6.09 0.785 3.7 0.56838. Bacillus firmus “Bacilli”: Bacillales MIN 13 1.114 30 9.19 0.963 0.9 -0.04639. Bacillus megaterium “Bacilli”: Bacillales MIN 3.3 0.519 30 2.33 0.367 7 0.84540. Bacillus popilliae “Bacilli”: Bacillales MIN 0.8 -0.097 30 0.57 -0.244 0.8 -0.09741. Bacillus pumilus “Bacilli”: Bacillales MIN 5 0.699 30 3.54 0.549 0.7 -0.15542. Bacillus stearothermophilus “Bacilli”: Bacillales MIN 8.2 0.914 50 1.45 0.161 0.7 -0.15543. Bacillus subtilis “Bacilli”: Bacillales MIN 3.3 0.519 30 2.33 0.367 1.4 0.14644. Bdellovibrio bacteriovorus Deltaproteobacteria: Bdellovibrionales MIN 25 1.398 30 17.68 1.247 0.3 -0.52345. Beneckea natriegens Gammaproteobacteria: “Vibrionales” MIN 265 2.423 30 187.38 2.273 1.5 0.17646. Bradyrhizobium japonicum Alphaproteobacteria: Rhizobiales MIN 1.0 0.000 29 0.76 -0.119 0.7 -0.15547. Branhamella catarrhalis Gammaproteobacteria: Pseudomonadales MIN 1.7 0.230 37 0.74 -0.131 1.3 0.11448. Brucella melitensis Alphaproteobacteria: Rhizobiales MIN 6.5 0.813 34 3.48 0.542 0.3 -0.52349. Burkholderia sp. Betaproteobacteria: Burkholderiales MIN 21 1.322 30 14.85 1.172 0.7 -0.15550. Cellvibrio gilvus Gammaproteobacteria: Pseudomonadales MIN 37 1.568 30 26.16 1.418 2 0.30151. Chromatium sp. Gammaproteobacteria: Chromatiales MIN 11 1.041 25 11.00 1.04152. Chromatium vinosum Gammaproteobacteria: Chromatiales MIN 2.2 0.342 30 1.56 0.193 1.5 0.17653. Corynebacterium diphtheriae Actinobacteria: Actinomycetales MIN 6.7 0.826 30 4.74 0.67654. Corynebacterium sp. Actinobacteria: Actinomycetales MIN 10 1.000 30 7.07 0.84955. Delftia acidovorans Betaproteobacteria: Burkholderiales MIN 13 1.114 30 9.19 0.963 0.8 -0.09756. Desulfovibrio salexigens Deltaproteobacteria: Desulfovibrionales MIN 13 1.114 30 9.19 0.963 1.5 0.17657. Enterobacter aerogenes Gammaproteobacteria: “Enterobacteriales” MIN 10 1.000 30 7.07 0.849 0.3 -0.52358. Enterobacter cloacae Gammaproteobacteria: “Enterobacteriales” MIN 31 1.491 30 21.92 1.341 0.9 -0.04659. Enterococcus cecorum “Bacilli”: “Lactobacillales” MIN 3.8 0.580 30 2.69 0.430 0.4 -0.39860. Enterococcus faecalis “Bacilli”: “Lactobacillales” MIN 0.3 -0.523 30 0.21 -0.678 0.2 -0.69961. Enterococcus hirae “Bacilli”: “Lactobacillales” MIN 1.5 0.176 30 1.06 0.02562. Enterococcus sp. “Bacilli”: “Lactobacillales” MIN 33 1.519 30 23.33 1.368 0.8 -0.09763. Escherichia coli Gammaproteobacteria: “Enterobacteriales” MIN 32 1.505 37 14 1.146 0.7 -0.15564. Flavobacterium capsulatum Flavobacteria: Flavobacteriales MIN 63 1.799 30 44.55 1.649 0.3 -0.52365. Francisella tularensis Gammaproteobacteria: Thiotrichales MIN 3.7 0.568 37 1.61 0.207 0.01 -2.00066. Frankia sp. Actinobacteria: Actinomycetales MIN 9 0.954 25 9.00 0.95467. Haemophilus influenzae Gammaproteobacteria: Pasteurellales MIN 0.5 -0.301 37 0.22 -0.658 0.14 -0.85468. Haemophilus parahaemolyticus Gammaproteobacteria: Pasteurellales MIN 3.5 0.544 37 1.52 0.18269. Haemophilus parainfluenzae Gammaproteobacteria: Pasteurellales MIN 3.5 0.544 37 1.52 0.182 0.4 -0.39870. Halobacterium salinarum Archaea: Halobacteria: Halobacteriales MIN 17 1.230 30 12.02 1.080 3.9 0.59171. Halomonas halodenitrificans Gammaproteobacteria: Oceanospirillales MIN 67 1.826 25 67.00 1.826 0.4 -0.39872. Klebsiella pneumoniae Gammaproteobacteria: “Enterobacteriales” MIN 3.3 0.519 30 2.33 0.367 0.4 -0.39873. Lactobacillus brevis “Bacilli”: “Lactobacillales” MIN 0.2 -0.699 30 0.14 -0.854 1.6 0.20474. Lactobacillus casei “Bacilli”: “Lactobacillales” MIN 1.7 0.230 30 1.20 0.07975. Lactococcus lactis “Bacilli”: “Lactobacillales” MIN 0.6 -0.222 30 0.42 -0.377 0.2 -0.69976. Lactococcus sp. “Bacilli”: “Lactobacillales” MIN 2.3 0.362 30 1.63 0.212 0.8 -0.097
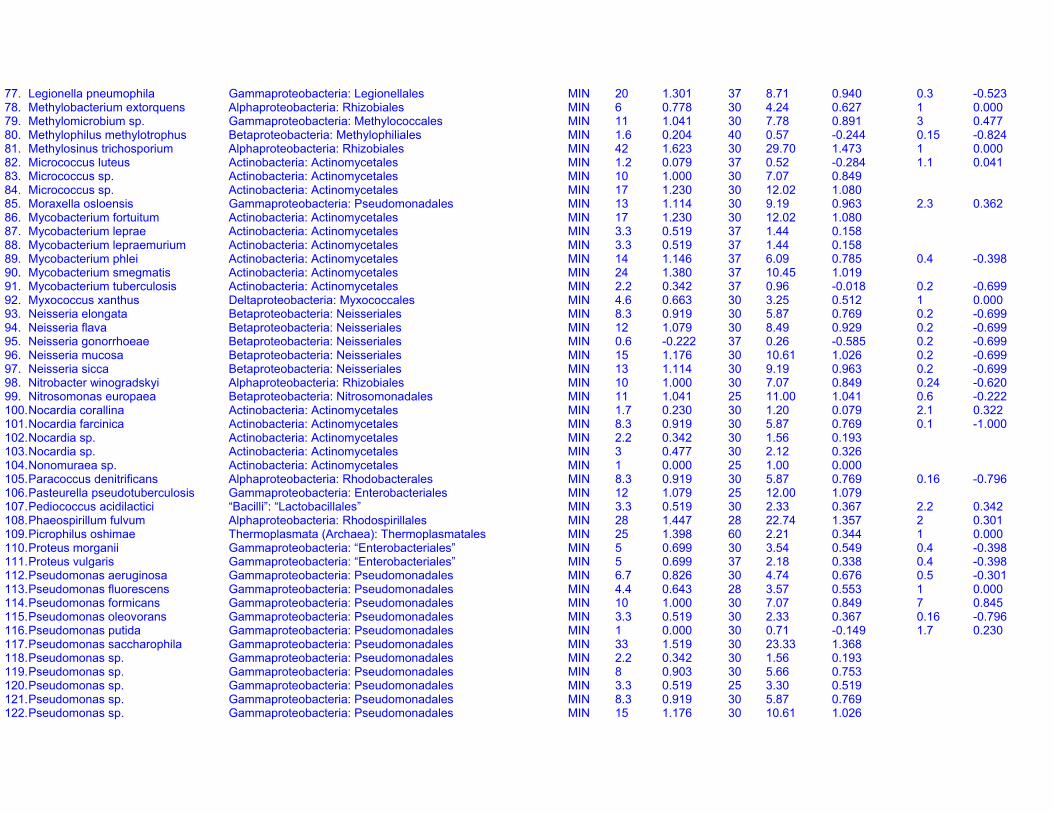
77. Legionella pneumophila Gammaproteobacteria: Legionellales MIN 20 1.301 37 8.71 0.940 0.3 -0.52378. Methylobacterium extorquens Alphaproteobacteria: Rhizobiales MIN 6 0.778 30 4.24 0.627 1 0.00079. Methylomicrobium sp. Gammaproteobacteria: Methylococcales MIN 11 1.041 30 7.78 0.891 3 0.47780. Methylophilus methylotrophus Betaproteobacteria: Methylophiliales MIN 1.6 0.204 40 0.57 -0.244 0.15 -0.82481. Methylosinus trichosporium Alphaproteobacteria: Rhizobiales MIN 42 1.623 30 29.70 1.473 1 0.00082. Micrococcus luteus Actinobacteria: Actinomycetales MIN 1.2 0.079 37 0.52 -0.284 1.1 0.04183. Micrococcus sp. Actinobacteria: Actinomycetales MIN 10 1.000 30 7.07 0.84984. Micrococcus sp. Actinobacteria: Actinomycetales MIN 17 1.230 30 12.02 1.08085. Moraxella osloensis Gammaproteobacteria: Pseudomonadales MIN 13 1.114 30 9.19 0.963 2.3 0.36286. Mycobacterium fortuitum Actinobacteria: Actinomycetales MIN 17 1.230 30 12.02 1.08087. Mycobacterium leprae Actinobacteria: Actinomycetales MIN 3.3 0.519 37 1.44 0.15888. Mycobacterium lepraemurium Actinobacteria: Actinomycetales MIN 3.3 0.519 37 1.44 0.15889. Mycobacterium phlei Actinobacteria: Actinomycetales MIN 14 1.146 37 6.09 0.785 0.4 -0.39890. Mycobacterium smegmatis Actinobacteria: Actinomycetales MIN 24 1.380 37 10.45 1.01991. Mycobacterium tuberculosis Actinobacteria: Actinomycetales MIN 2.2 0.342 37 0.96 -0.018 0.2 -0.69992. Myxococcus xanthus Deltaproteobacteria: Myxococcales MIN 4.6 0.663 30 3.25 0.512 1 0.00093. Neisseria elongata Betaproteobacteria: Neisseriales MIN 8.3 0.919 30 5.87 0.769 0.2 -0.69994. Neisseria flava Betaproteobacteria: Neisseriales MIN 12 1.079 30 8.49 0.929 0.2 -0.69995. Neisseria gonorrhoeae Betaproteobacteria: Neisseriales MIN 0.6 -0.222 37 0.26 -0.585 0.2 -0.69996. Neisseria mucosa Betaproteobacteria: Neisseriales MIN 15 1.176 30 10.61 1.026 0.2 -0.69997. Neisseria sicca Betaproteobacteria: Neisseriales MIN 13 1.114 30 9.19 0.963 0.2 -0.69998. Nitrobacter winogradskyi Alphaproteobacteria: Rhizobiales MIN 10 1.000 30 7.07 0.849 0.24 -0.62099. Nitrosomonas europaea Betaproteobacteria: Nitrosomonadales MIN 11 1.041 25 11.00 1.041 0.6 -0.222100. Nocardia corallina Actinobacteria: Actinomycetales MIN 1.7 0.230 30 1.20 0.079 2.1 0.322101. Nocardia farcinica Actinobacteria: Actinomycetales MIN 8.3 0.919 30 5.87 0.769 0.1 -1.000102. Nocardia sp. Actinobacteria: Actinomycetales MIN 2.2 0.342 30 1.56 0.193103. Nocardia sp. Actinobacteria: Actinomycetales MIN 3 0.477 30 2.12 0.326104. Nonomuraea sp. Actinobacteria: Actinomycetales MIN 1 0.000 25 1.00 0.000105. Paracoccus denitrificans Alphaproteobacteria: Rhodobacterales MIN 8.3 0.919 30 5.87 0.769 0.16 -0.796106. Pasteurella pseudotuberculosis Gammaproteobacteria: Enterobacteriales MIN 12 1.079 25 12.00 1.079107. Pediococcus acidilactici “Bacilli”: “Lactobacillales” MIN 3.3 0.519 30 2.33 0.367 2.2 0.342108. Phaeospirillum fulvum Alphaproteobacteria: Rhodospirillales MIN 28 1.447 28 22.74 1.357 2 0.301109. Picrophilus oshimae Thermoplasmata (Archaea): Thermoplasmatales MIN 25 1.398 60 2.21 0.344 1 0.000110. Proteus morganii Gammaproteobacteria: “Enterobacteriales” MIN 5 0.699 30 3.54 0.549 0.4 -0.398111. Proteus vulgaris Gammaproteobacteria: “Enterobacteriales” MIN 5 0.699 37 2.18 0.338 0.4 -0.398112. Pseudomonas aeruginosa Gammaproteobacteria: Pseudomonadales MIN 6.7 0.826 30 4.74 0.676 0.5 -0.301113. Pseudomonas fluorescens Gammaproteobacteria: Pseudomonadales MIN 4.4 0.643 28 3.57 0.553 1 0.000114. Pseudomonas formicans Gammaproteobacteria: Pseudomonadales MIN 10 1.000 30 7.07 0.849 7 0.845115. Pseudomonas oleovorans Gammaproteobacteria: Pseudomonadales MIN 3.3 0.519 30 2.33 0.367 0.16 -0.796116. Pseudomonas putida Gammaproteobacteria: Pseudomonadales MIN 1 0.000 30 0.71 -0.149 1.7 0.230117. Pseudomonas saccharophila Gammaproteobacteria: Pseudomonadales MIN 33 1.519 30 23.33 1.368118. Pseudomonas sp. Gammaproteobacteria: Pseudomonadales MIN 2.2 0.342 30 1.56 0.193119. Pseudomonas sp. Gammaproteobacteria: Pseudomonadales MIN 8 0.903 30 5.66 0.753120. Pseudomonas sp. Gammaproteobacteria: Pseudomonadales MIN 3.3 0.519 25 3.30 0.519121. Pseudomonas sp. Gammaproteobacteria: Pseudomonadales MIN 8.3 0.919 30 5.87 0.769122. Pseudomonas sp. Gammaproteobacteria: Pseudomonadales MIN 15 1.176 30 10.61 1.026
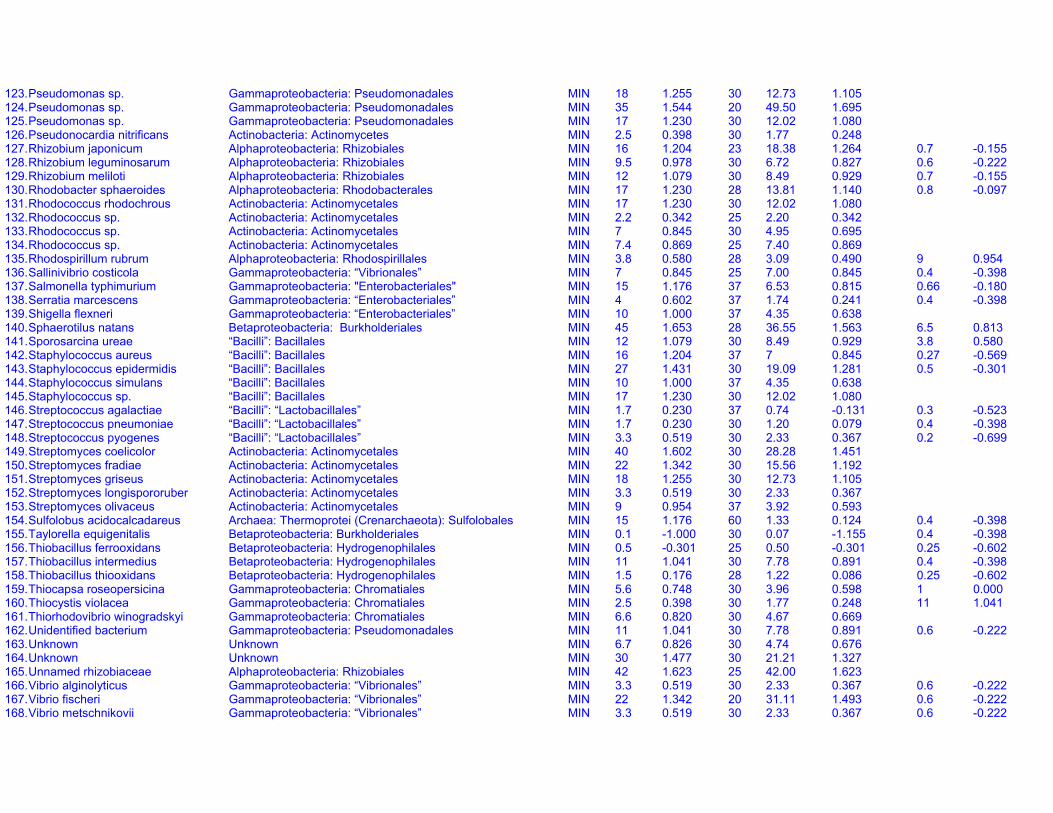
123. Pseudomonas sp. Gammaproteobacteria: Pseudomonadales MIN 18 1.255 30 12.73 1.105124. Pseudomonas sp. Gammaproteobacteria: Pseudomonadales MIN 35 1.544 20 49.50 1.695125. Pseudomonas sp. Gammaproteobacteria: Pseudomonadales MIN 17 1.230 30 12.02 1.080126. Pseudonocardia nitrificans Actinobacteria: Actinomycetes MIN 2.5 0.398 30 1.77 0.248127. Rhizobium japonicum Alphaproteobacteria: Rhizobiales MIN 16 1.204 23 18.38 1.264 0.7 -0.155128. Rhizobium leguminosarum Alphaproteobacteria: Rhizobiales MIN 9.5 0.978 30 6.72 0.827 0.6 -0.222129. Rhizobium meliloti Alphaproteobacteria: Rhizobiales MIN 12 1.079 30 8.49 0.929 0.7 -0.155130. Rhodobacter sphaeroides Alphaproteobacteria: Rhodobacterales MIN 17 1.230 28 13.81 1.140 0.8 -0.097131. Rhodococcus rhodochrous Actinobacteria: Actinomycetales MIN 17 1.230 30 12.02 1.080132. Rhodococcus sp. Actinobacteria: Actinomycetales MIN 2.2 0.342 25 2.20 0.342133. Rhodococcus sp. Actinobacteria: Actinomycetales MIN 7 0.845 30 4.95 0.695134. Rhodococcus sp. Actinobacteria: Actinomycetales MIN 7.4 0.869 25 7.40 0.869135. Rhodospirillum rubrum Alphaproteobacteria: Rhodospirillales MIN 3.8 0.580 28 3.09 0.490 9 0.954136. Sallinivibrio costicola Gammaproteobacteria: “Vibrionales” MIN 7 0.845 25 7.00 0.845 0.4 -0.398137. Salmonella typhimurium Gammaproteobacteria: "Enterobacteriales" MIN 15 1.176 37 6.53 0.815 0.66 -0.180138. Serratia marcescens Gammaproteobacteria: “Enterobacteriales” MIN 4 0.602 37 1.74 0.241 0.4 -0.398139. Shigella flexneri Gammaproteobacteria: “Enterobacteriales” MIN 10 1.000 37 4.35 0.638140. Sphaerotilus natans Betaproteobacteria: Burkholderiales MIN 45 1.653 28 36.55 1.563 6.5 0.813141. Sporosarcina ureae “Bacilli”: Bacillales MIN 12 1.079 30 8.49 0.929 3.8 0.580142. Staphylococcus aureus “Bacilli”: Bacillales MIN 16 1.204 37 7 0.845 0.27 -0.569143. Staphylococcus epidermidis “Bacilli”: Bacillales MIN 27 1.431 30 19.09 1.281 0.5 -0.301144. Staphylococcus simulans “Bacilli”: Bacillales MIN 10 1.000 37 4.35 0.638145. Staphylococcus sp. “Bacilli”: Bacillales MIN 17 1.230 30 12.02 1.080146. Streptococcus agalactiae “Bacilli”: “Lactobacillales” MIN 1.7 0.230 37 0.74 -0.131 0.3 -0.523147. Streptococcus pneumoniae “Bacilli”: “Lactobacillales” MIN 1.7 0.230 30 1.20 0.079 0.4 -0.398148. Streptococcus pyogenes “Bacilli”: “Lactobacillales” MIN 3.3 0.519 30 2.33 0.367 0.2 -0.699149. Streptomyces coelicolor Actinobacteria: Actinomycetales MIN 40 1.602 30 28.28 1.451150. Streptomyces fradiae Actinobacteria: Actinomycetales MIN 22 1.342 30 15.56 1.192151. Streptomyces griseus Actinobacteria: Actinomycetales MIN 18 1.255 30 12.73 1.105152. Streptomyces longispororuber Actinobacteria: Actinomycetales MIN 3.3 0.519 30 2.33 0.367153. Streptomyces olivaceus Actinobacteria: Actinomycetales MIN 9 0.954 37 3.92 0.593154. Sulfolobus acidocalcadareus Archaea: Thermoprotei (Crenarchaeota): Sulfolobales MIN 15 1.176 60 1.33 0.124 0.4 -0.398155. Taylorella equigenitalis Betaproteobacteria: Burkholderiales MIN 0.1 -1.000 30 0.07 -1.155 0.4 -0.398156. Thiobacillus ferrooxidans Betaproteobacteria: Hydrogenophilales MIN 0.5 -0.301 25 0.50 -0.301 0.25 -0.602157. Thiobacillus intermedius Betaproteobacteria: Hydrogenophilales MIN 11 1.041 30 7.78 0.891 0.4 -0.398158. Thiobacillus thiooxidans Betaproteobacteria: Hydrogenophilales MIN 1.5 0.176 28 1.22 0.086 0.25 -0.602159. Thiocapsa roseopersicina Gammaproteobacteria: Chromatiales MIN 5.6 0.748 30 3.96 0.598 1 0.000160. Thiocystis violacea Gammaproteobacteria: Chromatiales MIN 2.5 0.398 30 1.77 0.248 11 1.041161. Thiorhodovibrio winogradskyi Gammaproteobacteria: Chromatiales MIN 6.6 0.820 30 4.67 0.669162. Unidentified bacterium Gammaproteobacteria: Pseudomonadales MIN 11 1.041 30 7.78 0.891 0.6 -0.222163. Unknown Unknown MIN 6.7 0.826 30 4.74 0.676164. Unknown Unknown MIN 30 1.477 30 21.21 1.327165. Unnamed rhizobiaceae Alphaproteobacteria: Rhizobiales MIN 42 1.623 25 42.00 1.623166. Vibrio alginolyticus Gammaproteobacteria: “Vibrionales” MIN 3.3 0.519 30 2.33 0.367 0.6 -0.222167. Vibrio fischeri Gammaproteobacteria: “Vibrionales” MIN 22 1.342 20 31.11 1.493 0.6 -0.222168. Vibrio metschnikovii Gammaproteobacteria: “Vibrionales” MIN 3.3 0.519 30 2.33 0.367 0.6 -0.222
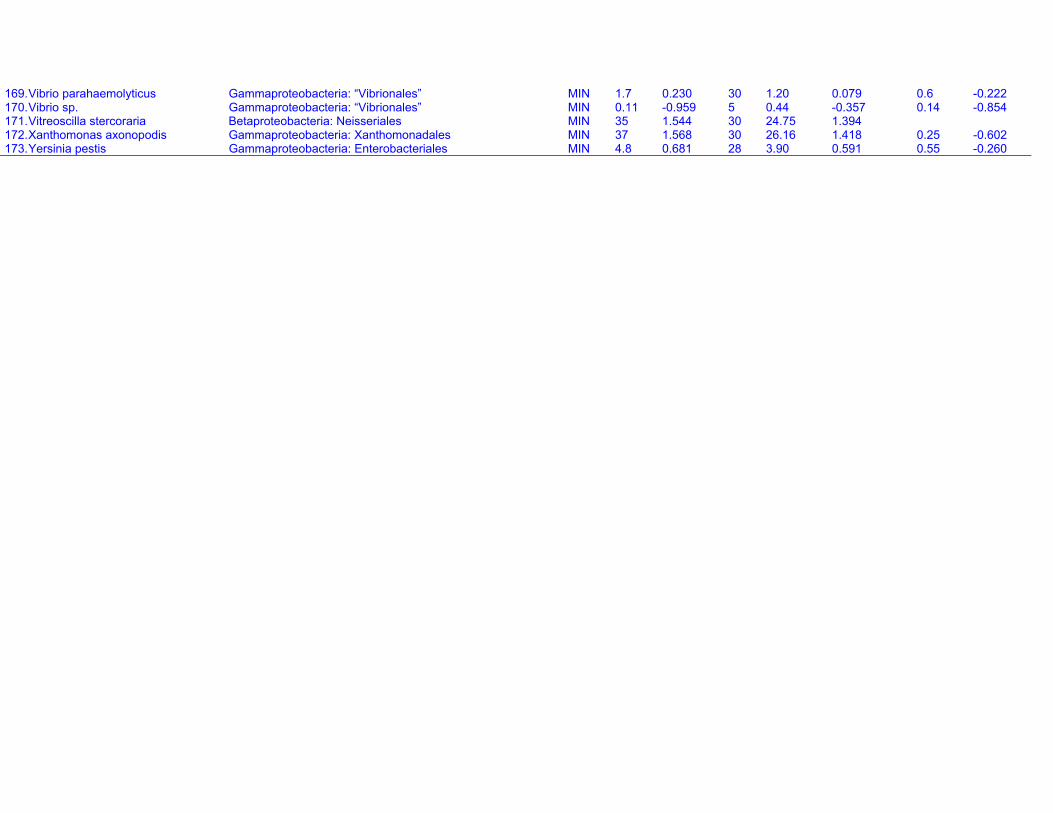
169. Vibrio parahaemolyticus Gammaproteobacteria: “Vibrionales” MIN 1.7 0.230 30 1.20 0.079 0.6 -0.222170. Vibrio sp. Gammaproteobacteria: “Vibrionales” MIN 0.11 -0.959 5 0.44 -0.357 0.14 -0.854171. Vitreoscilla stercoraria Betaproteobacteria: Neisseriales MIN 35 1.544 30 24.75 1.394172. Xanthomonas axonopodis Gammaproteobacteria: Xanthomonadales MIN 37 1.568 30 26.16 1.418 0.25 -0.602173. Yersinia pestis Gammaproteobacteria: Enterobacteriales MIN 4.8 0.681 28 3.90 0.591 0.55 -0.260