Embed Size (px)
Citation preview
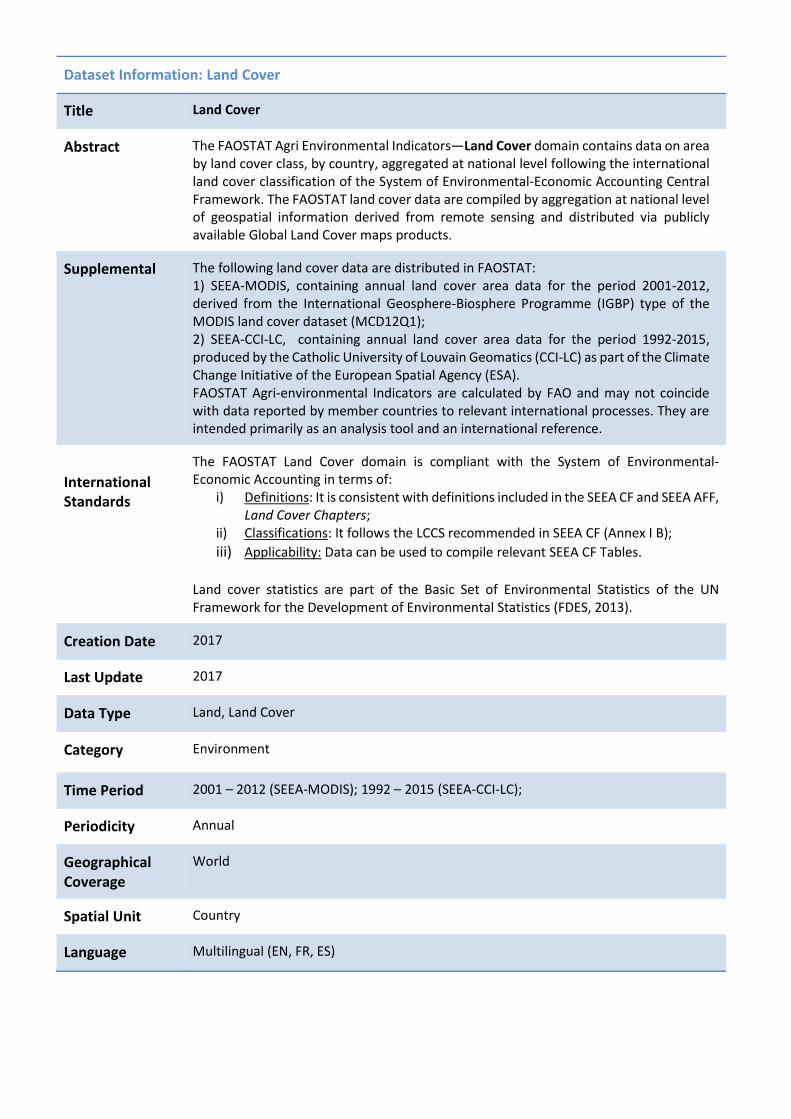
Dataset Information: Land Cover
Title Land Cover
Abstract The FAOSTAT Agri Environmental Indicators—Land Cover domain contains data on area by land cover class, by country, aggregated at national level following the international land cover classification of the System of Environmental-Economic Accounting Central Framework. The FAOSTAT land cover data are compiled by aggregation at national level of geospatial information derived from remote sensing and distributed via publicly available Global Land Cover maps products.
Supplemental The following land cover data are distributed in FAOSTAT: 1) SEEA-MODIS, containing annual land cover area data for the period 2001-2012, derived from the International Geosphere-Biosphere Programme (IGBP) type of the MODIS land cover dataset (MCD12Q1); 2) SEEA-CCI-LC, containing annual land cover area data for the period 1992-2015, produced by the Catholic University of Louvain Geomatics (CCI-LC) as part of the Climate Change Initiative of the European Spatial Agency (ESA). FAOSTAT Agri-environmental Indicators are calculated by FAO and may not coincide with data reported by member countries to relevant international processes. They are intended primarily as an analysis tool and an international reference.
International Standards
The FAOSTAT Land Cover domain is compliant with the System of Environmental-Economic Accounting in terms of:
i) Definitions: It is consistent with definitions included in the SEEA CF and SEEA AFF, Land Cover Chapters;
ii) Classifications: It follows the LCCS recommended in SEEA CF (Annex I B);
iii) Applicability: Data can be used to compile relevant SEEA CF Tables. Land cover statistics are part of the Basic Set of Environmental Statistics of the UN Framework for the Development of Environmental Statistics (FDES, 2013).
Creation Date 2017
Last Update 2017
Data Type Land, Land Cover
Category Environment
Time Period 2001 – 2012 (SEEA-MODIS); 1992 – 2015 (SEEA-CCI-LC);
Periodicity Annual
Geographical Coverage
World
Spatial Unit Country
Language Multilingual (EN, FR, ES)
Methodology and Quality Information:
Methods and processing
Overview
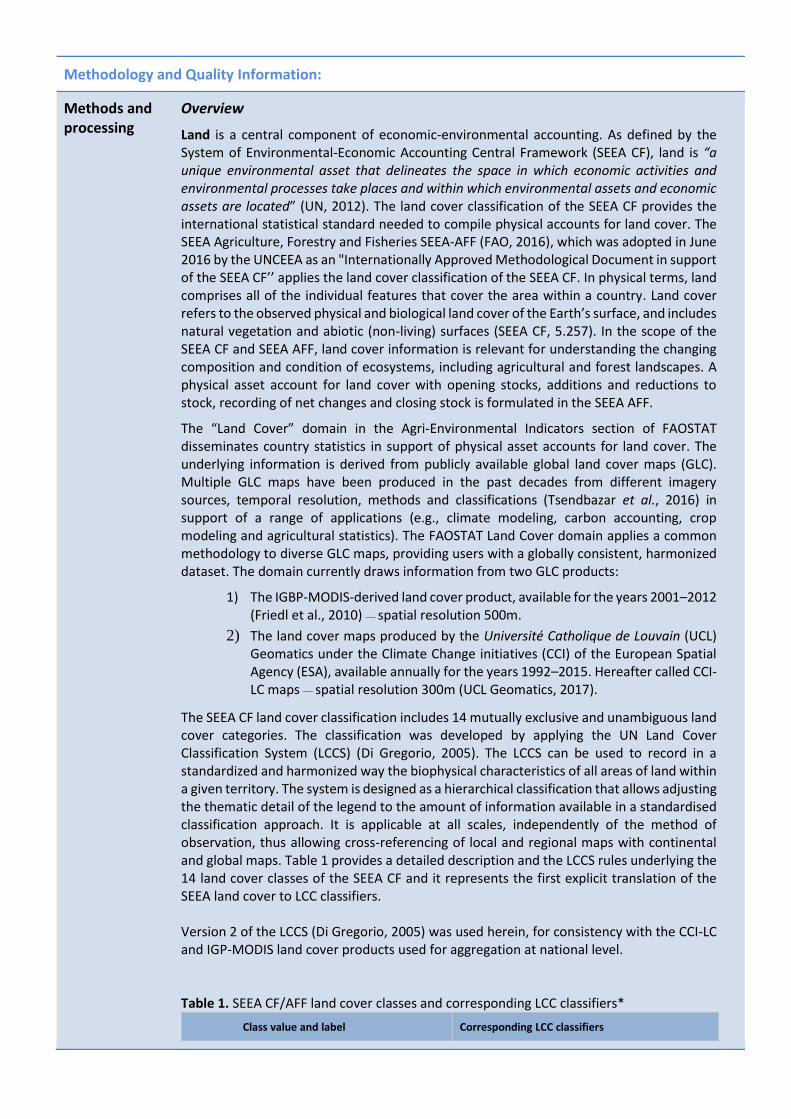
Land is a central component of economic-environmental accounting. As defined by the System of Environmental-Economic Accounting Central Framework (SEEA CF), land is “a unique environmental asset that delineates the space in which economic activities and environmental processes take places and within which environmental assets and economic assets are located” (UN, 2012). The land cover classification of the SEEA CF provides the international statistical standard needed to compile physical accounts for land cover. The SEEA Agriculture, Forestry and Fisheries SEEA-AFF (FAO, 2016), which was adopted in June 2016 by the UNCEEA as an "Internationally Approved Methodological Document in support of the SEEA CF’’ applies the land cover classification of the SEEA CF. In physical terms, land comprises all of the individual features that cover the area within a country. Land cover refers to the observed physical and biological land cover of the Earth’s surface, and includes natural vegetation and abiotic (non-living) surfaces (SEEA CF, 5.257). In the scope of the SEEA CF and SEEA AFF, land cover information is relevant for understanding the changing composition and condition of ecosystems, including agricultural and forest landscapes. A physical asset account for land cover with opening stocks, additions and reductions to stock, recording of net changes and closing stock is formulated in the SEEA AFF.
The “Land Cover” domain in the Agri-Environmental Indicators section of FAOSTAT disseminates country statistics in support of physical asset accounts for land cover. The underlying information is derived from publicly available global land cover maps (GLC). Multiple GLC maps have been produced in the past decades from different imagery sources, temporal resolution, methods and classifications (Tsendbazar et al., 2016) in support of a range of applications (e.g., climate modeling, carbon accounting, crop modeling and agricultural statistics). The FAOSTAT Land Cover domain applies a common methodology to diverse GLC maps, providing users with a globally consistent, harmonized dataset. The domain currently draws information from two GLC products:
1) The IGBP-MODIS-derived land cover product, available for the years 2001–2012 (Friedl et al., 2010) — spatial resolution 500m.
2) The land cover maps produced by the Université Catholique de Louvain (UCL) Geomatics under the Climate Change initiatives (CCI) of the European Spatial Agency (ESA), available annually for the years 1992–2015. Hereafter called CCI-LC maps — spatial resolution 300m (UCL Geomatics, 2017).
The SEEA CF land cover classification includes 14 mutually exclusive and unambiguous land cover categories. The classification was developed by applying the UN Land Cover Classification System (LCCS) (Di Gregorio, 2005). The LCCS can be used to record in a standardized and harmonized way the biophysical characteristics of all areas of land within a given territory. The system is designed as a hierarchical classification that allows adjusting the thematic detail of the legend to the amount of information available in a standardised classification approach. It is applicable at all scales, independently of the method of observation, thus allowing cross-referencing of local and regional maps with continental and global maps. Table 1 provides a detailed description and the LCCS rules underlying the 14 land cover classes of the SEEA CF and it represents the first explicit translation of the SEEA land cover to LCC classifiers. Version 2 of the LCCS (Di Gregorio, 2005) was used herein, for consistency with the CCI-LC and IGP-MODIS land cover products used for aggregation at national level. Table 1. SEEA CF/AFF land cover classes and corresponding LCC classifiers*
Class value and label Corresponding LCC classifiers
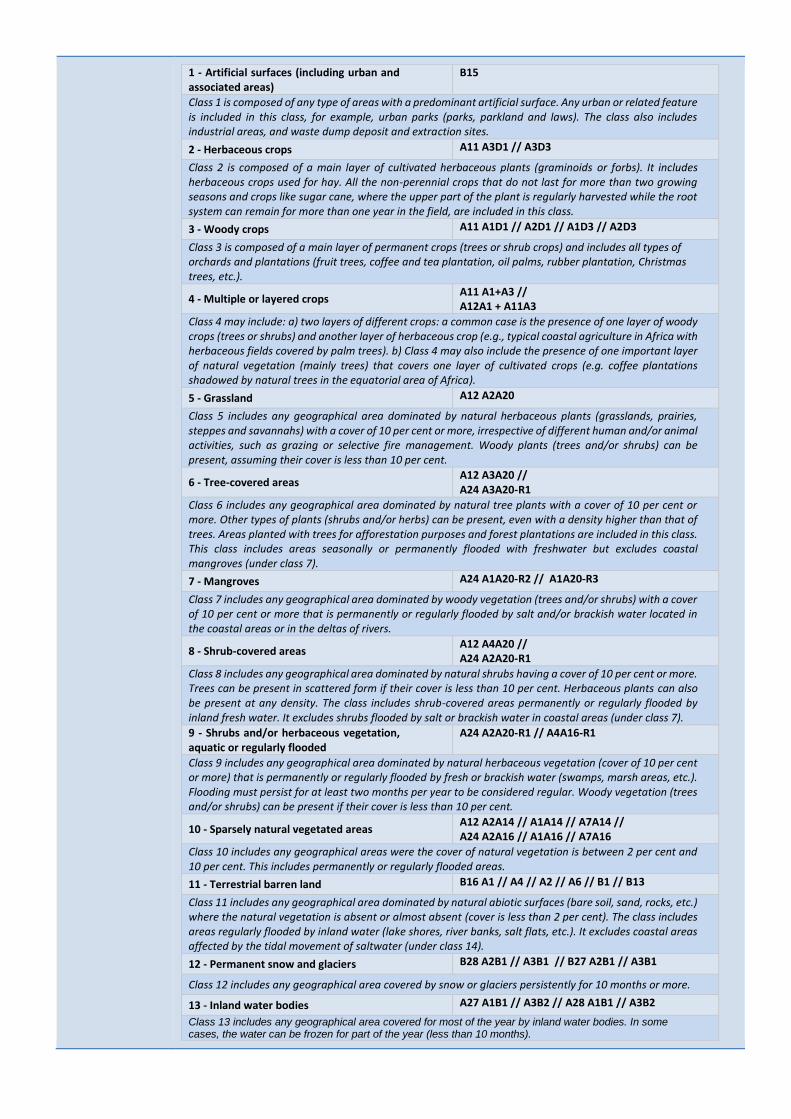
1 - Artificial surfaces (including urban and associated areas)
B15
Class 1 is composed of any type of areas with a predominant artificial surface. Any urban or related feature is included in this class, for example, urban parks (parks, parkland and laws). The class also includes industrial areas, and waste dump deposit and extraction sites.
2 - Herbaceous crops A11 A3D1 // A3D3
Class 2 is composed of a main layer of cultivated herbaceous plants (graminoids or forbs). It includes herbaceous crops used for hay. All the non-perennial crops that do not last for more than two growing seasons and crops like sugar cane, where the upper part of the plant is regularly harvested while the root system can remain for more than one year in the field, are included in this class.
3 - Woody crops A11 A1D1 // A2D1 // A1D3 // A2D3
Class 3 is composed of a main layer of permanent crops (trees or shrub crops) and includes all types of orchards and plantations (fruit trees, coffee and tea plantation, oil palms, rubber plantation, Christmas trees, etc.).
4 - Multiple or layered crops A11 A1+A3 // A12A1 + A11A3
Class 4 may include: a) two layers of different crops: a common case is the presence of one layer of woody crops (trees or shrubs) and another layer of herbaceous crop (e.g., typical coastal agriculture in Africa with herbaceous fields covered by palm trees). b) Class 4 may also include the presence of one important layer of natural vegetation (mainly trees) that covers one layer of cultivated crops (e.g. coffee plantations shadowed by natural trees in the equatorial area of Africa).
5 - Grassland A12 A2A20
Class 5 includes any geographical area dominated by natural herbaceous plants (grasslands, prairies, steppes and savannahs) with a cover of 10 per cent or more, irrespective of different human and/or animal activities, such as grazing or selective fire management. Woody plants (trees and/or shrubs) can be present, assuming their cover is less than 10 per cent.
6 - Tree-covered areas A12 A3A20 // A24 A3A20-R1
Class 6 includes any geographical area dominated by natural tree plants with a cover of 10 per cent or more. Other types of plants (shrubs and/or herbs) can be present, even with a density higher than that of trees. Areas planted with trees for afforestation purposes and forest plantations are included in this class. This class includes areas seasonally or permanently flooded with freshwater but excludes coastal mangroves (under class 7).
7 - Mangroves A24 A1A20-R2 // A1A20-R3
Class 7 includes any geographical area dominated by woody vegetation (trees and/or shrubs) with a cover of 10 per cent or more that is permanently or regularly flooded by salt and/or brackish water located in the coastal areas or in the deltas of rivers.
8 - Shrub-covered areas A12 A4A20 // A24 A2A20-R1
Class 8 includes any geographical area dominated by natural shrubs having a cover of 10 per cent or more. Trees can be present in scattered form if their cover is less than 10 per cent. Herbaceous plants can also be present at any density. The class includes shrub-covered areas permanently or regularly flooded by inland fresh water. It excludes shrubs flooded by salt or brackish water in coastal areas (under class 7).
9 - Shrubs and/or herbaceous vegetation, aquatic or regularly flooded
A24 A2A20-R1 // A4A16-R1
Class 9 includes any geographical area dominated by natural herbaceous vegetation (cover of 10 per cent or more) that is permanently or regularly flooded by fresh or brackish water (swamps, marsh areas, etc.). Flooding must persist for at least two months per year to be considered regular. Woody vegetation (trees and/or shrubs) can be present if their cover is less than 10 per cent.
10 - Sparsely natural vegetated areas A12 A2A14 // A1A14 // A7A14 // A24 A2A16 // A1A16 // A7A16
Class 10 includes any geographical areas were the cover of natural vegetation is between 2 per cent and 10 per cent. This includes permanently or regularly flooded areas.
11 - Terrestrial barren land B16 A1 // A4 // A2 // A6 // B1 // B13
Class 11 includes any geographical area dominated by natural abiotic surfaces (bare soil, sand, rocks, etc.) where the natural vegetation is absent or almost absent (cover is less than 2 per cent). The class includes areas regularly flooded by inland water (lake shores, river banks, salt flats, etc.). It excludes coastal areas affected by the tidal movement of saltwater (under class 14).
12 - Permanent snow and glaciers B28 A2B1 // A3B1 // B27 A2B1 // A3B1
Class 12 includes any geographical area covered by snow or glaciers persistently for 10 months or more.
13 - Inland water bodies A27 A1B1 // A3B2 // A28 A1B1 // A3B2
Class 13 includes any geographical area covered for most of the year by inland water bodies. In some cases, the water can be frozen for part of the year (less than 10 months).
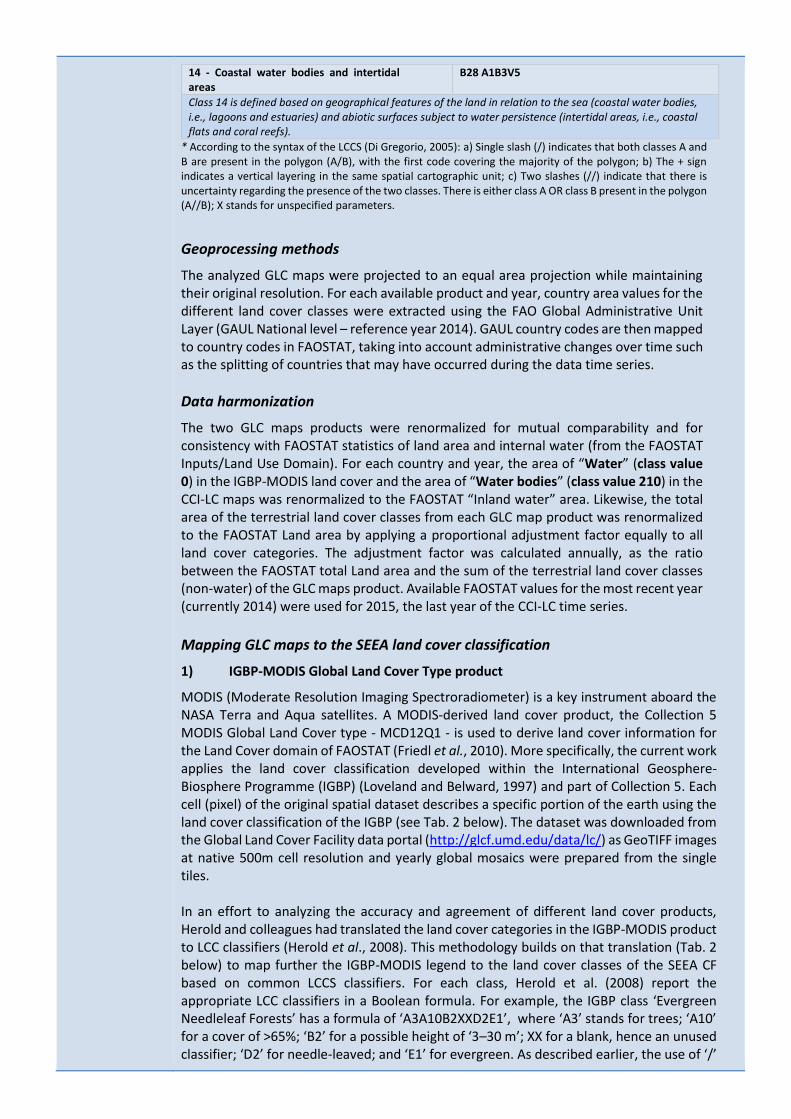
14 - Coastal water bodies and intertidal areas
B28 A1B3V5
Class 14 is defined based on geographical features of the land in relation to the sea (coastal water bodies, i.e., lagoons and estuaries) and abiotic surfaces subject to water persistence (intertidal areas, i.e., coastal flats and coral reefs).
* According to the syntax of the LCCS (Di Gregorio, 2005): a) Single slash (/) indicates that both classes A and B are present in the polygon (A/B), with the first code covering the majority of the polygon; b) The + sign indicates a vertical layering in the same spatial cartographic unit; c) Two slashes (//) indicate that there is uncertainty regarding the presence of the two classes. There is either class A OR class B present in the polygon (A//B); X stands for unspecified parameters.
Geoprocessing methods
The analyzed GLC maps were projected to an equal area projection while maintaining their original resolution. For each available product and year, country area values for the different land cover classes were extracted using the FAO Global Administrative Unit Layer (GAUL National level – reference year 2014). GAUL country codes are then mapped to country codes in FAOSTAT, taking into account administrative changes over time such as the splitting of countries that may have occurred during the data time series.
Data harmonization
The two GLC maps products were renormalized for mutual comparability and for consistency with FAOSTAT statistics of land area and internal water (from the FAOSTAT Inputs/Land Use Domain). For each country and year, the area of “Water” (class value 0) in the IGBP-MODIS land cover and the area of “Water bodies” (class value 210) in the CCI-LC maps was renormalized to the FAOSTAT “Inland water” area. Likewise, the total area of the terrestrial land cover classes from each GLC map product was renormalized to the FAOSTAT Land area by applying a proportional adjustment factor equally to all land cover categories. The adjustment factor was calculated annually, as the ratio between the FAOSTAT total Land area and the sum of the terrestrial land cover classes (non-water) of the GLC maps product. Available FAOSTAT values for the most recent year (currently 2014) were used for 2015, the last year of the CCI-LC time series.
Mapping GLC maps to the SEEA land cover classification
1) IGBP-MODIS Global Land Cover Type product
MODIS (Moderate Resolution Imaging Spectroradiometer) is a key instrument aboard the NASA Terra and Aqua satellites. A MODIS-derived land cover product, the Collection 5 MODIS Global Land Cover type - MCD12Q1 - is used to derive land cover information for the Land Cover domain of FAOSTAT (Friedl et al., 2010). More specifically, the current work applies the land cover classification developed within the International Geosphere-Biosphere Programme (IGBP) (Loveland and Belward, 1997) and part of Collection 5. Each cell (pixel) of the original spatial dataset describes a specific portion of the earth using the land cover classification of the IGBP (see Tab. 2 below). The dataset was downloaded from the Global Land Cover Facility data portal (http://glcf.umd.edu/data/lc/) as GeoTIFF images at native 500m cell resolution and yearly global mosaics were prepared from the single tiles. In an effort to analyzing the accuracy and agreement of different land cover products, Herold and colleagues had translated the land cover categories in the IGBP-MODIS product to LCC classifiers (Herold et al., 2008). This methodology builds on that translation (Tab. 2 below) to map further the IGBP-MODIS legend to the land cover classes of the SEEA CF based on common LCCS classifiers. For each class, Herold et al. (2008) report the appropriate LCC classifiers in a Boolean formula. For example, the IGBP class ‘Evergreen Needleleaf Forests’ has a formula of ‘A3A10B2XXD2E1’, where ‘A3’ stands for trees; ‘A10’ for a cover of >65%; ‘B2’ for a possible height of ‘3–30 m’; XX for a blank, hence an unused classifier; ‘D2’ for needle-leaved; and ‘E1’ for evergreen. As described earlier, the use of ‘/’
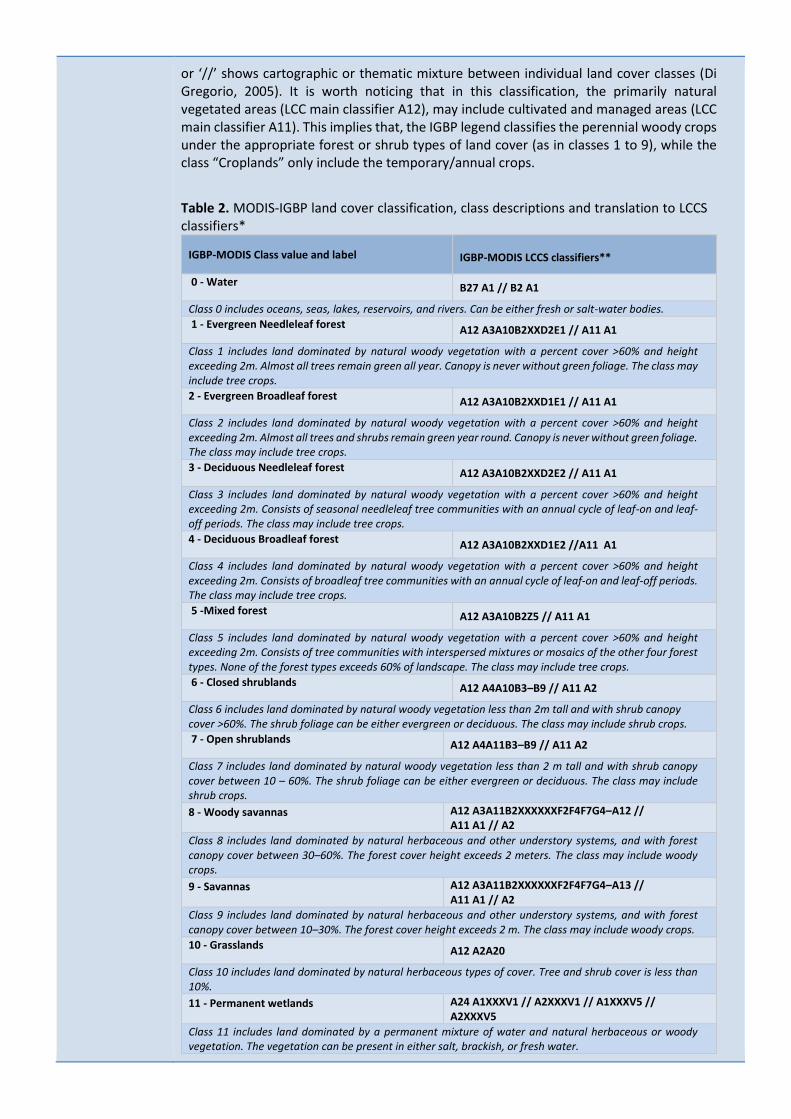
or ‘//’ shows cartographic or thematic mixture between individual land cover classes (Di Gregorio, 2005). It is worth noticing that in this classification, the primarily natural vegetated areas (LCC main classifier A12), may include cultivated and managed areas (LCC main classifier A11). This implies that, the IGBP legend classifies the perennial woody crops under the appropriate forest or shrub types of land cover (as in classes 1 to 9), while the class “Croplands” only include the temporary/annual crops.
Table 2. MODIS-IGBP land cover classification, class descriptions and translation to LCCS classifiers*
IGBP-MODIS Class value and label IGBP-MODIS LCCS classifiers**
0 - Water B27 A1 // B2 A1
Class 0 includes oceans, seas, lakes, reservoirs, and rivers. Can be either fresh or salt-water bodies.
1 - Evergreen Needleleaf forest A12 A3A10B2XXD2E1 // A11 A1
Class 1 includes land dominated by natural woody vegetation with a percent cover >60% and height exceeding 2m. Almost all trees remain green all year. Canopy is never without green foliage. The class may include tree crops.
2 - Evergreen Broadleaf forest A12 A3A10B2XXD1E1 // A11 A1
Class 2 includes land dominated by natural woody vegetation with a percent cover >60% and height exceeding 2m. Almost all trees and shrubs remain green year round. Canopy is never without green foliage. The class may include tree crops.
3 - Deciduous Needleleaf forest A12 A3A10B2XXD2E2 // A11 A1
Class 3 includes land dominated by natural woody vegetation with a percent cover >60% and height exceeding 2m. Consists of seasonal needleleaf tree communities with an annual cycle of leaf-on and leaf-off periods. The class may include tree crops.
4 - Deciduous Broadleaf forest A12 A3A10B2XXD1E2 //A11 A1
Class 4 includes land dominated by natural woody vegetation with a percent cover >60% and height exceeding 2m. Consists of broadleaf tree communities with an annual cycle of leaf-on and leaf-off periods. The class may include tree crops.
5 -Mixed forest A12 A3A10B2Z5 // A11 A1
Class 5 includes land dominated by natural woody vegetation with a percent cover >60% and height exceeding 2m. Consists of tree communities with interspersed mixtures or mosaics of the other four forest types. None of the forest types exceeds 60% of landscape. The class may include tree crops.
6 - Closed shrublands A12 A4A10B3–B9 // A11 A2
Class 6 includes land dominated by natural woody vegetation less than 2m tall and with shrub canopy cover >60%. The shrub foliage can be either evergreen or deciduous. The class may include shrub crops.
7 - Open shrublands A12 A4A11B3–B9 // A11 A2
Class 7 includes land dominated by natural woody vegetation less than 2 m tall and with shrub canopy cover between 10 – 60%. The shrub foliage can be either evergreen or deciduous. The class may include shrub crops.
8 - Woody savannas A12 A3A11B2XXXXXXF2F4F7G4–A12 // A11 A1 // A2
Class 8 includes land dominated by natural herbaceous and other understory systems, and with forest canopy cover between 30–60%. The forest cover height exceeds 2 meters. The class may include woody crops.
9 - Savannas A12 A3A11B2XXXXXXF2F4F7G4–A13 // A11 A1 // A2
Class 9 includes land dominated by natural herbaceous and other understory systems, and with forest canopy cover between 10–30%. The forest cover height exceeds 2 m. The class may include woody crops.
10 - Grasslands A12 A2A20
Class 10 includes land dominated by natural herbaceous types of cover. Tree and shrub cover is less than 10%.
11 - Permanent wetlands A24 A1XXXV1 // A2XXXV1 // A1XXXV5 // A2XXXV5
Class 11 includes land dominated by a permanent mixture of water and natural herbaceous or woody vegetation. The vegetation can be present in either salt, brackish, or fresh water.
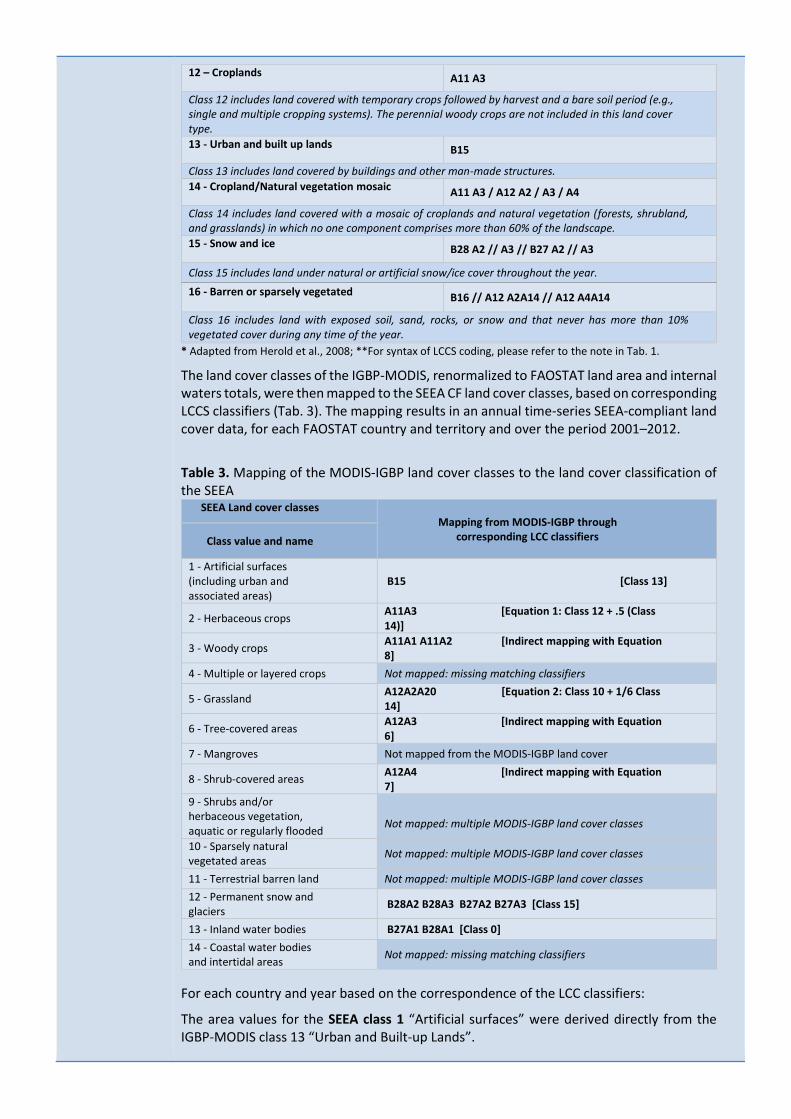
12 – Croplands A11 A3
Class 12 includes land covered with temporary crops followed by harvest and a bare soil period (e.g., single and multiple cropping systems). The perennial woody crops are not included in this land cover type.
13 - Urban and built up lands B15
Class 13 includes land covered by buildings and other man-made structures.
14 - Cropland/Natural vegetation mosaic A11 A3 / A12 A2 / A3 / A4
Class 14 includes land covered with a mosaic of croplands and natural vegetation (forests, shrubland, and grasslands) in which no one component comprises more than 60% of the landscape.
15 - Snow and ice B28 A2 // A3 // B27 A2 // A3
Class 15 includes land under natural or artificial snow/ice cover throughout the year.
16 - Barren or sparsely vegetated B16 // A12 A2A14 // A12 A4A14
Class 16 includes land with exposed soil, sand, rocks, or snow and that never has more than 10% vegetated cover during any time of the year.
* Adapted from Herold et al., 2008; **For syntax of LCCS coding, please refer to the note in Tab. 1.
The land cover classes of the IGBP-MODIS, renormalized to FAOSTAT land area and internal waters totals, were then mapped to the SEEA CF land cover classes, based on corresponding LCCS classifiers (Tab. 3). The mapping results in an annual time-series SEEA-compliant land cover data, for each FAOSTAT country and territory and over the period 2001–2012.
Table 3. Mapping of the MODIS-IGBP land cover classes to the land cover classification of the SEEA
SEEA Land cover classes Mapping from MODIS-IGBP through
corresponding LCC classifiers
Class value and name
1 - Artificial surfaces (including urban and associated areas)
B15 [Class 13]
2 - Herbaceous crops A11A3 [Equation 1: Class 12 + .5 (Class 14)]
3 - Woody crops A11A1 A11A2 [Indirect mapping with Equation 8]
4 - Multiple or layered crops Not mapped: missing matching classifiers
5 - Grassland A12A2A20 [Equation 2: Class 10 + 1/6 Class 14]
6 - Tree-covered areas A12A3 [Indirect mapping with Equation 6]
7 - Mangroves Not mapped from the MODIS-IGBP land cover
8 - Shrub-covered areas A12A4 [Indirect mapping with Equation 7]
9 - Shrubs and/or herbaceous vegetation, aquatic or regularly flooded
Not mapped: multiple MODIS-IGBP land cover classes
10 - Sparsely natural vegetated areas
Not mapped: multiple MODIS-IGBP land cover classes
11 - Terrestrial barren land Not mapped: multiple MODIS-IGBP land cover classes 12 - Permanent snow and glaciers
B28A2 B28A3 B27A2 B27A3 [Class 15]
13 - Inland water bodies B27A1 B28A1 [Class 0]
14 - Coastal water bodies and intertidal areas
Not mapped: missing matching classifiers
For each country and year based on the correspondence of the LCC classifiers:
The area values for the SEEA class 1 “Artificial surfaces” were derived directly from the IGBP-MODIS class 13 “Urban and Built-up Lands”.
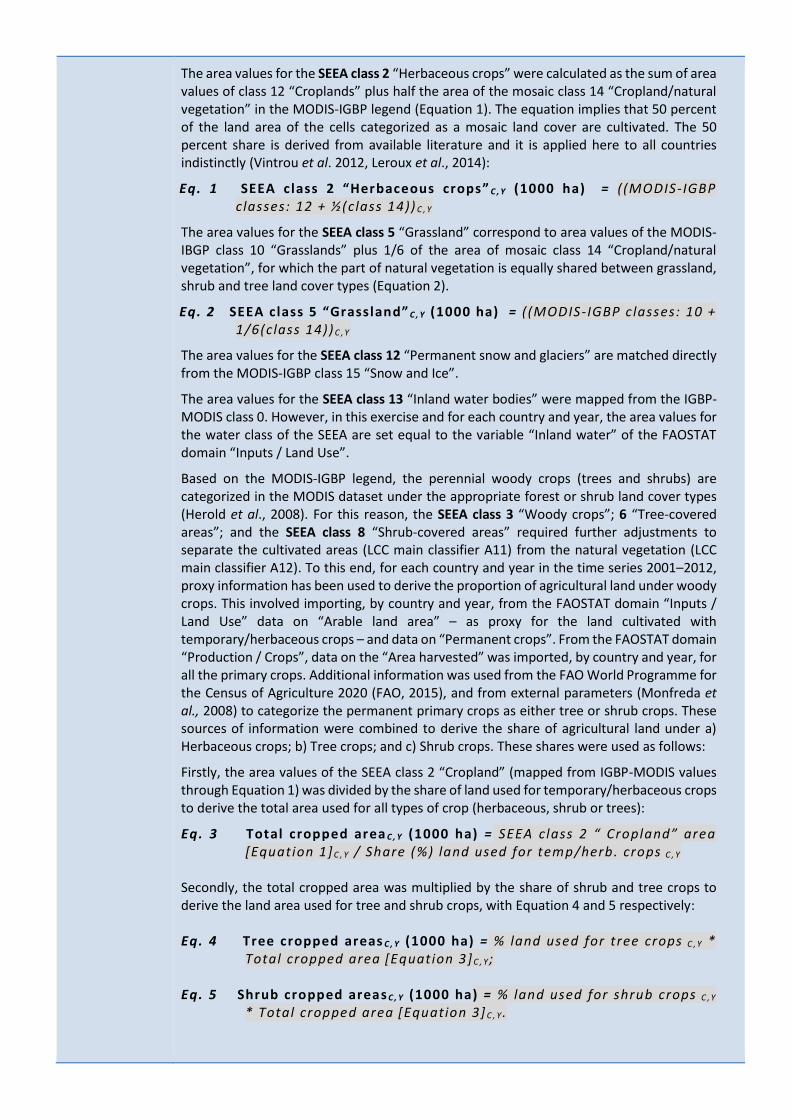
The area values for the SEEA class 2 “Herbaceous crops” were calculated as the sum of area values of class 12 “Croplands” plus half the area of the mosaic class 14 “Cropland/natural vegetation” in the MODIS-IGBP legend (Equation 1). The equation implies that 50 percent of the land area of the cells categorized as a mosaic land cover are cultivated. The 50 percent share is derived from available literature and it is applied here to all countries indistinctly (Vintrou et al. 2012, Leroux et al., 2014):
Eq. 1 SEEA class 2 “Herbaceous crops” C , Y (1000 ha) = ((MODIS-IGBP classes: 12 + ½(class 14)) C , Y
The area values for the SEEA class 5 “Grassland” correspond to area values of the MODIS-IBGP class 10 “Grasslands” plus 1/6 of the area of mosaic class 14 “Cropland/natural vegetation”, for which the part of natural vegetation is equally shared between grassland, shrub and tree land cover types (Equation 2).
Eq. 2 SEEA class 5 “Grassland” C , Y (1000 ha) = ((MODIS-IGBP c lasses: 10 + 1/6(class 14)) C , Y
The area values for the SEEA class 12 “Permanent snow and glaciers” are matched directly from the MODIS-IGBP class 15 “Snow and Ice”.
The area values for the SEEA class 13 “Inland water bodies” were mapped from the IGBP-MODIS class 0. However, in this exercise and for each country and year, the area values for the water class of the SEEA are set equal to the variable “Inland water” of the FAOSTAT domain “Inputs / Land Use”.
Based on the MODIS-IGBP legend, the perennial woody crops (trees and shrubs) are categorized in the MODIS dataset under the appropriate forest or shrub land cover types (Herold et al., 2008). For this reason, the SEEA class 3 “Woody crops”; 6 “Tree-covered areas”; and the SEEA class 8 “Shrub-covered areas” required further adjustments to separate the cultivated areas (LCC main classifier A11) from the natural vegetation (LCC main classifier A12). To this end, for each country and year in the time series 2001–2012, proxy information has been used to derive the proportion of agricultural land under woody crops. This involved importing, by country and year, from the FAOSTAT domain “Inputs / Land Use” data on “Arable land area” – as proxy for the land cultivated with temporary/herbaceous crops – and data on “Permanent crops”. From the FAOSTAT domain “Production / Crops”, data on the “Area harvested” was imported, by country and year, for all the primary crops. Additional information was used from the FAO World Programme for the Census of Agriculture 2020 (FAO, 2015), and from external parameters (Monfreda et al., 2008) to categorize the permanent primary crops as either tree or shrub crops. These sources of information were combined to derive the share of agricultural land under a) Herbaceous crops; b) Tree crops; and c) Shrub crops. These shares were used as follows:
Firstly, the area values of the SEEA class 2 “Cropland” (mapped from IGBP-MODIS values through Equation 1) was divided by the share of land used for temporary/herbaceous crops to derive the total area used for all types of crop (herbaceous, shrub or trees):
Eq. 3 Total cropped area C , Y (1000 ha) = SEEA class 2 “ Cropland” area [Equation 1] C , Y / Share (%) land used for temp/herb. crops C , Y
Secondly, the total cropped area was multiplied by the share of shrub and tree crops to derive the land area used for tree and shrub crops, with Equation 4 and 5 respectively: Eq. 4 Tree cropped areas C , Y (1000 ha) = % land used for tree crops C , Y *
Total cropped area [Equation 3] C , Y ; Eq. 5 Shrub cropped areas C , Y (1000 ha) = % land used for shrub crops C , Y
* Total cropped area [Equation 3] C , Y .
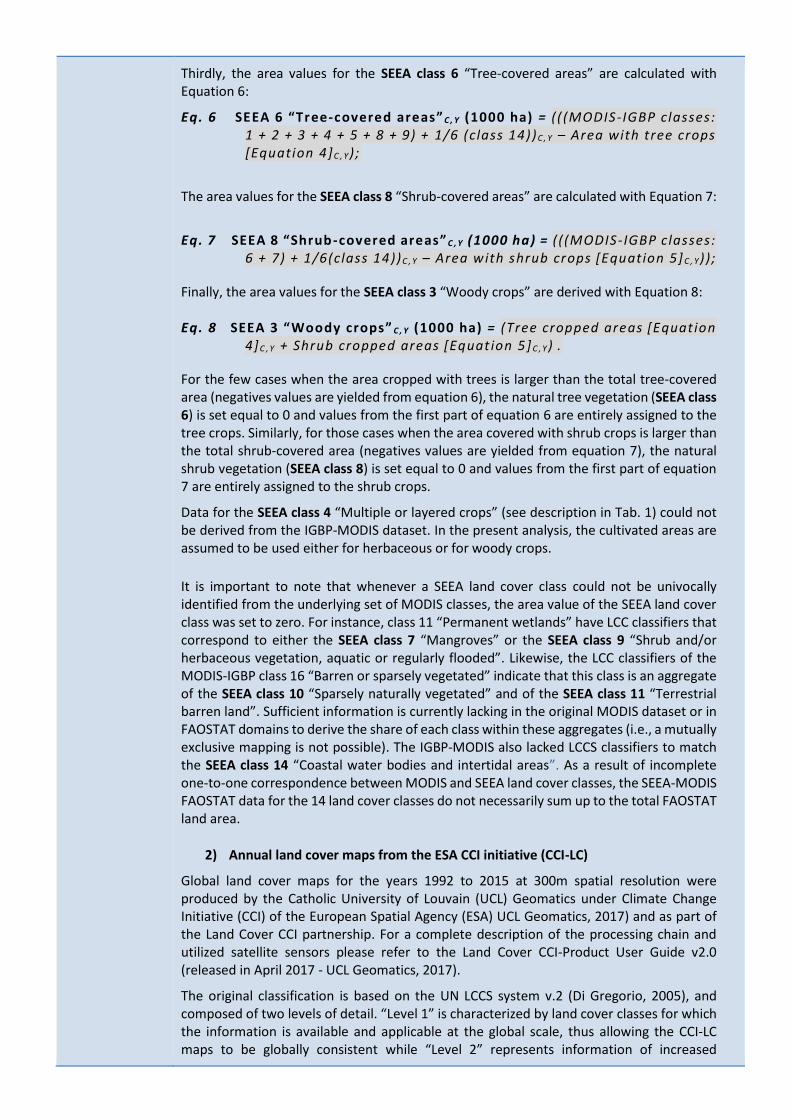
Thirdly, the area values for the SEEA class 6 “Tree-covered areas” are calculated with Equation 6:
Eq. 6 SEEA 6 “Tree -covered areas” C , Y (1000 ha) = (( (MODIS-IGBP classes: 1 + 2 + 3 + 4 + 5 + 8 + 9) + 1/6 (class 14))C , Y – Area with tree crops
[Equation 4]C , Y) ;
The area values for the SEEA class 8 “Shrub-covered areas” are calculated with Equation 7:
Eq. 7 SEEA 8 “Shrub -covered areas” C , Y (1000 ha) = (((MODIS-IGBP classes: 6 + 7) + 1/6(class 14))C , Y – Area with shrub crops [Equation 5] C , Y)) ;
Finally, the area values for the SEEA class 3 “Woody crops” are derived with Equation 8: Eq. 8 SEEA 3 “Woody crops” C , Y (1000 ha) = (Tree cropped areas [Equat ion
4]C , Y + Shrub cropped areas [Equat ion 5] C , Y) .
For the few cases when the area cropped with trees is larger than the total tree-covered area (negatives values are yielded from equation 6), the natural tree vegetation (SEEA class 6) is set equal to 0 and values from the first part of equation 6 are entirely assigned to the tree crops. Similarly, for those cases when the area covered with shrub crops is larger than the total shrub-covered area (negatives values are yielded from equation 7), the natural shrub vegetation (SEEA class 8) is set equal to 0 and values from the first part of equation 7 are entirely assigned to the shrub crops.
Data for the SEEA class 4 “Multiple or layered crops” (see description in Tab. 1) could not be derived from the IGBP-MODIS dataset. In the present analysis, the cultivated areas are assumed to be used either for herbaceous or for woody crops.
It is important to note that whenever a SEEA land cover class could not be univocally identified from the underlying set of MODIS classes, the area value of the SEEA land cover class was set to zero. For instance, class 11 “Permanent wetlands” have LCC classifiers that correspond to either the SEEA class 7 “Mangroves” or the SEEA class 9 “Shrub and/or herbaceous vegetation, aquatic or regularly flooded”. Likewise, the LCC classifiers of the MODIS-IGBP class 16 “Barren or sparsely vegetated” indicate that this class is an aggregate of the SEEA class 10 “Sparsely naturally vegetated” and of the SEEA class 11 “Terrestrial barren land”. Sufficient information is currently lacking in the original MODIS dataset or in FAOSTAT domains to derive the share of each class within these aggregates (i.e., a mutually exclusive mapping is not possible). The IGBP-MODIS also lacked LCCS classifiers to match the SEEA class 14 “Coastal water bodies and intertidal areas”. As a result of incomplete one-to-one correspondence between MODIS and SEEA land cover classes, the SEEA-MODIS FAOSTAT data for the 14 land cover classes do not necessarily sum up to the total FAOSTAT land area.
2) Annual land cover maps from the ESA CCI initiative (CCI-LC)
Global land cover maps for the years 1992 to 2015 at 300m spatial resolution were produced by the Catholic University of Louvain (UCL) Geomatics under Climate Change Initiative (CCI) of the European Spatial Agency (ESA) UCL Geomatics, 2017) and as part of the Land Cover CCI partnership. For a complete description of the processing chain and utilized satellite sensors please refer to the Land Cover CCI-Product User Guide v2.0 (released in April 2017 - UCL Geomatics, 2017).
The original classification is based on the UN LCCS system v.2 (Di Gregorio, 2005), and composed of two levels of detail. “Level 1” is characterized by land cover classes for which the information is available and applicable at the global scale, thus allowing the CCI-LC maps to be globally consistent while “Level 2” represents information of increased
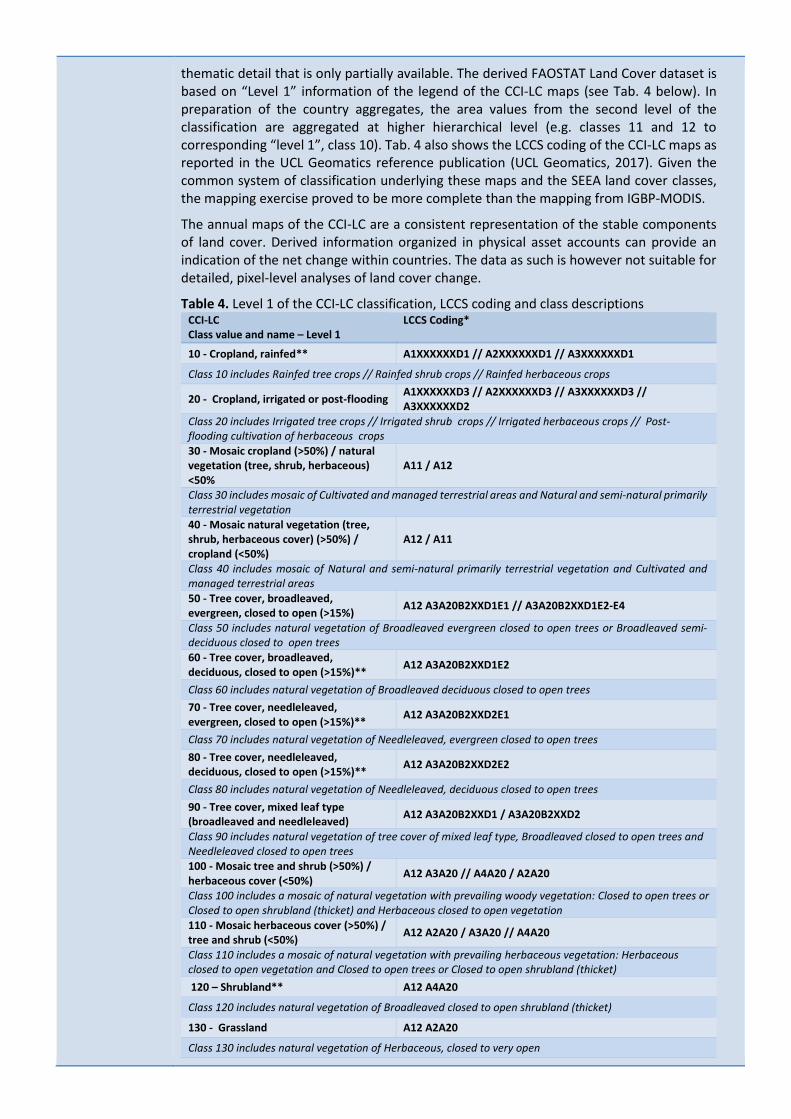
thematic detail that is only partially available. The derived FAOSTAT Land Cover dataset is based on “Level 1” information of the legend of the CCI-LC maps (see Tab. 4 below). In preparation of the country aggregates, the area values from the second level of the classification are aggregated at higher hierarchical level (e.g. classes 11 and 12 to corresponding “level 1”, class 10). Tab. 4 also shows the LCCS coding of the CCI-LC maps as reported in the UCL Geomatics reference publication (UCL Geomatics, 2017). Given the common system of classification underlying these maps and the SEEA land cover classes, the mapping exercise proved to be more complete than the mapping from IGBP-MODIS.
The annual maps of the CCI-LC are a consistent representation of the stable components of land cover. Derived information organized in physical asset accounts can provide an indication of the net change within countries. The data as such is however not suitable for detailed, pixel-level analyses of land cover change.
Table 4. Level 1 of the CCI-LC classification, LCCS coding and class descriptions CCI-LC Class value and name – Level 1
LCCS Coding*
10 - Cropland, rainfed** A1XXXXXXD1 // A2XXXXXXD1 // A3XXXXXXD1
Class 10 includes Rainfed tree crops // Rainfed shrub crops // Rainfed herbaceous crops
20 - Cropland, irrigated or post-flooding A1XXXXXXD3 // A2XXXXXXD3 // A3XXXXXXD3 // A3XXXXXXD2
Class 20 includes Irrigated tree crops // Irrigated shrub crops // Irrigated herbaceous crops // Post- flooding cultivation of herbaceous crops
30 - Mosaic cropland (>50%) / natural vegetation (tree, shrub, herbaceous) <50%
A11 / A12
Class 30 includes mosaic of Cultivated and managed terrestrial areas and Natural and semi-natural primarily terrestrial vegetation
40 - Mosaic natural vegetation (tree, shrub, herbaceous cover) (>50%) / cropland (<50%)
A12 / A11
Class 40 includes mosaic of Natural and semi-natural primarily terrestrial vegetation and Cultivated and managed terrestrial areas
50 - Tree cover, broadleaved, evergreen, closed to open (>15%)
A12 A3A20B2XXD1E1 // A3A20B2XXD1E2-E4
Class 50 includes natural vegetation of Broadleaved evergreen closed to open trees or Broadleaved semi-deciduous closed to open trees
60 - Tree cover, broadleaved, deciduous, closed to open (>15%)**
A12 A3A20B2XXD1E2
Class 60 includes natural vegetation of Broadleaved deciduous closed to open trees
70 - Tree cover, needleleaved, evergreen, closed to open (>15%)**
A12 A3A20B2XXD2E1
Class 70 includes natural vegetation of Needleleaved, evergreen closed to open trees
80 - Tree cover, needleleaved, deciduous, closed to open (>15%)**
A12 A3A20B2XXD2E2
Class 80 includes natural vegetation of Needleleaved, deciduous closed to open trees
90 - Tree cover, mixed leaf type (broadleaved and needleleaved)
A12 A3A20B2XXD1 / A3A20B2XXD2
Class 90 includes natural vegetation of tree cover of mixed leaf type, Broadleaved closed to open trees and Needleleaved closed to open trees 100 - Mosaic tree and shrub (>50%) / herbaceous cover (<50%)
A12 A3A20 // A4A20 / A2A20
Class 100 includes a mosaic of natural vegetation with prevailing woody vegetation: Closed to open trees or Closed to open shrubland (thicket) and Herbaceous closed to open vegetation
110 - Mosaic herbaceous cover (>50%) / tree and shrub (<50%)
A12 A2A20 / A3A20 // A4A20
Class 110 includes a mosaic of natural vegetation with prevailing herbaceous vegetation: Herbaceous closed to open vegetation and Closed to open trees or Closed to open shrubland (thicket)
120 – Shrubland** A12 A4A20
Class 120 includes natural vegetation of Broadleaved closed to open shrubland (thicket)
130 - Grassland A12 A2A20
Class 130 includes natural vegetation of Herbaceous, closed to very open
140 - Lichens and mosses A12 A7A20
Class 140 includes vegetation of closed to open lichens/mosses
150 - Sparse vegetation (tree, shrub, herbaceous cover) (<15%)**
A12 A3A14 // A4A14 // A2A14
Class 150 includes natural vegetation with sparse cover: Sparse trees or Herbaceous sparse vegetation or Sparse shrubs
160 - Tree cover, flooded, fresh or brackish water
A24 A3A20B2C1D1-R1 // A3A20B2C2D1-R1
Class 160 includes natural and semi-natural aquatic vegetation with of predominant tree type: Closed to open (100-40%) broadleaved trees on temporarily flooded land, water quality: fresh water or Closed to open (100-40%) broadleaved trees on permanently flooded land, water quality: fresh water
170 - Tree cover, flooded, saline water A24 A3A20B2C1D1-C5-R2 // A3A20B2C1D1-C5-R3
Class 170 includes natural and semi-natural aquatic vegetation of predominant tree type in saline water: Closed to open (100-40%) broadleaved trees on permanently flooded land (with daily variations), water quality: saline water or Closed to open (100- 40%) broadleaved trees on permanently flooded land (with daily variations), water quality: brackish water or Closed to open (100-40%) semi-deciduous shrubland on permanently flooded land (with daily variations), water quality: saline water or Closed to open (100-40%) semi-deciduous shrubland on permanently flooded land (with daily variations), water quality: brackish water
180 - Shrub or herbaceous cover, flooded, fresh/saline/brackish water
A24 A4A20B3C1 // A4A20B3C2 // A4A20B3C3 // A2A20B4C1 // A2A20B4C2 // A2A20B4C3
Class 180 includes natural and semi-natural aquatic vegetation of predominant shrub or herbaceous type in fresh, brackish or saline water quality: Closed to open shrubs on permanently flooded land or Closed to open herbaceous vegetation on permanently flooded land or Closed to open shrubs on temporarily flooded land or Closed to open herbaceous vegetation on temporarily flooded land or Closed to open shrubs on waterlogged soil or Closed to open herbaceous vegetation on waterlogged soil
190 - Urban areas B15
Class 190 includes Artificial surfaces and associated areas
200 - Bare areas** B16 A1 // A2
Class 200 includes Bare areas of either Consolidated or Unconsolidated Materials
210 - Water bodies B28 A1B1 // B27 A1B1
Class 210 includes Natural water bodies or Artificial water bodies
220 - Permanent snow and ice B27 A2B1 // A3B1 // B28 A2B1 // A3B1
Class 220 includes Natural Perennial snow or Perennial ice or Artificial Perennial snow or Perennial ice
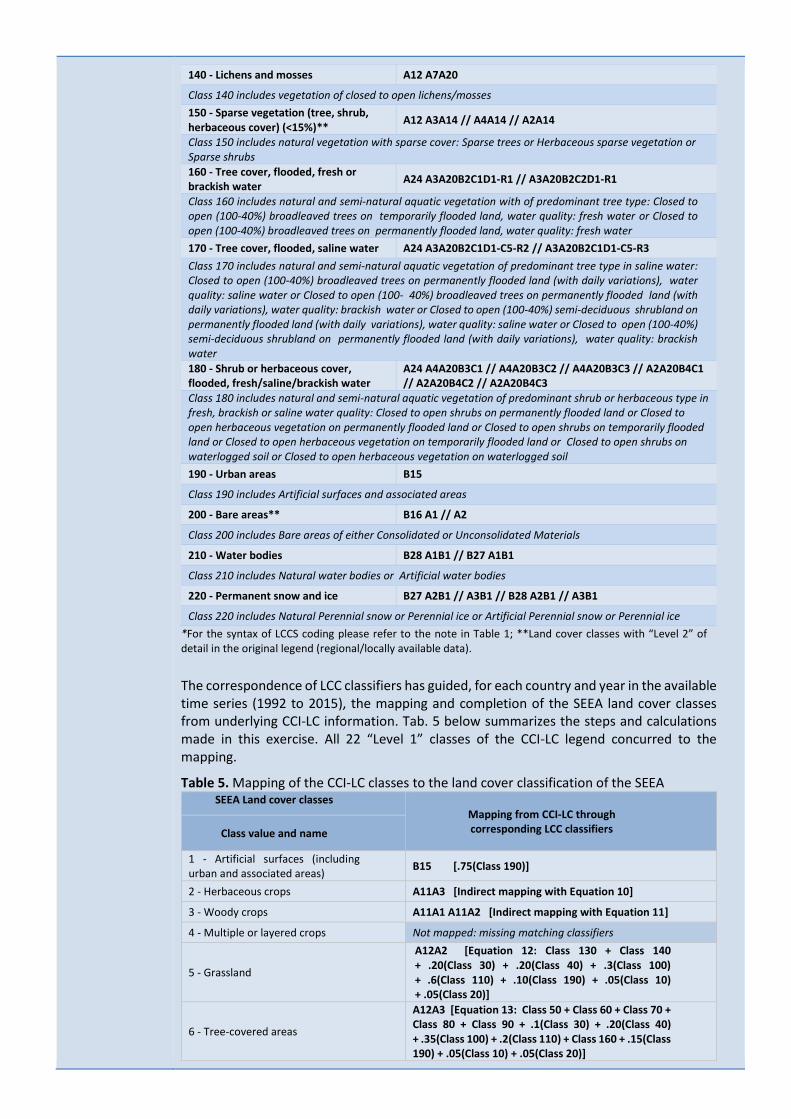
*For the syntax of LCCS coding please refer to the note in Table 1; **Land cover classes with “Level 2” of detail in the original legend (regional/locally available data).
The correspondence of LCC classifiers has guided, for each country and year in the available time series (1992 to 2015), the mapping and completion of the SEEA land cover classes from underlying CCI-LC information. Tab. 5 below summarizes the steps and calculations made in this exercise. All 22 “Level 1” classes of the CCI-LC legend concurred to the mapping.
Table 5. Mapping of the CCI-LC classes to the land cover classification of the SEEA SEEA Land cover classes
Mapping from CCI-LC through corresponding LCC classifiers
Class value and name
1 - Artificial surfaces (including urban and associated areas)
B15 [.75(Class 190)]
2 - Herbaceous crops A11A3 [Indirect mapping with Equation 10]
3 - Woody crops A11A1 A11A2 [Indirect mapping with Equation 11]
4 - Multiple or layered crops Not mapped: missing matching classifiers
5 - Grassland
A12A2 [Equation 12: Class 130 + Class 140 + .20(Class 30) + .20(Class 40) + .3(Class 100) + .6(Class 110) + .10(Class 190) + .05(Class 10) + .05(Class 20)]
6 - Tree-covered areas
A12A3 [Equation 13: Class 50 + Class 60 + Class 70 + Class 80 + Class 90 + .1(Class 30) + .20(Class 40) + .35(Class 100) + .2(Class 110) + Class 160 + .15(Class 190) + .05(Class 10) + .05(Class 20)]
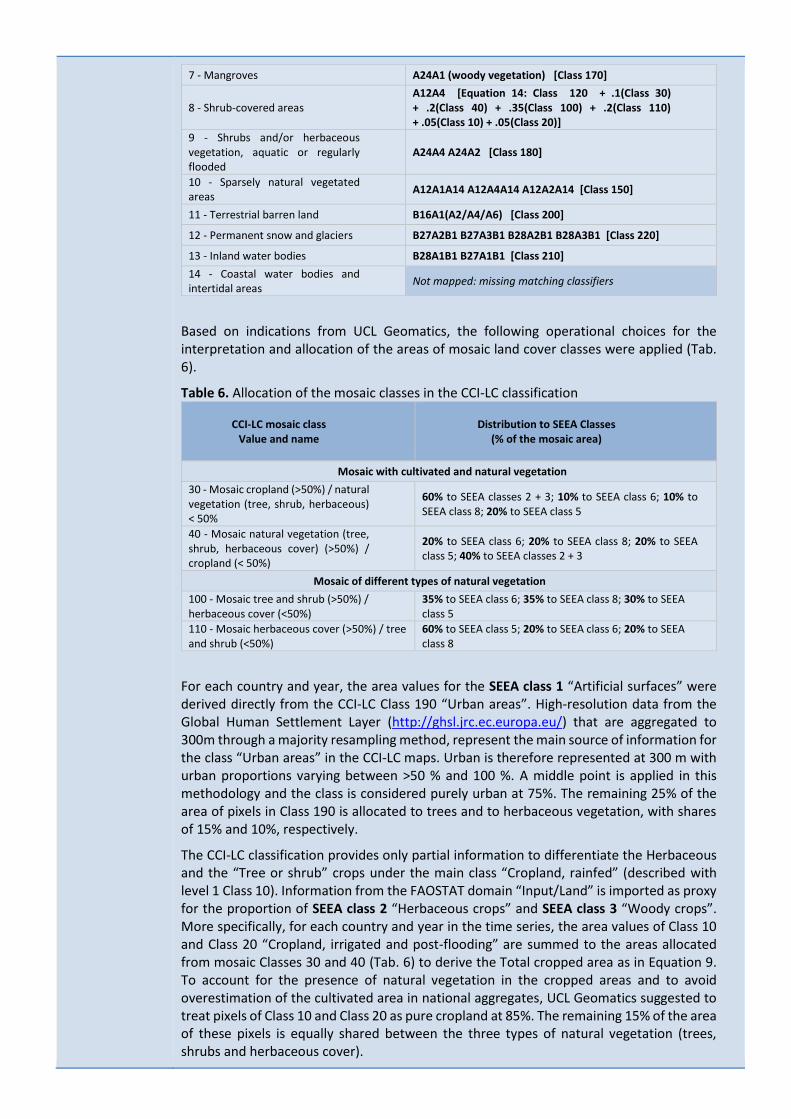
7 - Mangroves A24A1 (woody vegetation) [Class 170]
8 - Shrub-covered areas A12A4 [Equation 14: Class 120 + .1(Class 30) + .2(Class 40) + .35(Class 100) + .2(Class 110) + .05(Class 10) + .05(Class 20)]
9 - Shrubs and/or herbaceous vegetation, aquatic or regularly flooded
A24A4 A24A2 [Class 180]
10 - Sparsely natural vegetated areas
A12A1A14 A12A4A14 A12A2A14 [Class 150]
11 - Terrestrial barren land B16A1(A2/A4/A6) [Class 200]
12 - Permanent snow and glaciers B27A2B1 B27A3B1 B28A2B1 B28A3B1 [Class 220]
13 - Inland water bodies B28A1B1 B27A1B1 [Class 210]
14 - Coastal water bodies and intertidal areas
Not mapped: missing matching classifiers
Based on indications from UCL Geomatics, the following operational choices for the interpretation and allocation of the areas of mosaic land cover classes were applied (Tab. 6).
Table 6. Allocation of the mosaic classes in the CCI-LC classification
CCI-LC mosaic class Value and name
Distribution to SEEA Classes
(% of the mosaic area)
Mosaic with cultivated and natural vegetation
30 - Mosaic cropland (>50%) / natural vegetation (tree, shrub, herbaceous) < 50%
60% to SEEA classes 2 + 3; 10% to SEEA class 6; 10% to SEEA class 8; 20% to SEEA class 5
40 - Mosaic natural vegetation (tree, shrub, herbaceous cover) (>50%) / cropland (< 50%)
20% to SEEA class 6; 20% to SEEA class 8; 20% to SEEA class 5; 40% to SEEA classes 2 + 3
Mosaic of different types of natural vegetation
100 - Mosaic tree and shrub (>50%) / herbaceous cover (<50%)
35% to SEEA class 6; 35% to SEEA class 8; 30% to SEEA class 5
110 - Mosaic herbaceous cover (>50%) / tree and shrub (<50%)
60% to SEEA class 5; 20% to SEEA class 6; 20% to SEEA class 8
For each country and year, the area values for the SEEA class 1 “Artificial surfaces” were derived directly from the CCI-LC Class 190 “Urban areas”. High-resolution data from the Global Human Settlement Layer (http://ghsl.jrc.ec.europa.eu/) that are aggregated to 300m through a majority resampling method, represent the main source of information for the class “Urban areas” in the CCI-LC maps. Urban is therefore represented at 300 m with urban proportions varying between >50 % and 100 %. A middle point is applied in this methodology and the class is considered purely urban at 75%. The remaining 25% of the area of pixels in Class 190 is allocated to trees and to herbaceous vegetation, with shares of 15% and 10%, respectively.
The CCI-LC classification provides only partial information to differentiate the Herbaceous and the “Tree or shrub” crops under the main class “Cropland, rainfed” (described with level 1 Class 10). Information from the FAOSTAT domain “Input/Land” is imported as proxy for the proportion of SEEA class 2 “Herbaceous crops” and SEEA class 3 “Woody crops”. More specifically, for each country and year in the time series, the area values of Class 10 and Class 20 “Cropland, irrigated and post-flooding” are summed to the areas allocated from mosaic Classes 30 and 40 (Tab. 6) to derive the Total cropped area as in Equation 9. To account for the presence of natural vegetation in the cropped areas and to avoid overestimation of the cultivated area in national aggregates, UCL Geomatics suggested to treat pixels of Class 10 and Class 20 as pure cropland at 85%. The remaining 15% of the area of these pixels is equally shared between the three types of natural vegetation (trees, shrubs and herbaceous cover).
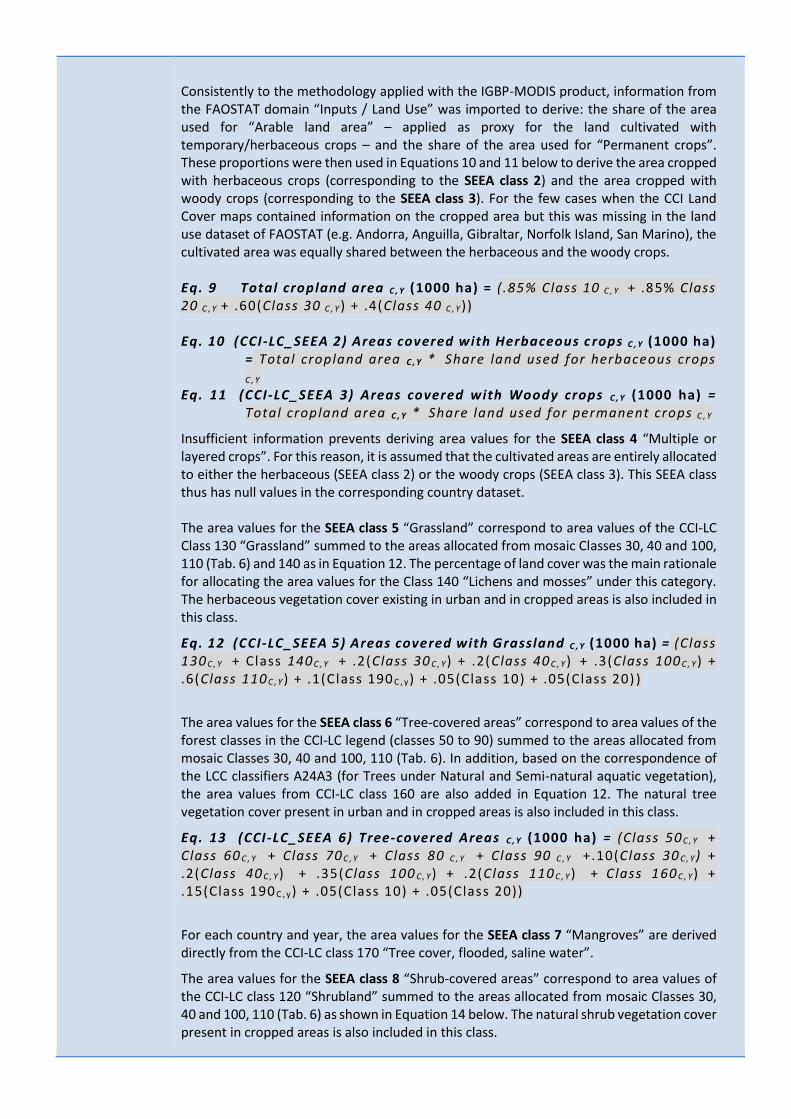
Consistently to the methodology applied with the IGBP-MODIS product, information from the FAOSTAT domain “Inputs / Land Use” was imported to derive: the share of the area used for “Arable land area” – applied as proxy for the land cultivated with temporary/herbaceous crops – and the share of the area used for “Permanent crops”. These proportions were then used in Equations 10 and 11 below to derive the area cropped with herbaceous crops (corresponding to the SEEA class 2) and the area cropped with woody crops (corresponding to the SEEA class 3). For the few cases when the CCI Land Cover maps contained information on the cropped area but this was missing in the land use dataset of FAOSTAT (e.g. Andorra, Anguilla, Gibraltar, Norfolk Island, San Marino), the cultivated area was equally shared between the herbaceous and the woody crops. Eq. 9 Total cropland area C , Y (1000 ha) = ( .85% Class 10 C , Y + .85% Class 20 C , Y + .60(Class 30 C , Y ) + .4(Class 40 C , Y )) Eq. 10 (CCI-LC_SEEA 2) Areas covered with Herbaceous c rops C , Y (1000 ha)
= Total cropland area C , Y * Share land used for herbaceous crops
C , Y Eq. 11 (CCI-LC_SEEA 3) Areas covered with Woody crops C , Y (1000 ha) =
Total cropland area C , Y * Share land used for permanent crops C , Y
Insufficient information prevents deriving area values for the SEEA class 4 “Multiple or layered crops”. For this reason, it is assumed that the cultivated areas are entirely allocated to either the herbaceous (SEEA class 2) or the woody crops (SEEA class 3). This SEEA class thus has null values in the corresponding country dataset. The area values for the SEEA class 5 “Grassland” correspond to area values of the CCI-LC Class 130 “Grassland” summed to the areas allocated from mosaic Classes 30, 40 and 100, 110 (Tab. 6) and 140 as in Equation 12. The percentage of land cover was the main rationale for allocating the area values for the Class 140 “Lichens and mosses” under this category. The herbaceous vegetation cover existing in urban and in cropped areas is also included in this class.
Eq. 12 (CCI-LC_SEEA 5) Areas covered with Grassland C , Y (1000 ha) = (Class 130C , Y + Class 140C , Y + .2(Class 30 C , Y) + .2(Class 40 C , Y) + .3(Class 100 C , Y) + .6(Class 110C , Y ) + .1(Class 190 C , y) + .05(Class 10) + .05(Class 20) )
The area values for the SEEA class 6 “Tree-covered areas” correspond to area values of the forest classes in the CCI-LC legend (classes 50 to 90) summed to the areas allocated from mosaic Classes 30, 40 and 100, 110 (Tab. 6). In addition, based on the correspondence of the LCC classifiers A24A3 (for Trees under Natural and Semi-natural aquatic vegetation), the area values from CCI-LC class 160 are also added in Equation 12. The natural tree vegetation cover present in urban and in cropped areas is also included in this class.
Eq. 13 (CCI-LC_SEEA 6) Tree-covered Areas C , Y (1000 ha) = (Class 50C , Y + Class 60 C , Y + Class 70C , Y + Class 80 C , Y + Class 90 C , Y +.10(Class 30 C , Y) + .2(Class 40 C , Y) + .35(Class 100 C , Y) + .2(Class 110C , Y ) + Class 160 C , Y) + .15(Class 190 C , y) + .05(Class 10) + .05(Class 20))
For each country and year, the area values for the SEEA class 7 “Mangroves” are derived directly from the CCI-LC class 170 “Tree cover, flooded, saline water”.
The area values for the SEEA class 8 “Shrub-covered areas” correspond to area values of the CCI-LC class 120 “Shrubland” summed to the areas allocated from mosaic Classes 30, 40 and 100, 110 (Tab. 6) as shown in Equation 14 below. The natural shrub vegetation cover present in cropped areas is also included in this class.
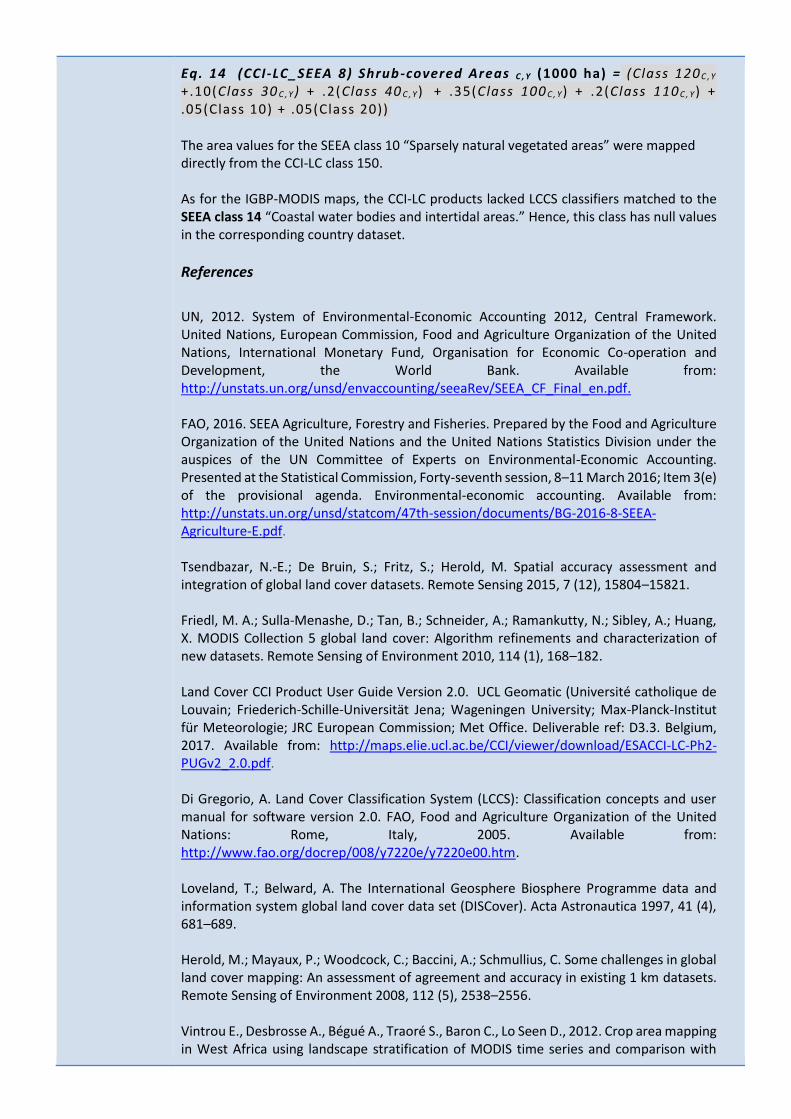
Eq. 14 (CCI-LC_SEEA 8) Shrub-covered Areas C , Y (1000 ha) = (Class 120C , Y +.10(Class 30 C , Y ) + .2(Class 40 C , Y) + .35(Class 100 C , Y) + .2(Class 110 C , Y) + .05(Class 10) + .05(Class 20))
The area values for the SEEA class 10 “Sparsely natural vegetated areas” were mapped directly from the CCI-LC class 150. As for the IGBP-MODIS maps, the CCI-LC products lacked LCCS classifiers matched to the SEEA class 14 “Coastal water bodies and intertidal areas.” Hence, this class has null values in the corresponding country dataset.
References
UN, 2012. System of Environmental-Economic Accounting 2012, Central Framework. United Nations, European Commission, Food and Agriculture Organization of the United Nations, International Monetary Fund, Organisation for Economic Co-operation and Development, the World Bank. Available from: http://unstats.un.org/unsd/envaccounting/seeaRev/SEEA_CF_Final_en.pdf. FAO, 2016. SEEA Agriculture, Forestry and Fisheries. Prepared by the Food and Agriculture Organization of the United Nations and the United Nations Statistics Division under the auspices of the UN Committee of Experts on Environmental-Economic Accounting. Presented at the Statistical Commission, Forty-seventh session, 8–11 March 2016; Item 3(e) of the provisional agenda. Environmental-economic accounting. Available from: http://unstats.un.org/unsd/statcom/47th-session/documents/BG-2016-8-SEEA-Agriculture-E.pdf. Tsendbazar, N.-E.; De Bruin, S.; Fritz, S.; Herold, M. Spatial accuracy assessment and integration of global land cover datasets. Remote Sensing 2015, 7 (12), 15804–15821. Friedl, M. A.; Sulla-Menashe, D.; Tan, B.; Schneider, A.; Ramankutty, N.; Sibley, A.; Huang, X. MODIS Collection 5 global land cover: Algorithm refinements and characterization of new datasets. Remote Sensing of Environment 2010, 114 (1), 168–182. Land Cover CCI Product User Guide Version 2.0. UCL Geomatic (Université catholique de Louvain; Friederich-Schille-Universität Jena; Wageningen University; Max-Planck-Institut für Meteorologie; JRC European Commission; Met Office. Deliverable ref: D3.3. Belgium, 2017. Available from: http://maps.elie.ucl.ac.be/CCI/viewer/download/ESACCI-LC-Ph2-PUGv2_2.0.pdf. Di Gregorio, A. Land Cover Classification System (LCCS): Classification concepts and user manual for software version 2.0. FAO, Food and Agriculture Organization of the United Nations: Rome, Italy, 2005. Available from: http://www.fao.org/docrep/008/y7220e/y7220e00.htm. Loveland, T.; Belward, A. The International Geosphere Biosphere Programme data and information system global land cover data set (DISCover). Acta Astronautica 1997, 41 (4), 681–689. Herold, M.; Mayaux, P.; Woodcock, C.; Baccini, A.; Schmullius, C. Some challenges in global land cover mapping: An assessment of agreement and accuracy in existing 1 km datasets. Remote Sensing of Environment 2008, 112 (5), 2538–2556. Vintrou E., Desbrosse A., Bégué A., Traoré S., Baron C., Lo Seen D., 2012. Crop area mapping in West Africa using landscape stratification of MODIS time series and comparison with
existing global land products. International Journal of Applied Earth Observation and Geoinformation, Volume 14, Issue 1, 83–89. Leroux L., Jolivot A., Bégué A., Lo Seen D., 2014. How reliable is the MODIS Land Cover Product for Crop Mapping Sub-Saharan Agricultural Landscapes? Remote sensing 2014, 6, 8541–8564; doi:10.3390/rs6098541.
FAO, 2015. World Programme for the Census of Agriculture 2020. Volume 1. Programme, concepts and definitions; FAO Statistical Development Series 15; Food and Agriculture Organization (FAO) of the United Nations: 204 pp. Available from: http://www.fao.org/3/a-i4913e.pdf. Monfreda, C., Ramankutty, N., Foley, J. A, 2008. Farming the planet: 2. Geographic distribution of crop areas, yields, physiological types, and net primary production in the year 2000. Global Biogeochemical Cycles 2008, 22 (1).
Data Collection Method
Computed
Completeness 100%
Useful Links http://faostat3.fao.org/home/E http://unstats.un.org/unsd/envaccounting/seearev/ http://www.fao.org/economic/ess/environment/seea/en/ http://glcf.umd.edu/data/lc/ http://maps.elie.ucl.ac.be/CCI/viewer/
Distribution Information:
Owner FAO Provider FAO Source FAO Copyright Policy
Content on www.fao.org, its affiliated websites and specific pages (collectively "the FAO website") is protected by copyright. To ensure wide dissemination of its information, FAO is committed to making its content freely available and encourages the use, reproduction and dissemination of the text, multimedia and data products presented. Except where otherwise indicated, content may be copied, printed and downloaded for private study, research and teaching purposes, or for use in non-commercial products or services, provided that appropriate acknowledgement of FAO as the source and copyright holder is given and that FAO's endorsement of users' views, products or services is not stated or implied in any way. FAO encourages unrestricted use of news releases provided on the FAO website, and no formal permission is required to reproduce these materials. All requests for translation and adaptation rights, and for resale and other commercial use rights should be addressed to [email protected] or submitted via the online Licence Request Form when downloading.
Citation FAO, 2017. FAOSTAT Agri-Environmental Indicators, Land Cover http://www.fao.org/faostat/en/#data/LC
Acknowledgements
The FAOSTAT Agri-Environmental Indicators domains are developed and maintained by the Environmental Statistics Team, FAO Statistics Division (ESS), with Regular Programme Funding under O6 and SO2. The Université Catholique de Louvain (UCL) Geomatics, the Boston University and the Environment Statistics section of the United Nations Statistics Division (UNSD) provided useful comments that contributed to refining this methodology.


![Randolph Glacier Inventory: A Dataset of Global Glacier ... · Zheltyhina. 2012, Randolph Glacier Inventory [v2.0]: A Dataset of Global Glacier Outlines. Global Land Ice Measurements](https://img.pdfslide.us/doc/110x75/5f1037d37e708231d448062a/randolph-glacier-inventory-a-dataset-of-global-glacier-zheltyhina-2012-randolph.jpg)


![Global land use implications of dietary trends · with ongoing global dietary trends. We used the FAOSTAT database [2] to compile the food supply quantity for each of the commodity](https://img.pdfslide.us/doc/110x75/6013fc2da6246c4d026dbb2d/global-land-use-implications-of-dietary-trends-with-ongoing-global-dietary-trends.jpg)