Embed Size (px)
Citation preview

7/28/2019 Datamining in Medical Applications
http://slidepdf.com/reader/full/datamining-in-medical-applications 1/33
Alfred M. Mutiso
Course 6 Independent Study
6.199 Advanced Undergraduate ProjectFinal Draft
DATAMINING IN MEDICAL APPLICATIONS:
COMPUTER-AIDED DIAGNOSIS (CAD) IN MEDICAL IMAGING
WITH AN EMPHASIS ON MAMMOGRAPHY
Abstract
This study focuses on medical image analysis techniques used in radiological pro-
cesses; specifically, the analysis of mammograms by computer-aided diagnosis systems
that attempt to provide both sensitivity and specificity in the identification of anoma-
lies in mammograms and other types of medical images. An assembly of the strongest
techniques into a coherent CAD system is then proposed is Section 4. A large list of
references are compiled at the end of this paper for further study, with links to printed
materials where applicable.
1 Introduction
Medical image analysis is an extremely broad and well-studied field with a vast panoply
of techniques in existence, both as the focus for research and as the theoretical bases for
an increasing number of increasingly complex medical imaging systems. This study aims to
study a variety of these image analysis techniques as applied to digital mammography in
general and the detection of breast carcinomas and other anomalies in particular.
1

7/28/2019 Datamining in Medical Applications
http://slidepdf.com/reader/full/datamining-in-medical-applications 2/33
Breast cancer ranks first in the causes of cancer deaths among women and is second only
to cervical cancer in developing countries[8]. The best way to reduce death rates due to this
disease is to treat it at an early stage. Early diagnosis of breast cancer requires an effective
procedure to allow physicians to differentiate between benign tumors from malignant ones.
Developing computer-aided diagnosis (CAD) systems to help with this task is a non-trivial
problem, and current methods employed in pursuit of this goal illustrate the difficulty in
maximizing both sensitivity to tumoral growths and specificity in identifying their nature.
X-ray mammography is the best current method for early detection of breast cancer, with
an accuracy of between 85% and 95%[3]. Identifying abnormalities such as calcifications and
masses often requires the eye of a trained radiologist. As a result, some anomalies may be
missed due to human error as a result of fatigue, etc. The development of CAD systems
that assist the radiologist has thus become of prime interest, the aim being not to replace
the radiologist but to offer a second opinion. Eventually, the state-of-the-art could advance
to the point where such systems effectively substitute for trained radiologists, an eventuality
that is desirable for small outfits that cannot afford to have an expert radiologist at their
continuous disposal. For example, a CAD system could scan a mammogram and draw red
circles around suspicious areas. Later, a radiologist can examine these areas and determine
whether they are true lesions or whether they are artifacts of the scanning process, such as
shadows.
2

7/28/2019 Datamining in Medical Applications
http://slidepdf.com/reader/full/datamining-in-medical-applications 3/33
2 Background
Considerable effort has been expended to develop CAD systems to aid the trained ra-
diologist identify areas with possible pathology on an image. Most of these efforts have
concentrated on X-ray mammography and chest radiography. A number of CAD schemes
have been investigated in literature. These include:
• subtraction techniques that identify anomalies by comparison with normal tissue
• topographic techniques that perform feature extraction and analysis to identify anoma-
lies
• filtering techniques that use digital signal processing filters, often developed especially
to augment anomalies for easy detection
• staged expert systems that perform rule-based analysis of image data in an attempt to
provide a correct diagnosis
The majority of CAD systems attempt to identify anomalies by either looking for image
differences based on comparison with known normal tissue (subtraction techniques)[4] or
by image feature identification and extraction of features that correlate with pathological
anomalies, such as in texture analysis (topographic techniques)[11, 4, 6, 36]. Most systems
proceed in stages, first examining the image data and extracting pre-determined features,
then localizing regions of interest or ROIs which can be examined further for potential
anomalies. High degrees of sensitivity have been achieved using several of these techniques,
but many have been hampered by high false-positive rates and hence low specificity . The
problem of false positives is compounded further by the fact that false positive rates are
3
7/28/2019 Datamining in Medical Applications
http://slidepdf.com/reader/full/datamining-in-medical-applications 4/33
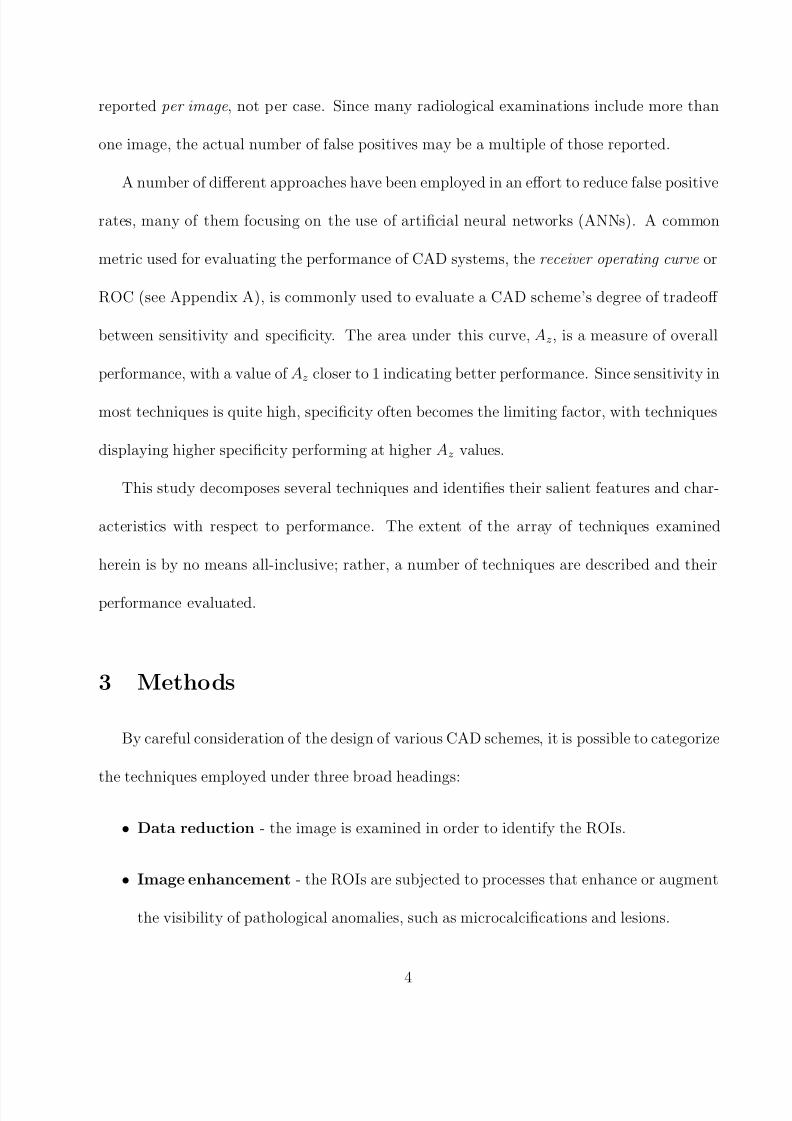
reported per image , not per case. Since many radiological examinations include more than
one image, the actual number of false positives may be a multiple of those reported.
A number of different approaches have been employed in an effort to reduce false positive
rates, many of them focusing on the use of artificial neural networks (ANNs). A common
metric used for evaluating the performance of CAD systems, the receiver operating curve or
ROC (see Appendix A), is commonly used to evaluate a CAD scheme’s degree of tradeoff
between sensitivity and specificity. The area under this curve, Az, is a measure of overall
performance, with a value of Az closer to 1 indicating better performance. Since sensitivity in
most techniques is quite high, specificity often becomes the limiting factor, with techniques
displaying higher specificity performing at higher Az values.
This study decomposes several techniques and identifies their salient features and char-
acteristics with respect to performance. The extent of the array of techniques examined
herein is by no means all-inclusive; rather, a number of techniques are described and their
performance evaluated.
3 Methods
By careful consideration of the design of various CAD schemes, it is possible to categorize
the techniques employed under three broad headings:
• Data reduction - the image is examined in order to identify the ROIs.
• Image enhancement - the ROIs are subjected to processes that enhance or augment
the visibility of pathological anomalies, such as microcalcifications and lesions.
4

7/28/2019 Datamining in Medical Applications
http://slidepdf.com/reader/full/datamining-in-medical-applications 5/33
• Diagnosis - the ROIs are subjected to one or more of the broad categories of procedures
mentioned in Section 2 in order to arrive at a diagnosis, most commonly in the form
of “benign” or “malignant”
These categories are extremely broad, and there may exist CAD systems that subject
images to techniques that do not fall under one of them. However, most of the CAD systems
employ methods that can be classified under one or more of them.
3.1 Data Reduction
Data reduction is the process by which an image is decomposed into a collection of regions
that appear to contain anomalies that differ from the surrounding tissue. These regions are
usually a strict subset of the original image and are subregions of the original image that may
contain ROIs. By doing this, the CAD system need only process those subregions identified
by the data reduction step, rather than the entire input image. Data reduction accomplishes
two objectives simultaneously[34]:
• An increase in throughput via a reduction in input data
• A reduction in false positives by limiting the scope of the detection algorithms in the
rest of the CAD system to the ROIs only. With less of the original image to worry
about, the CAD system gains specificity since less image means less false-positives in
general, assuming that the detection algorithms work as intended.
It is clear that the most obvious way to perform data reduction is to have a trained radiol-
ogist identify the ROIs for the CAD system. This can be accomplished through a graphical
5
7/28/2019 Datamining in Medical Applications
http://slidepdf.com/reader/full/datamining-in-medical-applications 6/33
interface to the CAD system that allows the radiologist to specify suspicious regions. It
should be noted that some CAD systems do not require this step at all due to the nature of
their diagnostic process, such as that those that employ subtraction techniques.
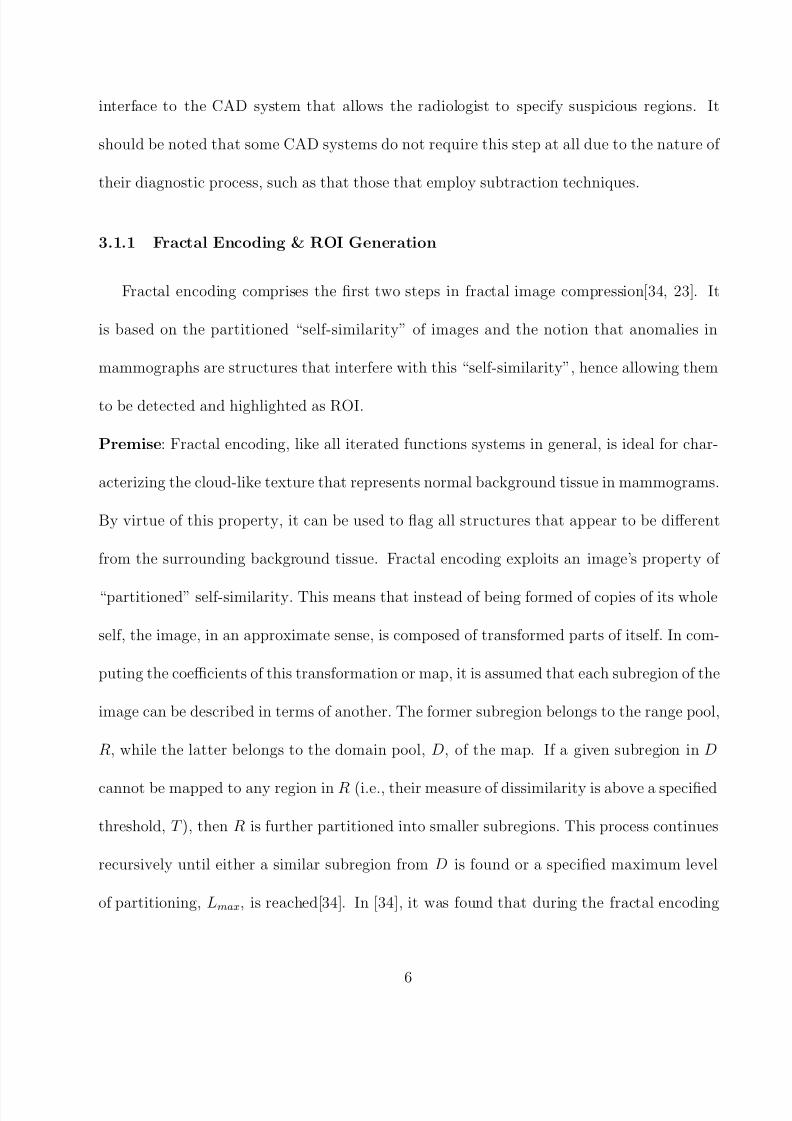
3.1.1 Fractal Encoding & ROI Generation
Fractal encoding comprises the first two steps in fractal image compression[34, 23]. It
is based on the partitioned “self-similarity” of images and the notion that anomalies in
mammographs are structures that interfere with this “self-similarity”, hence allowing them
to be detected and highlighted as ROI.
Premise: Fractal encoding, like all iterated functions systems in general, is ideal for char-
acterizing the cloud-like texture that represents normal background tissue in mammograms.
By virtue of this property, it can be used to flag all structures that appear to be different
from the surrounding background tissue. Fractal encoding exploits an image’s property of
“partitioned” self-similarity. This means that instead of being formed of copies of its whole
self, the image, in an approximate sense, is composed of transformed parts of itself. In com-
puting the coefficients of this transformation or map, it is assumed that each subregion of the
image can be described in terms of another. The former subregion belongs to the range pool,
R, while the latter belongs to the domain pool, D, of the map. If a given subregion in D
cannot be mapped to any region in R (i.e., their measure of dissimilarity is above a specified
threshold, T ), then R is further partitioned into smaller subregions. This process continues
recursively until either a similar subregion from D is found or a specified maximum level
of partitioning, Lmax, is reached[34]. In [34], it was found that during the fractal encoding
6

7/28/2019 Datamining in Medical Applications
http://slidepdf.com/reader/full/datamining-in-medical-applications 7/33
process, Lmax was reached for subregions in R that contain mammographic abnormalities.
This makes sense because anomalies are dissimilar to normal tissue and hence cannot be de-
scribed in terms of normal tissue. Subregions for which Lmax is reached therefore constitute
the ROI. This is illustrated in Figure 1[34].
Method: In their study, Sari Sarraf et al[34] split the digitized image into a number of
(512x512) sub-images that are then processed independently. Each sub-image is the pro-
cessed as follows: the image is first subjected to fractal encoding, then the resulting encoded
image is subjected to the quad-tree partitioning scheme[34] using appropriate values for Lmax
and T . Figure 1 illustrates this. Once partitioned, the system then identifies those subre-
gions that never satisfied the similarity condition (i.e. those that reached the maximum level
of recursion Lmax). These are the ROI. The system simply discards the rest of the image and
passes the ROI to the rest of the CAD system. Figure 1 includes noise filtering before fractal
encoding as well. This is because the presence of noise in some of the sub-images was shown
to significantly interfere with the encoding process, often causing the system to reports ROIs
in sub-images that clearly had none. Sari Sarraf et al[34] used the simplest noise removal
technique available - neighborhood averaging. Doing so alleviated the problem, though most
sophisticated schemes could have been employed.
Results: The project achieved an average data reduction of 83% over the 80 mammogram
set they had used. That means that each sub-image was reduced by a further 83% on average,
leaving only its ROIs for the detection algorithms to work on. The project also achieved an
86% reduction in false detections by the CAD system when using front-end data reduction.
As mentioned before, this improvement is due to the fact that the detection algorithms were
7

7/28/2019 Datamining in Medical Applications
http://slidepdf.com/reader/full/datamining-in-medical-applications 8/33
applied to ROIs alone rather than entire images. The project also achieved a coverage rate
of 92% - that is, out of all microcalcifications present in the mammograms, 92% of them
ended up in the ROIs generated by the data reduction process.
From the results, it is clear that fractal encoding holds a great deal of promise as a means
of increasing the performance of CAD systems by increasing their throughput and reducing
the proportion of false-positives. This data reduction process can constitute a front-end data
reduction module that can be used to augment almost any CAD system, as suggested in [34]
and illustrated in Figure 1.
8

7/28/2019 Datamining in Medical Applications
http://slidepdf.com/reader/full/datamining-in-medical-applications 9/33
FractalEncodingQuad-tree
decomposition
ROIGeneration Pruning
Noisefilter
originalimage(a)
TLmax
quad-treepartitioned
image(b)
imagewithregionsthatneversatisfiedsimilaritycondition
(c)
generatedROIs
(d)
Front-enddata
reductionmodule
(restofCADsystem) IMAGES
Figure 1: Overview of front-end data reduction module with images[34]. Images: (a) A digital
mammogram with clustered microcalcifications in the lower portion of the image. (b) Quad-tree
partitioning as a result of the fractal encoding of the image in (a) for Lmax = 6 (i.e., smallest
sub-images are 8 x 8) and T = 3.4. (c) Those subregions and their 8-neighbors in (b) that never
satisfied the similarity condition. (d) Generated FARs ( focus of attention regions ) or ROI; note
their concentration in the lower portion of the image.
9

7/28/2019 Datamining in Medical Applications
http://slidepdf.com/reader/full/datamining-in-medical-applications 10/33
3.2 Image Enhancement
Mammographic image enhancement methods are typically aimed at either improvement
of the overall visibility of features or enhancement of a specific sign of malignancy. Various
schemes for doing this exist, with most of them based in signal processing techniques used
either in their original form (such as simple histogram equalization) or adapted for specific
use in mammography.
A number of generic image enhancement methods exist. Histogram equalization and fuzzy
image enhancement[35] are just two examples. Though a whole slew of image enhancement
techniques exist in the general domain, very few are specifically targeted at the enhancement
of mammographic images. Section 3.2.1 describes one of them.
3.2.1 Wavelet-based enhancement
Koren et al[18] developed a contrast enhancement method based on the adaptation of
specific enhancement schemes for distinct mammographic features, which were then used to
combine the set of processed images into an enhanced image. In their scheme, the mammo-
graphic image is first processed for enhancement of microcalcifications, masses and stellate
lesions. From the resulting enhanced image, the final enhanced image is synthesized by
means of image fusion[20]. Specifically, their algorithm consisted of two major steps:
1. the image is first subjected to a redundant B-spline wavelet transform decomposition [18]
from which a set of wavelet coefficients is obtained
2. the wavelet coefficients are modified distinctly for each type of malignancy (microcal-
cifications, stellate lesions or circumscribed masses).
10

7/28/2019 Datamining in Medical Applications
http://slidepdf.com/reader/full/datamining-in-medical-applications 11/33
3. the multiple sets of coefficients thus obtained are fused into a single set from which the
reconstruction is computed
The algorithm is illustrated in Figure 2, as applied to a digitized mammogram that they
obtained from the University of Florida database. The theoretical treatment for the mathe-
matics involved in this scheme is beyond the scope of this study. However, it is interesting to
note that the enhance image produced by this scheme is “more easily interpreted by a radi-
ologist compared to images produced via global enhancement techniques”[18]. It is yet to be
seen what improvement this enhancement scheme can contribute to existing CAD schemes.
11

7/28/2019 Datamining in Medical Applications
http://slidepdf.com/reader/full/datamining-in-medical-applications 12/33
inputmammogram
B-SplineWaveletDecomposition
FusionofCoefficients
WaveletCoefficient
Modification
waveletcoefficients
contrast-enhancedmammogram
enhancedmammogram
Figure 2: Overview of the image fusion algorithm based on B-Spline Wavelet Transform[18]
12

7/28/2019 Datamining in Medical Applications
http://slidepdf.com/reader/full/datamining-in-medical-applications 13/33
3.3 Computer-Aided Diagnosis Techniques
Quite apart from the aforementioned front-end data reduction and image enhancements
techniques is the classification scheme used to diagnose the pathology of the mammogram.
These range from techniques that classify lesions according to types (stellate, circumscribed,
calcifications, thickened skin syndrome,etc)[30] to techniques that produce binary diagnoses
(malignant, benign). The underlying techniques supporting and generating these diagnoses
are quite varied and range from artificial neural networks[1, 8, 13] to statistical, signal pro-
cessing and mathematical modeling techniques[2, 30, 4, 19, 18, 24] techniques, as well as
others that incorporate different techniques[6] into one coherent system. A number of them
with useful features are examined here.
3.3.1 Neural Networks
Artificial neural networks (ANNs) are by far the most commonly used constructs in CAD
systems due to the ability to perform well in problems that are structural in nature[19], and
have excelled in problems of pattern recognition. In mammography, ANNs have been studied
as a way to reduce the rate of detection of false-positive anomalies, which in turn improves
the specificity of the CAD system.
ANNs are trained in one of two ways: supervised learning, where both input data and
corresponding outputs are provided during training, and unsupervised learning, where input
data is provided and a criteria for judging outputs is determined. Auto-associative learning
is a form of unsupervised learning in which the ANN attempts to learn an identity mapping;
specifically, the ANN seeks to minimize the error in the generation of this identity mapping,
13

7/28/2019 Datamining in Medical Applications
http://slidepdf.com/reader/full/datamining-in-medical-applications 14/33
a feature that can be used to provide efficient and compact encodings of the data[19].
ANNs are limited in at least four related ways[19]:
• the quantity of data required for each case determines the size of the input layer, which
in turn determines the size of the network. A large number of inputs exponentially
increases the time required to train the network as well as the complexity of the learning
process.
• the size of the data set determines the number of times the inputs are presented to the
network during each training cycle. If the members of the data set are considerably
diverse, they may increase the complexity of the learning process.
• a fixed data set size and increased number of connections leads to an excess of connec-
tions in the ANN and more likely to result in poor generalization
• the training data set must be adequate in representation and depth.
As far as is known, no known techniques exist that use ANNs to directly analyze and de-
tect anomalies from entire digitized medical images without first using extraction techniques.
Some studies have applied ANNs to specific ROIs, while others have required that the input
for the ANNs undergo preliminary enhancement of specific features, such as density and
edges[19].
Chen et al[8] used the output of a two-dimension autocorrelation matrix computation
performed on an ROI as the input for their neural network. This was based on the premise
that a grayscale ultrasonogram shows different tissues with remarkably different textures.
Benign tumors are described as “regular masses with homogenous internal echoes”, but
14

7/28/2019 Datamining in Medical Applications
http://slidepdf.com/reader/full/datamining-in-medical-applications 15/33
carcinomas are described as “masses with fuzzy borders and heterogenous internal echoes.
Based on this, they used the correlation between neighboring pixels on the images as a basis
for classifying the tumors. Specifically, a modified version of the two dimensional normalized
autocorrelation coefficient[31] γ between pixel (i, j) and pixel (i+ ∆m, j + ∆n) on an image
of size m× n can be defined as:
γ (∆m,∆n) =A(∆m,∆n)
A(0, 0)
where
A(∆m,∆n) =1
(m− ∆m)(n− ∆n)
×m−1−∆m
x=0
n−1−∆n
y=0
×|[f (x, y) − f ]
×[f (x + ∆m, y + ∆n) − f ]|,
where f is the mean value of f (x, y). This produces a two-dimension autocorrelation matrix
for the input of the ANN. The dimensions of the matrix are fixed by ∆n and ∆m for an
image of any size. In their study, Chen et al[8] set both of these to 5, which produces a 5 ×
5 autocorrelation matrix. This matrix constitutes the input of the ANN, which in this case
will have 25 input nodes. The ANN is a multilayer feed-forward neural network with one
or more hidden layers (i.e. an MLP) with one output node whose value is either 0 or 1 for
“malignant” or “benign”. This scheme is illustrated in Figure 3.
Using this scheme, a high ROC Az value of 0.9560±0.0183 was achieved, with the accuracy
15

7/28/2019 Datamining in Medical Applications
http://slidepdf.com/reader/full/datamining-in-medical-applications 16/33
varying with the threshold value used to distinguish the output of the ANN between 0 and
1. This CAD system’s performance was a significant improvement over that achieved by the
scheme developed by Garra et al[5] from which it was adapted (Az = 0.91)[8]. These results
indicated that it was quite possible to distinguish benign and malignant tumors by using
interpixel correlations on digital images as the input for an ANN.
Anultrasonogram
ROIsubimage
containingthe
tumorunder
investigation
2DAutocorrelation
Matrix
NeuralNetwork
TumorClassifier
Precomputedsynapticweights
OUTPUT(0OR1)
Figure 3: Diagram illustrating the Chen et al[8] CAD scheme.
16

7/28/2019 Datamining in Medical Applications
http://slidepdf.com/reader/full/datamining-in-medical-applications 17/33
Bovis et al[4] used a combination of subtraction techniques, feature extraction via texture
analysis and classification using ANNs in their CAD scheme. The subtraction procedure
involved identifying a common reference point for the basis of alignment before subtraction.
The spatial position of the nipple was located using a method developed by Mendez et al[27]
and the observed image translated such that the nipple locations on both breast images are
aligned. Using the aligned left and right breast image pairs, two images are generated by
bilaterally subtracting one image from the other. One is a positive image and shows features
that occur in the left breast image but not the right, while the other is a negative image that
shows features that occur in the right breast image but not the left. This is illustrated in
Figure 4. They then used a quad-tree region model similar to that used in fractal encoding
(described in Section 3.1.1 to remove false positives, then built five co-occurrence matrices
in four different spatial directions for all the remaining suspicious regions or ROIs[4]. From
this, a texture feature vector was extracted for each set of co-occurrence matrices constructed
at different pixel distances. The feature vectors giving the best TPF1 were then used for
subsequent classification by an ANN, and the ANN model giving the highest TPF was then
selected. Using this scheme, Bovis et al[4] achieved an overall performance of Az = 0.74,
which is not quite as high as that achieved by Chen et al[8].
1True Positive Fraction. See Appendix A
17

7/28/2019 Datamining in Medical Applications
http://slidepdf.com/reader/full/datamining-in-medical-applications 18/33
Figure 4: (a) left breast (b) aligned and rotated right breast image (c) negative difference image(d) positive difference image. Bovis et al[4]
18

7/28/2019 Datamining in Medical Applications
http://slidepdf.com/reader/full/datamining-in-medical-applications 19/33
Christoyianni et al[6] have used a combination of neural network-based classifiers to detect
ROI in mammograms. Their study focused on two types of ANNs - radial-basis-function
(RBF) networks and multi-layer perceptron (MLP) networks. Their aim was to compare the
performance of the two classifiers in terms of speed and accuracy. Their method is carried
out in two steps: in the first stage, the mammogram is subjected to feature extraction,
producing a spatial gray level dependency matrix , similar in scope to the two-dimensional
autocorrelation matrix used by Chen et al[8] and described in Section 3.3.1. This SGLD
matrix is then used as the input to the neural network classifier. It was found that similar
recognition scores were achieved for the types of features that the classifiers were trained
to recognize, with the MLP implementation giving 4% better recognition rates than the
RBF networks used. It took longer to train the MLP classifier, though. However, it was
found that the achieved recognition accuracy was far below that required in any practical
cancer detection system, hence the fact that neural networks at present can only be used
to assist radiologists rather than substitute for them. The main contribution of this study
was to show that MLP classifiers, though expensive in terms of the computational resources
required to train them, were preferable to RBF networks, which are designed to be faster to
train.
Ossen et al[28] demonstrated the use of neural network classifiers in the segmentation of
medical images, much in the same way that Bezier splines are used to do so as described
in Section 3.3.2. The neural network classifiers were successfully integrate in an existing
medical imaging system used to diagnose Grave’s opthalmopathy, a disease characterized by
the protrusion of the eye. The classifier is trained interactively by selecting representative
19
7/28/2019 Datamining in Medical Applications
http://slidepdf.com/reader/full/datamining-in-medical-applications 20/33
texture samples for each object class, with no preprocessing of input data necessary. After
the learning phase, the classifier is applied to a sequence of complete images or ROIs. Their
results show that neural network classifiers are able to significantly enhance low-level seg-
mentation, with the particular advantage being the “direct and neat” integration of medical
expertise through the interactive choice of training patterns for the classifier.
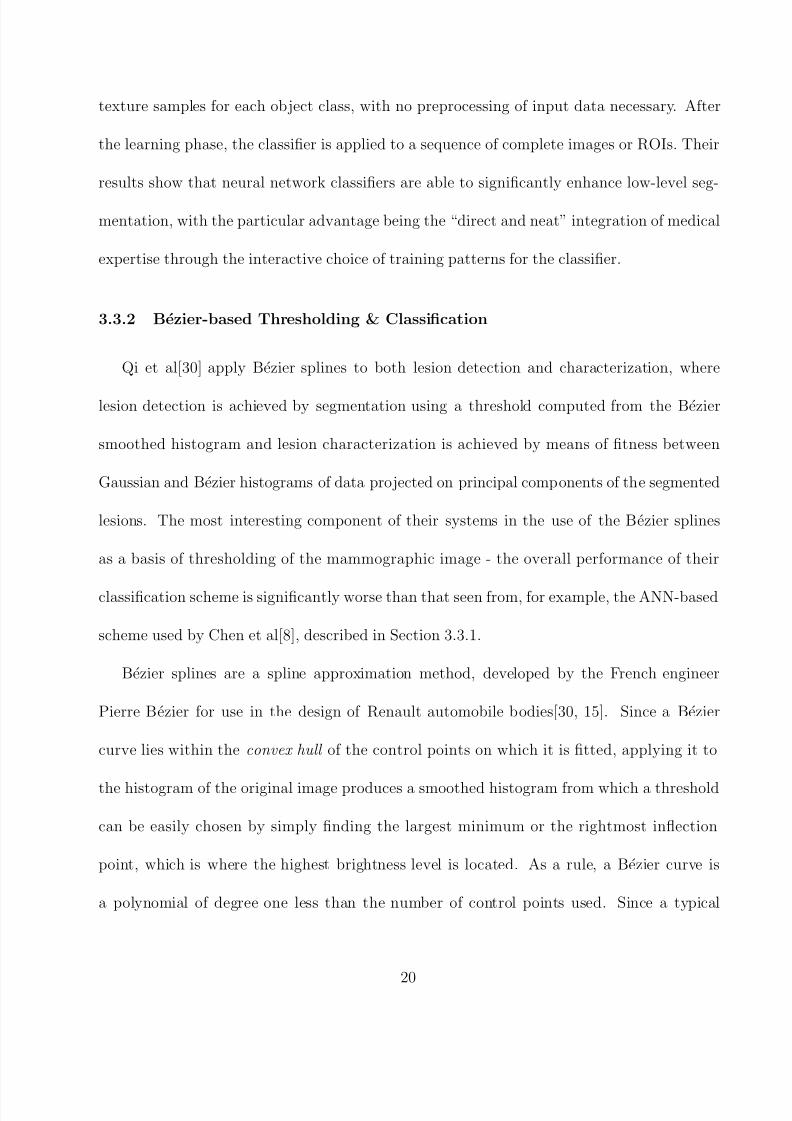
3.3.2 Bezier-based Thresholding & Classification
Qi et al[30] apply Bezier splines to both lesion detection and characterization, where
lesion detection is achieved by segmentation using a threshold computed from the Bezier
smoothed histogram and lesion characterization is achieved by means of fitness between
Gaussian and Bezier histograms of data projected on principal components of the segmented
lesions. The most interesting component of their systems in the use of the Bezier splines
as a basis of thresholding of the mammographic image - the overall performance of their
classification scheme is significantly worse than that seen from, for example, the ANN-based
scheme used by Chen et al[8], described in Section 3.3.1.
Bezier splines are a spline approximation method, developed by the French engineer
Pierre Bezier for use in the design of Renault automobile bodies[30, 15]. Since a Bezier
curve lies within the convex hull of the control points on which it is fitted, applying it to
the histogram of the original image produces a smoothed histogram from which a threshold
can be easily chosen by simply finding the largest minimum or the rightmost inflection
point, which is where the highest brightness level is located. As a rule, a Bezier curve is
a polynomial of degree one less than the number of control points used. Since a typical
20

7/28/2019 Datamining in Medical Applications
http://slidepdf.com/reader/full/datamining-in-medical-applications 21/33
grayscale image consists of 256 brightness levels, the histogram values of these levels can be
used as the control points for a Bezier curve polynomial of degree 255. If the histogram levels
are denoted by pk = (xk, yk), where both k and xk vary from 0 to 255, then these coordinate
points can be blended to produce a position vector P (u) which describes the path of an
approximating Bezier polynomial between p0 and p255:
P (u) =255
k=0
pkBEZ k,255(u)
where 0 ≤ u ≤ 1. The Bezier blending functions BEZ k,255(u) are the Bernstein polynomials:
BEZ k,255(u) = C (255, k)uk(1 − u)n−k
and the C (255, k) are the binomial coefficients:
C (255, k) =255!
k!(255 − k)!
After generating the Bezier histogram, a threshold is selected and the image is thresholded
to produce a segmented image with the lesion visible, as illustrated in Figure 5. The image is
then subjected to region-growing - a simple method that is used to neglect single-pixel bright
points and combine segments which are only one pixel apart. This produces a labeled image
by virtue of the fact that this stage is augmented by the recording of distribution information
for each segment in memory for later access when classifying calcifications. Finally, the
labeled image is subjected to principal component analysis[30] which classifies the lesion in
21

7/28/2019 Datamining in Medical Applications
http://slidepdf.com/reader/full/datamining-in-medical-applications 22/33
the mammogram based on its principal component. This method is based on the premise
that different types of lesions produce distinct principle components[30].
Though Bezier spline segment is fairly sophisticated, the overall performance of the CAD
scheme described here is inferior others that use ANNs, such as that developed by Chen et
al[8].
original
image
pure
histogram
Bezier
histogram
segmented
imagethresholding
Bezier-based
Thresholding&
Segmentation
Labelled
Image
principal
component
regiongrow
Bezierhistogramof
projected
data
Figure 5: (a) System overview of the Bezier spline-based thresholding and segmentation algo-
rithm(Qi et al[30])
22

7/28/2019 Datamining in Medical Applications
http://slidepdf.com/reader/full/datamining-in-medical-applications 23/33
3.3.3 Statistical Techniques
Anguh et al[2] propose a multiscale method for segmenting and enhancing lesions of
various sizes in mammograms. The first stage applies a multiscale automatic threshold esti-
mator based on histogram moments to segment the mammogram at multilevels. The second
stage then converts the segmented image using pseudo-color mapping to produce a color
image[2]. The final result is analogous to a breast map which provides an adequate basis for
radiological breast tissue differentiation and analysis in digital mammography. Their paper
provides a treatment on the mathematical theory of moments before present an algorithm for
the multiscale thresholding of the mammogram. The result of this thresholding technique
is a mammographic map or breast map based on various thresholds with varying object
sizes. This map can then be used by a radiologist; however, the CAD scheme proposed in
[2] uses pseudo-color mapping[10] to convert the grayscale to a color image. This is done
since human vision can only discern a limited number of grayscale levels. The end results
is a pseudo-color breast map in which the lesions have been highlighted in different colors
and confirmed by visual inspection by a trained radiologist. Anguh et al[2] claim that this
multiscale segmentation and enhancement method detects virtually all lesions identified by
an expert radiologist in the process of visual inspection in initial tests on 25 mammograms.
4 Discussion
Given the veritable panoply of different techniques used in different studies, it is difficult
to pinpoint any one technique as a silver bullet for the problem of computer-aided diagnosis
23

7/28/2019 Datamining in Medical Applications
http://slidepdf.com/reader/full/datamining-in-medical-applications 24/33
as applied to medical imaging in general and mammography in particular. However, it is
possible to suggest the design of a system that combines the best features encountered during
this study.
In the proposed system, the following components from other systems could be integrated
in the following manner:
1. the B-spline wavelet decomposition and enhancement algorithm described in Sec-
tion 3.2.1. This technique provides remarkable enhancement of mammographic images
in a way that highlights anomalies and makes the job of the rest of the CAD system
easier. This produces an enhanced mammographic image.
2. the fractal encoding and ROI generation technique described in Section 3.1.1. This
algorithm performs a remarkable data reduction that is bound to speed up any CAD
system with very high coverage of ROIs. Given the enhanced mammographic image,
this technique identifies almost all the ROIs in the image.
3. the autocorrelation matrix-based neural network classifier scheme described in Sec-
tion 3.3.1 and ascribed to Chen et al[8]. This technique seems to have the highest
reported value for Az in this study.
The proposed system is summarized in Figure 6. This system combines the best techniques
identified in the course of this study. It is important to note that not all techniques are
subject to the neat modularization that is desirable in any computing system as complex
as a CAD system. Nevertheless, a number of them are amenable to analytic decomposition
and reintegration into a new system that takes advantage of the best of each.
24

7/28/2019 Datamining in Medical Applications
http://slidepdf.com/reader/full/datamining-in-medical-applications 25/33
B-splinewaveletDecomposition
andEnhancement
NeuralNetworkClassifier 2D
AutocorrelationMatrix
Computation
FractalEncodingandROI
Generation
originalmammogram
autocorrelationmatrix
pre-computedsynapticweights
ROI(s)
enhancedimage
Output0or1
Figure 6: Overview of proposed CAD system
25

7/28/2019 Datamining in Medical Applications
http://slidepdf.com/reader/full/datamining-in-medical-applications 26/33
5 Conclusion
It is clear that CAD systems are a desirable technology, especially in light of the fact
that missed diagnoses due to human error often have severe consequences. The problem
of developing CAD systems that are both sensitive and specific is a non-trivial one, and
considerable effort has been expended in both the development of new techniques and the
adaptation of existing ones in other disciplines to this problem. Medical imaging in general
is very widely studied, and the variety of techniques in front-end data reduction, image
enhancement and classification described herein and in the references for this study are only
a scratch on the surface of a much bigger problem. Hopefully, the goal of CAD system design
will eventually be realized - that of providing the accuracy of an expert radiologist in an
indefatigable, highly-available computerized system.
As a basis for further study, a number of the references in this study warrant further,
sustained attention. For example, Shane Dickson[7] has applied neural networks to a medical
image analysis problem in her thesis - that of automatically detecting the acoustic neuromas
in MR images of the head. Dickson reports 100% sensitivity and 99% specificity on a dataset
of 50 cases that the prototype system was applied to.
These kinds of studies and others continue to provide the theoretical basis for increasingly
sophisticated medical imaging systems, with vast potential in radiology and mammography
in particular.
26

7/28/2019 Datamining in Medical Applications
http://slidepdf.com/reader/full/datamining-in-medical-applications 27/33

7/28/2019 Datamining in Medical Applications
http://slidepdf.com/reader/full/datamining-in-medical-applications 28/33
FPF =FP
FP + TN
An example ROC curve is shown in Figure 7. The Az value is the total area under the
ROC curve. The value of Az ranges from 0 to 1, with a higher Az indicating better overall
performance.
0.2 0.4 0.6 0.8 1.0 1.20
0.2
0.4
0.6
0.8
1.0
0
T P F
( S e n s i t i v i t y )
FPF(1-Specificity)
Figure 7: The Az value of this ROC curve is the area under the curve.
28

7/28/2019 Datamining in Medical Applications
http://slidepdf.com/reader/full/datamining-in-medical-applications 29/33
References
[1] Predrag Baki’c And. Application of neural networks in computer aided diagnosis of
breast cancer. http://citeseer.nj.nec.com/404677.html.
[2] M.M. Anguh and A.C. Silva. Multiscale segmentation and enhancement in mammo-
grams. http://www.visgraf.impa.br/sibgrapi97/anais/ART03/ART03.ps.gz.
[3] L. Baker. Breast cancer demonstration project: five year summary report. Cancer ,
pages 194–225, 1982.
[4] Keir Bovis and Sameer Singh. Detection of masses in mammograms using texture
features. http://www.dcs.ex.ac.uk/research/pann/master/cameo/paper80.ps.
[5] Garra B.S., Krasner B.H., Horii S.C., Archer S., Muk S.K., and Zerman R.K. Improving
the distinction between benign and malignant breast lesions: the value of sonographic
texture analysis. Ultrasound Imaging , 15:267–285, 1993.
[6] I. Christoyianni, E. Dermatas, and G. Kokkinakis. Neural classification of ab-
normal tissue in digital mammography using statistical features of the texture.
http://www.wcl2.ee.upatras.gr/christ/pub ioanna.htm.
[7] Shane Dickson. Investigation of the use of Neural Networks for Computerised Medical
Image Analysis . PhD thesis, Department of Computer Science, University of Bristol,
February 1998.
29

7/28/2019 Datamining in Medical Applications
http://slidepdf.com/reader/full/datamining-in-medical-applications 30/33
[8] Chen D.R., Chang R.F., and Huang Y.L. Computer-aided diagnosis applied to us of
solid breast nodules by using neural networks. Radiology , 213(2):407–412, November
1999. http://www.cs.ccu.edu.tw/ rfchang/radio9911.pdf.
[9] V. Goldberg and A. Manduca. Improvement in specificity of ultrasonography for diag-
nosis of breast tumors by means of artificial intelligence. Medical Physics 1992 , 19:1475–
1481, 1992.
[10] R.C. Gonzalez and R.C. Woods. Digital Image Processing . Addison Wesley., 1992.
[11] R. Gupta and P.E. Undrill. The use of texture analysis to identify suspicious masses in
mammography. http://www.biomed.abdn.ac.uk/Abstracts/A00337/.
[12] R. Hanka, T. Harte, A. Dixon, D. Lomas, and P. Britton. Neural networks in the inter-
pretation of contrast-enhanced magnetic resonance images of the breast. In Proceedings
Current Perspectives in Healthcare Computing Conference, Harrogate, UK , pages 275–
283, March 1996.
[13] Trevor Hastie, Debra Ikeda, and Robert Tibshirani. Computer-aided diagnosis of mam-
mographic masses. Technical report, Departments of Preventive Medicine & Biostatis-
tics, University of Toronto, June 1996. ftp://utstat.toronto.edu/pub/tibs/mammo.ps.Z.
[14] Trevor Hastie, Debra Ikeda, and Robert Tibshirani. Statistical measures for the
computer-aided diagnosis of mammographic masses. Journal of Computational and
Graphical Statistics , 8(3), September 1999.
[15] D. Hearn and M.P. Baker. Computer Graphics . Prentice Hall, Inc., 2nd edition, 1994.
30

7/28/2019 Datamining in Medical Applications
http://slidepdf.com/reader/full/datamining-in-medical-applications 31/33
[16] Y. Hirose, K. Yamashita, and S. Hijiva. Backpropagation algorithm which varies the
number of hidden units. Neural Networks , 4:61–66, 1991.
[17] International Commission on Radiological Units and Measurements. Medical Imaging -
The Assessment of Image Quality , 1996.
[18] Andrew Laine Iztok Koren and Fred Taylor. Enhancement via fusion of mammographic
features. http://citeseer.nj.nec.com/288745.htm.
[19] Barry Kalman, Stan C. Kwasny, and William R. Reinus. Diagnostic screening
of digital mammograms using wavelets and neural networks to extract structure.
http://citeseer.nj.nec.com/31683.html.
[20] I. Koren, A. Laine, and F. Taylor. Image fusion using steerable dyadic wavelet transform.
Proceedings of the IEEE International Conference on Image Processing , 3:232–235, 1995.
[21] A. Laine, J. Fan, and W. Yang. Wavelets for contrast enhancement of digital mam-
mography. IEEE Engineering in Medicine and Biology Magazine , 14(5):536–550, 1995.
http://citeseer.nj.nec.com/349213.html.
[22] A. Laine, S. Schuler, J. Fan, and W. Huda. Mammographic feature enhancement
by multiscale analysis. IEEE Transactions in Medical Imaging , MI-13:725–740, 1994.
http://citeseer.nj.nec.com/laine94mammographic.html.
[23] H. Li, K. Liu, and S. Lo. Fractal modeling and segmentation for the enhancement of
microcalcifications in digital mammograms. IEEE Trans. Med. Imaging , 16:785–798,
1997. http://citeseer.nj.nec.com/li97fractal.html.
31

7/28/2019 Datamining in Medical Applications
http://slidepdf.com/reader/full/datamining-in-medical-applications 32/33
[24] S. Liu and E. Delp. Multiresolution detection of stellate lesions in mammograms. In
Proceedings of the IEEE International Conference on Image Processing , pages 109–112,
October 1997. http://citeseer.nj.nec.com/article/liu97multiresolution.html.
[25] Sheng Liu. Multiresolution detection of spiculated lesions in digital mammograms.
http://citeseer.nj.nec.com/179226.html.
[26] Laura N. Mascio, Jose M. Hernandez, and Clinton M. Logan. Automated anal-
ysis for microcalcifications in high resolution digital mammograms. http://www-
eng.llnl.gov/documents/imaging/jmhspie93.html.
[27] A. Mendez, P. Tahoces, M. Lado, M. Souto, and J. Vidal. Computer aided diagnosis:
Automatic detection of malignant masses in digitized mammograms. Medical Physics ,
25(6):957–964, 1998.
[28] A. Ossen, T. Zamzow, H. Oswald, and E. Fleck. Segmentation of medical images using
neural-network classifiers. In Proceedings of the International Conference on Neural
Networks and Expert Systems in Medicine and Healthcare (NNESMED’94), pages 427–
432, 1994. http://citeseer.nj.nec.com/ossen94segmentation.html.
[29] Riccardo Poli and Guido Valli. Optimum segmentation of medical images with hopfield
neural networks. Technical Report CSRP-95-12, University of Birmingham School of
Computer Science, October 1995. http://citeseer.nj.nec.com/156628.html.
[30] Qi and Snyder. Lesion detection and characterization in digital mammography by bezier
histograms. http://citeseer.nj.nec.com/348097.html.
32

7/28/2019 Datamining in Medical Applications
http://slidepdf.com/reader/full/datamining-in-medical-applications 33/33
[31] Gonzalez R.C. and Woods R.E. Image Compression , pages 312–315. Reading, Mass.:
Wesley, 1991.
[32] Guido Valli Riccardo. Neural networks and prior knowledge help the segmentation of
medical images. http://citeseer.nj.nec.com/336457.html.
[33] D. E. Rumelhart, G. E. Hinton, and R. J. Williams. Learning representations by back-
propagating errors. Nature , 323:533–536, 1986.
[34] H. Sari-Sarraf, S. S. Gleason, and R. M. Nishikawa. Front-end data reduction in
computer-aided diagnosis of mammograms: A pilot study. In SPIE’s Medical Imag-
ing Conference , February 1999. http://www-ismv.ic.ornl.gov/publications/spie99.pdf.
[35] Sameer Singh and Reem Al-Mansoori. Identification of regions of interest
in digital mammograms. Journal of Intelligent Systems , 10(2):183–217, 2000.
http://www.dcs.ex.ac.uk/research/pann/pdf/pann SS 005.pdf.
[36] P. Undrill and R. Gupta. Texture analysis and boundary refinement to outline mam-
mography masses. IEEE Colloquium (Digest), 072:5/1–5/6, 1996.
[37] Kevin S. Woods. Automated image analysis techniques for digital mammography.
http://citeseer.nj.nec.com/woods94automated.html.
33