Embed Size (px)
Citation preview
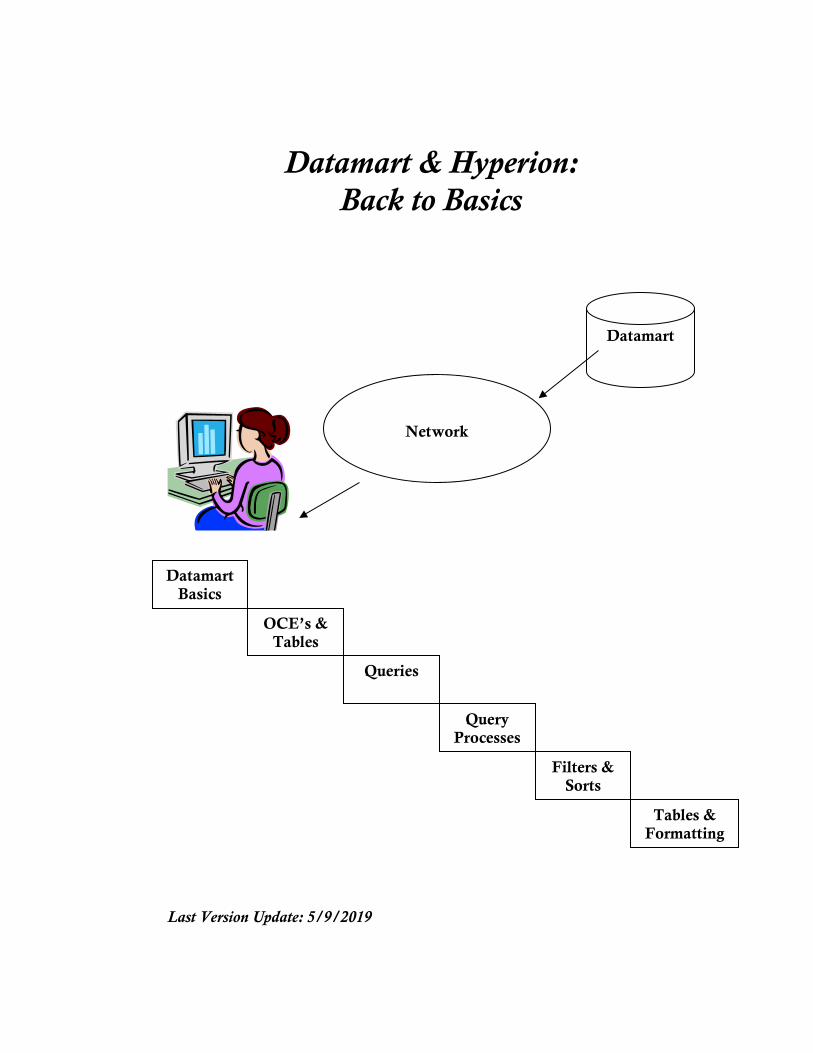
Datamart & Hyperion: Back to Basics
Last Version Update: 5/9/2019
Network
Datamart
Datamart Basics
OCE’s & Tables
Queries
Query Processes
Filters & Sorts
Tables & Formatting
About the Department of Administrative Services (DAS) – Datamart Team: The Department of Administrative Services (DAS) Datamart team provides courses with a focus on helping our customers improve their financial and technological skills. The training materials are for the students’ use both during the course and as a reference guide after the course is complete. For more information and a list of other available products, please visit us at our website at http://www.oregon.gov/DAS/ .
Copyright & Trademarks Copyright © 2011 by DAS Datamart administration. All rights reserved. Trademarked names appear throughout this book. Rather than list the names and entities that own the trademarks or insert a trademark symbol with each mention of the trademark name, DAS Datamart team states that it is using the names for editorial purposes and to the benefit of the trademark owner with no intention of infringing upon the trademark.
Disclaimer The DAS Datamart administration has taken every effort to ensure the accuracy of this manual. If you should discover any discrepancies, please notify us immediately.
Department of Administrative Services
155 Cottage St., NE, Salem, OR 97301
Datamart: (503) 373-0269 – Fax: (503) 378-3514
E-mail: [email protected]
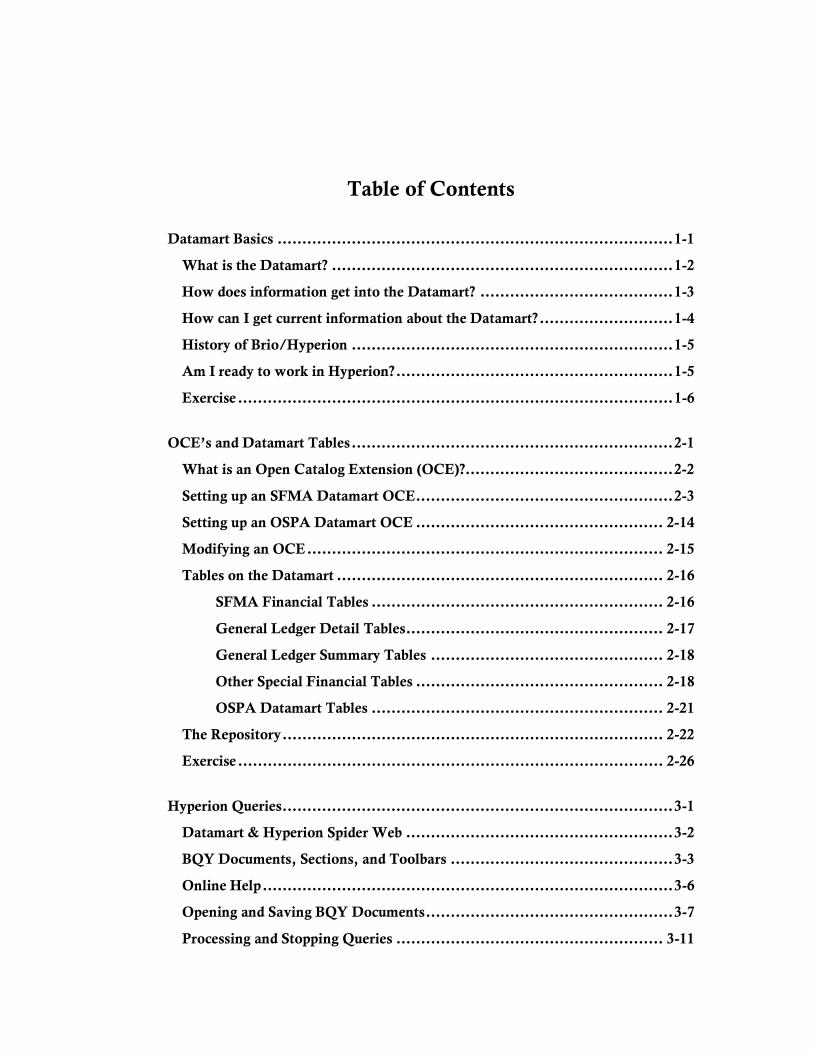
Table of Contents
Datamart Basics ................................................................................ 1-1
What is the Datamart? ..................................................................... 1-2
How does information get into the Datamart? ....................................... 1-3
How can I get current information about the Datamart? ........................... 1-4
History of Brio/Hyperion ................................................................. 1-5
Am I ready to work in Hyperion? ........................................................ 1-5
Exercise ........................................................................................ 1-6
OCE’s and Datamart Tables ................................................................. 2-1
What is an Open Catalog Extension (OCE)?.......................................... 2-2
Setting up an SFMA Datamart OCE .................................................... 2-3
Setting up an OSPA Datamart OCE .................................................. 2-14
Modifying an OCE ........................................................................ 2-15
Tables on the Datamart .................................................................. 2-16
SFMA Financial Tables ........................................................... 2-16
General Ledger Detail Tables .................................................... 2-17
General Ledger Summary Tables ............................................... 2-18
Other Special Financial Tables .................................................. 2-18
OSPA Datamart Tables ........................................................... 2-21
The Repository ............................................................................. 2-22
Exercise ...................................................................................... 2-26
Hyperion Queries ............................................................................... 3-1
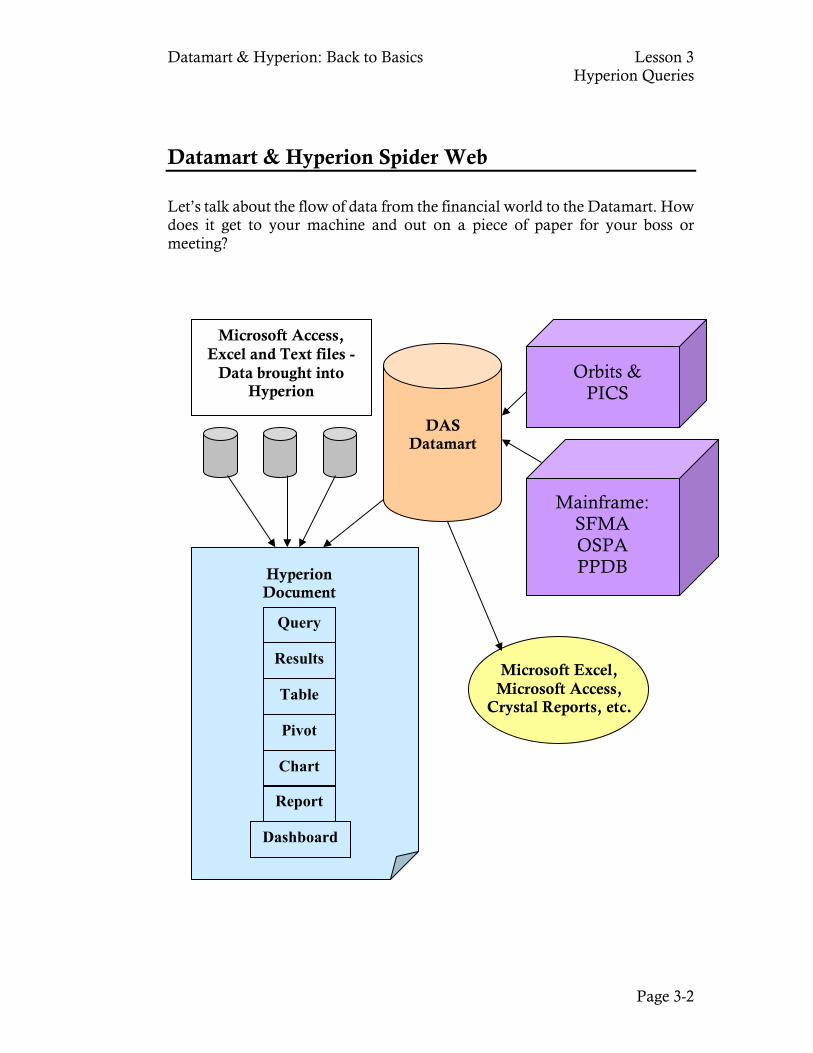
Datamart & Hyperion Spider Web ...................................................... 3-2
BQY Documents, Sections, and Toolbars ............................................. 3-3
Online Help ................................................................................... 3-6
Opening and Saving BQY Documents .................................................. 3-7
Processing and Stopping Queries ...................................................... 3-11
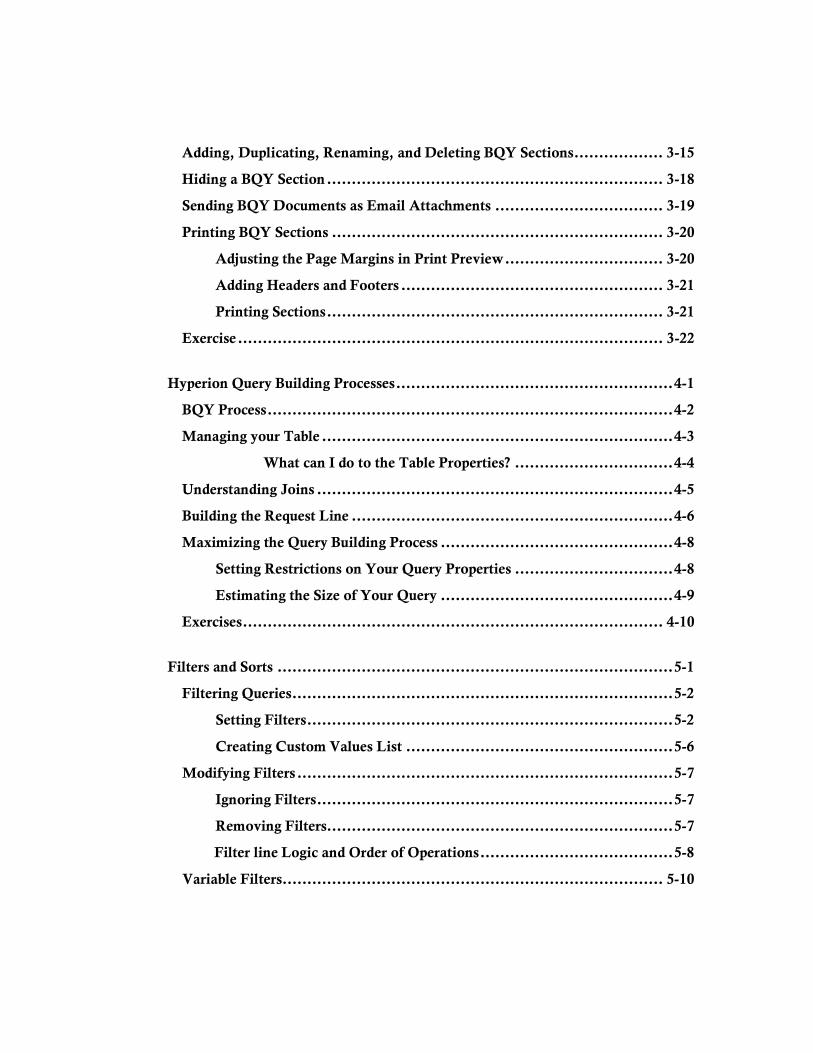
Adding, Duplicating, Renaming, and Deleting BQY Sections .................. 3-15
Hiding a BQY Section .................................................................... 3-18
Sending BQY Documents as Email Attachments .................................. 3-19
Printing BQY Sections ................................................................... 3-20
Adjusting the Page Margins in Print Preview ................................ 3-20
Adding Headers and Footers ..................................................... 3-21
Printing Sections .................................................................... 3-21
Exercise ...................................................................................... 3-22
Hyperion Query Building Processes ........................................................ 4-1
BQY Process .................................................................................. 4-2
Managing your Table ....................................................................... 4-3
What can I do to the Table Properties? ................................ 4-4
Understanding Joins ........................................................................ 4-5
Building the Request Line ................................................................. 4-6
Maximizing the Query Building Process ............................................... 4-8
Setting Restrictions on Your Query Properties ................................ 4-8
Estimating the Size of Your Query ............................................... 4-9
Exercises ..................................................................................... 4-10
Filters and Sorts ................................................................................ 5-1
Filtering Queries ............................................................................. 5-2
Setting Filters .......................................................................... 5-2
Creating Custom Values List ...................................................... 5-6
Modifying Filters ............................................................................ 5-7
Ignoring Filters ........................................................................ 5-7
Removing Filters...................................................................... 5-7
Filter line Logic and Order of Operations ....................................... 5-8
Variable Filters ............................................................................. 5-10
Customizing Variable Filters Dialog Box ..................................... 5-11
Sorting Data ................................................................................ 5-12
Data Functions on the Requested Items .............................................. 5-13
Exercises ..................................................................................... 5-16
Tables and Formatting ........................................................................ 6-1
What’s the difference between Results and Table Sections? ....................... 6-2
Formatting Data in Results and Table Sections ...................................... 6-4
Sorting Data in a Table Section .......................................................... 6-7
Suppressing Duplicate Values ............................................................ 6-8
Setting and Removing Local Filters in Results and Table Sections .............. 6-9
Creating Date Groups .................................................................... 6-11
Creating Grouping Columns............................................................ 6-12
Removing and Hiding Data ............................................................. 6-14
Creating Grand Totals and Break Totals ............................................ 6-15
Exercise ...................................................................................... 6-20
Lesson 1
Datamart Basics
What is a Datamart? How does information get into the Datamart? How can I get current information about the Datamart? History of Brio/Hyperion Am I ready to work in Hyperion?
Datamart & Hyperion: Back to Basics Lesson 1 Datamart Basics
Page 1-2
What is a Datamart?
The Department of Administrative Services (DAS) financial Datamart is your one-stop warehouse for financial transactions, account balances, grant profiles, PCA information, Payroll data and more, which helps
employees develop reports for business information and decision making. Many years ago, the Department of Administrative Services (DAS) State Controller’s Division (SCD) sponsored the creation of a Datamart. This initiative brought data from the primary transactional accounting system (SFMA) and the payroll system (OSPA) into a relational database for various agencies and users to easily query against for information using a reporting tool. Recently, Position Information Control System (PICS), PPDB and ORBITS (Budget) data have been added to this Datamart, and many other transactional applications have been created that capture relevant information that users can use to make better business decisions.
The Datamart provides a resource for easy reporting. In 1997, the SCD developed a Datamart of accounting data from SFMA to meet the ad-hoc reporting needs of state agencies. This became known as the SCD Datamart and later known as the SFMA Datamart. In 1999, the SCD developed a Datamart of payroll data from OSPA, which became known as the OSPA Datamart. The number of active Datamart users has expanded over the past several years, from 145 users in 1999 to an average of 360 users per month in 2007 to over 900 users in 2015. Many agencies are using these data sources on a regular basis to meet individual agency reporting needs. Some agencies use the Datamart to replace system-generated mainframe reports. This provides agencies with more meaningful, custom designed reports and saves time since data does not need to be re-keyed from hard-copy reports for various analyses.
The Datamart gives the user the ability to create custom reports.
Datamart & Hyperion: Back to Basics Lesson 1 Datamart Basics
Page 1-3
How does information get into the Datamart? The DAS Datamart contains data from the following statewide systems: SFMA (Statewide Financial Management Application) SFMA data is updated weekly with an extract from SFMA on Friday evening and an upload on Saturday evening. Mid-July through August (considered Month 13) the YE GL Detail, YE GL Summary, and Profile tables are updated three times per week from SFMA. In addition, the YE Active Accounting Event table is updated the last three Thursdays during the Month 13 time period.
OSPA (Oregon Statewide Payroll Application) The Payroll or OSPA data is updated monthly after the Final Run 2, approximately the 10th of each month. The data is available the morning after the leave accrual process has completed.
ORBITS (Oregon Relational Budget Information Tracking System) The Orbits or budget data is loaded weekly along with the normal SFMA load process.
PPDB (Position & Personnel Database) The PPDB data within the Datamart is through Feb 2019. The new data is obtained from the Workday application.
PICS (Position Information Control System) The PICS information is loaded weekly along with the normal SFMA extract process. **The above dates are subject to change. See the Datamart Processing Calendar on the Datamart website for specific dates throughout the year.
Datamart & Hyperion: Back to Basics Lesson 1 Datamart Basics
Page 1-4
How can I get current information about the Datamart? If you have any questions, suggestions, problems, or just plain comments please contact the Datamart Business Analyst listed below.
Datamart Business Analyst 155 Cottage Street NE, U50
Salem, OR 97301-3969 Phone: (503) 373-0269
Fax: (503) 378-3514 E-mail: [email protected]
Datamart Website The main Datamart site is dedicated to providing valuable information on everything about the Datamart, as well as, the Hyperion application. Please visit: http://www.oregon.gov/DAS/Financial/AcctgSys/Pages/Datamart.aspx Datamart Maintenance Website The maintenance site is dedicated to helping users with their Datamart password, as well as, has the capability to stop queries ran against the DAS Datamart. Please visit: https://datamartapp.dasapp.state.or.us/ Datamart News List To join the Datamart News List, please visit the main Datamart website, shown above, and review the Datamart-News section. There is an additional link on the website that goes to the E-Communications site. Follow the necessary instructions and soon you will be receiving important communication from the Datamart team, as well as, other Datamart users. Datamart User Group Survey meetings The Datamart team hosts various meetings where users gather to discuss the goals, needs and direction of the Datamart. Meeting dates and times are announced through the Datamart News List.
Datamart & Hyperion: Back to Basics Lesson 1 Datamart Basics
Page 1-5
History of Brio/Hyperion? Since the DAS Datamart creation in 1997, the State of Oregon has come to rely on the Brio/Hyperion query tool as its primary means of retrieving accounting, payroll and other financial information. The original application, which was called ‘Brio’ was created by the Brio Software, Inc. and was used extensively throughout the state to access the Datamart. However, in 2003, Brio was acquired by Hyperion Solutions Corporation. Hyperion continued to update the software until March 2007, when Hyperion was acquired by The Oracle Corporation. Throughout the transition years, the State of Oregon continued to use the product extensively. In May 2010, the State of Oregon purchased a license for ‘Oracle Enterprise Performance Management System 11’ also known as Hyperion Interactive Reporting Studio (aka IR Studio).
Am I ready to work in Hyperion? If you can answer “YES” to all the questions below, you are ready to work in Hyperion. 1. Are you a state employee?
2. Do you have a RACF ID?
3. Do you have an IBM DB2 Open Database Connection (ODBC)?
4. Do you have security access to the Datamart?
5. Is Hyperion installed on your PC?
6. Have you set up an Open Catalog Extension (OCE) for
Hyperion?
7. Have you completed Datamart training?
Datamart & Hyperion: Back to Basics Lesson 1 Datamart Basics
Page 1-6
Exercise
1. What is the primary function of the Department of Administrative Services (DAS) Financial Datamart?
2. How often is the SFMA, OSPA, and PICS data updated with new information on the Datamart?
3. Name 3 resources for Datamart information:
4. What are 4 things I need before I can access the Datamart?
5. What is the name of the latest Brio/Hyperion version?
Lesson 2
OCE’s and Datamart Tables
What is an Open Catalog Extension (OCE)? Setting up an SFMA Datamart OCE Setting up an OSPA Datamart OCE Modifying an OCE Tables on the Datamart
o SFMA Financial Tables o General Ledger Detail Tables o General Ledger Summary Tables o Other Special Financial Tables o OSPA Datamart Tables
The Repository
Datamart & Hyperion: Back to Basics Lesson 2 OCE’s and Datamart Tables
Page 2-2
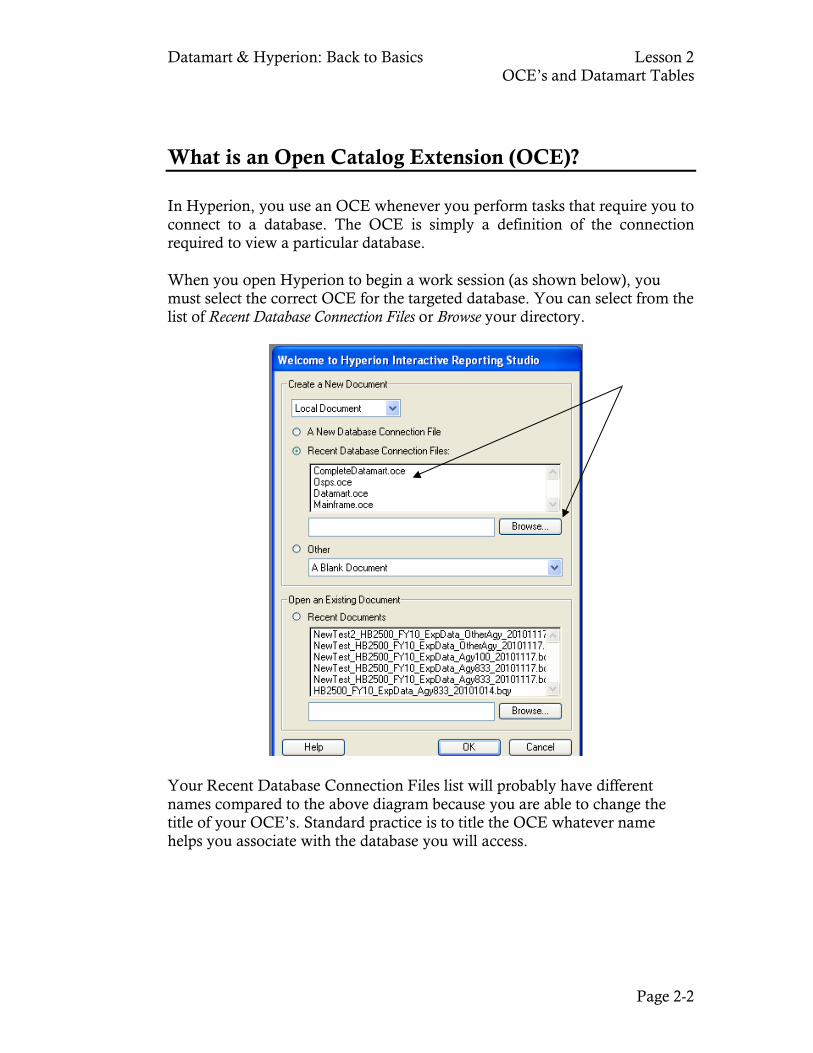
What is an Open Catalog Extension (OCE)? In Hyperion, you use an OCE whenever you perform tasks that require you to connect to a database. The OCE is simply a definition of the connection required to view a particular database.
When you open Hyperion to begin a work session (as shown below), you must select the correct OCE for the targeted database. You can select from the list of Recent Database Connection Files or Browse your directory.
Your Recent Database Connection Files list will probably have different names compared to the above diagram because you are able to change the title of your OCE’s. Standard practice is to title the OCE whatever name helps you associate with the database you will access.
Datamart & Hyperion: Back to Basics Lesson 2 OCE’s and Datamart Tables
Page 2-3
Setting up a SFMA Datamart OCE
Creating an Open Catalog Extension (OCE) in Hyperion Interactive Reporting Studio - Version 11
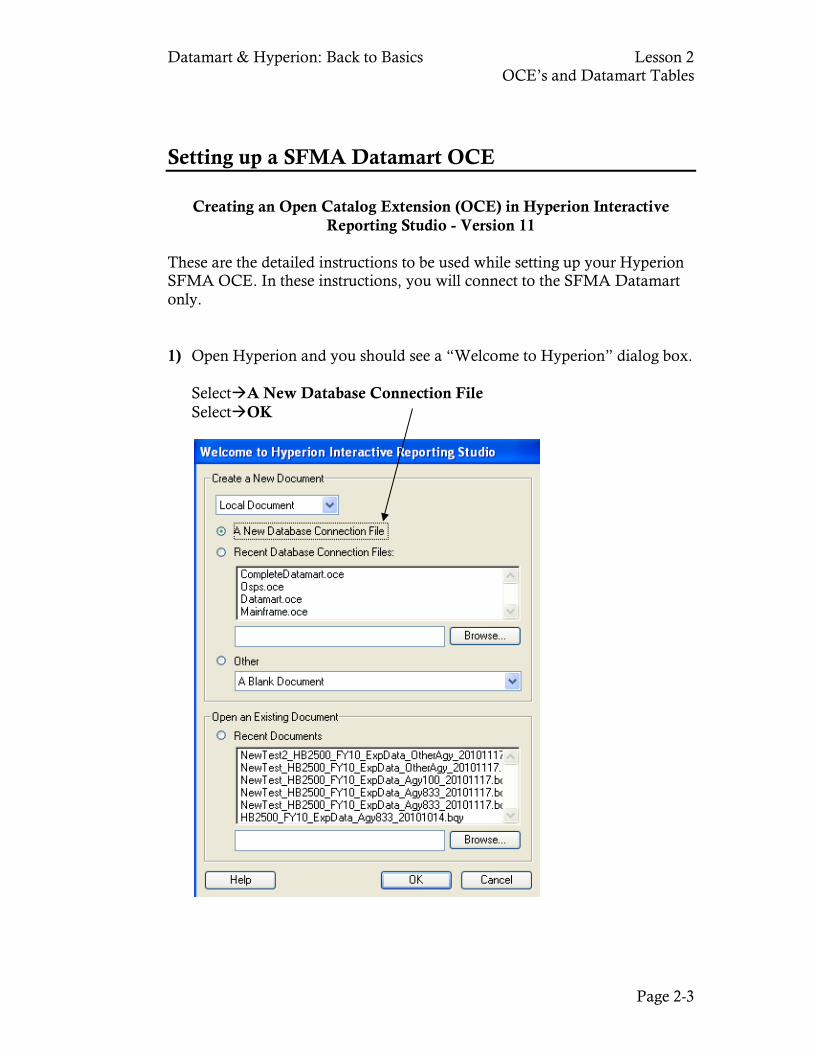
These are the detailed instructions to be used while setting up your Hyperion SFMA OCE. In these instructions, you will connect to the SFMA Datamart only. 1) Open Hyperion and you should see a “Welcome to Hyperion” dialog box.
SelectA New Database Connection File SelectOK
Datamart & Hyperion: Back to Basics Lesson 2 OCE’s and Datamart Tables
Page 2-4
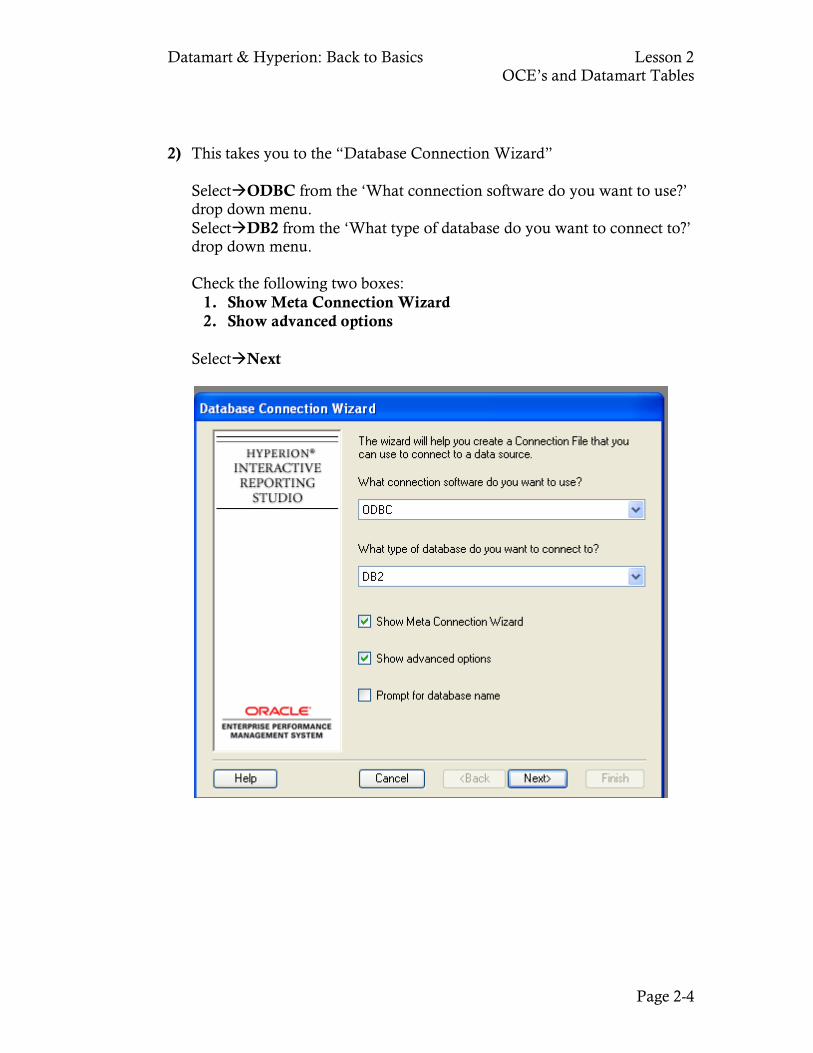
2) This takes you to the “Database Connection Wizard”
SelectODBC from the ‘What connection software do you want to use?’ drop down menu.
SelectDB2 from the ‘What type of database do you want to connect to?’ drop down menu.
Check the following two boxes:
1. Show Meta Connection Wizard 2. Show advanced options
SelectNext
Datamart & Hyperion: Back to Basics Lesson 2 OCE’s and Datamart Tables
Page 2-5
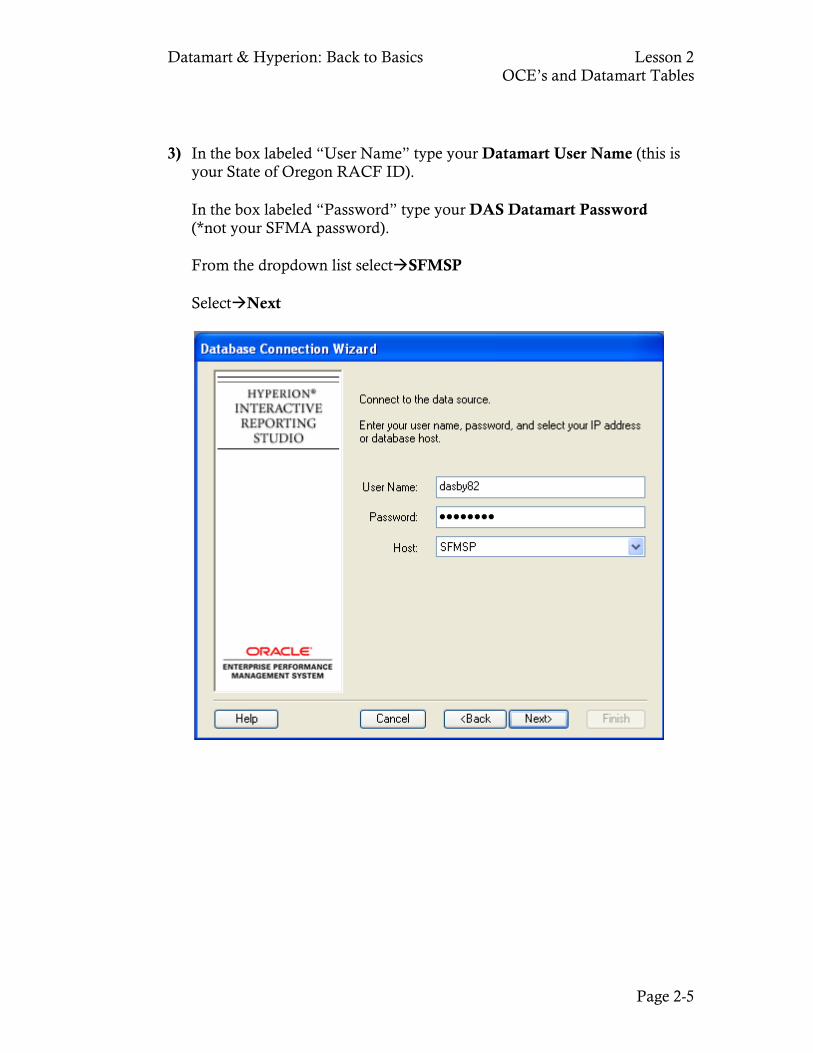
3) In the box labeled “User Name” type your Datamart User Name (this is your State of Oregon RACF ID). In the box labeled “Password” type your DAS Datamart Password (*not your SFMA password). From the dropdown list selectSFMSP SelectNext
Datamart & Hyperion: Back to Basics Lesson 2 OCE’s and Datamart Tables
Page 2-6
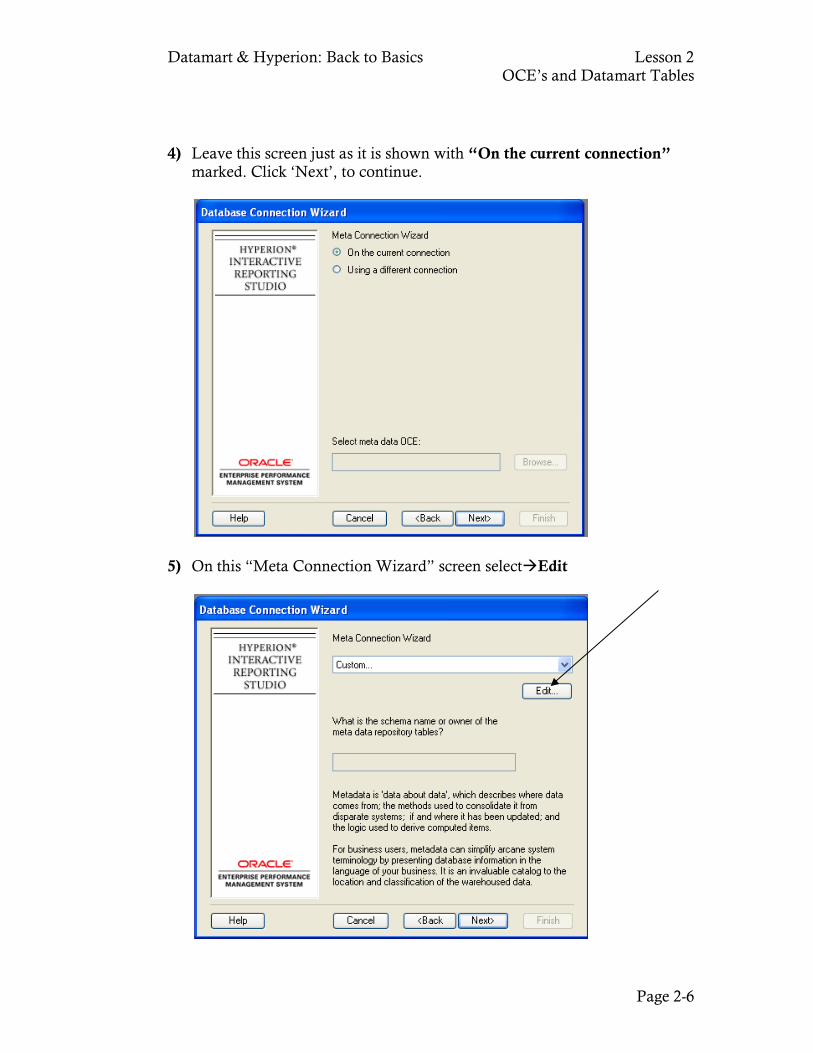
4) Leave this screen just as it is shown with “On the current connection” marked. Click ‘Next’, to continue.
5) On this “Meta Connection Wizard” screen selectEdit
Datamart & Hyperion: Back to Basics Lesson 2 OCE’s and Datamart Tables
Page 2-7
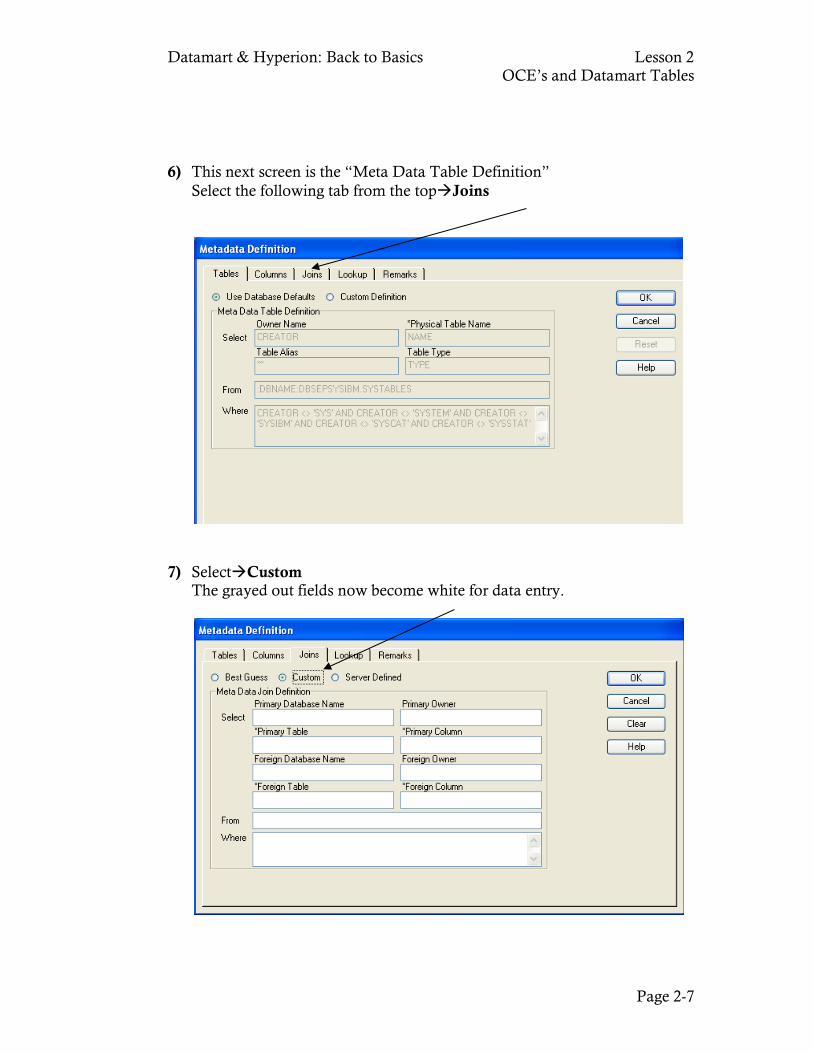
6) This next screen is the “Meta Data Table Definition” Select the following tab from the topJoins
7) SelectCustom The grayed out fields now become white for data entry.
Datamart & Hyperion: Back to Basics Lesson 2 OCE’s and Datamart Tables
Page 2-8
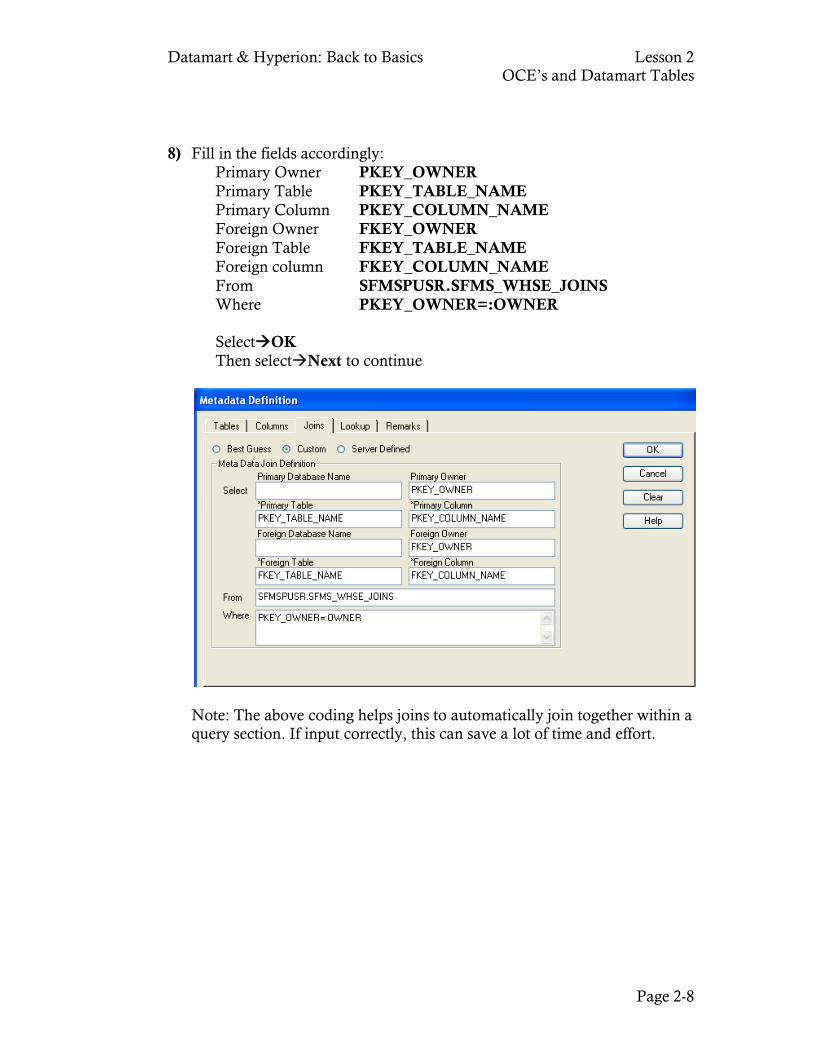
8) Fill in the fields accordingly: Primary Owner PKEY_OWNER Primary Table PKEY_TABLE_NAME Primary Column PKEY_COLUMN_NAME Foreign Owner FKEY_OWNER Foreign Table FKEY_TABLE_NAME Foreign column FKEY_COLUMN_NAME From SFMSPUSR.SFMS_WHSE_JOINS Where PKEY_OWNER=:OWNER
SelectOK Then selectNext to continue
Note: The above coding helps joins to automatically join together within a query section. If input correctly, this can save a lot of time and effort.
Datamart & Hyperion: Back to Basics Lesson 2 OCE’s and Datamart Tables
Page 2-9
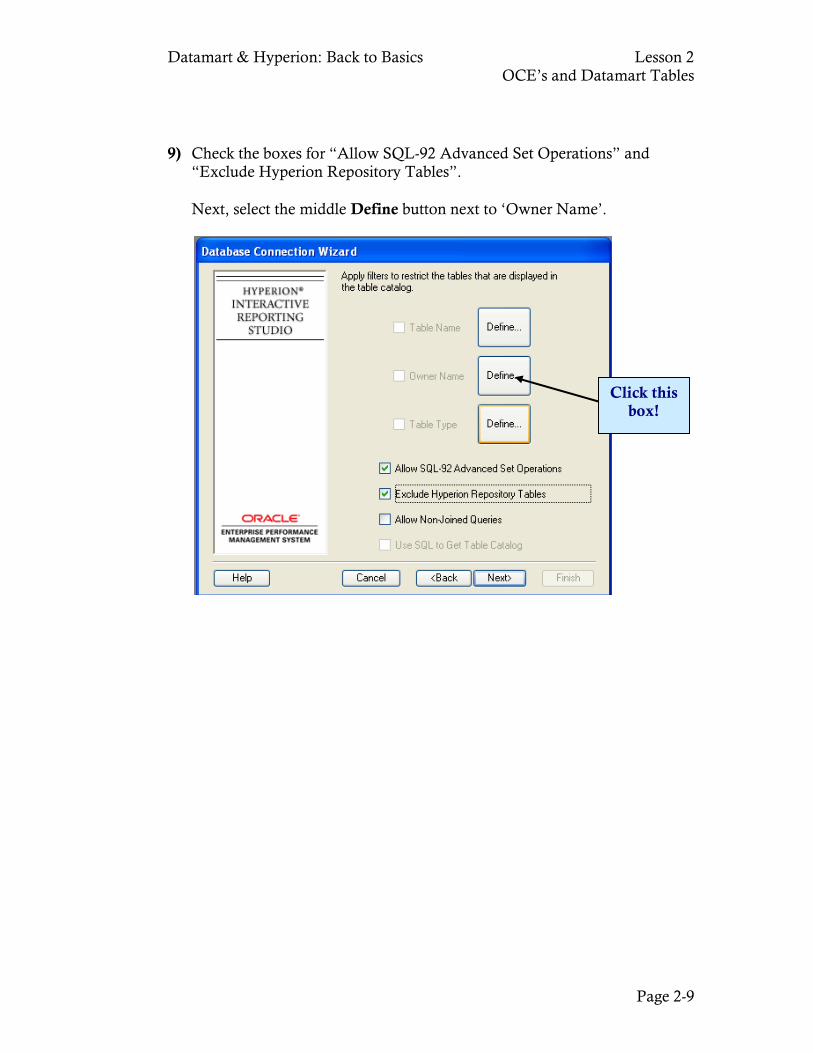
9) Check the boxes for “Allow SQL-92 Advanced Set Operations” and “Exclude Hyperion Repository Tables”.
Next, select the middle Define button next to ‘Owner Name’.
Click this box!
Datamart & Hyperion: Back to Basics Lesson 2 OCE’s and Datamart Tables
Page 2-10
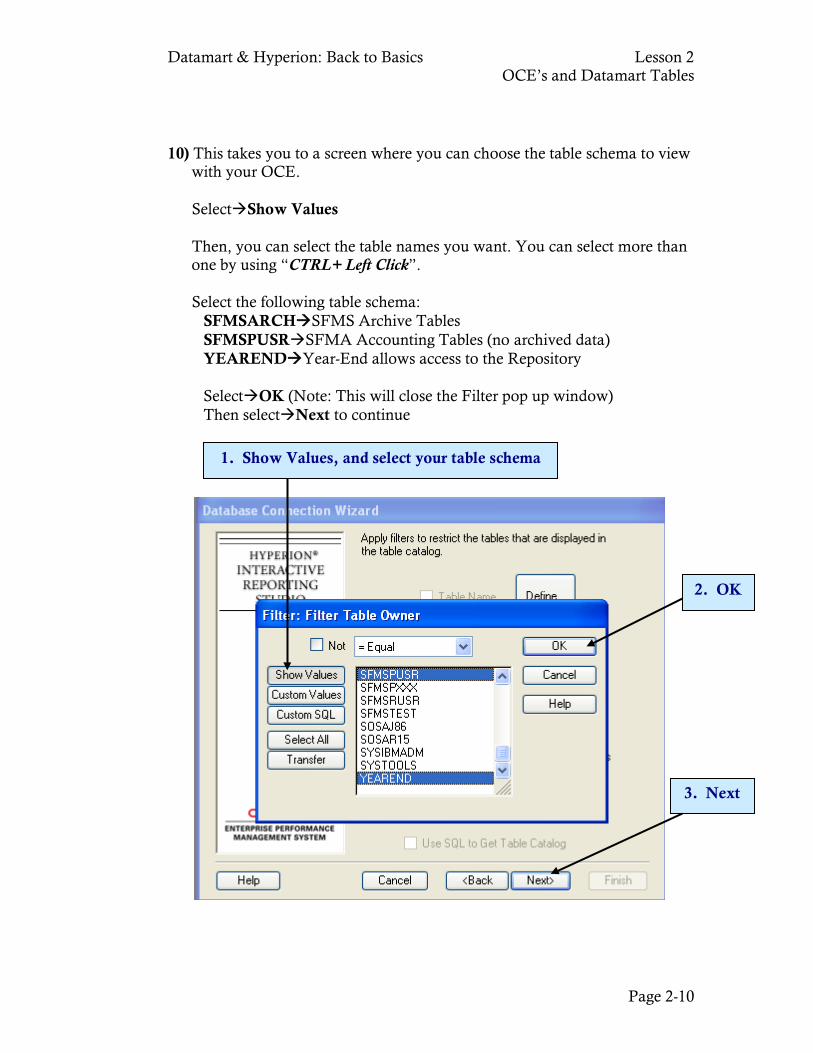
10) This takes you to a screen where you can choose the table schema to view with your OCE.
SelectShow Values Then, you can select the table names you want. You can select more than
one by using “CTRL+ Left Click”. Select the following table schema:
SFMSARCHSFMS Archive Tables SFMSPUSRSFMA Accounting Tables (no archived data) YEARENDYear-End allows access to the Repository
SelectOK (Note: This will close the Filter pop up window) Then selectNext to continue
1. Show Values, and select your table schema
2. OK
3. Next
Datamart & Hyperion: Back to Basics Lesson 2 OCE’s and Datamart Tables
Page 2-11
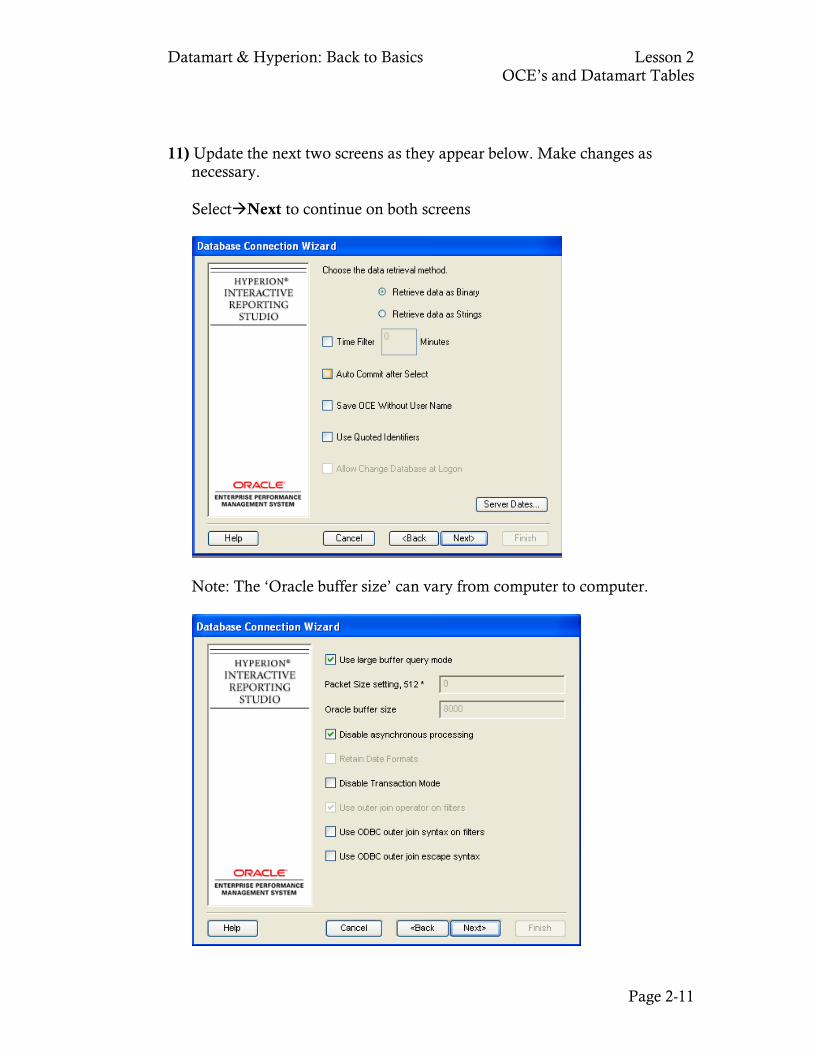
11) Update the next two screens as they appear below. Make changes as necessary.
SelectNext to continue on both screens
Note: The ‘Oracle buffer size’ can vary from computer to computer.
Datamart & Hyperion: Back to Basics Lesson 2 OCE’s and Datamart Tables
Page 2-12
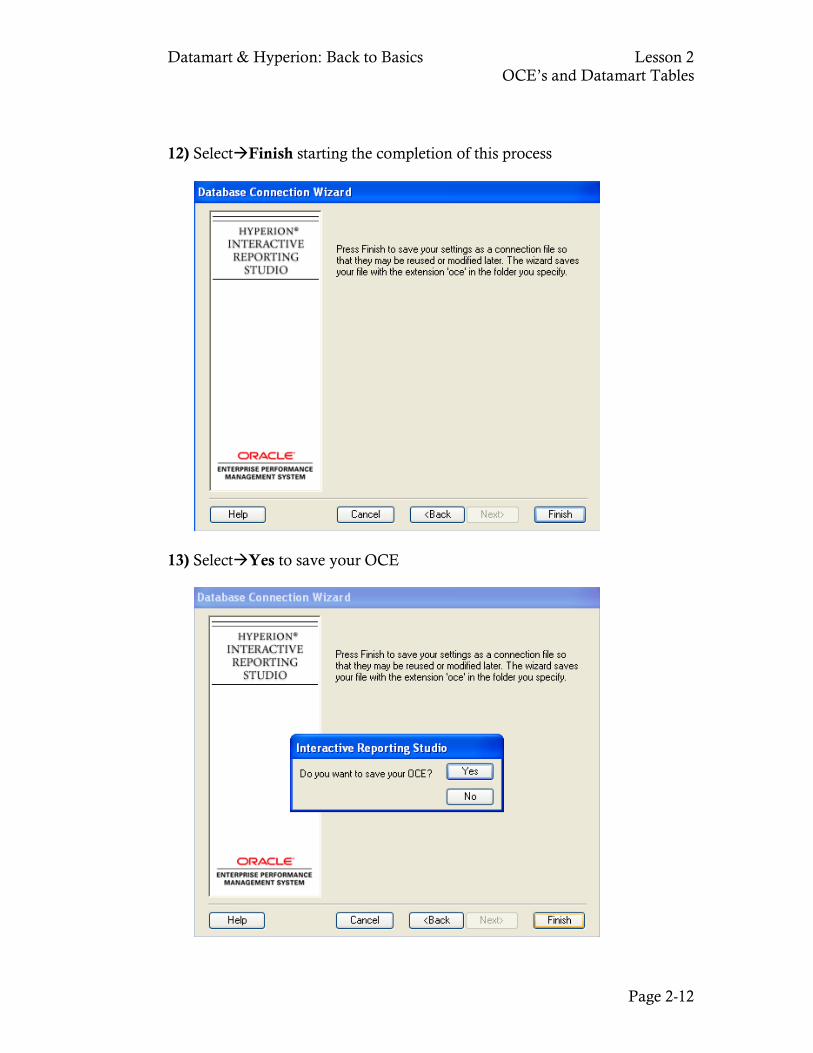
12) SelectFinish starting the completion of this process
13) SelectYes to save your OCE
Datamart & Hyperion: Back to Basics Lesson 2 OCE’s and Datamart Tables
Page 2-13
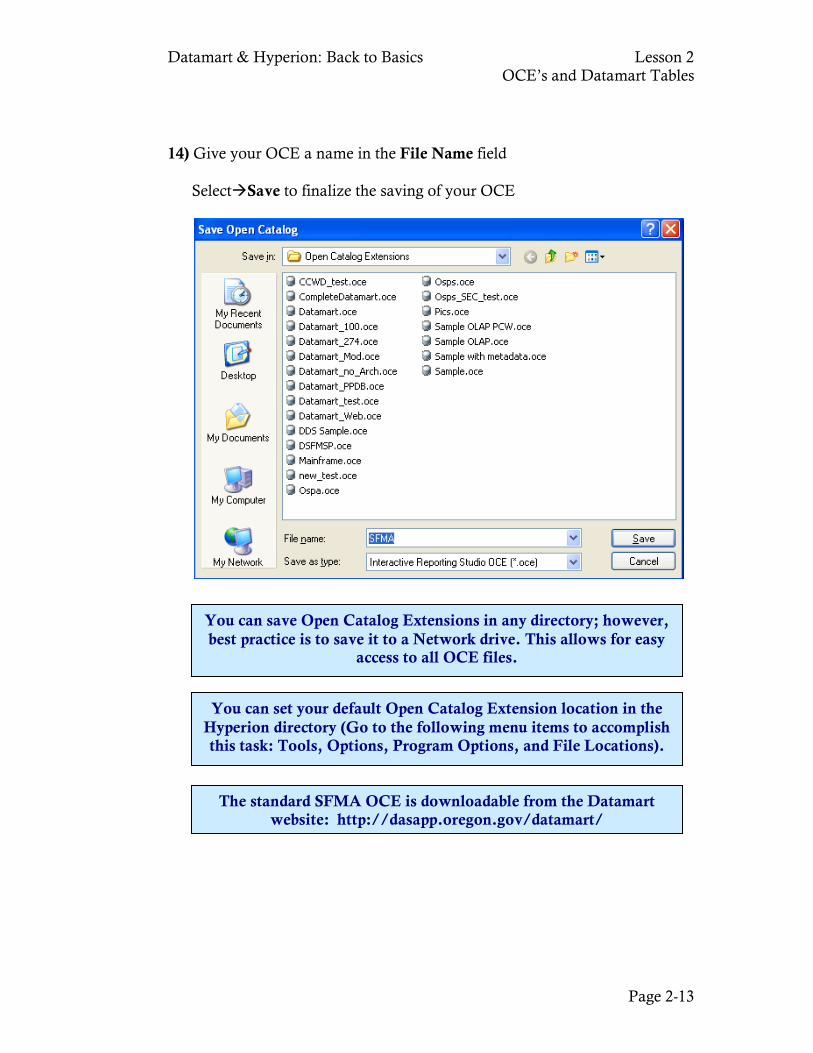
14) Give your OCE a name in the File Name field
SelectSave to finalize the saving of your OCE
You can save Open Catalog Extensions in any directory; however, best practice is to save it to a Network drive. This allows for easy
access to all OCE files.
The standard SFMA OCE is downloadable from the Datamart website: http://dasapp.oregon.gov/datamart/
You can set your default Open Catalog Extension location in the Hyperion directory (Go to the following menu items to accomplish this task: Tools, Options, Program Options, and File Locations).
Datamart & Hyperion: Back to Basics Lesson 2 OCE’s and Datamart Tables
Page 2-14
Setting up an OSPA Datamart OCE Follow the same steps as the SFMA Datamart OCE process except replace
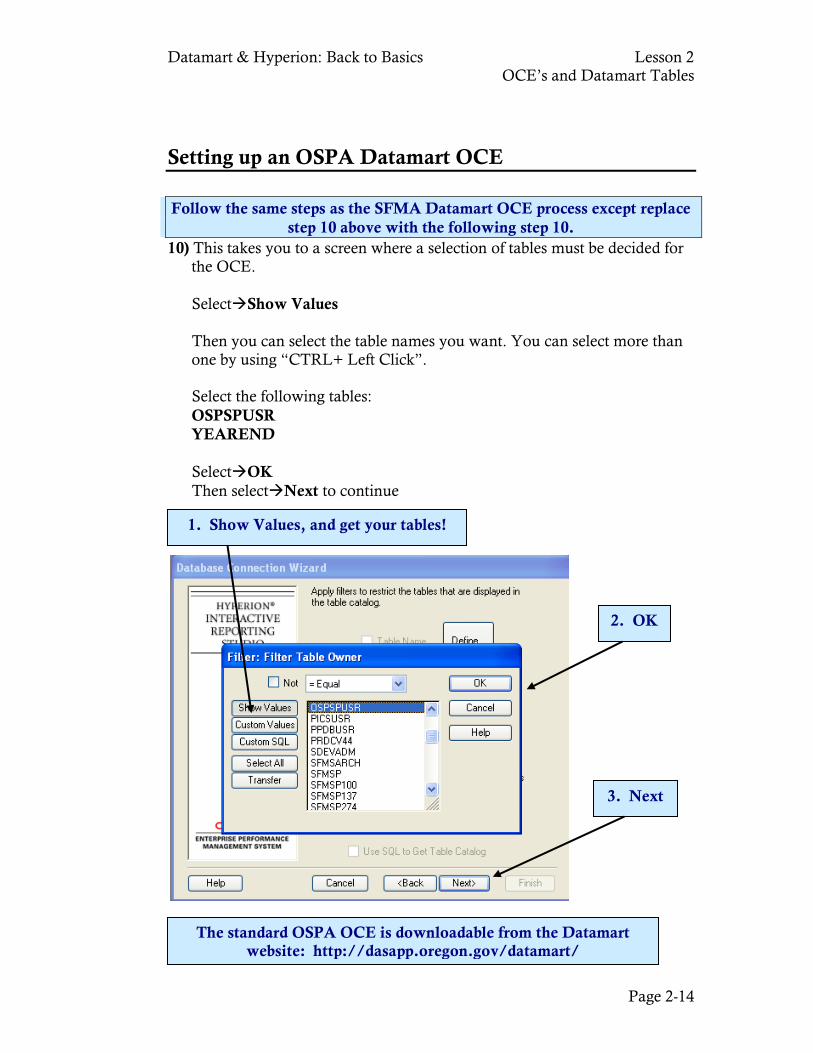
step 10 above with the following step 10. 10) This takes you to a screen where a selection of tables must be decided for
the OCE. SelectShow Values Then you can select the table names you want. You can select more than
one by using “CTRL+ Left Click”. Select the following tables:
OSPSPUSR YEAREND SelectOK Then selectNext to continue
1. Show Values, and get your tables!
2. OK
3. Next
The standard OSPA OCE is downloadable from the Datamart website: http://dasapp.oregon.gov/datamart/
Datamart & Hyperion: Back to Basics Lesson 2 OCE’s and Datamart Tables
Page 2-15
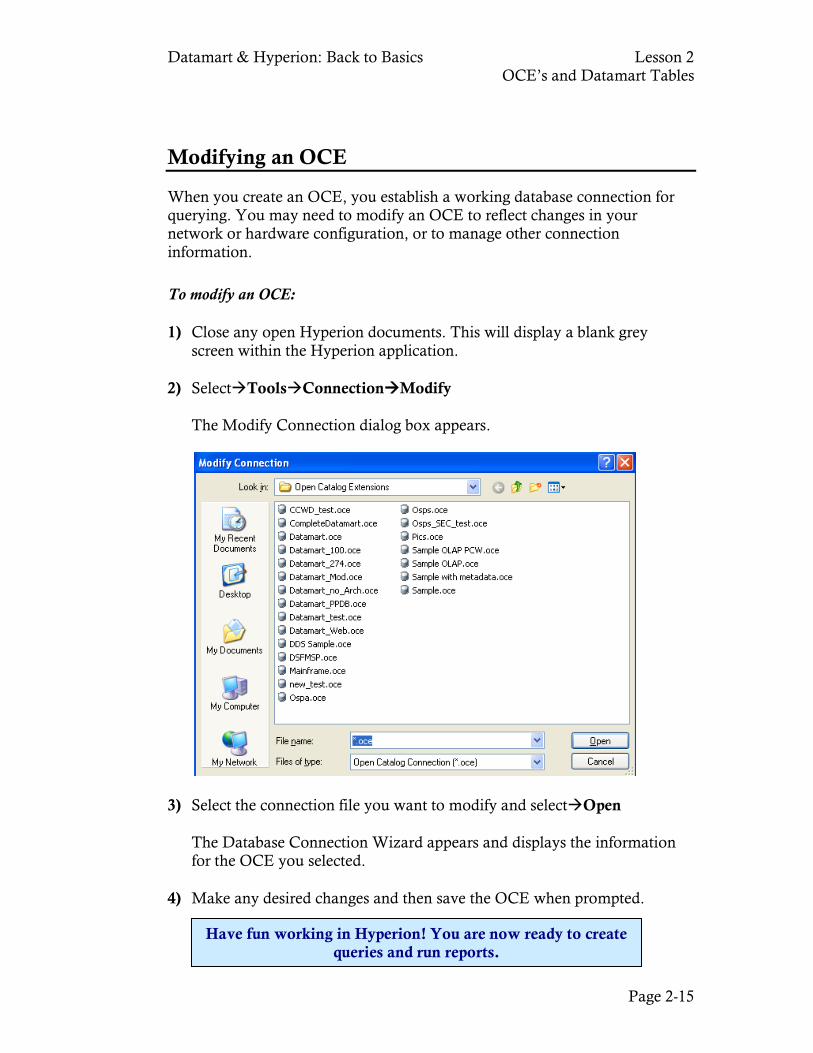
Modifying an OCE When you create an OCE, you establish a working database connection for querying. You may need to modify an OCE to reflect changes in your network or hardware configuration, or to manage other connection information.
To modify an OCE:
1) Close any open Hyperion documents. This will display a blank grey screen within the Hyperion application.
2) SelectToolsConnectionModify
The Modify Connection dialog box appears.
3) Select the connection file you want to modify and selectOpen
The Database Connection Wizard appears and displays the information for the OCE you selected.
4) Make any desired changes and then save the OCE when prompted.
Have fun working in Hyperion! You are now ready to create queries and run reports.
Datamart & Hyperion: Back to Basics Lesson 2 OCE’s and Datamart Tables
Page 2-16
Tables on the Datamart There are two types of tables on the Datamart: Financial and Profile. The main difference between the two is the financial tables contain financial information, such as General Ledger balances, and transaction amounts. While the profile tables provide titles for various data elements, or allows a roll-up of information to a higher level than the financial table can provide. If you want detail finer than what is on any of the financial tables, you are not going to have much luck. The Datamart and the query tools can only slice and dice the data as deeply as the data goes. For example, if you want to get a subset of your comptroller objects. You will not have a way to tie that subset together using data on the Datamart; you are going to be stuck (likely) having to go to the detailed records or the original documents.
SFMA Financial Tables Accounting Event Tables Active Accounting Event This table mirrors the data from the SFMA system. Data is reflective of the current 3 months of active transactions. All Accounting Event This table mirrors the data from the SFMA system. Data is reflective of the current fiscal year and five prior years of transactions. This table may contain up to two years of addition information depending on the purge timetable. Archive Accounting Event This table mirrors the data from the SFMA system. Data is reflective of the current fiscal year and seven prior years of transactions. This table may contain up to two years of addition information depending on the purge timetable. YE Active Accounting Event This table mirrors the data from the SFMA system. Data is reflective of the current fiscal year of transactions. This table is updated only three times during month 13 and at other times of the year, this table contains zero data. The accounting event tables are the lowest level of detail in the Datamart. All other financial tables are various summaries of this information.
Datamart & Hyperion: Back to Basics Lesson 2 OCE’s and Datamart Tables
Page 2-17
Note: In the Datamart, ‘date’ fields are actual dates, while date fields in SFMA are ‘text’ fields. This allows SFMA to contain dates not on a standard calendar. Month 13, identified through effective date, is the best example of this occurrence. In SFMA, Month 13 is identified as 6/31/YEAR. In the Datamart, date fields are not allowed to have dates not on the calendar – a data validation feature in DB2. In order for us to move data to the Datamart, we have to do some “data washing”. Dates like 6/31/YEAR are changed to 6/30/YEAR, a new data element is introduced called Batch Date Ci. The download program picks up the last digit in the month and records it in this field. This way, any time an incorrect date is entered into SFMA, it is corrected in the Datamart, and an indicator is provided. Note: The Fiscal Month field identifies the appropriate fiscal month, including month 13.
General Ledger Detail Tables General Ledger DetailThis table mirrors the data from the SFMA system. This table summarizes General Ledger balances, and summarizes at the object and agency object level. YE General Ledger Detail This table mirrors the data from the SFMA system. However, the data on this table is updated only during month 13 close. During the period of approximately mid-July to the close in August, this table is updated with the balances in the current fiscal year only. At other times of the year, this table contains zero data. This table summarizes General Ledger balances, and summarizes at the object and agency object level. Arch GL Detail This table mirrors the data from the SFMA system. The period available is dependent on the date of agency implementation onto SFMA.
Datamart & Hyperion: Back to Basics Lesson 2 OCE’s and Datamart Tables
Page 2-18
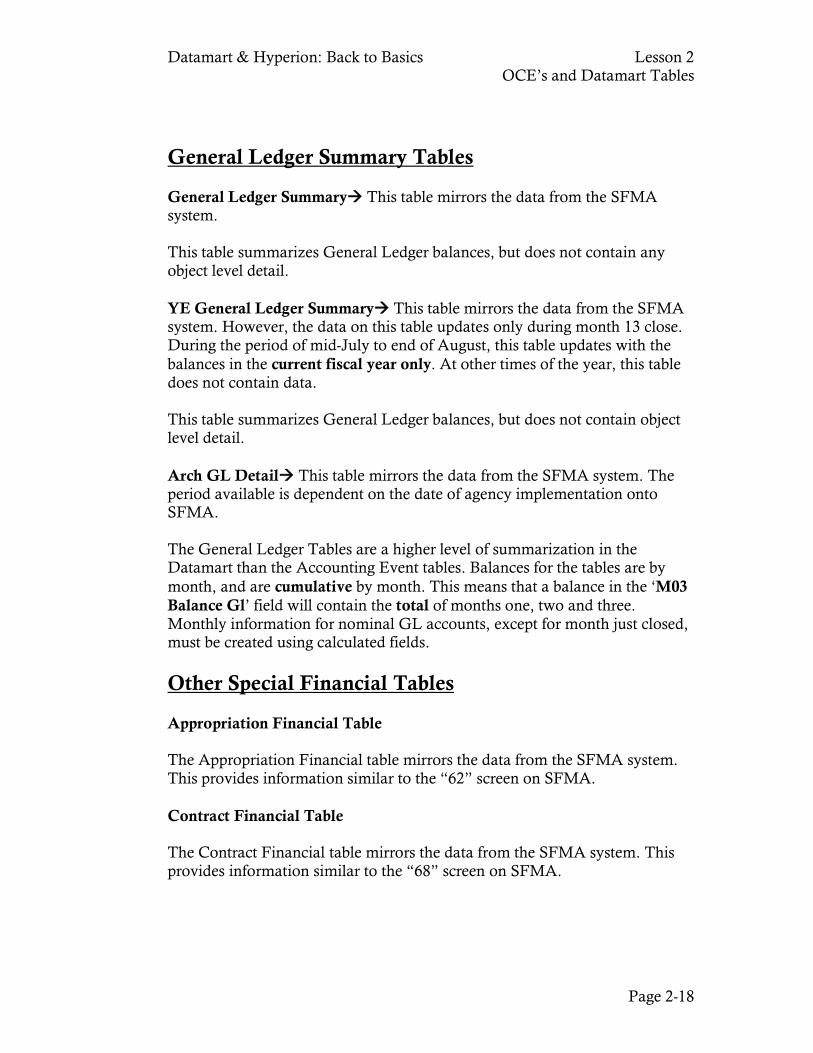
General Ledger Summary Tables General Ledger Summary This table mirrors the data from the SFMA system. This table summarizes General Ledger balances, but does not contain any object level detail. YE General Ledger Summary This table mirrors the data from the SFMA system. However, the data on this table updates only during month 13 close. During the period of mid-July to end of August, this table updates with the balances in the current fiscal year only. At other times of the year, this table does not contain data. This table summarizes General Ledger balances, but does not contain object level detail. Arch GL Detail This table mirrors the data from the SFMA system. The period available is dependent on the date of agency implementation onto SFMA. The General Ledger Tables are a higher level of summarization in the Datamart than the Accounting Event tables. Balances for the tables are by month, and are cumulative by month. This means that a balance in the ‘M03 Balance Gl’ field will contain the total of months one, two and three. Monthly information for nominal GL accounts, except for month just closed, must be created using calculated fields.
Other Special Financial Tables Appropriation Financial Table The Appropriation Financial table mirrors the data from the SFMA system. This provides information similar to the “62” screen on SFMA. Contract Financial Table The Contract Financial table mirrors the data from the SFMA system. This provides information similar to the “68” screen on SFMA.
Datamart & Hyperion: Back to Basics Lesson 2 OCE’s and Datamart Tables
Page 2-19
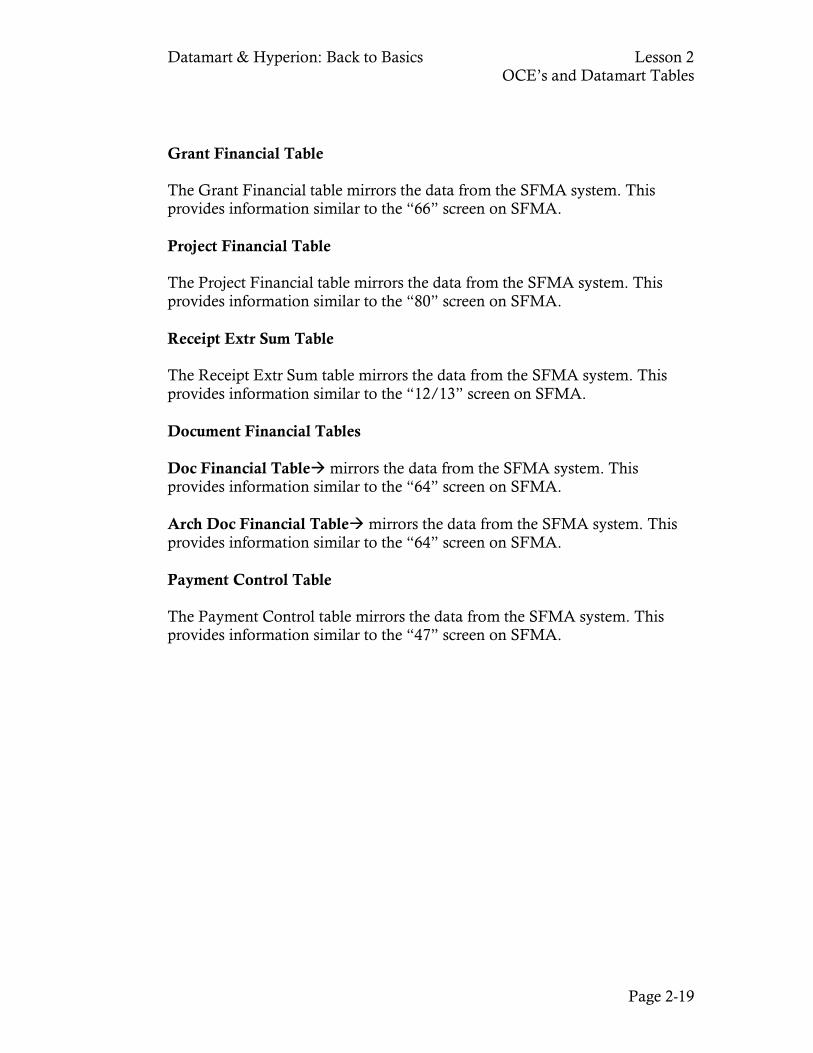
Grant Financial Table The Grant Financial table mirrors the data from the SFMA system. This provides information similar to the “66” screen on SFMA. Project Financial Table The Project Financial table mirrors the data from the SFMA system. This provides information similar to the “80” screen on SFMA. Receipt Extr Sum Table The Receipt Extr Sum table mirrors the data from the SFMA system. This provides information similar to the “12/13” screen on SFMA. Document Financial Tables Doc Financial Table mirrors the data from the SFMA system. This provides information similar to the “64” screen on SFMA. Arch Doc Financial Table mirrors the data from the SFMA system. This provides information similar to the “64” screen on SFMA. Payment Control Table The Payment Control table mirrors the data from the SFMA system. This provides information similar to the “47” screen on SFMA.
Datamart & Hyperion: Back to Basics Lesson 2 OCE’s and Datamart Tables
Page 2-20
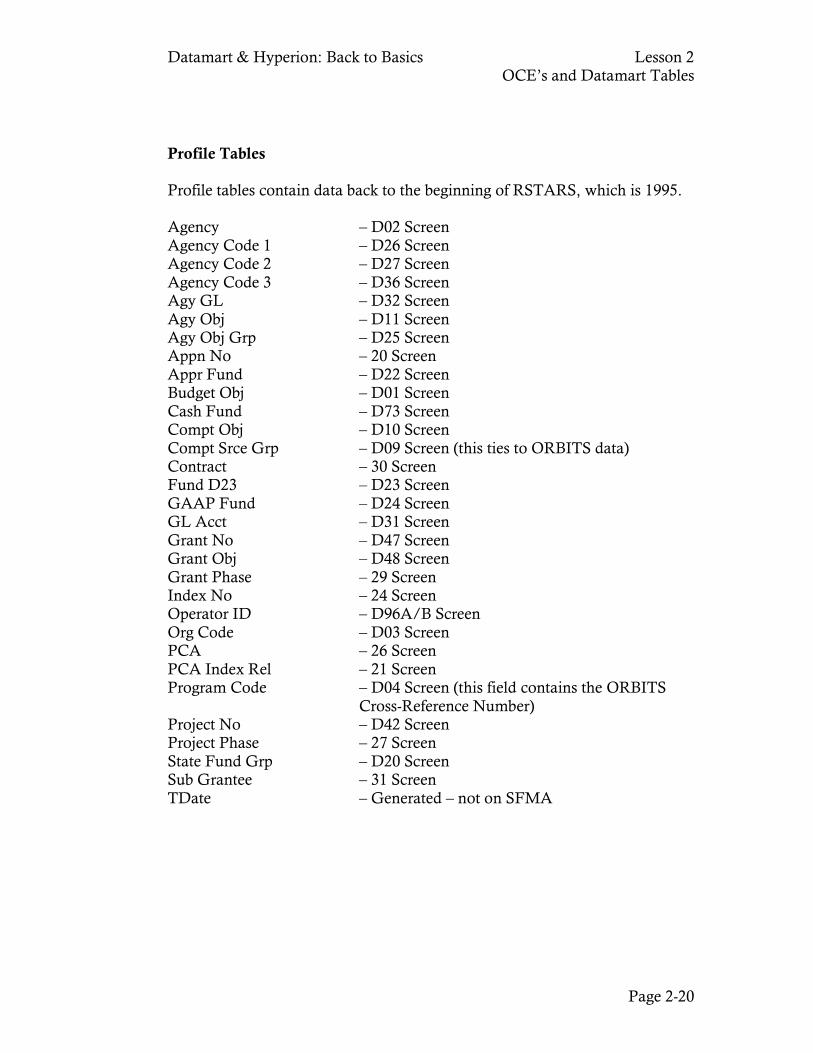
Profile Tables Profile tables contain data back to the beginning of RSTARS, which is 1995. Agency – D02 Screen Agency Code 1 – D26 Screen Agency Code 2 – D27 Screen Agency Code 3 – D36 Screen Agy GL – D32 Screen Agy Obj – D11 Screen Agy Obj Grp – D25 Screen Appn No – 20 Screen Appr Fund – D22 Screen Budget Obj – D01 Screen Cash Fund – D73 Screen Compt Obj – D10 Screen Compt Srce Grp – D09 Screen (this ties to ORBITS data) Contract – 30 Screen Fund D23 – D23 Screen GAAP Fund – D24 Screen GL Acct – D31 Screen Grant No – D47 Screen Grant Obj – D48 Screen Grant Phase – 29 Screen Index No – 24 Screen Operator ID – D96A/B Screen Org Code – D03 Screen PCA – 26 Screen PCA Index Rel – 21 Screen Program Code – D04 Screen (this field contains the ORBITS
Cross-Reference Number) Project No – D42 Screen Project Phase – 27 Screen State Fund Grp – D20 Screen Sub Grantee – 31 Screen TDate – Generated – not on SFMA
Datamart & Hyperion: Back to Basics Lesson 2 OCE’s and Datamart Tables
Page 2-21
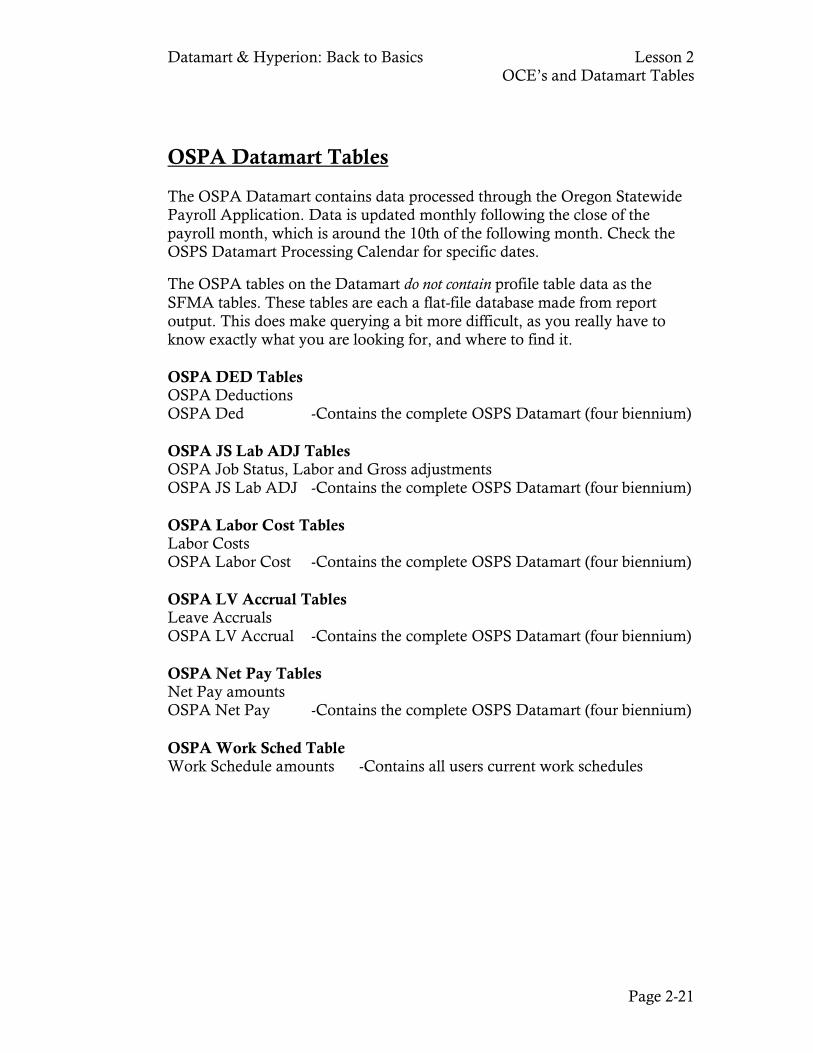
OSPA Datamart Tables The OSPA Datamart contains data processed through the Oregon Statewide Payroll Application. Data is updated monthly following the close of the payroll month, which is around the 10th of the following month. Check the OSPS Datamart Processing Calendar for specific dates. The OSPA tables on the Datamart do not contain profile table data as the SFMA tables. These tables are each a flat-file database made from report output. This does make querying a bit more difficult, as you really have to know exactly what you are looking for, and where to find it. OSPA DED Tables OSPA Deductions OSPA Ded -Contains the complete OSPS Datamart (four biennium) OSPA JS Lab ADJ Tables OSPA Job Status, Labor and Gross adjustments OSPA JS Lab ADJ -Contains the complete OSPS Datamart (four biennium) OSPA Labor Cost Tables Labor Costs OSPA Labor Cost -Contains the complete OSPS Datamart (four biennium) OSPA LV Accrual Tables Leave Accruals OSPA LV Accrual -Contains the complete OSPS Datamart (four biennium) OSPA Net Pay Tables Net Pay amounts OSPA Net Pay -Contains the complete OSPS Datamart (four biennium) OSPA Work Sched Table Work Schedule amounts -Contains all users current work schedules
Datamart & Hyperion: Back to Basics Lesson 2 OCE’s and Datamart Tables
Page 2-22
Note: The OSPA Datamart does not contain:
• Confidential Information, such as Social Security numbers, wage withholding, garnishment info, bank account information or certain insurance surcharges
• Data sourced from other applications such as salary range or employee addresses
• Detailed daily time information if not using Online Daily Time • Furlough savings information
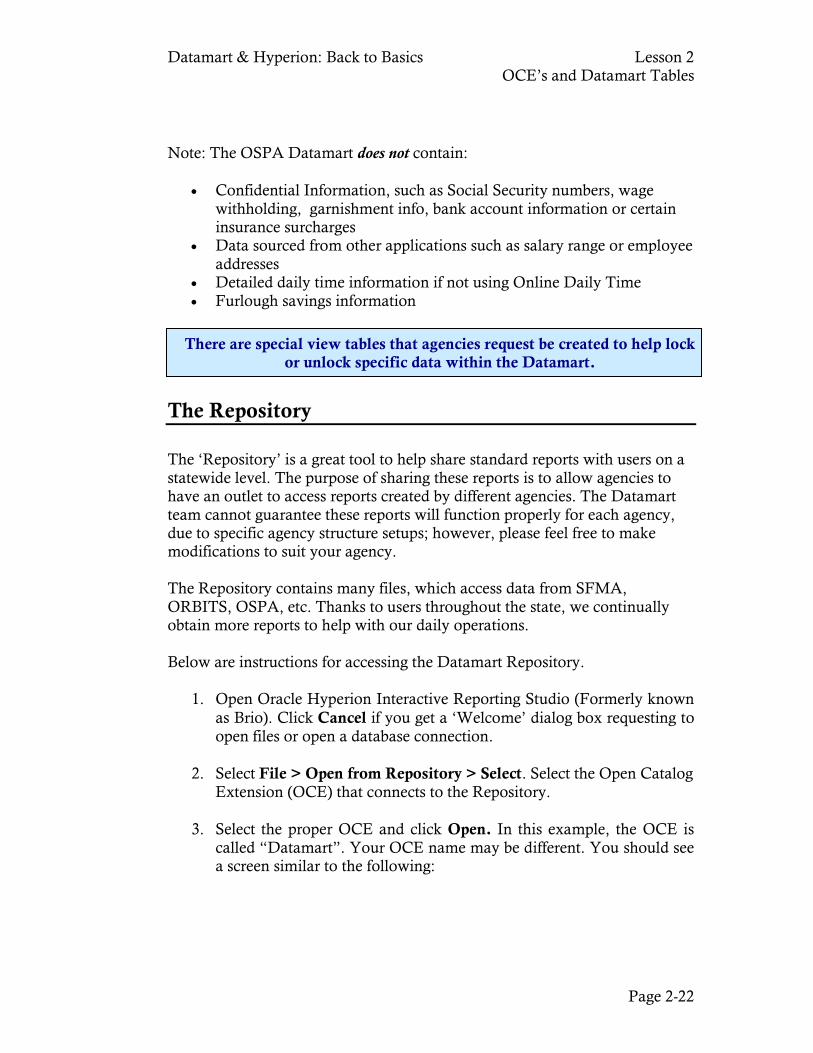
The Repository The ‘Repository’ is a great tool to help share standard reports with users on a statewide level. The purpose of sharing these reports is to allow agencies to have an outlet to access reports created by different agencies. The Datamart team cannot guarantee these reports will function properly for each agency, due to specific agency structure setups; however, please feel free to make modifications to suit your agency. The Repository contains many files, which access data from SFMA, ORBITS, OSPA, etc. Thanks to users throughout the state, we continually obtain more reports to help with our daily operations. Below are instructions for accessing the Datamart Repository.
1. Open Oracle Hyperion Interactive Reporting Studio (Formerly known as Brio). Click Cancel if you get a ‘Welcome’ dialog box requesting to open files or open a database connection.
2. Select File > Open from Repository > Select. Select the Open Catalog
Extension (OCE) that connects to the Repository.
3. Select the proper OCE and click Open. In this example, the OCE is called “Datamart”. Your OCE name may be different. You should see a screen similar to the following:
There are special view tables that agencies request be created to help lock or unlock specific data within the Datamart.
Datamart & Hyperion: Back to Basics Lesson 2 OCE’s and Datamart Tables
Page 2-23
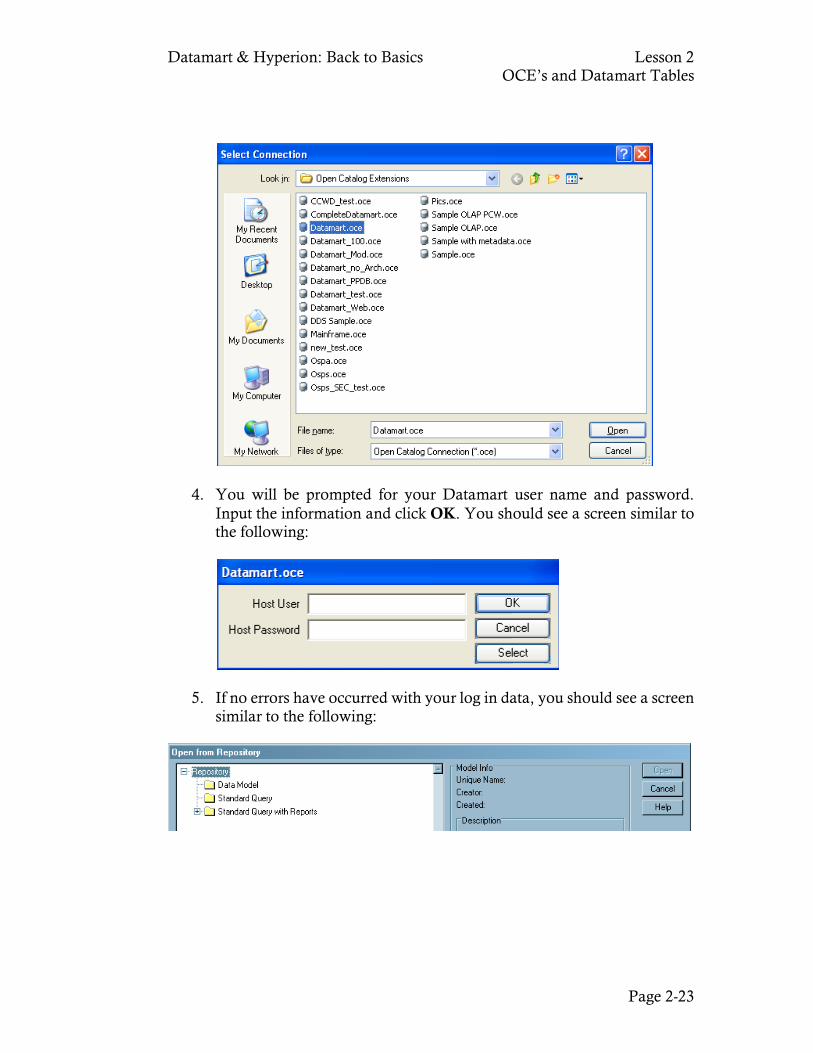
4. You will be prompted for your Datamart user name and password. Input the information and click OK. You should see a screen similar to the following:
5. If no errors have occurred with your log in data, you should see a screen similar to the following:
Datamart & Hyperion: Back to Basics Lesson 2 OCE’s and Datamart Tables
Page 2-24
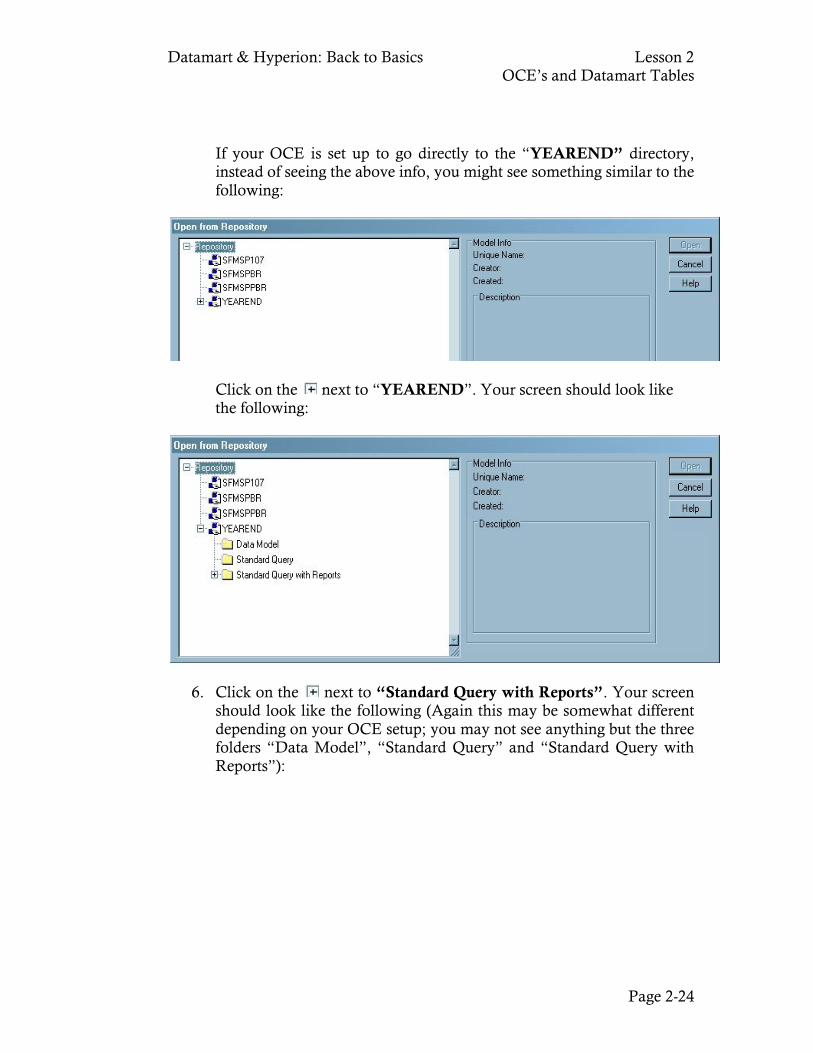
If your OCE is set up to go directly to the “YEAREND” directory, instead of seeing the above info, you might see something similar to the following:
Click on the next to “YEAREND”. Your screen should look like the following:
6. Click on the next to “Standard Query with Reports”. Your screen should look like the following (Again this may be somewhat different depending on your OCE setup; you may not see anything but the three folders “Data Model”, “Standard Query” and “Standard Query with Reports”):
Datamart & Hyperion: Back to Basics Lesson 2 OCE’s and Datamart Tables
Page 2-25
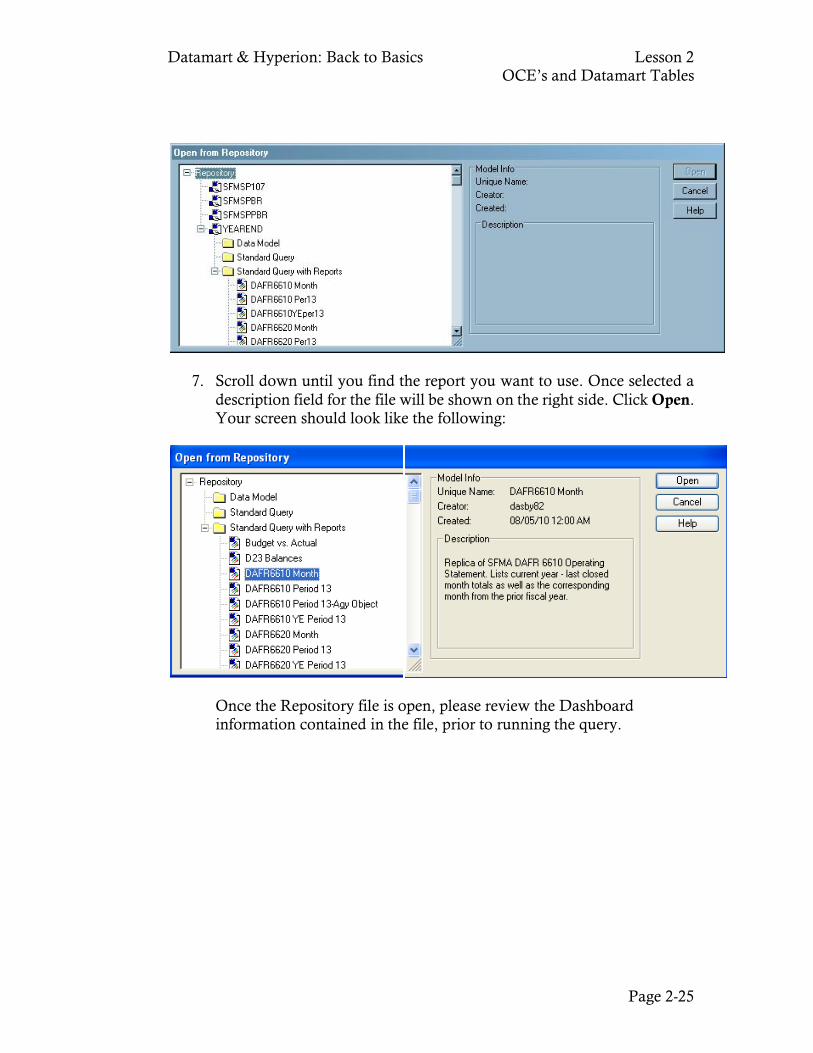
7. Scroll down until you find the report you want to use. Once selected a description field for the file will be shown on the right side. Click Open. Your screen should look like the following:
Once the Repository file is open, please review the Dashboard information contained in the file, prior to running the query.
Datamart & Hyperion: Back to Basics Lesson 2 OCE’s and Datamart Tables
Page 2-26
Exercise
1. What is an Open Catalog Extension (OCE)?
2. How many OCE’s can I set up on my machine?
3. Can I modify an existing OCE on my machine?
4. Name the 2 types of tables on the Datamart.
5. Name 3 financial tables found in the Datamart.
6. Name 3 profile tables found in the Datamart.
7. Name 3 OSPA tables found in the Datamart.
8. Name a resource, which provides a great tool to help share
standard reports with users on a statewide level.
Lesson 3
Hyperion Queries
Datamart & Hyperion Spider Web BQY Documents, Sections, and Toolbars Online Help Opening and Saving BQY Documents Processing and Stopping Queries Adding, Duplicating, Renaming, and Deleting BQY
Sections Hiding a BQY Section Sending BQY Documents as Email Attachments Printing BQY Sections
o Adjusting the Page Margins in Print Preview o Adding Headers and Footers o Printing Sections
Datamart & Hyperion: Back to Basics Lesson 3 Hyperion Queries
Page 3-2
Datamart & Hyperion Spider Web Let’s talk about the flow of data from the financial world to the Datamart. How does it get to your machine and out on a piece of paper for your boss or meeting?
DAS
Datamart
Microsoft Access, Excel and Text files -
Data brought into Hyperion
Mainframe: SFMA OSPA PPDB
Hyperion Document
Microsoft Excel, Microsoft Access,
Crystal Reports, etc.
Query
Results
Table
Pivot
Chart
Orbits & PICS
Report
Dashboard
Datamart & Hyperion: Back to Basics Lesson 3 Hyperion Queries
Page 3-3
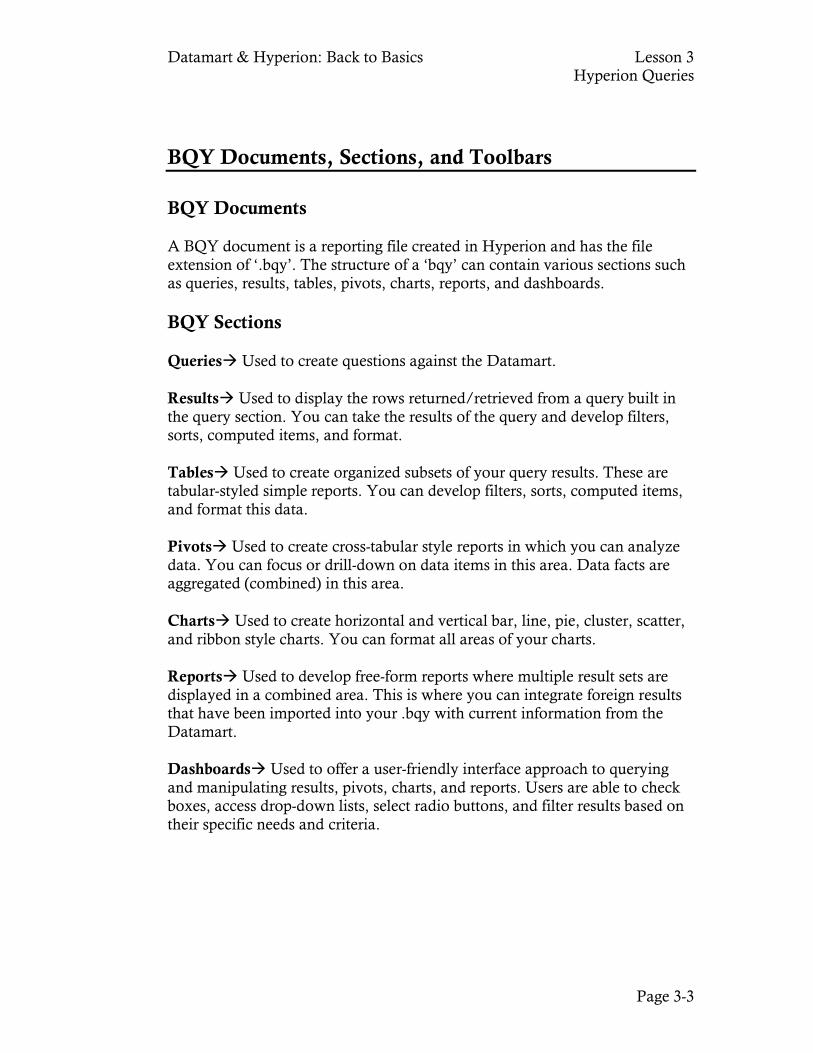
BQY Documents, Sections, and Toolbars BQY Documents A BQY document is a reporting file created in Hyperion and has the file extension of ‘.bqy’. The structure of a ‘bqy’ can contain various sections such as queries, results, tables, pivots, charts, reports, and dashboards. BQY Sections Queries Used to create questions against the Datamart. Results Used to display the rows returned/retrieved from a query built in the query section. You can take the results of the query and develop filters, sorts, computed items, and format. Tables Used to create organized subsets of your query results. These are tabular-styled simple reports. You can develop filters, sorts, computed items, and format this data. Pivots Used to create cross-tabular style reports in which you can analyze data. You can focus or drill-down on data items in this area. Data facts are aggregated (combined) in this area. Charts Used to create horizontal and vertical bar, line, pie, cluster, scatter, and ribbon style charts. You can format all areas of your charts. Reports Used to develop free-form reports where multiple result sets are displayed in a combined area. This is where you can integrate foreign results that have been imported into your .bqy with current information from the Datamart. Dashboards Used to offer a user-friendly interface approach to querying and manipulating results, pivots, charts, and reports. Users are able to check boxes, access drop-down lists, select radio buttons, and filter results based on their specific needs and criteria.
Datamart & Hyperion: Back to Basics Lesson 3 Hyperion Queries
Page 3-4
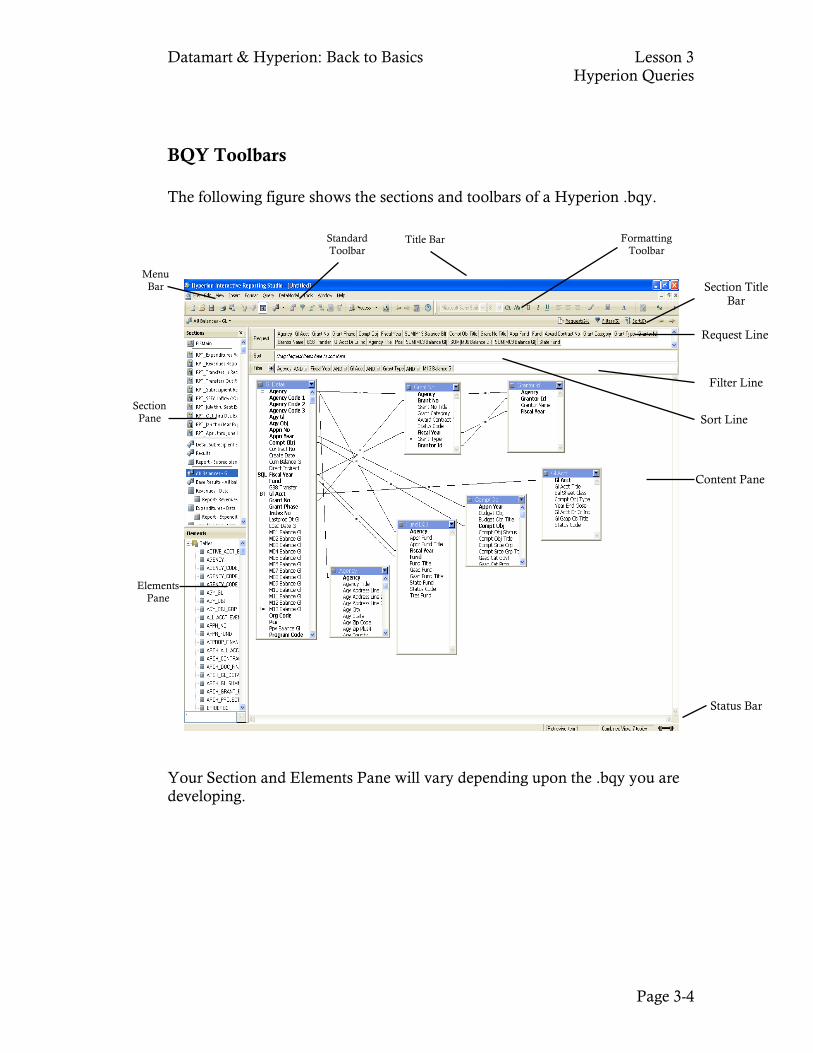
BQY Toolbars The following figure shows the sections and toolbars of a Hyperion .bqy.
Your Section and Elements Pane will vary depending upon the .bqy you are developing.
Title Bar
Menu Bar
Standard Toolbar
Formatting Toolbar
Section Pane
Elements
Pane
Status Bar
Content Pane
Sort Line
Filter Line
Request Line
Section Title Bar
Datamart & Hyperion: Back to Basics Lesson 3 Hyperion Queries
Page 3-5
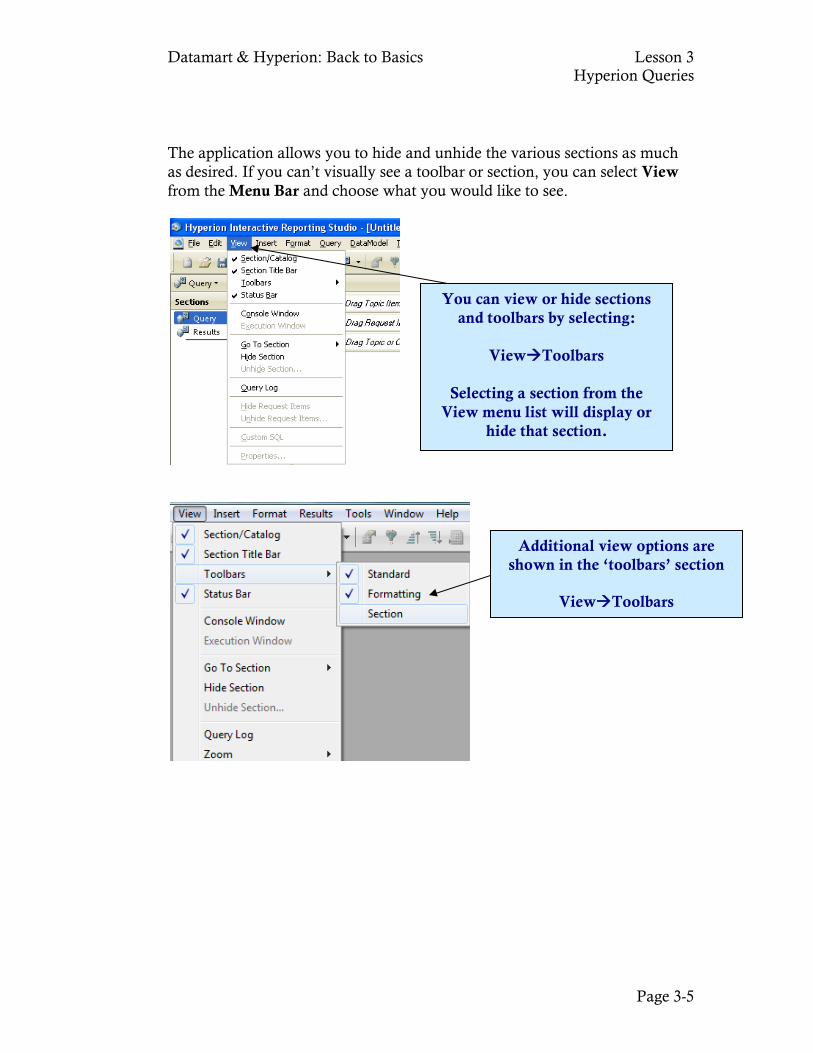
The application allows you to hide and unhide the various sections as much as desired. If you can’t visually see a toolbar or section, you can select View from the Menu Bar and choose what you would like to see.
You can view or hide sections and toolbars by selecting:
ViewToolbars
Selecting a section from the
View menu list will display or hide that section.
Additional view options are shown in the ‘toolbars’ section
ViewToolbars
Datamart & Hyperion: Back to Basics Lesson 3 Hyperion Queries
Page 3-6
Online Help Online help is available through Hyperion. To access help: From the Menu Bar (Note: Must have bqy started) HelpHelp on Content Or Select the ‘F1’ key This will take you to Hyperion online help. You can search for help by three methods:
Contents Allows the user to search for help on a pre-defined topic Index Search for help on predefined topics alphabetically Search Type your help issue in the search box for results
Datamart & Hyperion: Back to Basics Lesson 3 Hyperion Queries
Page 3-7
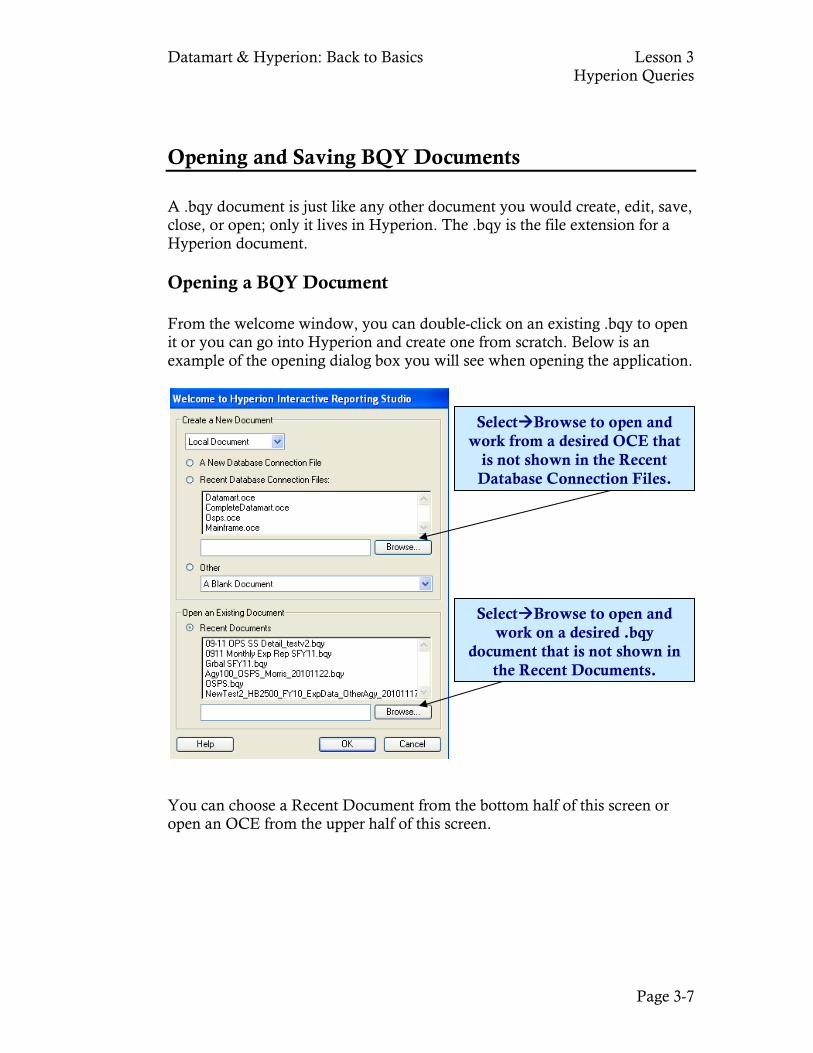
Opening and Saving BQY Documents A .bqy document is just like any other document you would create, edit, save, close, or open; only it lives in Hyperion. The .bqy is the file extension for a Hyperion document. Opening a BQY Document From the welcome window, you can double-click on an existing .bqy to open it or you can go into Hyperion and create one from scratch. Below is an example of the opening dialog box you will see when opening the application.
You can choose a Recent Document from the bottom half of this screen or open an OCE from the upper half of this screen.
SelectBrowse to open and work from a desired OCE that
is not shown in the Recent Database Connection Files.
SelectBrowse to open and work on a desired .bqy
document that is not shown in the Recent Documents.
Datamart & Hyperion: Back to Basics Lesson 3 Hyperion Queries
Page 3-8
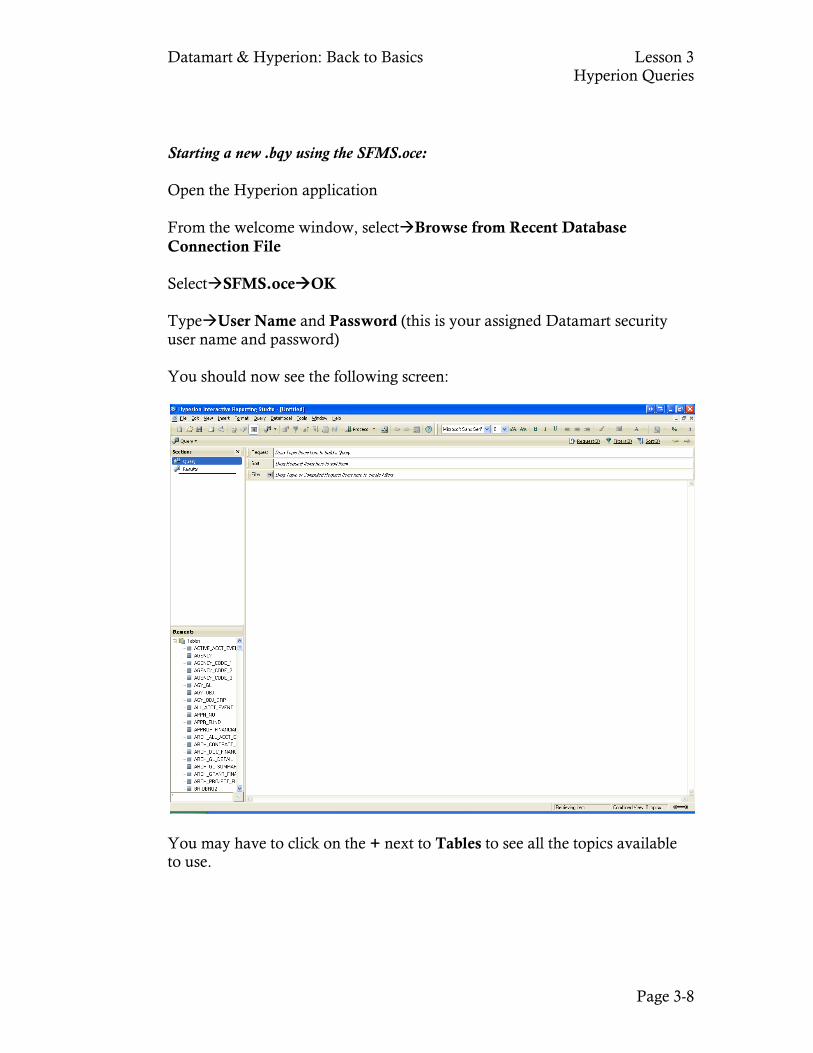
Starting a new .bqy using the SFMS.oce: Open the Hyperion application From the welcome window, selectBrowse from Recent Database Connection File SelectSFMS.oceOK TypeUser Name and Password (this is your assigned Datamart security user name and password) You should now see the following screen:
You may have to click on the + next to Tables to see all the topics available to use.
Datamart & Hyperion: Back to Basics Lesson 3 Hyperion Queries
Page 3-9
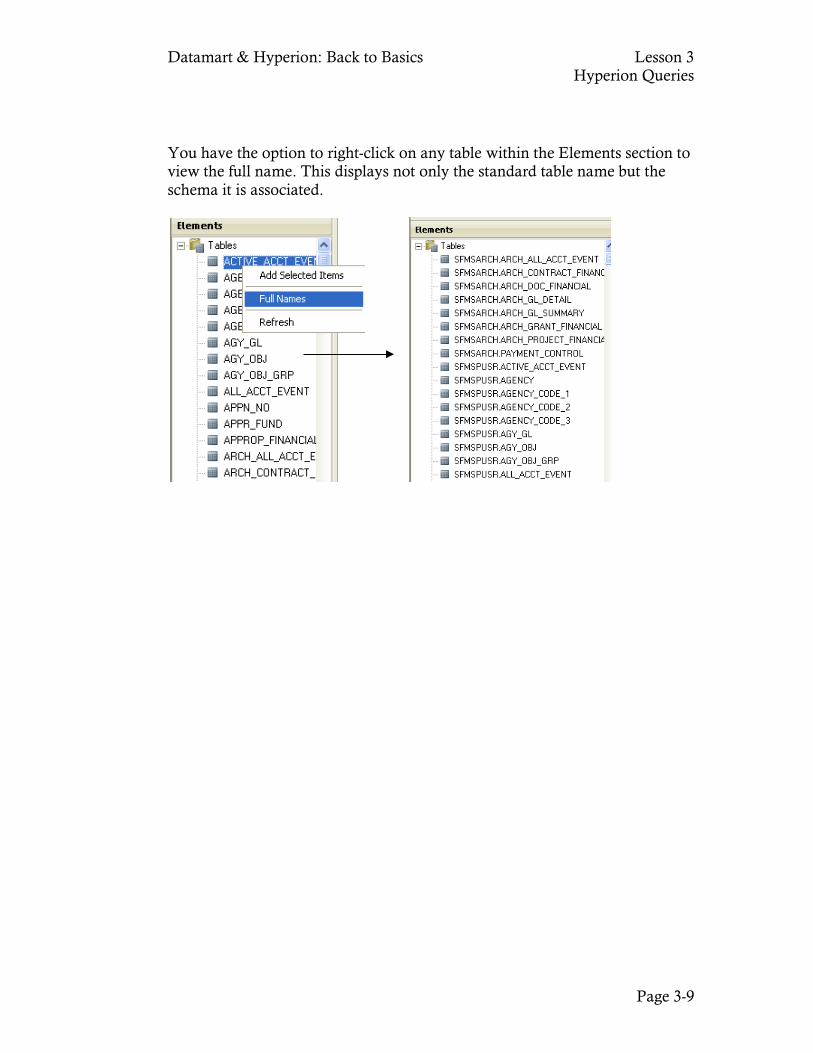
You have the option to right-click on any table within the Elements section to view the full name. This displays not only the standard table name but the schema it is associated.
Datamart & Hyperion: Back to Basics Lesson 3 Hyperion Queries
Page 3-10
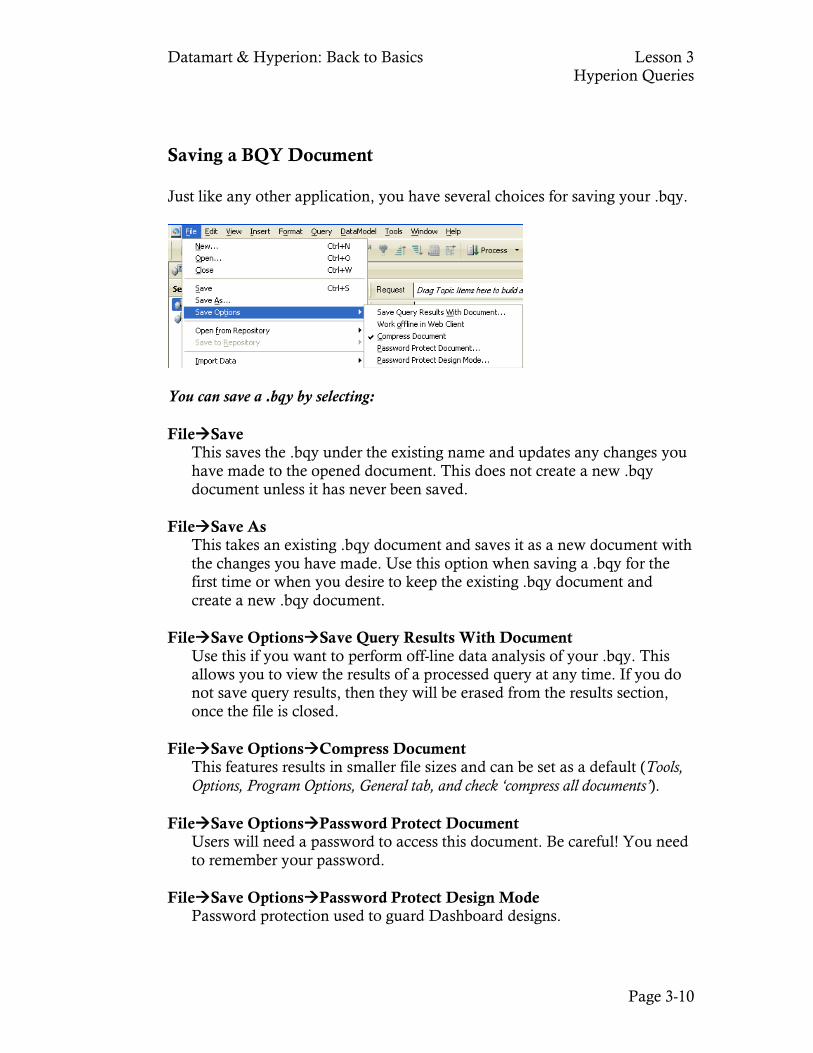
Saving a BQY Document Just like any other application, you have several choices for saving your .bqy.
You can save a .bqy by selecting: FileSave
This saves the .bqy under the existing name and updates any changes you have made to the opened document. This does not create a new .bqy document unless it has never been saved.
FileSave As
This takes an existing .bqy document and saves it as a new document with the changes you have made. Use this option when saving a .bqy for the first time or when you desire to keep the existing .bqy document and create a new .bqy document.
FileSave OptionsSave Query Results With Document Use this if you want to perform off-line data analysis of your .bqy. This
allows you to view the results of a processed query at any time. If you do not save query results, then they will be erased from the results section, once the file is closed.
FileSave OptionsCompress Document
This features results in smaller file sizes and can be set as a default (Tools, Options, Program Options, General tab, and check ‘compress all documents’).
FileSave OptionsPassword Protect Document
Users will need a password to access this document. Be careful! You need to remember your password.
FileSave OptionsPassword Protect Design Mode
Password protection used to guard Dashboard designs.
Datamart & Hyperion: Back to Basics Lesson 3 Hyperion Queries
Page 3-11
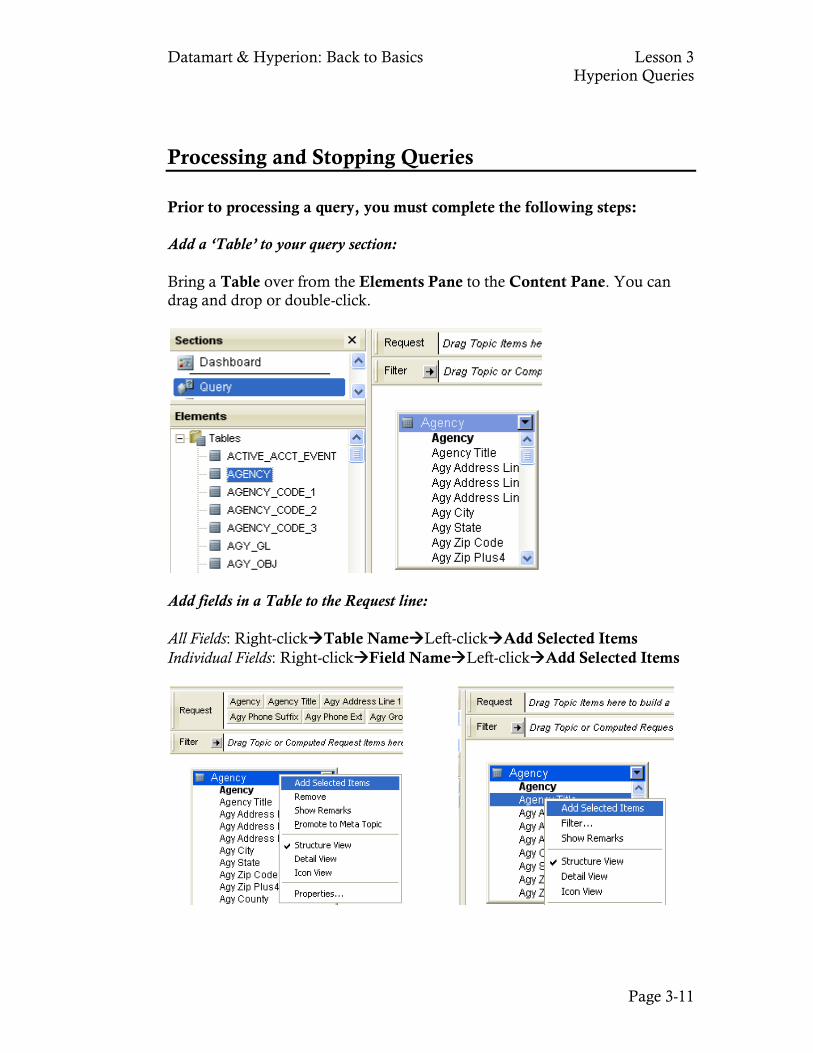
Processing and Stopping Queries Prior to processing a query, you must complete the following steps: Add a ‘Table’ to your query section: Bring a Table over from the Elements Pane to the Content Pane. You can drag and drop or double-click.
Add fields in a Table to the Request line: All Fields: Right-clickTable NameLeft-clickAdd Selected Items Individual Fields: Right-clickField NameLeft-clickAdd Selected Items
Datamart & Hyperion: Back to Basics Lesson 3 Hyperion Queries
Page 3-12
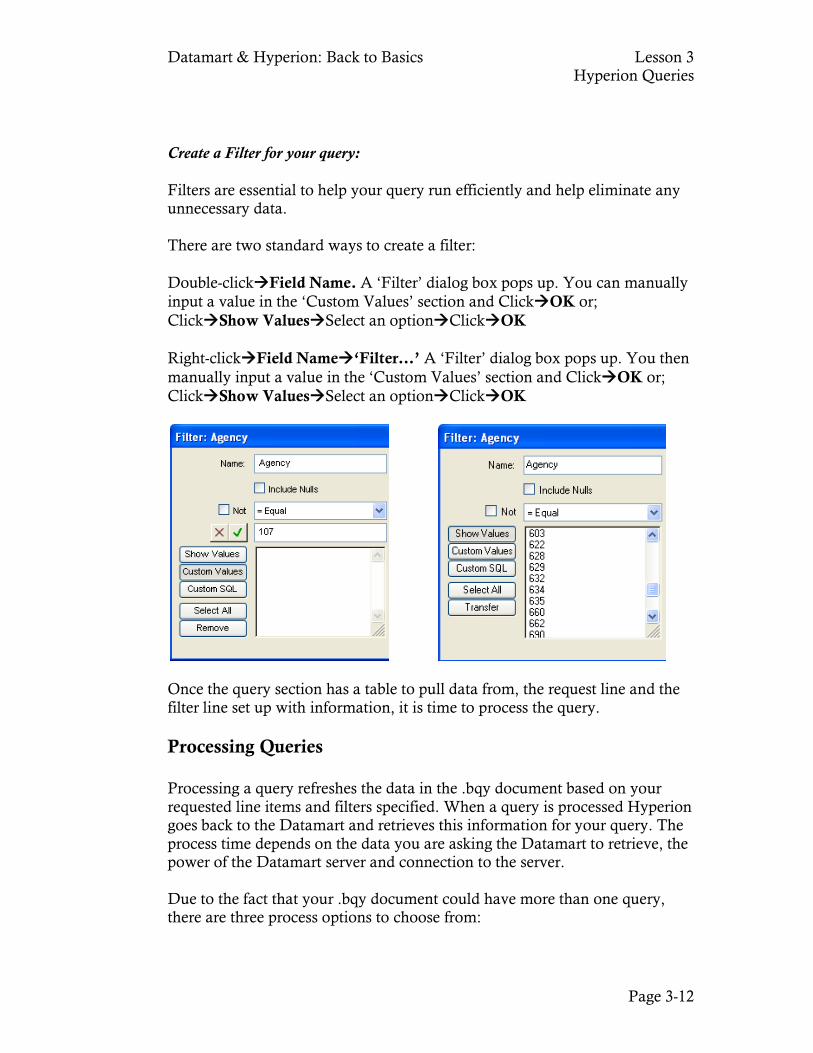
Create a Filter for your query: Filters are essential to help your query run efficiently and help eliminate any unnecessary data. There are two standard ways to create a filter: Double-clickField Name. A ‘Filter’ dialog box pops up. You can manually input a value in the ‘Custom Values’ section and ClickOK or; ClickShow ValuesSelect an optionClickOK Right-clickField Name‘Filter…’ A ‘Filter’ dialog box pops up. You then manually input a value in the ‘Custom Values’ section and ClickOK or; ClickShow ValuesSelect an optionClickOK
Once the query section has a table to pull data from, the request line and the filter line set up with information, it is time to process the query. Processing Queries Processing a query refreshes the data in the .bqy document based on your requested line items and filters specified. When a query is processed Hyperion goes back to the Datamart and retrieves this information for your query. The process time depends on the data you are asking the Datamart to retrieve, the power of the Datamart server and connection to the server. Due to the fact that your .bqy document could have more than one query, there are three process options to choose from:
Datamart & Hyperion: Back to Basics Lesson 3 Hyperion Queries
Page 3-13
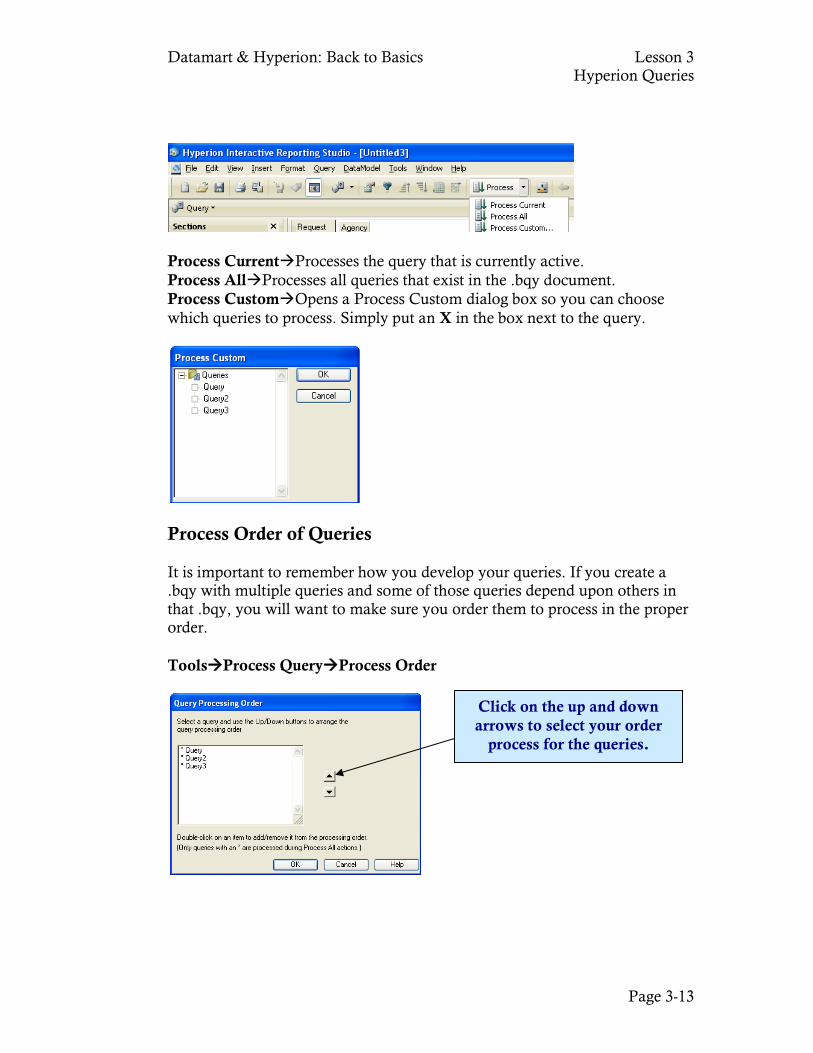
Process CurrentProcesses the query that is currently active. Process AllProcesses all queries that exist in the .bqy document. Process CustomOpens a Process Custom dialog box so you can choose which queries to process. Simply put an X in the box next to the query.
Process Order of Queries It is important to remember how you develop your queries. If you create a .bqy with multiple queries and some of those queries depend upon others in that .bqy, you will want to make sure you order them to process in the proper order. ToolsProcess QueryProcess Order
Click on the up and down arrows to select your order
process for the queries.
Datamart & Hyperion: Back to Basics Lesson 3 Hyperion Queries
Page 3-14
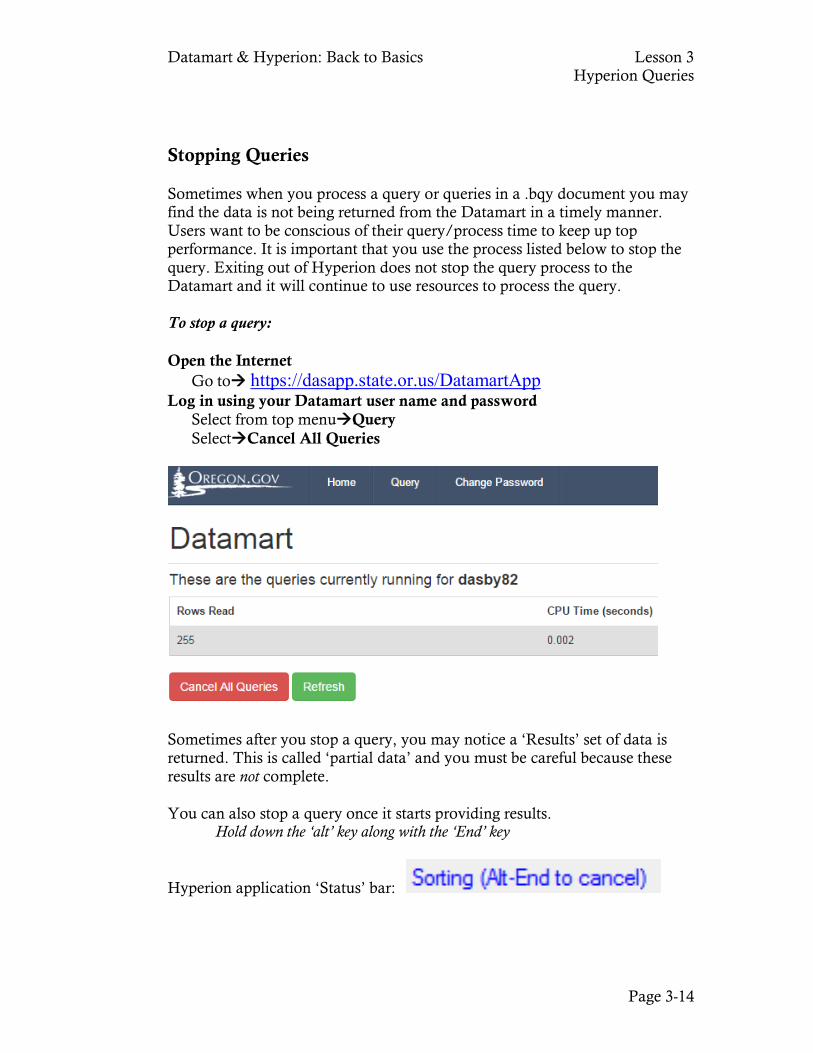
Stopping Queries Sometimes when you process a query or queries in a .bqy document you may find the data is not being returned from the Datamart in a timely manner. Users want to be conscious of their query/process time to keep up top performance. It is important that you use the process listed below to stop the query. Exiting out of Hyperion does not stop the query process to the Datamart and it will continue to use resources to process the query. To stop a query: Open the Internet
Go to https://dasapp.state.or.us/DatamartApp Log in using your Datamart user name and password
Select from top menuQuery SelectCancel All Queries
Sometimes after you stop a query, you may notice a ‘Results’ set of data is returned. This is called ‘partial data’ and you must be careful because these results are not complete. You can also stop a query once it starts providing results. Hold down the ‘alt’ key along with the ‘End’ key
Hyperion application ‘Status’ bar:
Datamart & Hyperion: Back to Basics Lesson 3 Hyperion Queries
Page 3-15
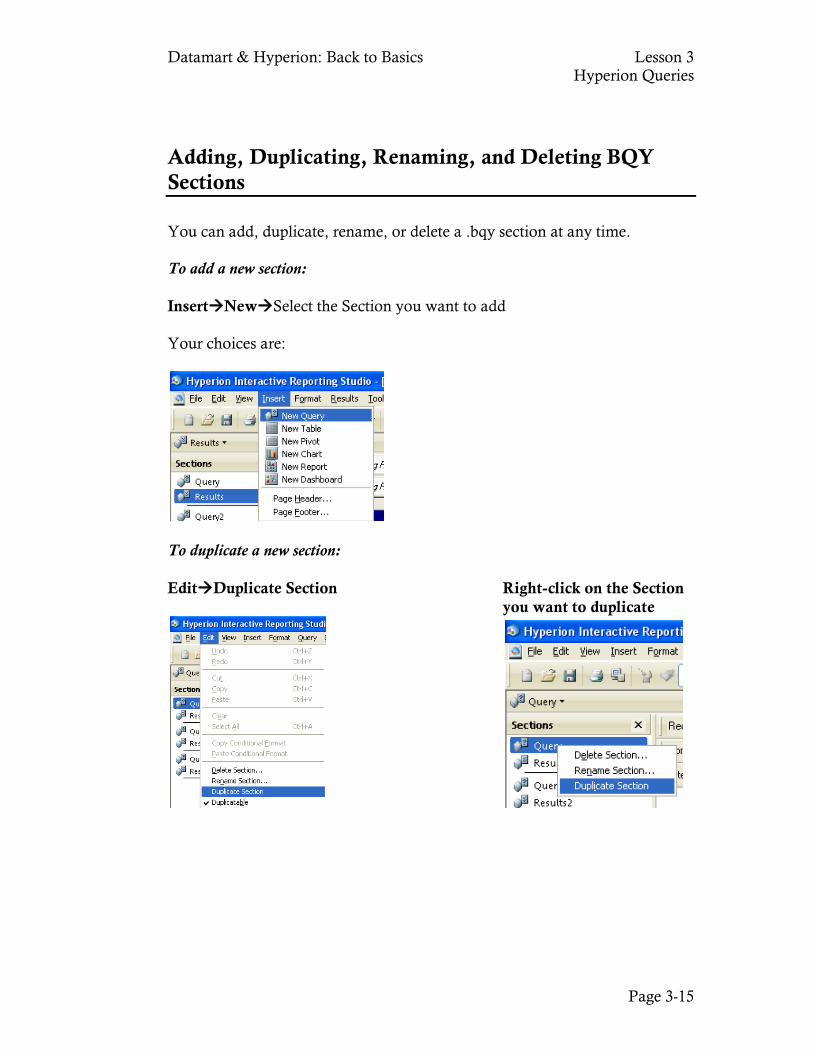
Adding, Duplicating, Renaming, and Deleting BQY Sections You can add, duplicate, rename, or delete a .bqy section at any time. To add a new section: InsertNewSelect the Section you want to add Your choices are:
To duplicate a new section: EditDuplicate Section Right-click on the Section
you want to duplicate
Datamart & Hyperion: Back to Basics Lesson 3 Hyperion Queries
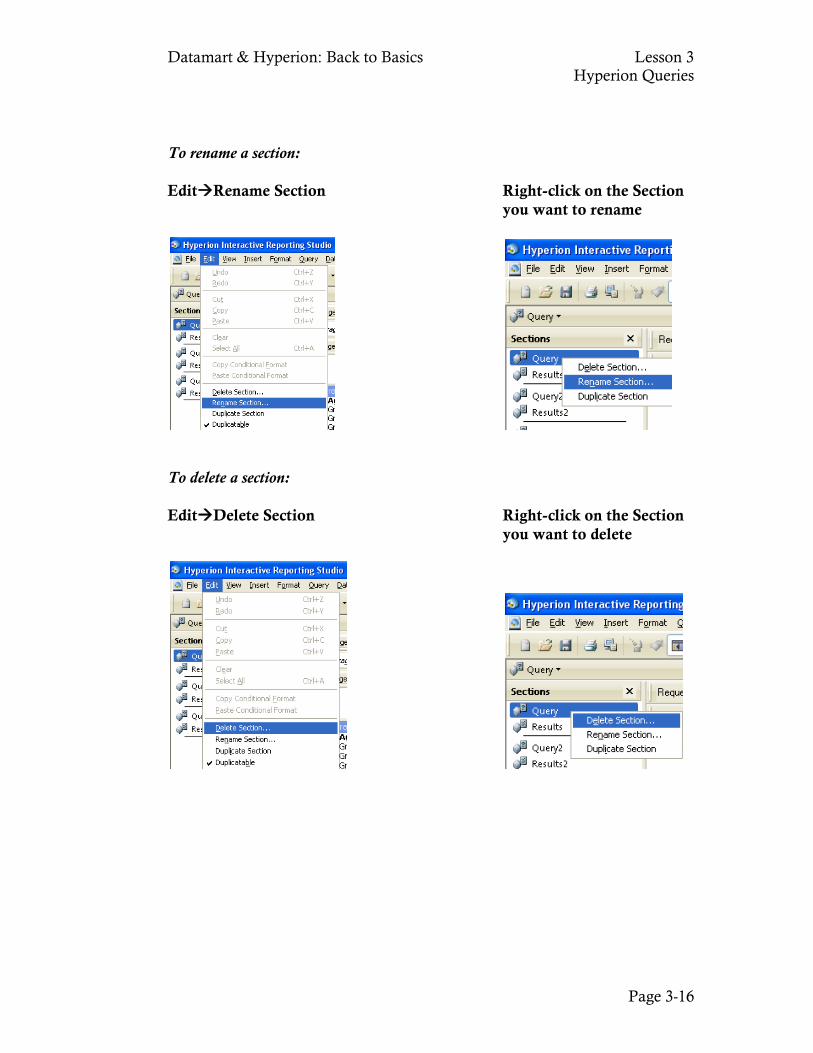
Page 3-16
To rename a section: EditRename Section Right-click on the Section
you want to rename
To delete a section: EditDelete Section Right-click on the Section
you want to delete
Datamart & Hyperion: Back to Basics Lesson 3 Hyperion Queries
Page 3-17
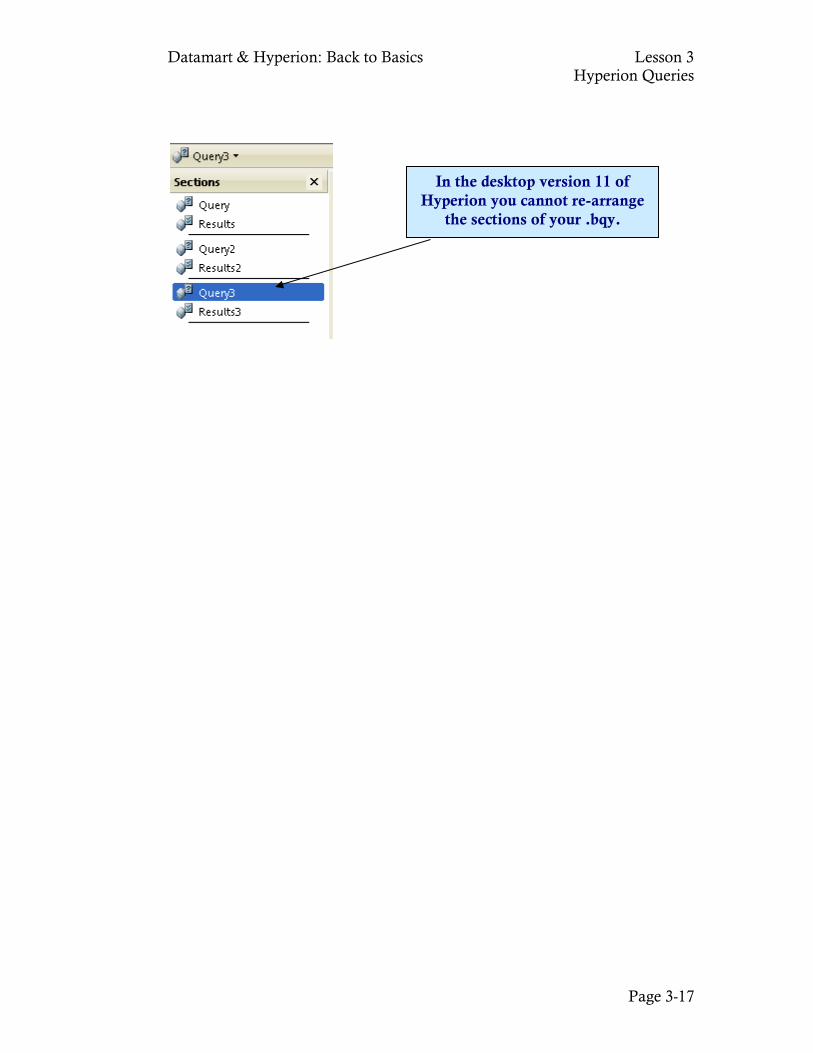
In the desktop version 11 of Hyperion you cannot re-arrange
the sections of your .bqy.
Datamart & Hyperion: Back to Basics Lesson 3 Hyperion Queries
Page 3-18
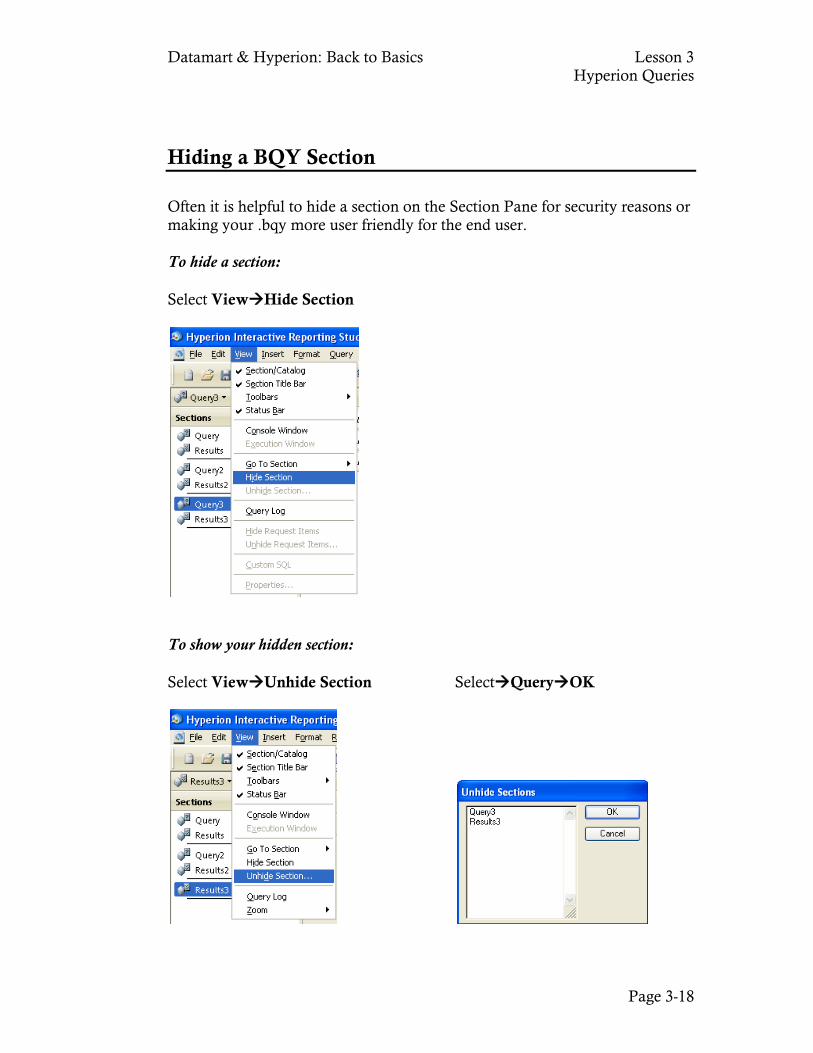
Hiding a BQY Section Often it is helpful to hide a section on the Section Pane for security reasons or making your .bqy more user friendly for the end user. To hide a section: Select ViewHide Section
To show your hidden section: Select ViewUnhide Section SelectQueryOK
Datamart & Hyperion: Back to Basics Lesson 3 Hyperion Queries
Page 3-19
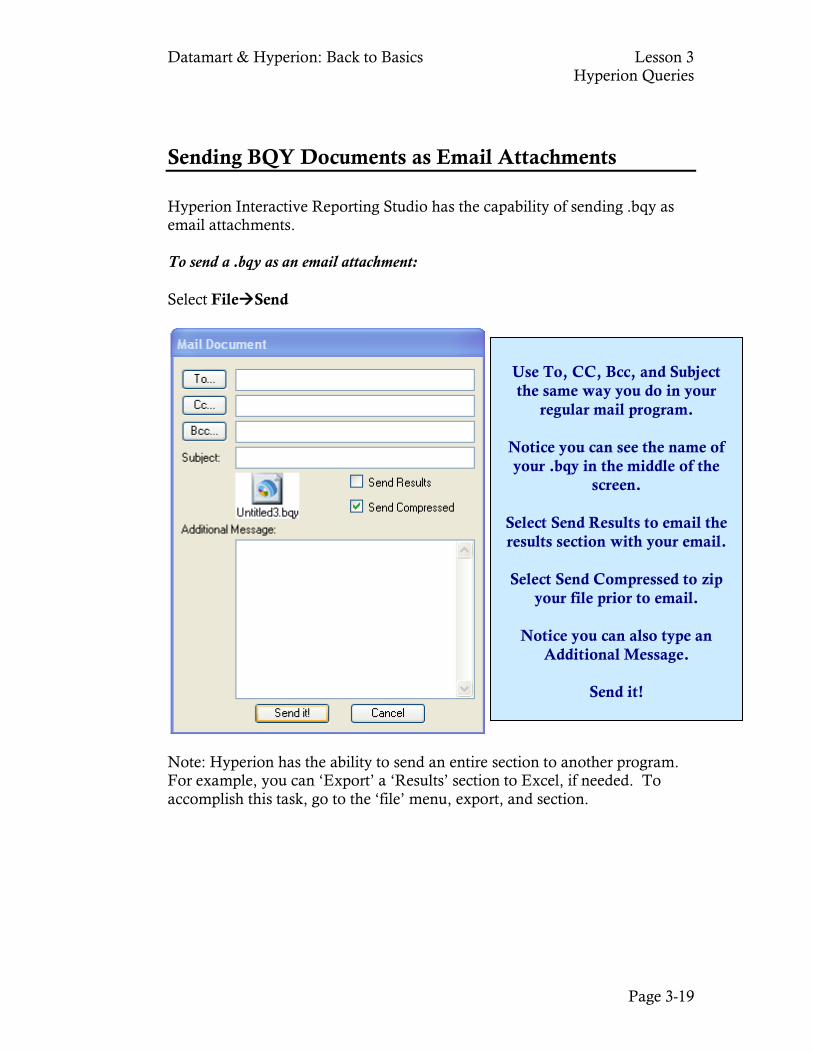
Sending BQY Documents as Email Attachments Hyperion Interactive Reporting Studio has the capability of sending .bqy as email attachments. To send a .bqy as an email attachment: Select FileSend
Note: Hyperion has the ability to send an entire section to another program. For example, you can ‘Export’ a ‘Results’ section to Excel, if needed. To accomplish this task, go to the ‘file’ menu, export, and section.
Use To, CC, Bcc, and Subject the same way you do in your
regular mail program.
Notice you can see the name of your .bqy in the middle of the
screen.
Select Send Results to email the results section with your email.
Select Send Compressed to zip
your file prior to email.
Notice you can also type an Additional Message.
Send it!
Datamart & Hyperion: Back to Basics Lesson 3 Hyperion Queries
Page 3-20
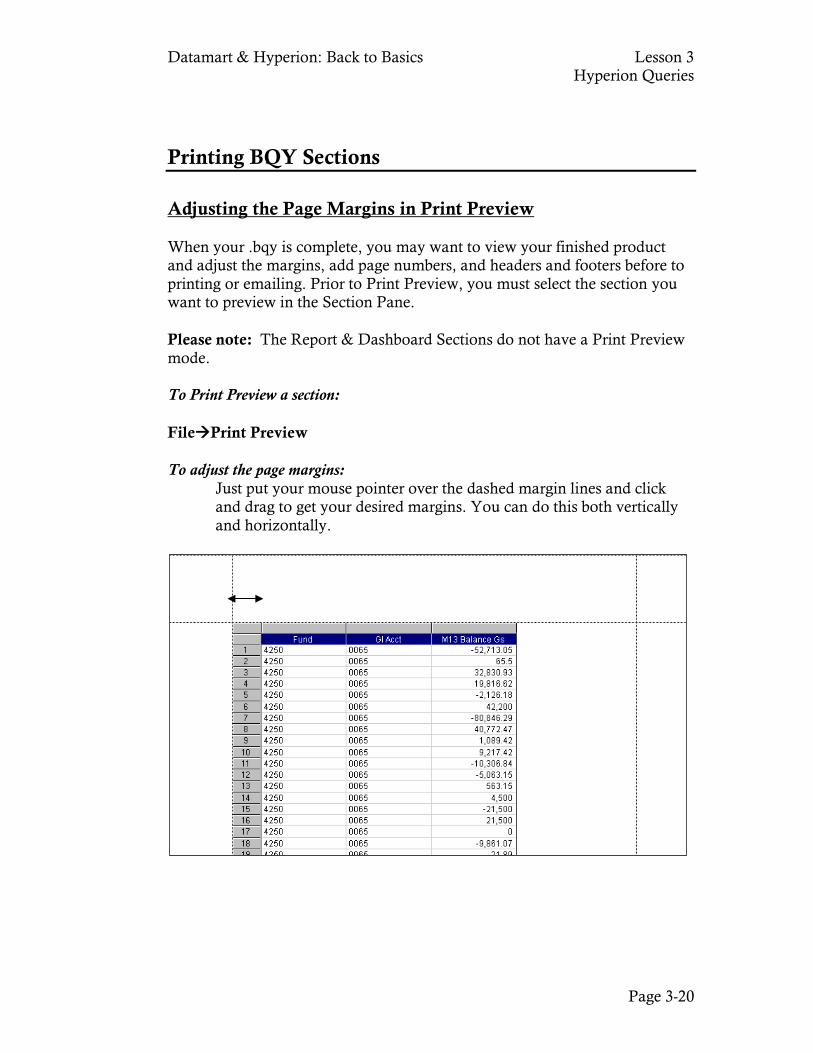
Printing BQY Sections Adjusting the Page Margins in Print Preview
When your .bqy is complete, you may want to view your finished product and adjust the margins, add page numbers, and headers and footers before to printing or emailing. Prior to Print Preview, you must select the section you want to preview in the Section Pane. Please note: The Report & Dashboard Sections do not have a Print Preview mode. To Print Preview a section: FilePrint Preview To adjust the page margins:
Just put your mouse pointer over the dashed margin lines and click and drag to get your desired margins. You can do this both vertically and horizontally.
Datamart & Hyperion: Back to Basics Lesson 3 Hyperion Queries
Page 3-21
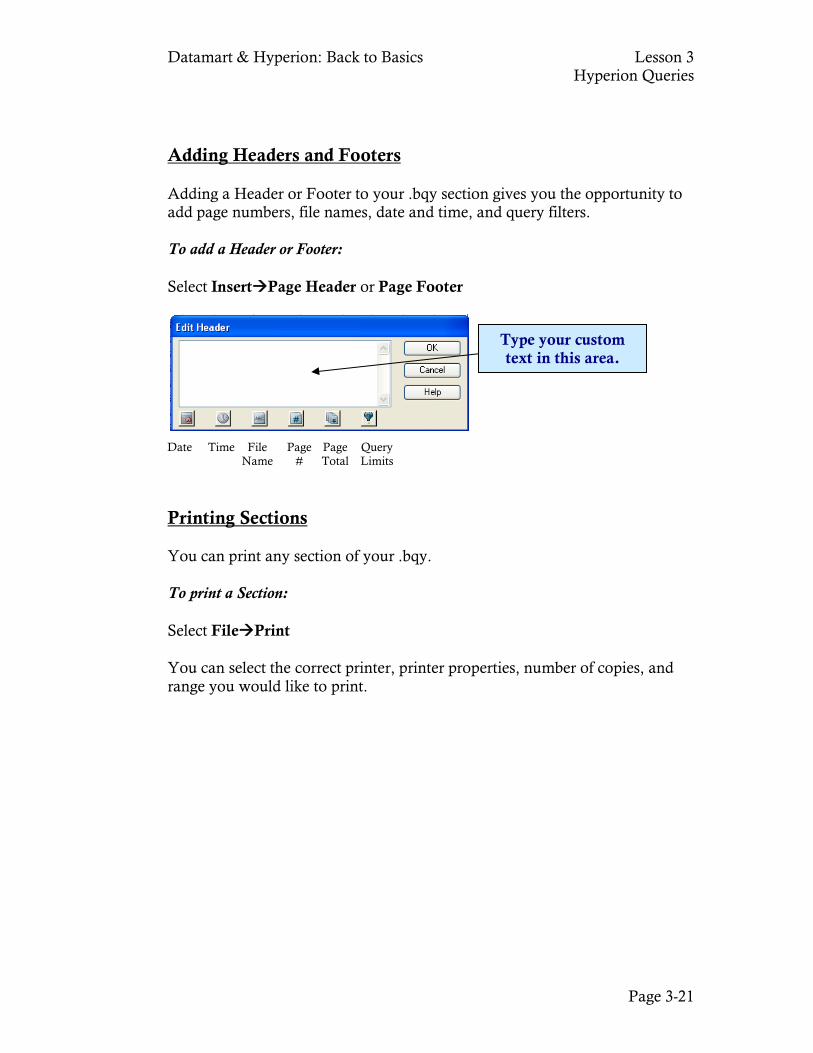
Adding Headers and Footers
Adding a Header or Footer to your .bqy section gives you the opportunity to add page numbers, file names, date and time, and query filters. To add a Header or Footer: Select InsertPage Header or Page Footer
Printing Sections
You can print any section of your .bqy. To print a Section: Select FilePrint You can select the correct printer, printer properties, number of copies, and range you would like to print.
Type your custom text in this area.
Date Time File Name
Page #
Page Total
Query Limits

Datamart & Hyperion: Back to Basics Lesson 3 Hyperion Queries
Page 3-22
Exercise Name the 6 sections you can create in a .bqy.
a. b. c. d. e. f.
1. Create a .bqy file using an oce that accesses SFMS data.
2. Expand the Table list on the Element Pane.
3. Bring the ‘GL Detail’ Table over to the Content Pane.
4. Sort the table fields alphabetically. (Hint: Right-click on the title of the table and select properties).
5. Add the following Items to the Request Line:
a. Agency b. GL Acct c. Fund d. Fiscal Year e. M13 Balance GL
6. Filter the following Items:
a. ‘Agency’ equal to ‘585’ b. ‘Fiscal Year’ equal to ‘2018’ c. ‘M13 Balance GL’ not equal to zero
Datamart & Hyperion: Back to Basics Lesson 3 Hyperion Queries
Page 3-23
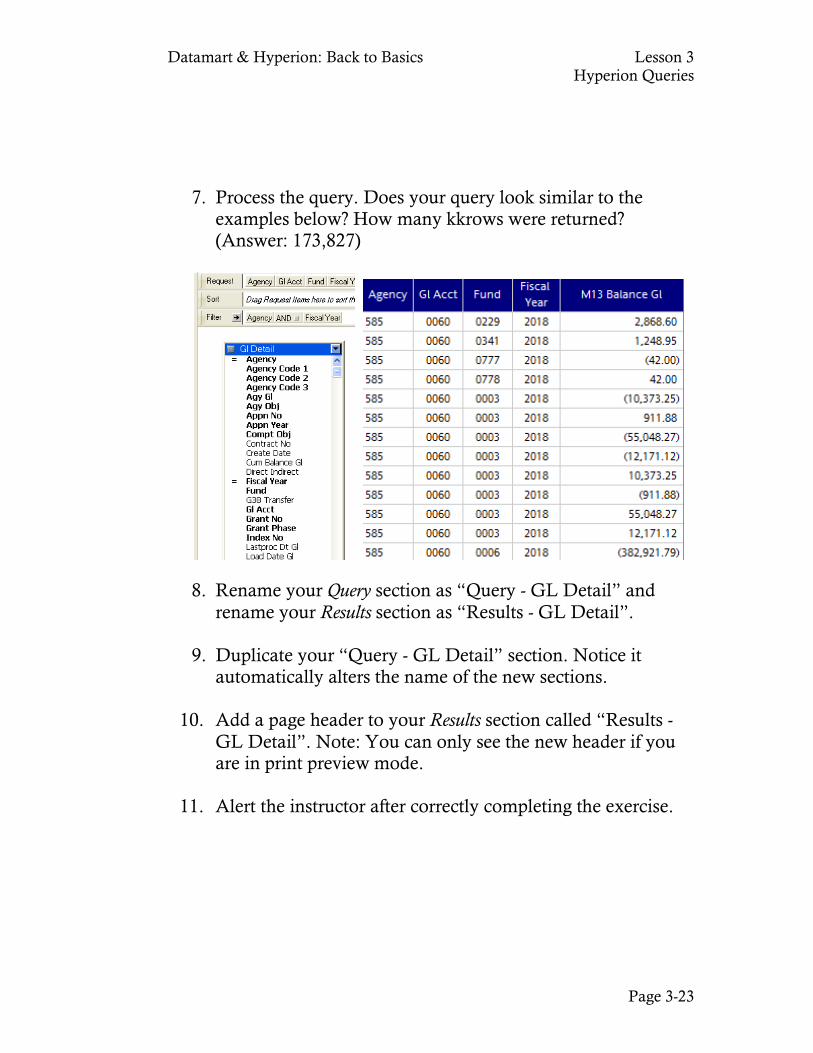
7. Process the query. Does your query look similar to the examples below? How many kkrows were returned? (Answer: 173,827)
8. Rename your Query section as “Query - GL Detail” and rename your Results section as “Results - GL Detail”.
9. Duplicate your “Query - GL Detail” section. Notice it
automatically alters the name of the new sections.
10. Add a page header to your Results section called “Results - GL Detail”. Note: You can only see the new header if you are in print preview mode.
11. Alert the instructor after correctly completing the exercise.

Lesson 4
Hyperion Query Building Processes
BQY Process Managing your Table
o What can I do to the Table Properties? Understanding Joins Building the Request Line Maximizing the Query Building Process
o Setting Restrictions on your Query Properties o Estimating the Size of your Query
Datamart & Hyperion: Back to Basics Lesson 4 Hyperion Query Building
Processes
Page 4-2
BQY Process BQY documents are files you create and use to retrieve information from a database, analyze the information, and build reports. Because Hyperion is an integrated query, analysis, and reporting tool, documents have multiple sections, each of which governs one part of the query and reporting process. You create sections progressively: first, query a database, then retrieve results, next add tables, pivots, and charts for additional analysis and last generate reports. Documents can contain data from any number of relational databases queries, multidimensional database queries, and/or from imported data. Documents usually include one or more of the following items: • A DataModel: This is a visual representation of the actual database tables.
Note: Using the ‘Sync with Database’ operation, within the ‘DataModel’ menu, can be very helpful to sync your query with the current database and make sure you have all fields available.
• A query or multiple queries for retrieving a subset of data from the database.
• Join options, including local joins between different data sets within a single document, local join filters, and optional join path generation.
• Results and table sections display data in a table-style format.
• Multidimensional pivots that permit drill-down analysis of data results.
• Charts that graphically display your query results and allow different angles of vision on the data.
• Reports presenting customized hierarchical views of your data. Most Hyperion documents have at least one Query and one Results section. From the Results section, you can create multiple Pivot, Chart, Table, and Report sections to analyze and present data.
Datamart & Hyperion: Back to Basics Lesson 4 Hyperion Query Building
Processes
Page 4-3
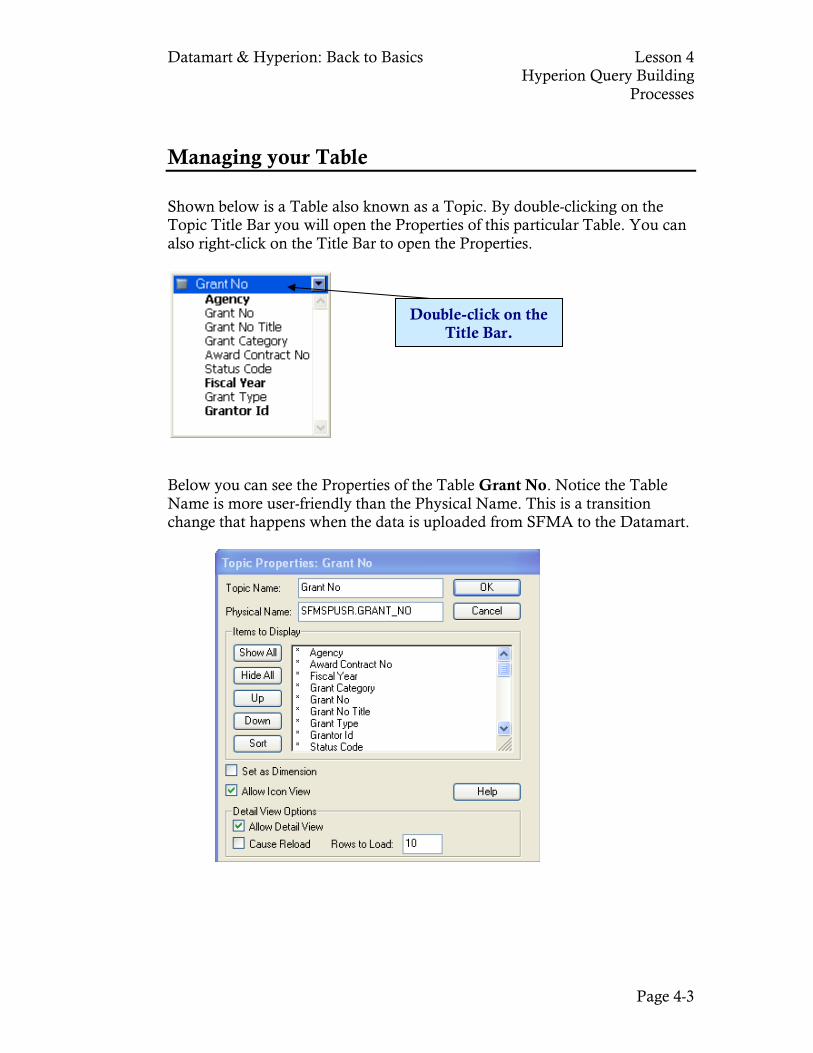
Managing your Table Shown below is a Table also known as a Topic. By double-clicking on the Topic Title Bar you will open the Properties of this particular Table. You can also right-click on the Title Bar to open the Properties.
Below you can see the Properties of the Table Grant No. Notice the Table Name is more user-friendly than the Physical Name. This is a transition change that happens when the data is uploaded from SFMA to the Datamart.
Double-click on the Title Bar.
Datamart & Hyperion: Back to Basics Lesson 4 Hyperion Query Building
Processes
Page 4-4
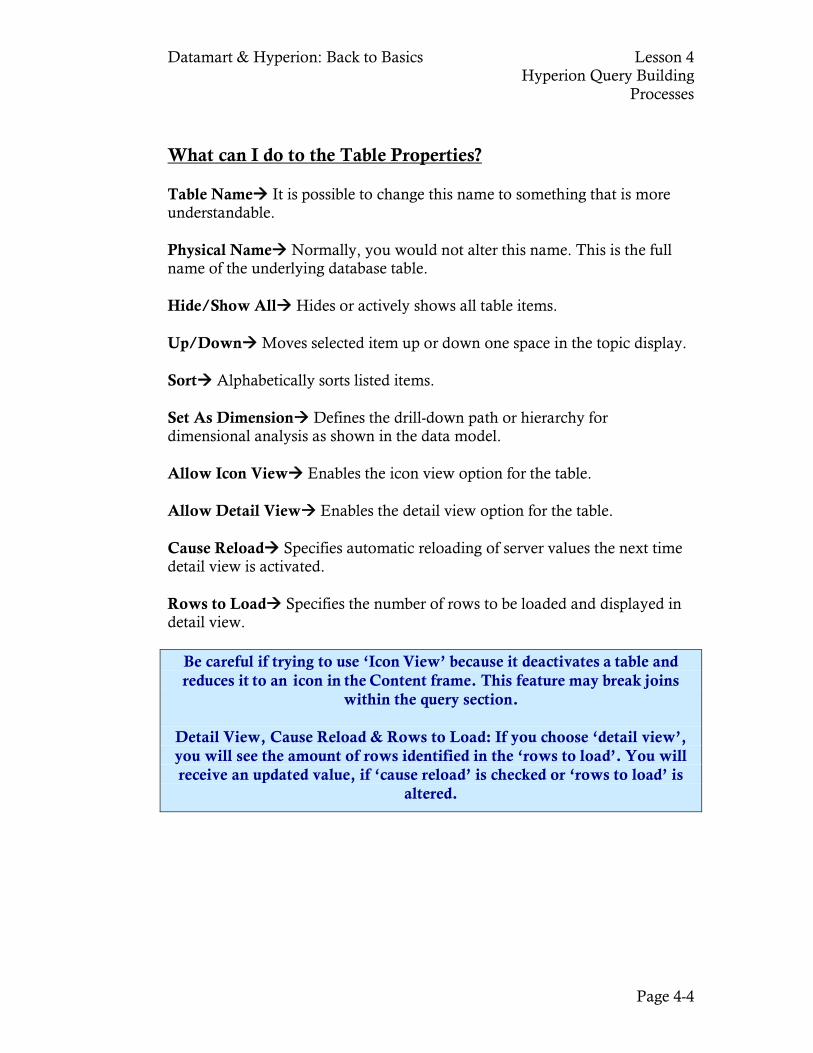
What can I do to the Table Properties? Table Name It is possible to change this name to something that is more understandable. Physical Name Normally, you would not alter this name. This is the full name of the underlying database table. Hide/Show All Hides or actively shows all table items. Up/Down Moves selected item up or down one space in the topic display. Sort Alphabetically sorts listed items. Set As Dimension Defines the drill-down path or hierarchy for dimensional analysis as shown in the data model. Allow Icon View Enables the icon view option for the table. Allow Detail View Enables the detail view option for the table. Cause Reload Specifies automatic reloading of server values the next time detail view is activated. Rows to Load Specifies the number of rows to be loaded and displayed in detail view.
Be careful if trying to use ‘Icon View’ because it deactivates a table and reduces it to an icon in the Content frame. This feature may break joins
within the query section.
Detail View, Cause Reload & Rows to Load: If you choose ‘detail view’, you will see the amount of rows identified in the ‘rows to load’. You will receive an updated value, if ‘cause reload’ is checked or ‘rows to load’ is
altered.
Datamart & Hyperion: Back to Basics Lesson 4 Hyperion Query Building
Processes
Page 4-5
Understanding Joins Tables in relational databases share information through a conceptual link, or join, between related columns in different tables. These relationships are displayed in the data model through visual join lines between fields. Joins enable you to connect or link records in two tables by way of a shared data field. Once a data field is shared, other data contained in the joined tables can be accessed. In this way, each record can share data with another record, however, it does not store or duplicate the same kind of information. Joins can be automatically created for you, or joined manually. Join types determine how data is retrieved from a database. To specify a join type:
1. Double click on a join line and a ‘join type’ window opens, displaying the various joins to select.
2. Select a join type and click OK. Four types of joins are supported:
• Simple join (=, >,<, >=, <=+): A simple (linear) join retrieves the records in both tables that have an identical data in the joined columns. Within the ‘join properties’ window, you can change the default join setting for simple joins by choosing an operator from the drop-down box. The default setting, Equal, is preferred.
• Left join (+=): A left join retrieves all rows from the fields on the left
and any rows from the fields on the right that have matching values in the join column.
• Right join (=+): A right join retrieves all rows from the field on the
right and any rows from the field on the left that have matching values in the join column.
• Outer join (+ = +): An outer join combines the impact of a left and right join. An outer join retrieves all rows from both tables matching joined column values, if found, or retrieves nulls for non-matching values. Every row represented in both topics is displayed at least once.
Note: Not all database servers support all join types.
Datamart & Hyperion: Back to Basics Lesson 4 Hyperion Query Building
Processes
Page 4-6
Building the Request Line As you build your query, you can reorder, remove, or hide items on the Request line. This allows you to change the way in which the query processes and displays. Reordering Request Items You can move requested fields to reorder them for viewing results. To reorder items on the Request line, select the item to be moved and
drag it to a new location on the Request line. Removing Request Items You can remove fields from the Request line to exclude the data from your query or results set. To remove a field from the Request line, select the desired item and
complete one of the following actions: • Click the ‘Remove’ button on the standard toolbar. • Right-click on a field and select ‘Remove’. • Press the Delete key.
If you have not yet processed the query, Interactive Reporting removes the item from the Request line; however, if you have previously processed the query, the Report Refresh dialog is displayed with this message: “The section XXXX (section) references the following removed column(s): XXXX (column name). Do you want to keep references to these columns or turn off auto-refresh or remove them with the query is next processed?” You can select to keep the references, or remove them. Caution! Remove fields with caution as a computed item or report may draw data from the item you delete. Hiding Request Items You can hide fields that are displayed on the Request line. This allows you to incorporate data in the results set without displaying it. Hidden request items cannot be referenced for computations. To hide a request item, complete one of the following actions:
• Select the item, right-click and select Hide. • Select the item, select the View menu, then Hide Request Items.
Datamart & Hyperion: Back to Basics Lesson 4 Hyperion Query Building
Processes
Page 4-7
To show a hidden request item: Complete one of the following actions:
• Click in a blank area of the Request line, then select Unhide. • Select the View menu, then select Unhide Request Items.
When you have identified the fields to include in the query, you can perform a number of other operations before processing the query. You can add filters to the filter line, as well as, add computed items to the Request line, or you can use a Request line fields to specify a sort order within the Sort line.
Datamart & Hyperion: Back to Basics Lesson 4 Hyperion Query Building
Processes
Page 4-8
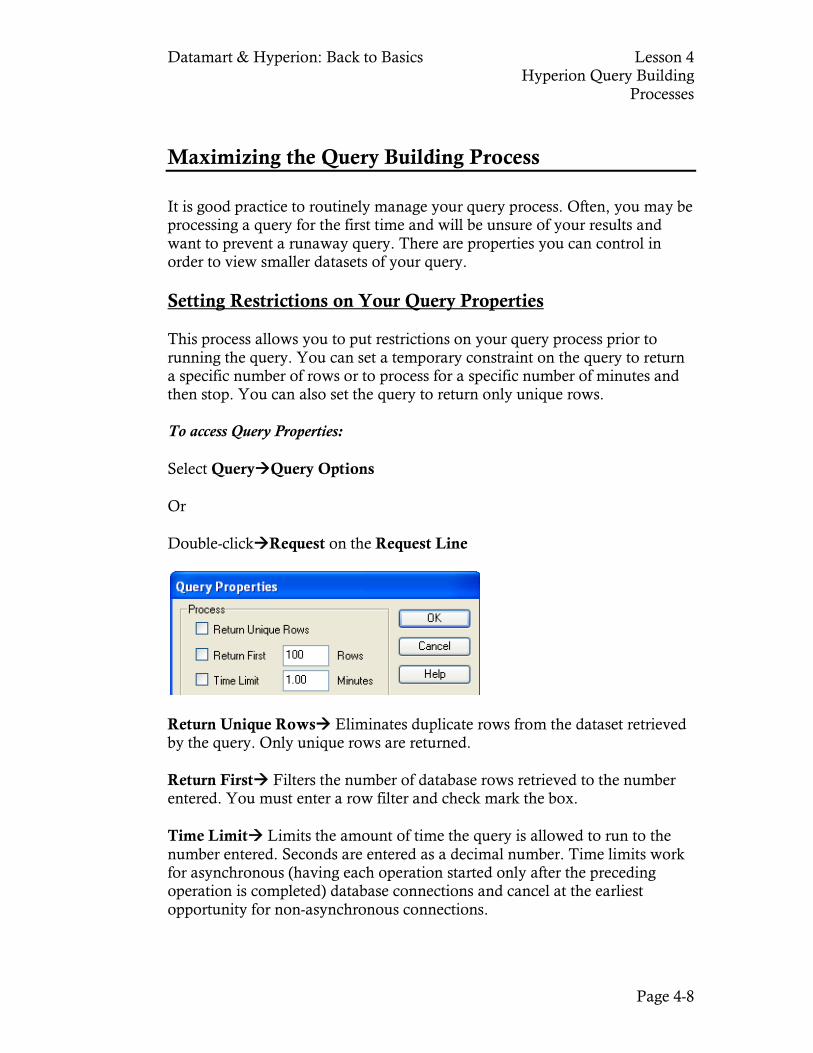
Maximizing the Query Building Process It is good practice to routinely manage your query process. Often, you may be processing a query for the first time and will be unsure of your results and want to prevent a runaway query. There are properties you can control in order to view smaller datasets of your query. Setting Restrictions on Your Query Properties This process allows you to put restrictions on your query process prior to running the query. You can set a temporary constraint on the query to return a specific number of rows or to process for a specific number of minutes and then stop. You can also set the query to return only unique rows. To access Query Properties: Select QueryQuery Options Or Double-clickRequest on the Request Line
Return Unique Rows Eliminates duplicate rows from the dataset retrieved by the query. Only unique rows are returned. Return First Filters the number of database rows retrieved to the number entered. You must enter a row filter and check mark the box. Time Limit Limits the amount of time the query is allowed to run to the number entered. Seconds are entered as a decimal number. Time limits work for asynchronous (having each operation started only after the preceding operation is completed) database connections and cancel at the earliest opportunity for non-asynchronous connections.
Datamart & Hyperion: Back to Basics Lesson 4 Hyperion Query Building
Processes
Page 4-9
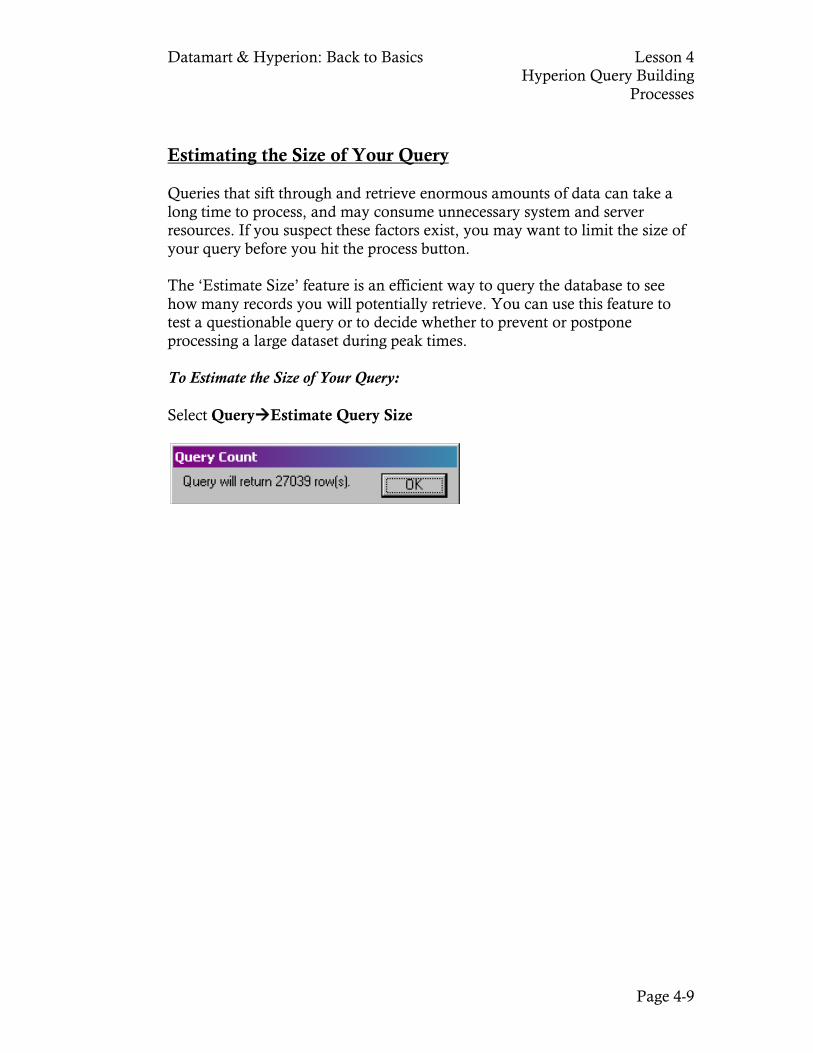
Estimating the Size of Your Query Queries that sift through and retrieve enormous amounts of data can take a long time to process, and may consume unnecessary system and server resources. If you suspect these factors exist, you may want to limit the size of your query before you hit the process button. The ‘Estimate Size’ feature is an efficient way to query the database to see how many records you will potentially retrieve. You can use this feature to test a questionable query or to decide whether to prevent or postpone processing a large dataset during peak times. To Estimate the Size of Your Query: Select QueryEstimate Query Size
Datamart & Hyperion: Back to Basics Lesson 4 Hyperion Query Building
Processes
Page 4-10
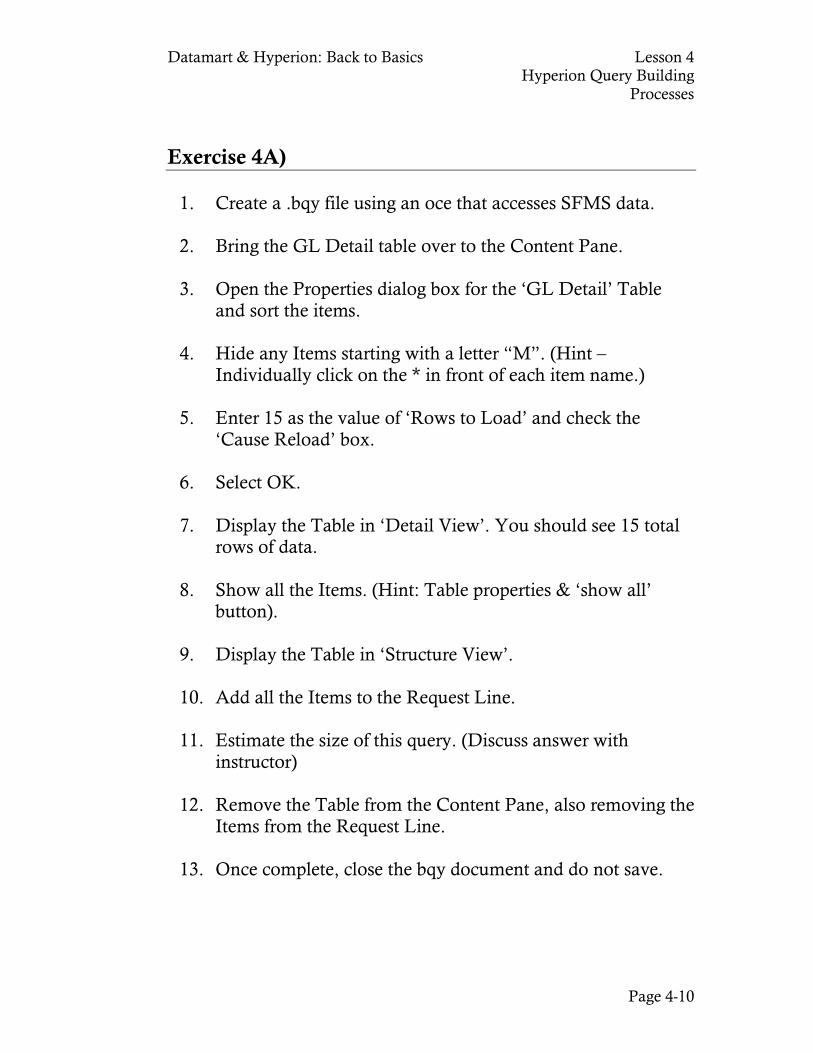
Exercise 4A)
1. Create a .bqy file using an oce that accesses SFMS data. 2. Bring the GL Detail table over to the Content Pane. 3. Open the Properties dialog box for the ‘GL Detail’ Table
and sort the items. 4. Hide any Items starting with a letter “M”. (Hint –
Individually click on the * in front of each item name.) 5. Enter 15 as the value of ‘Rows to Load’ and check the
‘Cause Reload’ box. 6. Select OK. 7. Display the Table in ‘Detail View’. You should see 15 total
rows of data. 8. Show all the Items. (Hint: Table properties & ‘show all’
button). 9. Display the Table in ‘Structure View’. 10. Add all the Items to the Request Line. 11. Estimate the size of this query. (Discuss answer with
instructor) 12. Remove the Table from the Content Pane, also removing the
Items from the Request Line. 13. Once complete, close the bqy document and do not save.
Datamart & Hyperion: Back to Basics Lesson 4 Hyperion Query Building
Processes
Page 4-11
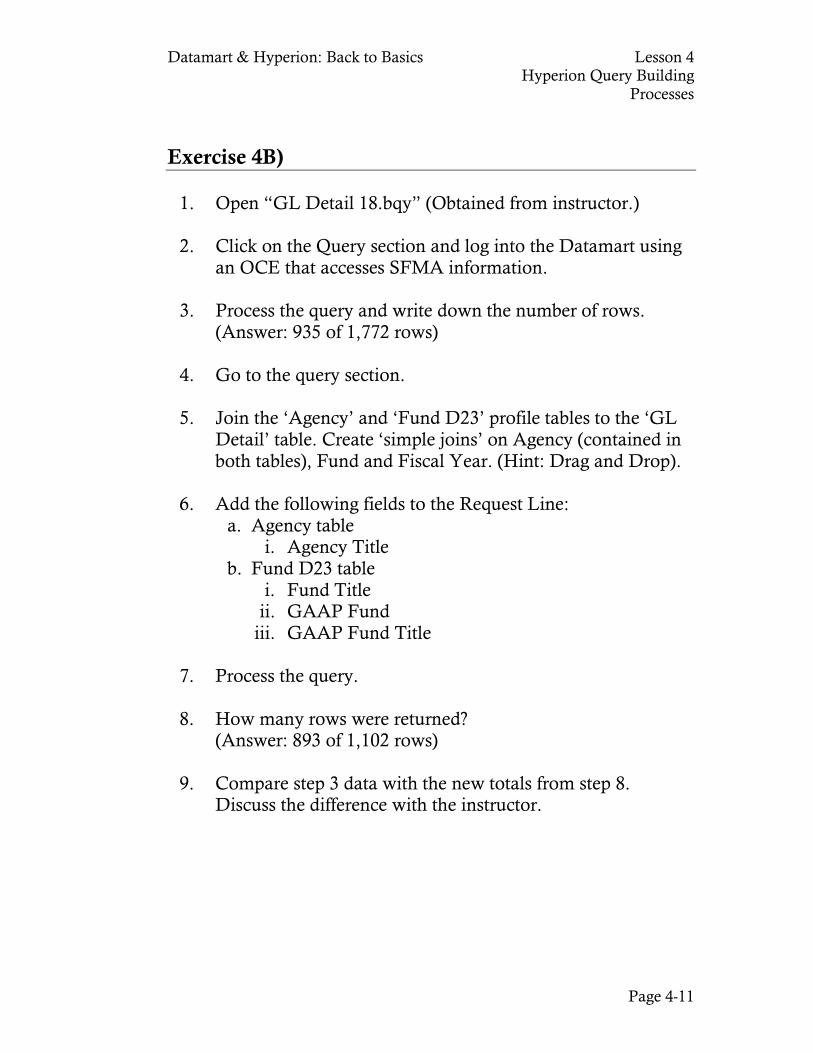
Exercise 4B)
1. Open “GL Detail 18.bqy” (Obtained from instructor.) 2. Click on the Query section and log into the Datamart using
an OCE that accesses SFMA information.
3. Process the query and write down the number of rows. (Answer: 935 of 1,772 rows)
4. Go to the query section. 5. Join the ‘Agency’ and ‘Fund D23’ profile tables to the ‘GL
Detail’ table. Create ‘simple joins’ on Agency (contained in both tables), Fund and Fiscal Year. (Hint: Drag and Drop).
6. Add the following fields to the Request Line:
a. Agency table i. Agency Title
b. Fund D23 table i. Fund Title
ii. GAAP Fund iii. GAAP Fund Title
7. Process the query. 8. How many rows were returned?
(Answer: 893 of 1,102 rows) 9. Compare step 3 data with the new totals from step 8.
Discuss the difference with the instructor.

Lesson 5
Filters and Sorts
Filtering Queries o Setting Filters o Creating Custom Values List
Modifying Filters o Ignoring Filters o Removing Filters o Filter Line Logic and Order of Operations
Variable Filters o Customizing Variable Filters Dialog Box
Sorting Data Data Functions on the Requested Items
Datamart & Hyperion: Back to Basics Lesson 5 Filters and Sorts
Page 5-2
Filtering Queries For most queries it is necessary to set a filter on the amount of data to be returned. The Datamart contains massive amounts of data, and you want to avoid requesting unnecessary information. Before processing a query, set the appropriate filters in the Query Section.
In the Query Section, you can:
Manually specify filter values Query the Datamart for filter values Create custom lists of filter values
Define compound filter formulas on the Filter Line Set filters as variables to prompt the user to select certain values
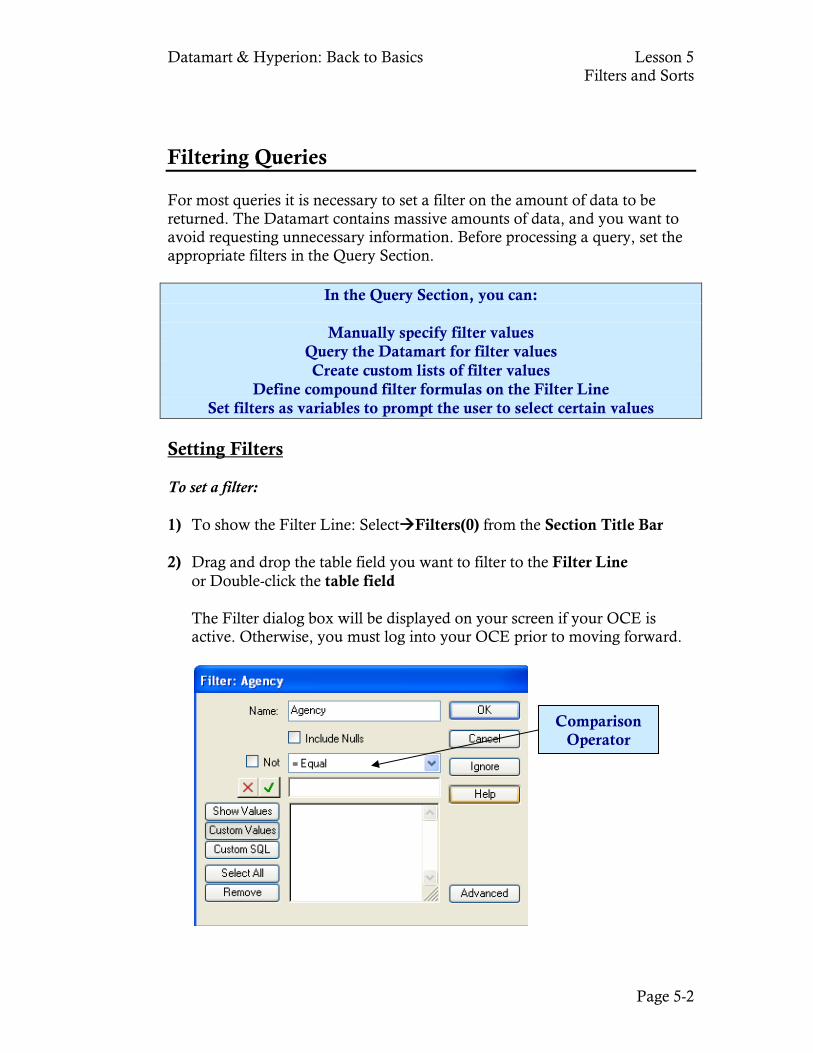
Setting Filters To set a filter: 1) To show the Filter Line: SelectFilters(0) from the Section Title Bar 2) Drag and drop the table field you want to filter to the Filter Line
or Double-click the table field
The Filter dialog box will be displayed on your screen if your OCE is active. Otherwise, you must log into your OCE prior to moving forward.
Comparison Operator
Datamart & Hyperion: Back to Basics Lesson 5 Filters and Sorts
Page 5-3
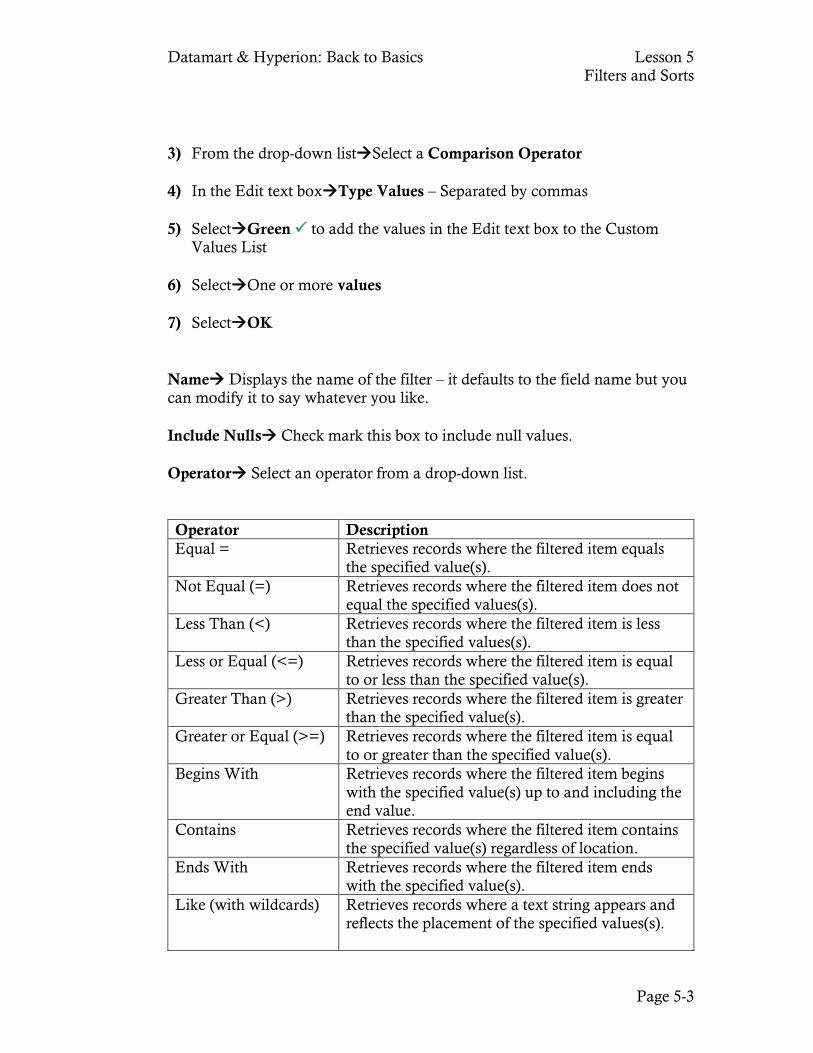
3) From the drop-down listSelect a Comparison Operator
4) In the Edit text boxType Values – Separated by commas
5) SelectGreen to add the values in the Edit text box to the Custom Values List 6) SelectOne or more values 7) SelectOK Name Displays the name of the filter – it defaults to the field name but you can modify it to say whatever you like. Include Nulls Check mark this box to include null values. Operator Select an operator from a drop-down list. Operator Description Equal = Retrieves records where the filtered item equals
the specified value(s). Not Equal (=) Retrieves records where the filtered item does not
equal the specified values(s). Less Than (<) Retrieves records where the filtered item is less
than the specified values(s). Less or Equal (<=) Retrieves records where the filtered item is equal
to or less than the specified value(s). Greater Than (>) Retrieves records where the filtered item is greater
than the specified value(s). Greater or Equal (>=) Retrieves records where the filtered item is equal
to or greater than the specified value(s). Begins With Retrieves records where the filtered item begins
with the specified value(s) up to and including the end value.
Contains Retrieves records where the filtered item contains the specified value(s) regardless of location.
Ends With Retrieves records where the filtered item ends with the specified value(s).
Like (with wildcards) Retrieves records where a text string appears and reflects the placement of the specified values(s).
Datamart & Hyperion: Back to Basics Lesson 5 Filters and Sorts
Page 5-4
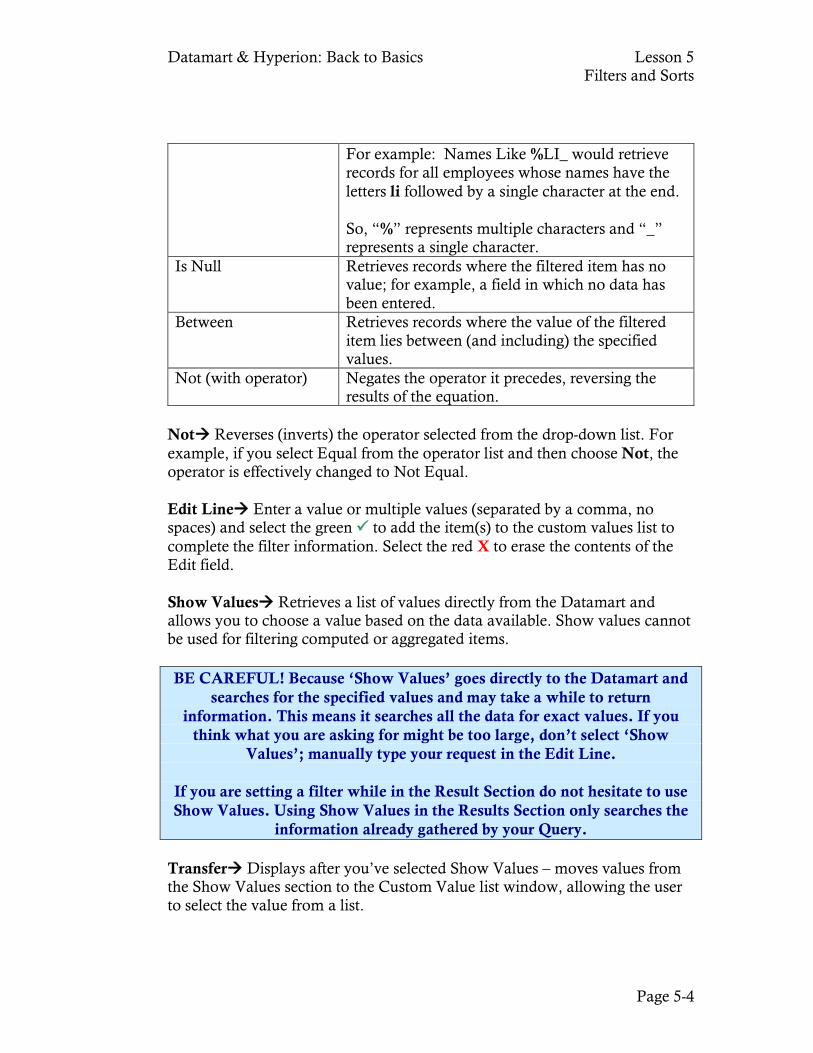
For example: Names Like %LI_ would retrieve records for all employees whose names have the letters li followed by a single character at the end. So, “%” represents multiple characters and “_” represents a single character.
Is Null Retrieves records where the filtered item has no value; for example, a field in which no data has been entered.
Between Retrieves records where the value of the filtered item lies between (and including) the specified values.
Not (with operator) Negates the operator it precedes, reversing the results of the equation.
Not Reverses (inverts) the operator selected from the drop-down list. For example, if you select Equal from the operator list and then choose Not, the operator is effectively changed to Not Equal. Edit Line Enter a value or multiple values (separated by a comma, no spaces) and select the green to add the item(s) to the custom values list to complete the filter information. Select the red X to erase the contents of the Edit field. Show Values Retrieves a list of values directly from the Datamart and allows you to choose a value based on the data available. Show values cannot be used for filtering computed or aggregated items. BE CAREFUL! Because ‘Show Values’ goes directly to the Datamart and
searches for the specified values and may take a while to return information. This means it searches all the data for exact values. If you
think what you are asking for might be too large, don’t select ‘Show Values’; manually type your request in the Edit Line.
If you are setting a filter while in the Result Section do not hesitate to use Show Values. Using Show Values in the Results Section only searches the
information already gathered by your Query. Transfer Displays after you’ve selected Show Values – moves values from the Show Values section to the Custom Value list window, allowing the user to select the value from a list.
Datamart & Hyperion: Back to Basics Lesson 5 Filters and Sorts
Page 5-5
Custom Values This is the default value when you set a filter. One reason to use custom lists with .bqy documents is many data items rarely change, if at all. For example, a Gender item has three consistent values (male, female, and unknown). An Agency item has many more values, but may only change every year or so. Data that changes rarely is said to have low cardinality. Under such circumstances, it makes sense for users to select from a custom values list, rather than continuously querying to show Datamart values. Custom SQL Displays the custom SQL dialog box for coding filters directly in SQL. The Custom SQL button appears only if you access the filter dialog box from the Query section. Select All Selects all values displayed in the displayed value area. Remove Removes highlighted values from the custom list or a filter. Ignore Temporarily suspends a filter without deleting it. Advanced Displays loaded value settings and subquery options. Loaded Values Settings Toggles a custom values list to be read from a file or from the Datamart. Change File allows you to specify the file name. If you read values from a text file, vertical tabs or paragraph markers must delimit each value. Use Show Values to display the file contents.
Datamart & Hyperion: Back to Basics Lesson 5 Filters and Sorts
Page 5-6
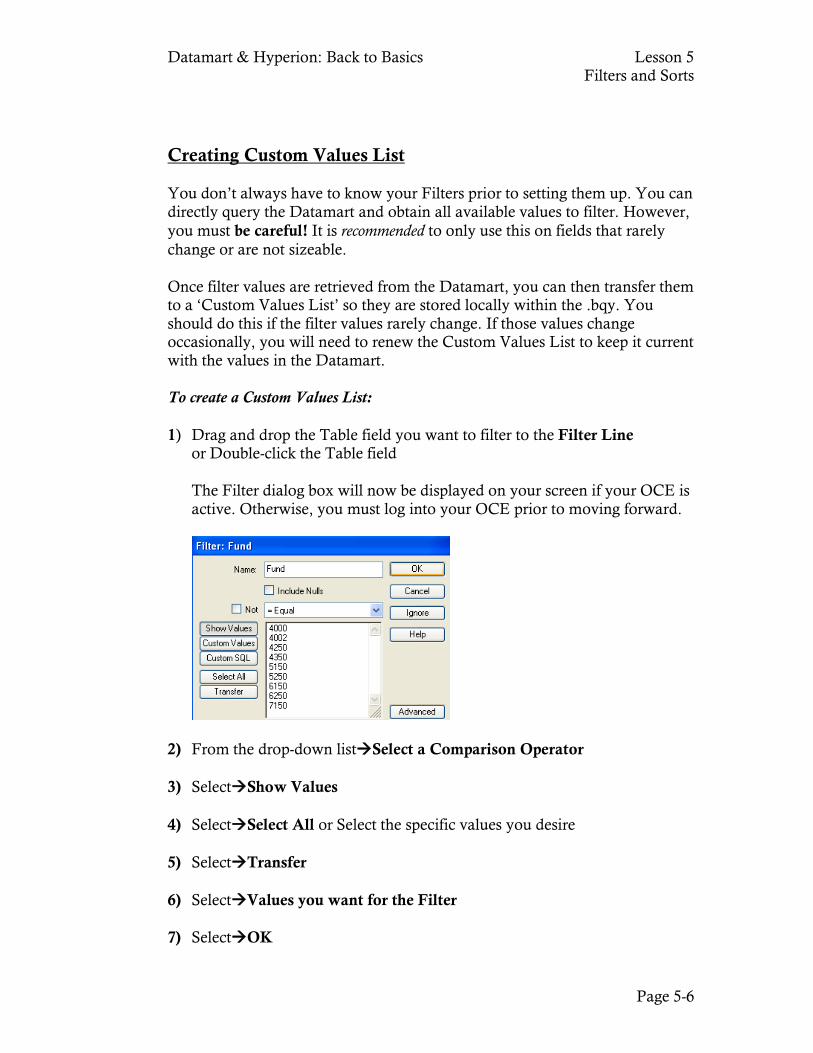
Creating Custom Values List You don’t always have to know your Filters prior to setting them up. You can directly query the Datamart and obtain all available values to filter. However, you must be careful! It is recommended to only use this on fields that rarely change or are not sizeable. Once filter values are retrieved from the Datamart, you can then transfer them to a ‘Custom Values List’ so they are stored locally within the .bqy. You should do this if the filter values rarely change. If those values change occasionally, you will need to renew the Custom Values List to keep it current with the values in the Datamart. To create a Custom Values List: 1) Drag and drop the Table field you want to filter to the Filter Line or Double-click the Table field
The Filter dialog box will now be displayed on your screen if your OCE is active. Otherwise, you must log into your OCE prior to moving forward.
2) From the drop-down listSelect a Comparison Operator 3) SelectShow Values 4) SelectSelect All or Select the specific values you desire 5) SelectTransfer 6) SelectValues you want for the Filter 7) SelectOK
Datamart & Hyperion: Back to Basics Lesson 5 Filters and Sorts
Page 5-7
Modifying Filters A Filter can always be modified. You can change the values and settings permanently, temporarily ignore it, or delete it. To modify a Filter Item: 1) In the Query SectionDouble-click the Filter Item 2) Make your changes to the Filter dialog box
Operator Type and select new values Show Values and select from a new values list Add or remove values from the Custom Values List
3) SelectOK Ignoring Filters You can temporarily ignore a filter without deleting it. To ignore a Filter Item: 1) In the Query SectionDouble-click the Filter Item 2) SelectIgnore Removing Filters You can permanently remove a Filter Item. To remove a Filter Item: Select the FilterRight-clickSelect Remove
Datamart & Hyperion: Back to Basics Lesson 5 Filters and Sorts
Page 5-8
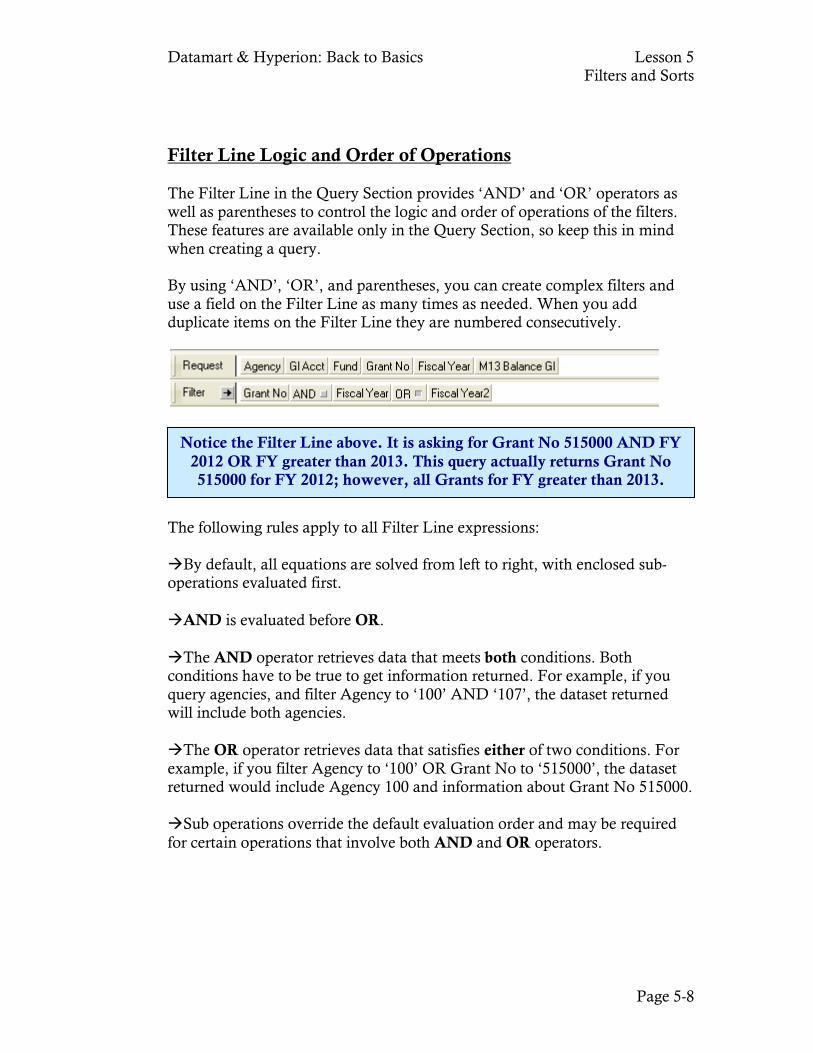
Filter Line Logic and Order of Operations The Filter Line in the Query Section provides ‘AND’ and ‘OR’ operators as well as parentheses to control the logic and order of operations of the filters. These features are available only in the Query Section, so keep this in mind when creating a query. By using ‘AND’, ‘OR’, and parentheses, you can create complex filters and use a field on the Filter Line as many times as needed. When you add duplicate items on the Filter Line they are numbered consecutively.
The following rules apply to all Filter Line expressions: By default, all equations are solved from left to right, with enclosed sub-operations evaluated first. AND is evaluated before OR. The AND operator retrieves data that meets both conditions. Both conditions have to be true to get information returned. For example, if you query agencies, and filter Agency to ‘100’ AND ‘107’, the dataset returned will include both agencies. The OR operator retrieves data that satisfies either of two conditions. For example, if you filter Agency to ‘100’ OR Grant No to ‘515000’, the dataset returned would include Agency 100 and information about Grant No 515000. Sub operations override the default evaluation order and may be required for certain operations that involve both AND and OR operators.
Notice the Filter Line above. It is asking for Grant No 515000 AND FY 2012 OR FY greater than 2013. This query actually returns Grant No 515000 for FY 2012; however, all Grants for FY greater than 2013.
Datamart & Hyperion: Back to Basics Lesson 5 Filters and Sorts
Page 5-9
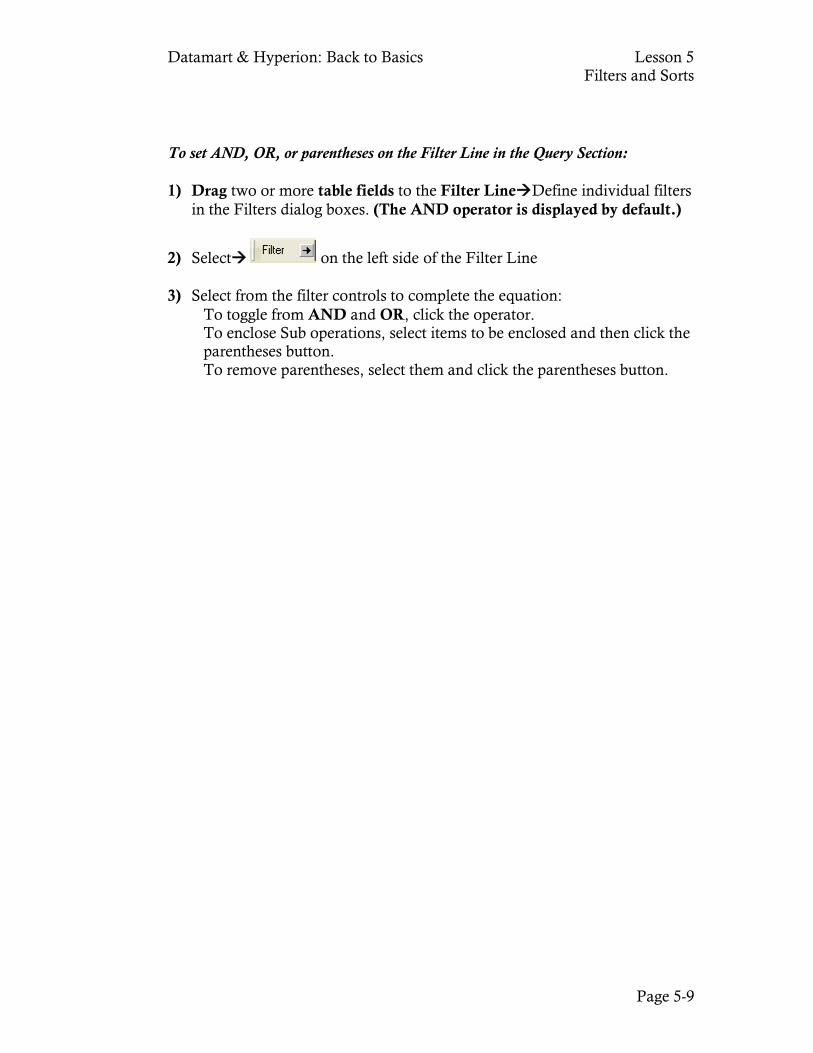
To set AND, OR, or parentheses on the Filter Line in the Query Section: 1) Drag two or more table fields to the Filter LineDefine individual filters
in the Filters dialog boxes. (The AND operator is displayed by default.)
2) Select on the left side of the Filter Line 3) Select from the filter controls to complete the equation:
To toggle from AND and OR, click the operator. To enclose Sub operations, select items to be enclosed and then click the parentheses button.
To remove parentheses, select them and click the parentheses button.
Datamart & Hyperion: Back to Basics Lesson 5 Filters and Sorts
Page 5-10
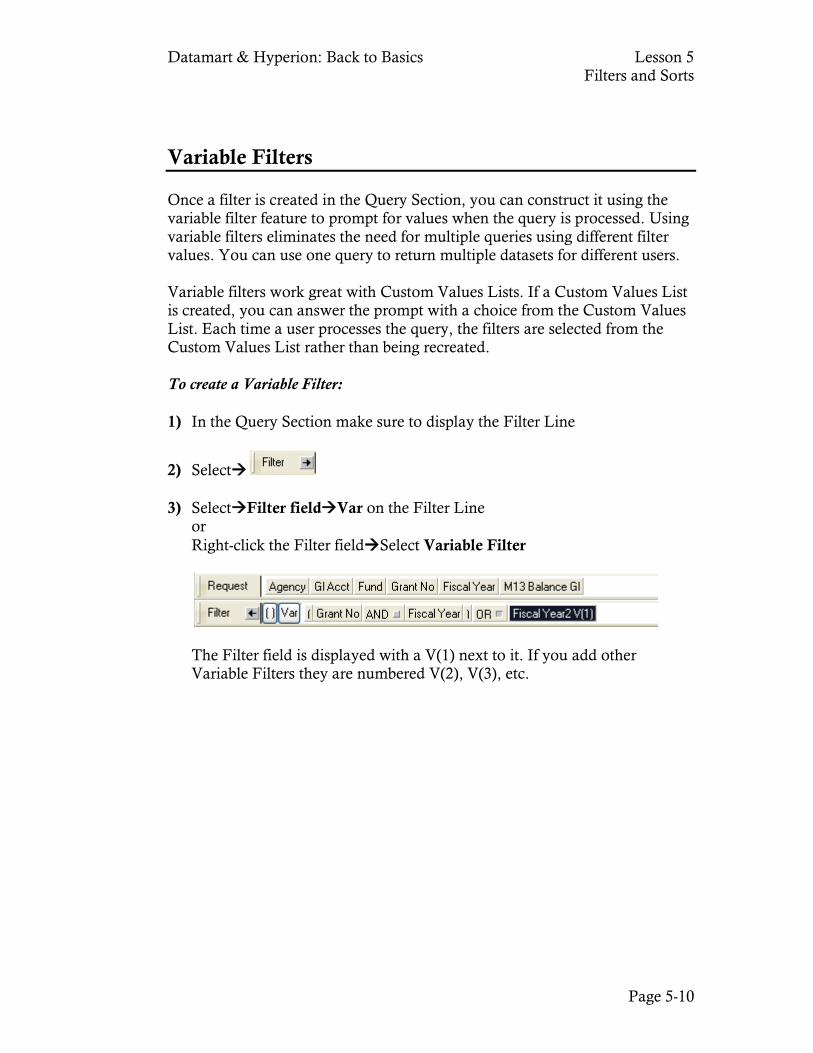
Variable Filters Once a filter is created in the Query Section, you can construct it using the variable filter feature to prompt for values when the query is processed. Using variable filters eliminates the need for multiple queries using different filter values. You can use one query to return multiple datasets for different users. Variable filters work great with Custom Values Lists. If a Custom Values List is created, you can answer the prompt with a choice from the Custom Values List. Each time a user processes the query, the filters are selected from the Custom Values List rather than being recreated. To create a Variable Filter: 1) In the Query Section make sure to display the Filter Line
2) Select 3) SelectFilter fieldVar on the Filter Line or Right-click the Filter fieldSelect Variable Filter
The Filter field is displayed with a V(1) next to it. If you add other Variable Filters they are numbered V(2), V(3), etc.
Datamart & Hyperion: Back to Basics Lesson 5 Filters and Sorts
Page 5-11
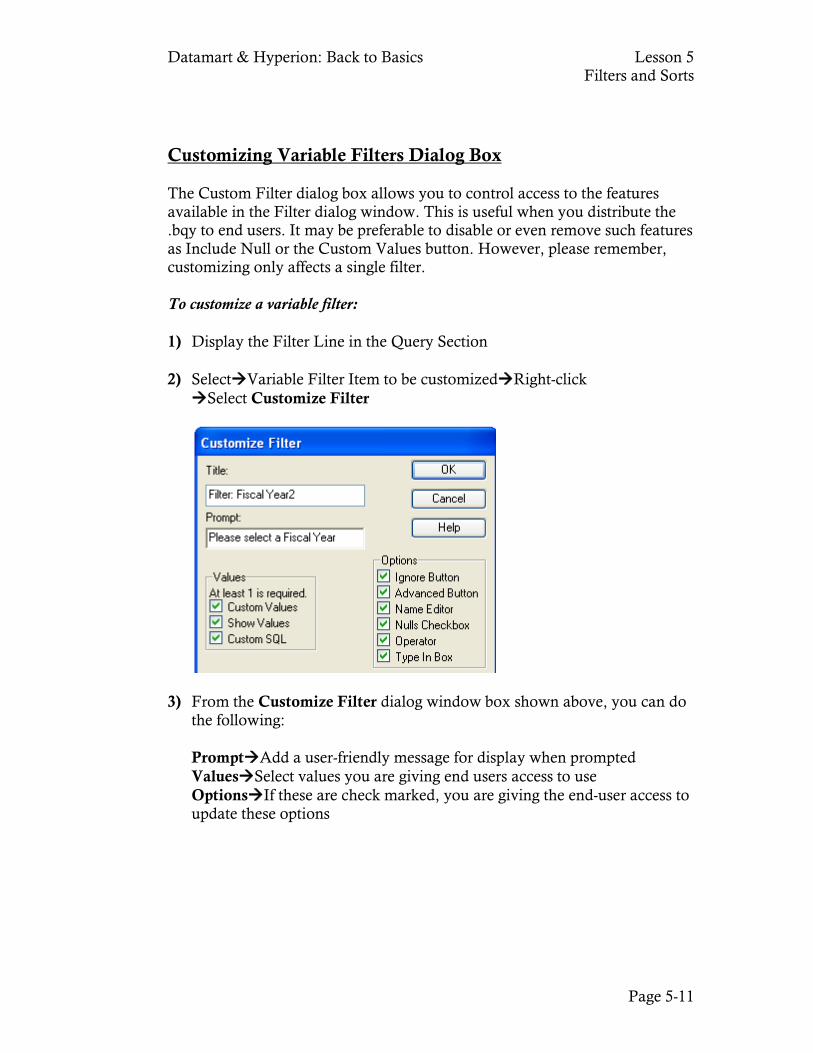
Customizing Variable Filters Dialog Box The Custom Filter dialog box allows you to control access to the features available in the Filter dialog window. This is useful when you distribute the .bqy to end users. It may be preferable to disable or even remove such features as Include Null or the Custom Values button. However, please remember, customizing only affects a single filter. To customize a variable filter: 1) Display the Filter Line in the Query Section 2) SelectVariable Filter Item to be customizedRight-click Select Customize Filter
3) From the Customize Filter dialog window box shown above, you can do
the following: PromptAdd a user-friendly message for display when prompted ValuesSelect values you are giving end users access to use OptionsIf these are check marked, you are giving the end-user access to
update these options
Datamart & Hyperion: Back to Basics Lesson 5 Filters and Sorts
Page 5-12
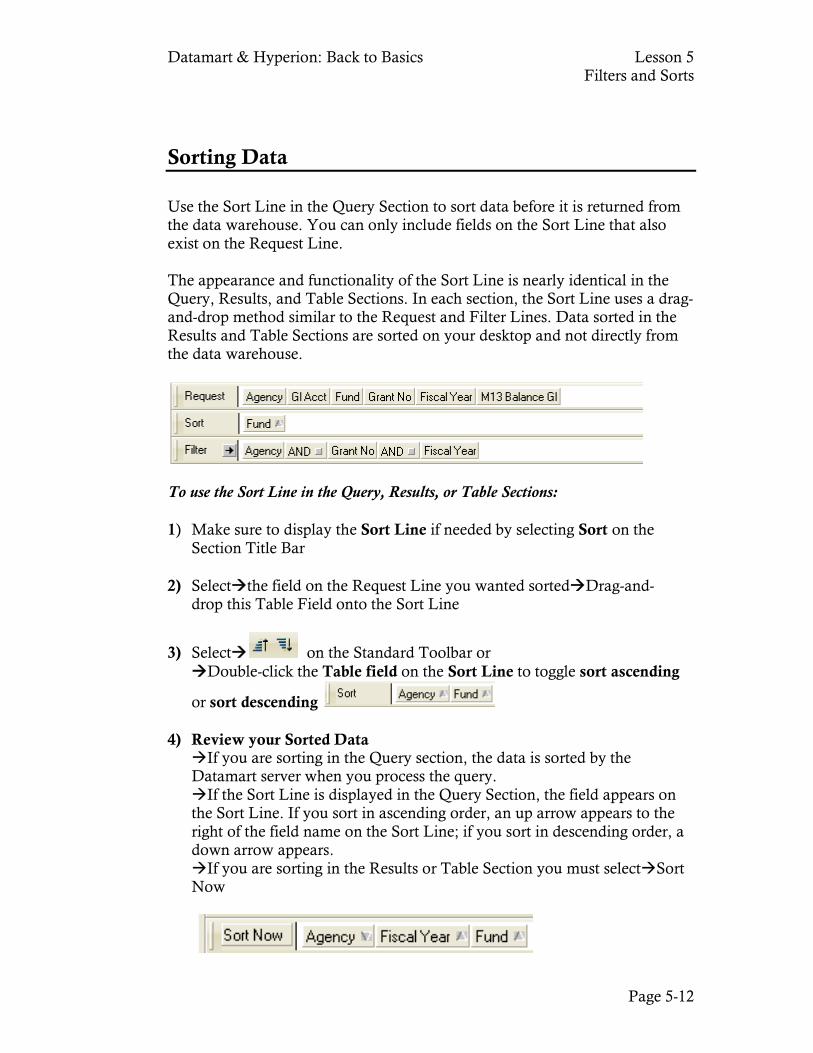
Sorting Data Use the Sort Line in the Query Section to sort data before it is returned from the data warehouse. You can only include fields on the Sort Line that also exist on the Request Line. The appearance and functionality of the Sort Line is nearly identical in the Query, Results, and Table Sections. In each section, the Sort Line uses a drag-and-drop method similar to the Request and Filter Lines. Data sorted in the Results and Table Sections are sorted on your desktop and not directly from the data warehouse.
To use the Sort Line in the Query, Results, or Table Sections: 1) Make sure to display the Sort Line if needed by selecting Sort on the Section Title Bar 2) Selectthe field on the Request Line you wanted sortedDrag-and- drop this Table Field onto the Sort Line
3) Select on the Standard Toolbar or Double-click the Table field on the Sort Line to toggle sort ascending
or sort descending 4) Review your Sorted Data If you are sorting in the Query section, the data is sorted by the Datamart server when you process the query. If the Sort Line is displayed in the Query Section, the field appears on the Sort Line. If you sort in ascending order, an up arrow appears to the right of the field name on the Sort Line; if you sort in descending order, a down arrow appears. If you are sorting in the Results or Table Section you must selectSort Now
Datamart & Hyperion: Back to Basics Lesson 5 Filters and Sorts
Page 5-13
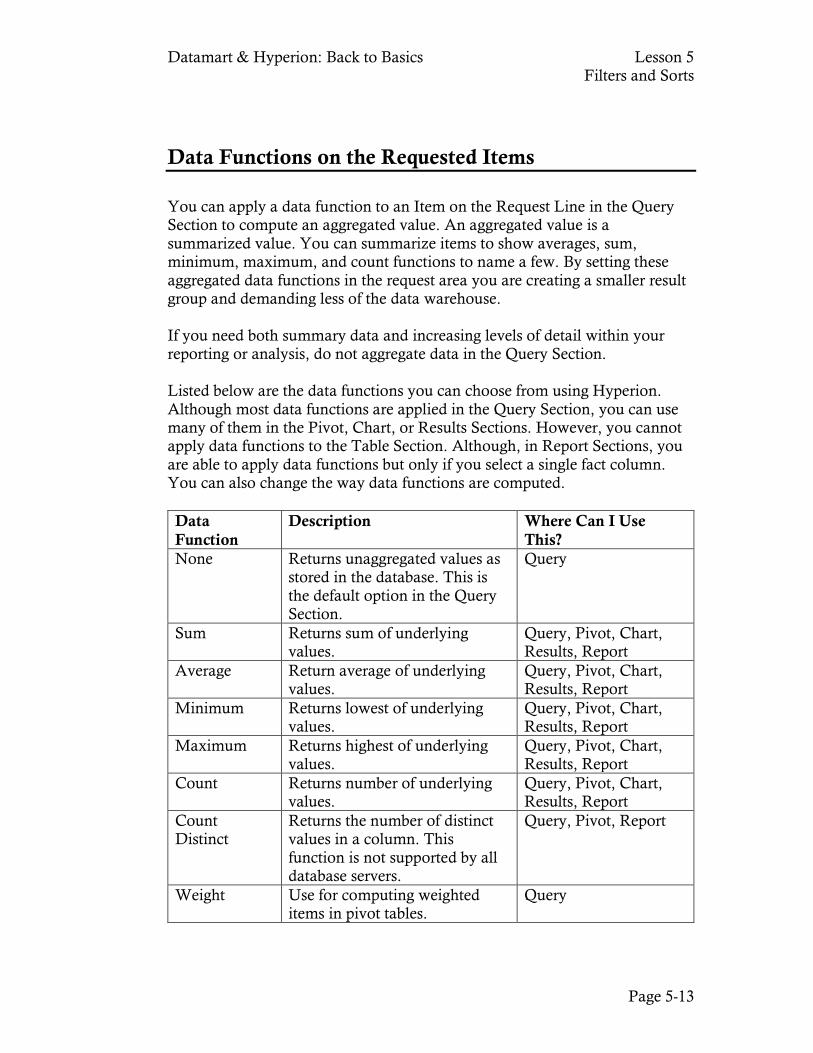
Data Functions on the Requested Items You can apply a data function to an Item on the Request Line in the Query Section to compute an aggregated value. An aggregated value is a summarized value. You can summarize items to show averages, sum, minimum, maximum, and count functions to name a few. By setting these aggregated data functions in the request area you are creating a smaller result group and demanding less of the data warehouse. If you need both summary data and increasing levels of detail within your reporting or analysis, do not aggregate data in the Query Section. Listed below are the data functions you can choose from using Hyperion. Although most data functions are applied in the Query Section, you can use many of them in the Pivot, Chart, or Results Sections. However, you cannot apply data functions to the Table Section. Although, in Report Sections, you are able to apply data functions but only if you select a single fact column. You can also change the way data functions are computed. Data Function
Description Where Can I Use This?
None Returns unaggregated values as stored in the database. This is the default option in the Query Section.
Query
Sum Returns sum of underlying values.
Query, Pivot, Chart, Results, Report
Average Return average of underlying values.
Query, Pivot, Chart, Results, Report
Minimum Returns lowest of underlying values.
Query, Pivot, Chart, Results, Report
Maximum Returns highest of underlying values.
Query, Pivot, Chart, Results, Report
Count Returns number of underlying values.
Query, Pivot, Chart, Results, Report
Count Distinct
Returns the number of distinct values in a column. This function is not supported by all database servers.
Query, Pivot, Report
Weight Use for computing weighted items in pivot tables.
Query
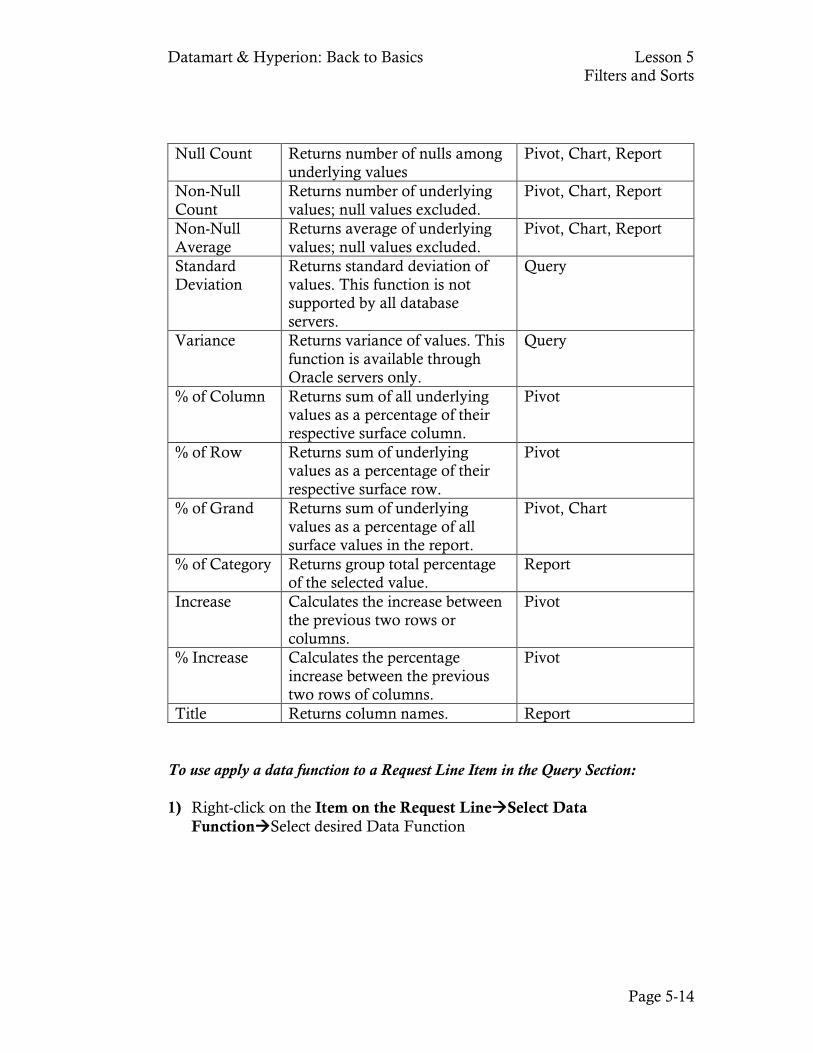
Datamart & Hyperion: Back to Basics Lesson 5 Filters and Sorts
Page 5-14
Null Count Returns number of nulls among underlying values
Pivot, Chart, Report
Non-Null Count
Returns number of underlying values; null values excluded.
Pivot, Chart, Report
Non-Null Average
Returns average of underlying values; null values excluded.
Pivot, Chart, Report
Standard Deviation
Returns standard deviation of values. This function is not supported by all database servers.
Query
Variance Returns variance of values. This function is available through Oracle servers only.
Query
% of Column Returns sum of all underlying values as a percentage of their respective surface column.
Pivot
% of Row Returns sum of underlying values as a percentage of their respective surface row.
Pivot
% of Grand Returns sum of underlying values as a percentage of all surface values in the report.
Pivot, Chart
% of Category Returns group total percentage of the selected value.
Report
Increase Calculates the increase between the previous two rows or columns.
Pivot
% Increase Calculates the percentage increase between the previous two rows of columns.
Pivot
Title Returns column names. Report To use apply a data function to a Request Line Item in the Query Section: 1) Right-click on the Item on the Request LineSelect Data
FunctionSelect desired Data Function
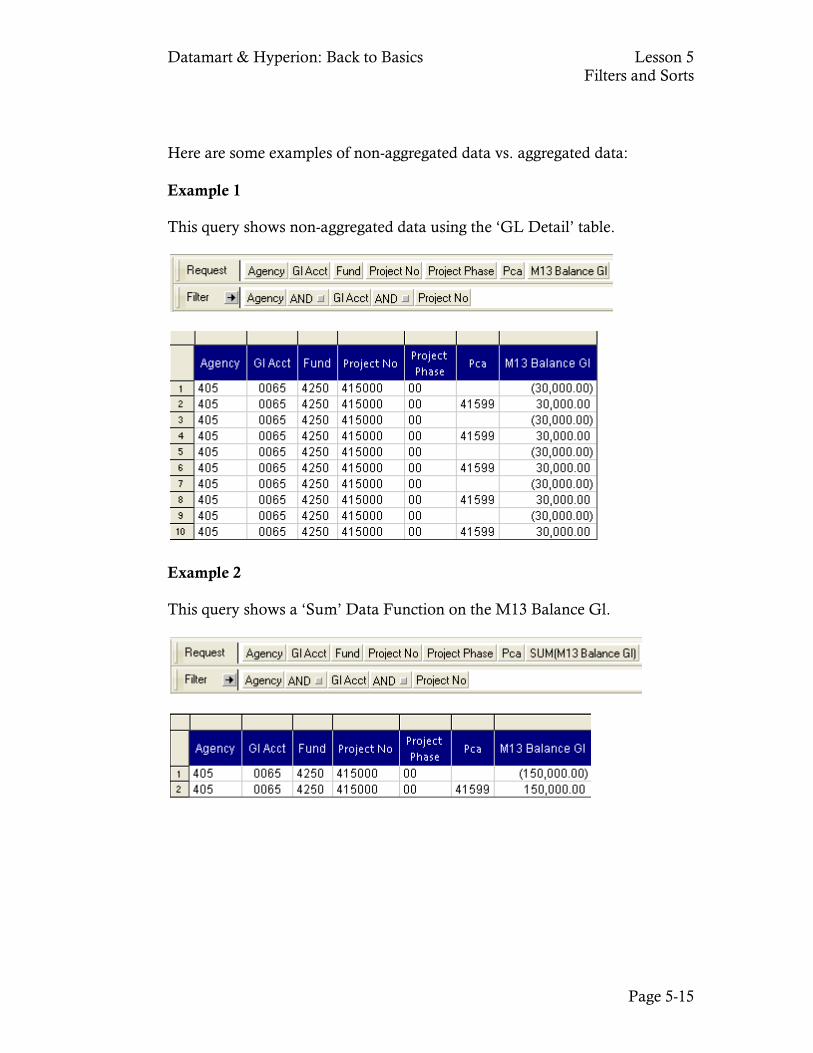
Datamart & Hyperion: Back to Basics Lesson 5 Filters and Sorts
Page 5-15
Here are some examples of non-aggregated data vs. aggregated data: Example 1 This query shows non-aggregated data using the ‘GL Detail’ table.
Example 2 This query shows a ‘Sum’ Data Function on the M13 Balance Gl.
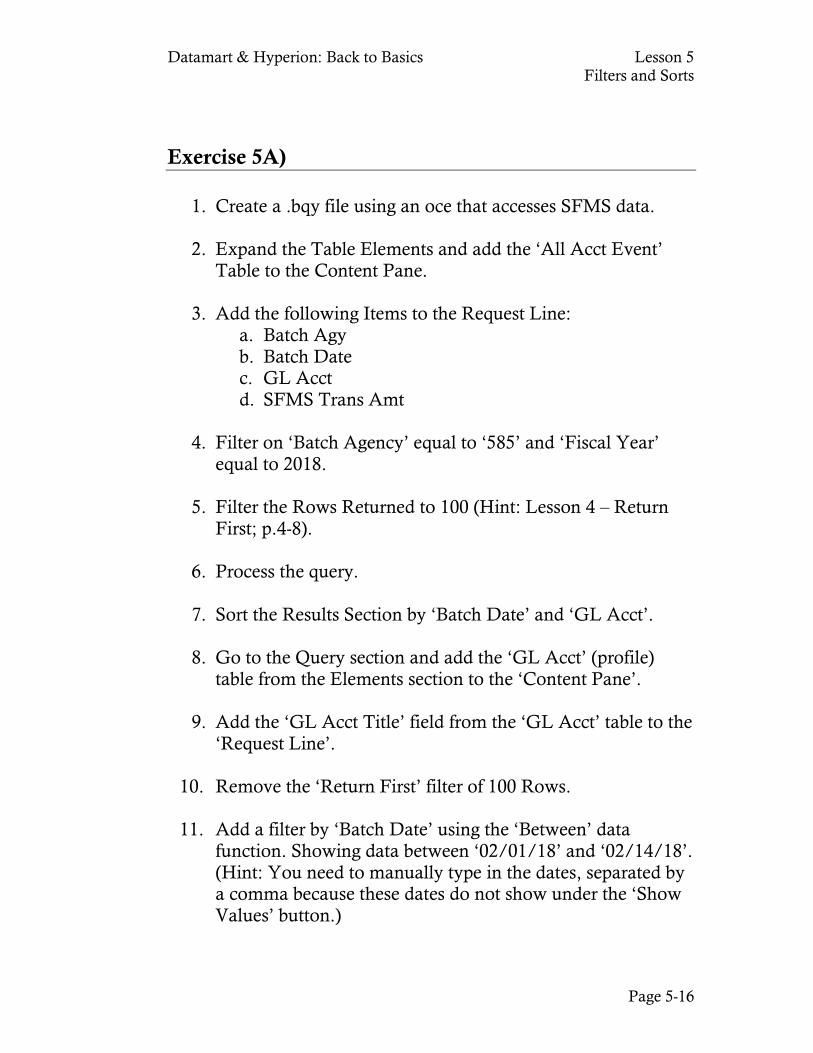
Datamart & Hyperion: Back to Basics Lesson 5 Filters and Sorts
Page 5-16
Exercise 5A)
1. Create a .bqy file using an oce that accesses SFMS data.
2. Expand the Table Elements and add the ‘All Acct Event’ Table to the Content Pane.
3. Add the following Items to the Request Line:
a. Batch Agy b. Batch Date c. GL Acct d. SFMS Trans Amt
4. Filter on ‘Batch Agency’ equal to ‘585’ and ‘Fiscal Year’
equal to 2018. 5. Filter the Rows Returned to 100 (Hint: Lesson 4 – Return
First; p.4-8). 6. Process the query. 7. Sort the Results Section by ‘Batch Date’ and ‘GL Acct’. 8. Go to the Query section and add the ‘GL Acct’ (profile)
table from the Elements section to the ‘Content Pane’. 9. Add the ‘GL Acct Title’ field from the ‘GL Acct’ table to the
‘Request Line’.
10. Remove the ‘Return First’ filter of 100 Rows. 11. Add a filter by ‘Batch Date’ using the ‘Between’ data
function. Showing data between ‘02/01/18’ and ‘02/14/18’. (Hint: You need to manually type in the dates, separated by a comma because these dates do not show under the ‘Show Values’ button.)
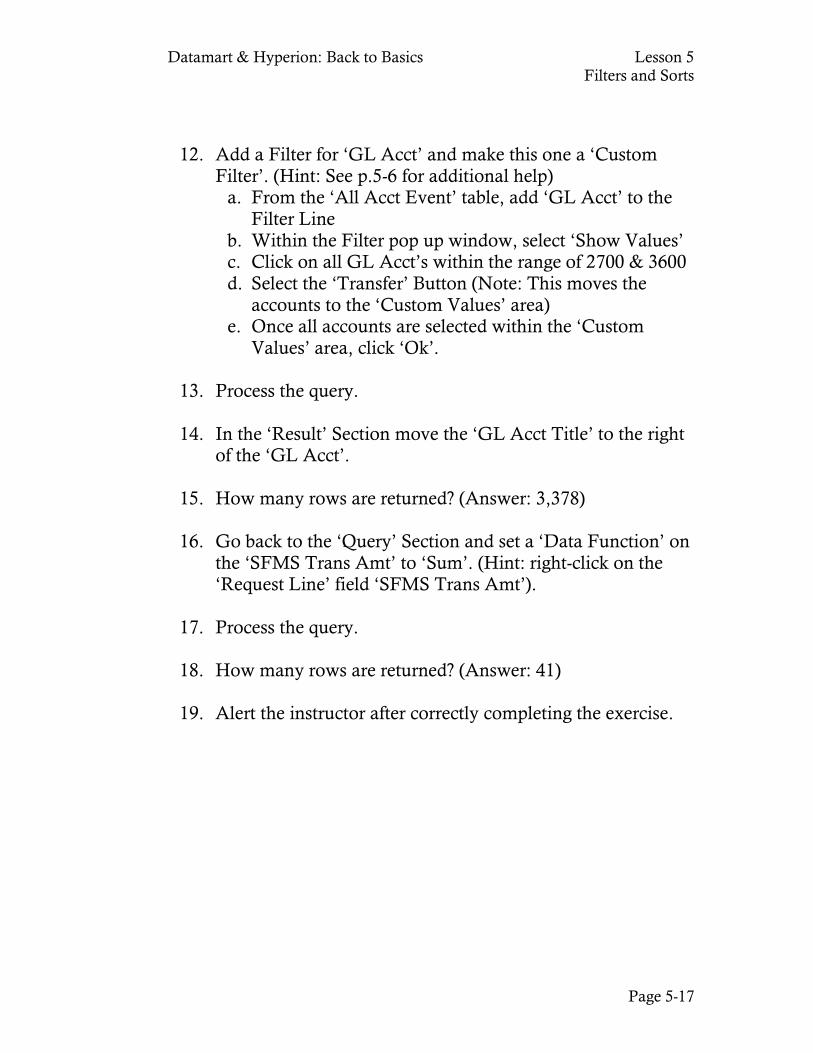
Datamart & Hyperion: Back to Basics Lesson 5 Filters and Sorts
Page 5-17
12. Add a Filter for ‘GL Acct’ and make this one a ‘Custom Filter’. (Hint: See p.5-6 for additional help)
a. From the ‘All Acct Event’ table, add ‘GL Acct’ to the Filter Line
b. Within the Filter pop up window, select ‘Show Values’ c. Click on all GL Acct’s within the range of 2700 & 3600 d. Select the ‘Transfer’ Button (Note: This moves the
accounts to the ‘Custom Values’ area) e. Once all accounts are selected within the ‘Custom
Values’ area, click ‘Ok’.
13. Process the query. 14. In the ‘Result’ Section move the ‘GL Acct Title’ to the right
of the ‘GL Acct’. 15. How many rows are returned? (Answer: 3,378) 16. Go back to the ‘Query’ Section and set a ‘Data Function’ on
the ‘SFMS Trans Amt’ to ‘Sum’. (Hint: right-click on the ‘Request Line’ field ‘SFMS Trans Amt’).
17. Process the query. 18. How many rows are returned? (Answer: 41)
19. Alert the instructor after correctly completing the exercise.
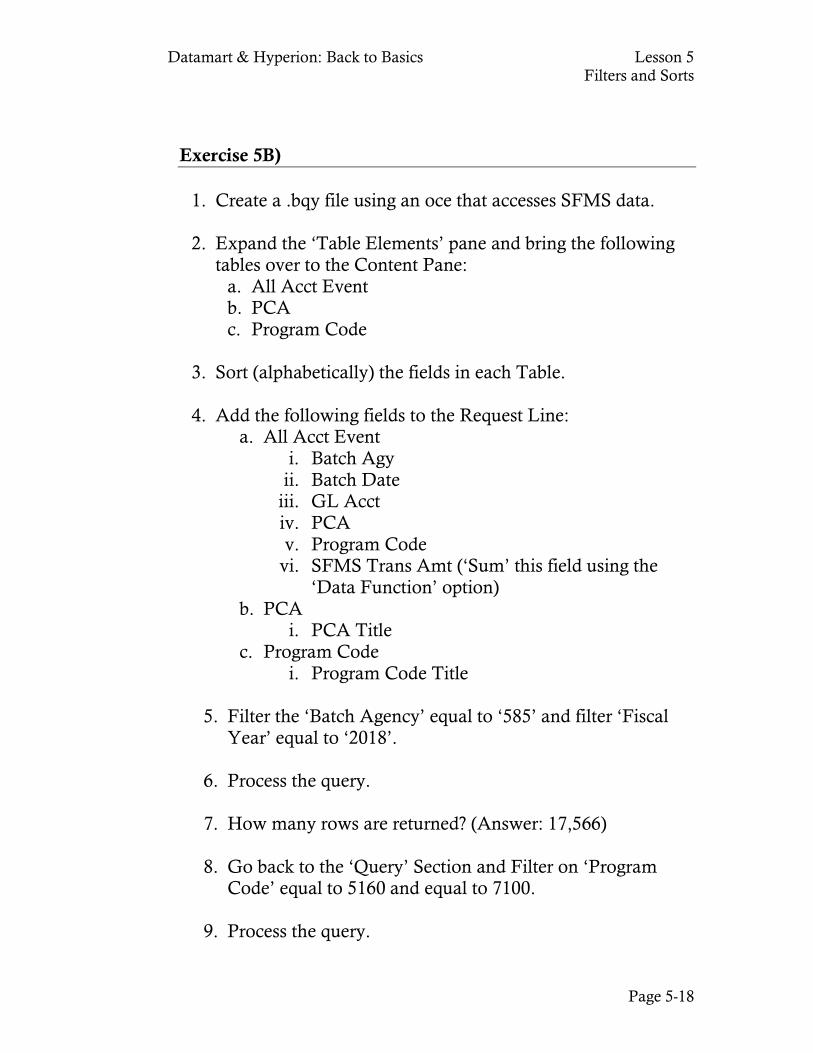
Datamart & Hyperion: Back to Basics Lesson 5 Filters and Sorts
Page 5-18
Exercise 5B)
1. Create a .bqy file using an oce that accesses SFMS data.
2. Expand the ‘Table Elements’ pane and bring the following tables over to the Content Pane:
a. All Acct Event b. PCA c. Program Code
3. Sort (alphabetically) the fields in each Table.
4. Add the following fields to the Request Line:
a. All Acct Event i. Batch Agy
ii. Batch Date iii. GL Acct iv. PCA v. Program Code
vi. SFMS Trans Amt (‘Sum’ this field using the ‘Data Function’ option)
b. PCA i. PCA Title
c. Program Code i. Program Code Title
5. Filter the ‘Batch Agency’ equal to ‘585’ and filter ‘Fiscal
Year’ equal to ‘2018’. 6. Process the query. 7. How many rows are returned? (Answer: 17,566) 8. Go back to the ‘Query’ Section and Filter on ‘Program
Code’ equal to 5160 and equal to 7100.
9. Process the query.
Datamart & Hyperion: Back to Basics Lesson 5 Filters and Sorts
Page 5-19
10. In the Results Section a. Sort Ascending: Batch Date, GL Acct and Program
Code.
11. How many rows are returned? (Answer: 178) 12. Go back to the ‘Query’ Section and ‘ignore’ the ‘Program
Code’ filter.
13. Set a Variable Filter on ‘GL Acct’. a. Drag the ‘GL Acct’ field to the Filter line. You will be
prompted by a pop up window. b. Set the ‘Custom Value’ to Begins with 31 and click
‘ok’. c. Right-click on the ‘GL Acct’ Filter and select ‘Variable
Filter’. 14. Process the query. (The Variable filter window for
‘GL Acct’ will pop up. Verify selection and click ‘ok’) 15. How many rows are returned? (Answer: 921) 16. Alert the instructor after correctly completing the exercise.

Lesson 6
Tables and Formatting
What’s the difference between Results and Table Sections? Formatting Data in Results and Table Sections Sorting Data in a Table Section Suppressing Duplicate Values Setting and Removing Local Filters in Results and Table
Sections Creating Date Groups Creating Grouping Columns Removing and Hiding Data Creating Grand Totals and Break Totals
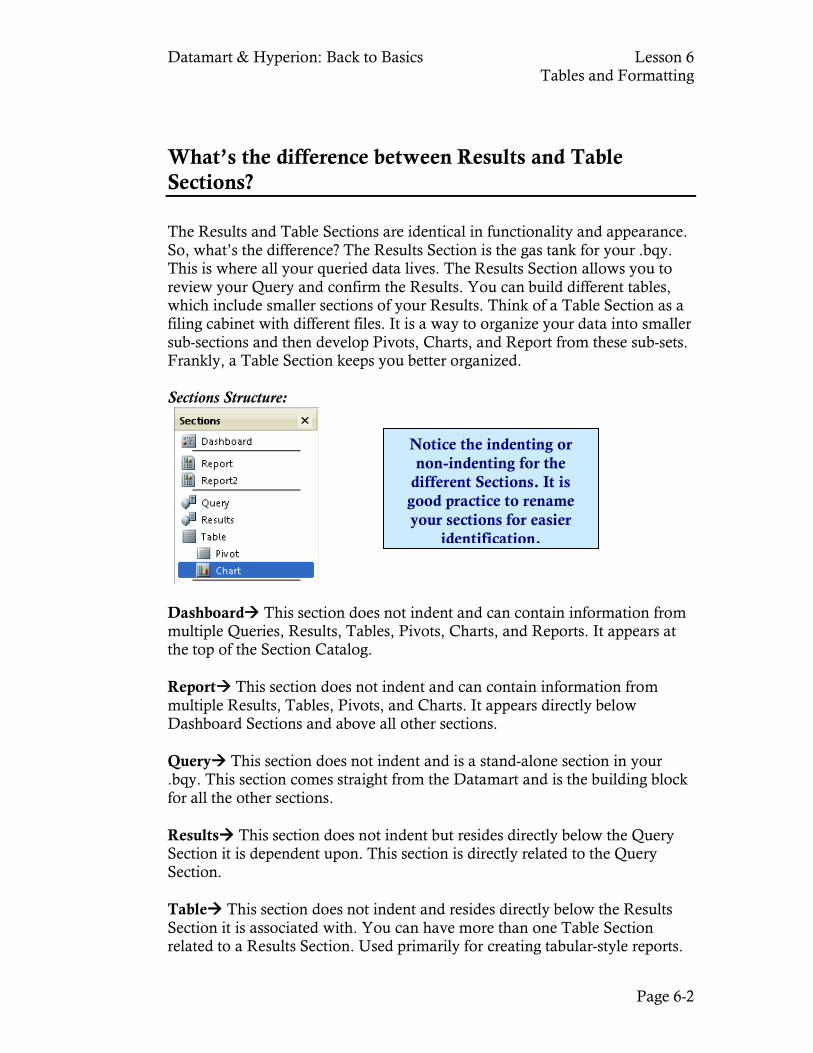
Datamart & Hyperion: Back to Basics Lesson 6 Tables and Formatting
Page 6-2
What’s the difference between Results and Table Sections? The Results and Table Sections are identical in functionality and appearance. So, what’s the difference? The Results Section is the gas tank for your .bqy. This is where all your queried data lives. The Results Section allows you to review your Query and confirm the Results. You can build different tables, which include smaller sections of your Results. Think of a Table Section as a filing cabinet with different files. It is a way to organize your data into smaller sub-sections and then develop Pivots, Charts, and Report from these sub-sets. Frankly, a Table Section keeps you better organized. Sections Structure:
Dashboard This section does not indent and can contain information from multiple Queries, Results, Tables, Pivots, Charts, and Reports. It appears at the top of the Section Catalog. Report This section does not indent and can contain information from multiple Results, Tables, Pivots, and Charts. It appears directly below Dashboard Sections and above all other sections. Query This section does not indent and is a stand-alone section in your .bqy. This section comes straight from the Datamart and is the building block for all the other sections. Results This section does not indent but resides directly below the Query Section it is dependent upon. This section is directly related to the Query Section. Table This section does not indent and resides directly below the Results Section it is associated with. You can have more than one Table Section related to a Results Section. Used primarily for creating tabular-style reports.
Notice the indenting or non-indenting for the
different Sections. It is good practice to rename your sections for easier
identification.
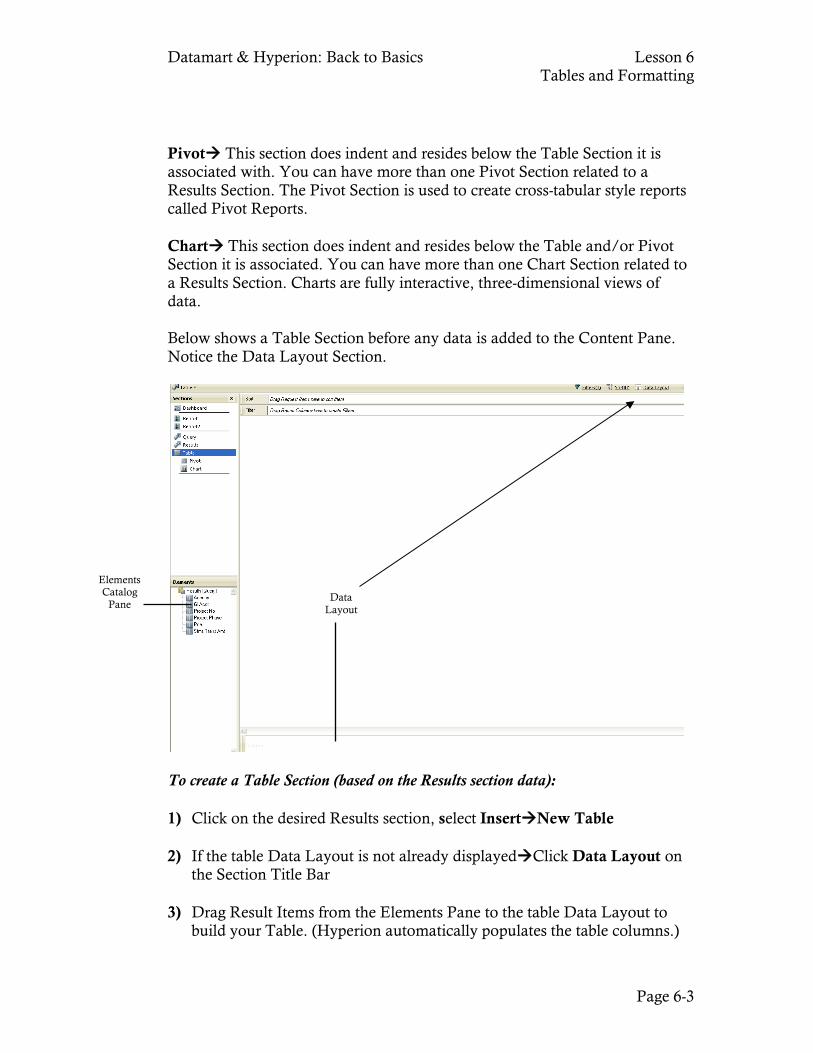
Datamart & Hyperion: Back to Basics Lesson 6 Tables and Formatting
Page 6-3
Pivot This section does indent and resides below the Table Section it is associated with. You can have more than one Pivot Section related to a Results Section. The Pivot Section is used to create cross-tabular style reports called Pivot Reports. Chart This section does indent and resides below the Table and/or Pivot Section it is associated. You can have more than one Chart Section related to a Results Section. Charts are fully interactive, three-dimensional views of data. Below shows a Table Section before any data is added to the Content Pane. Notice the Data Layout Section.
To create a Table Section (based on the Results section data): 1) Click on the desired Results section, select InsertNew Table 2) If the table Data Layout is not already displayedClick Data Layout on
the Section Title Bar 3) Drag Result Items from the Elements Pane to the table Data Layout to
build your Table. (Hyperion automatically populates the table columns.)
Data Layout
Elements Catalog
Pane
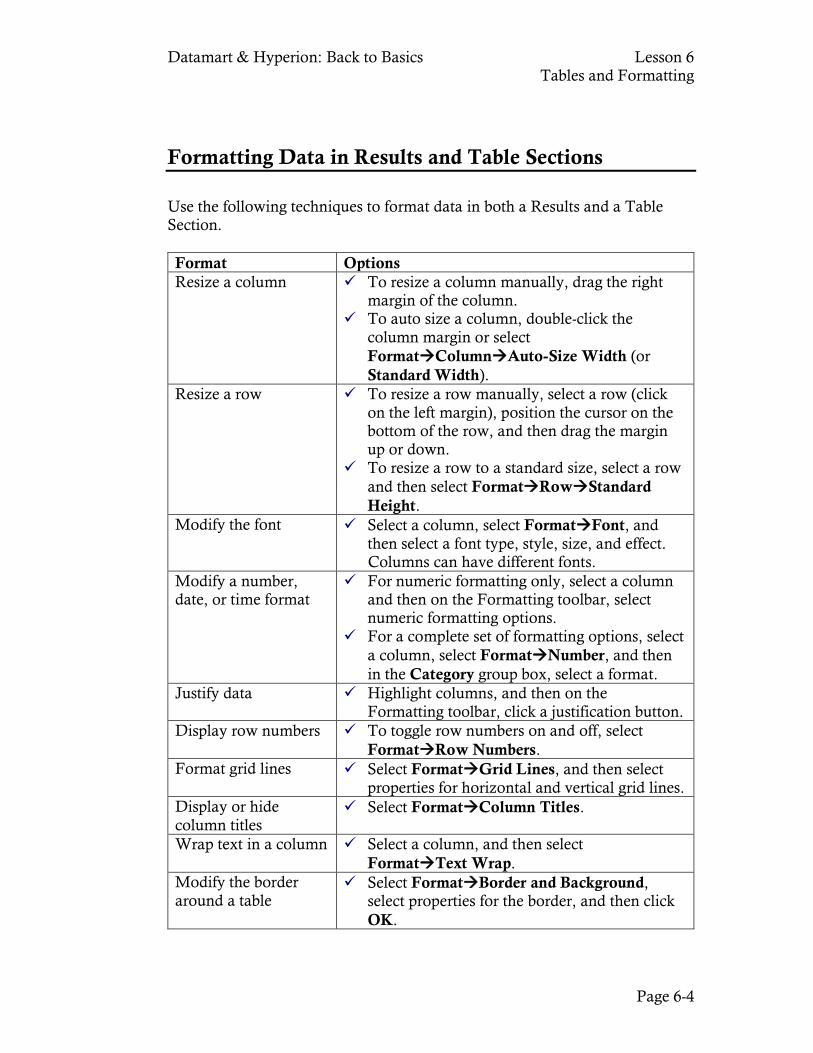
Datamart & Hyperion: Back to Basics Lesson 6 Tables and Formatting
Page 6-4
Formatting Data in Results and Table Sections Use the following techniques to format data in both a Results and a Table Section. Format Options Resize a column To resize a column manually, drag the right
margin of the column. To auto size a column, double-click the
column margin or select FormatColumnAuto-Size Width (or Standard Width).
Resize a row To resize a row manually, select a row (click on the left margin), position the cursor on the bottom of the row, and then drag the margin up or down.
To resize a row to a standard size, select a row and then select FormatRowStandard Height.
Modify the font Select a column, select FormatFont, and then select a font type, style, size, and effect.
Columns can have different fonts. Modify a number, date, or time format
For numeric formatting only, select a column and then on the Formatting toolbar, select numeric formatting options.
For a complete set of formatting options, select a column, select FormatNumber, and then in the Category group box, select a format.
Justify data Highlight columns, and then on the Formatting toolbar, click a justification button.
Display row numbers To toggle row numbers on and off, select FormatRow Numbers.
Format grid lines Select FormatGrid Lines, and then select properties for horizontal and vertical grid lines.
Display or hide column titles
Select FormatColumn Titles.
Wrap text in a column Select a column, and then select FormatText Wrap.
Modify the border around a table
Select FormatBorder and Background, select properties for the border, and then click OK.
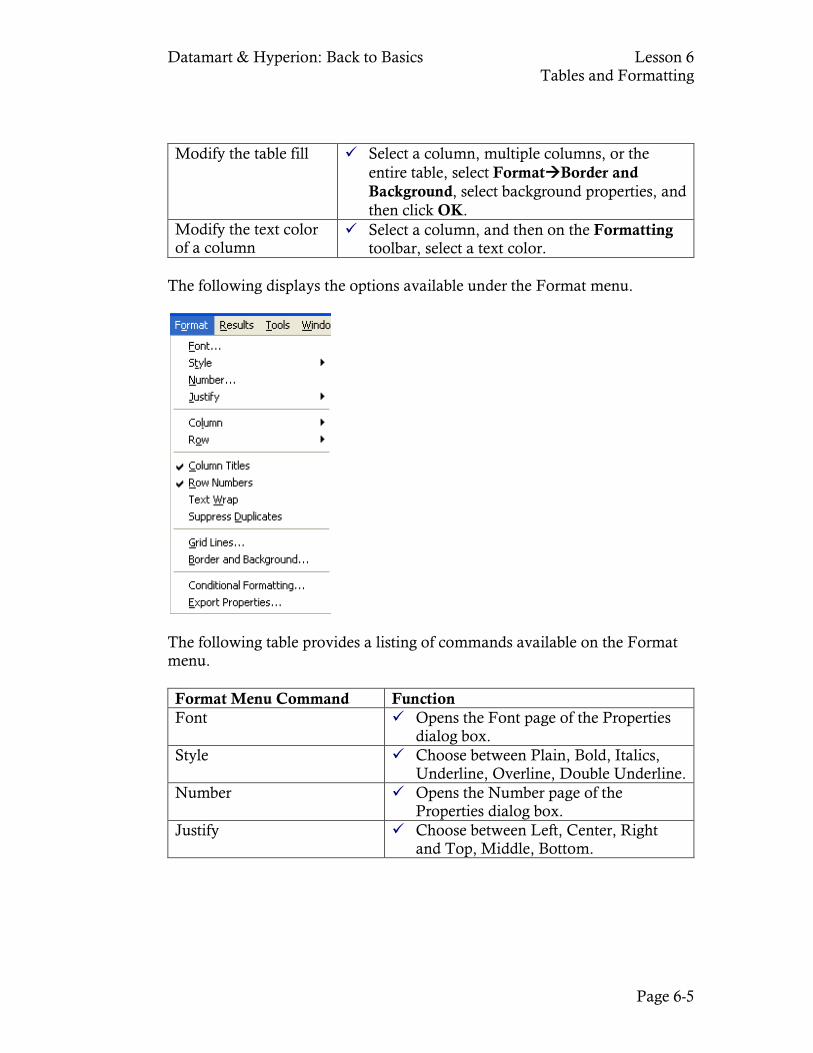
Datamart & Hyperion: Back to Basics Lesson 6 Tables and Formatting
Page 6-5
Modify the table fill Select a column, multiple columns, or the entire table, select FormatBorder and Background, select background properties, and then click OK.
Modify the text color of a column
Select a column, and then on the Formatting toolbar, select a text color.
The following displays the options available under the Format menu.
The following table provides a listing of commands available on the Format menu. Format Menu Command Function Font Opens the Font page of the Properties
dialog box. Style Choose between Plain, Bold, Italics,
Underline, Overline, Double Underline. Number Opens the Number page of the
Properties dialog box. Justify Choose between Left, Center, Right
and Top, Middle, Bottom.
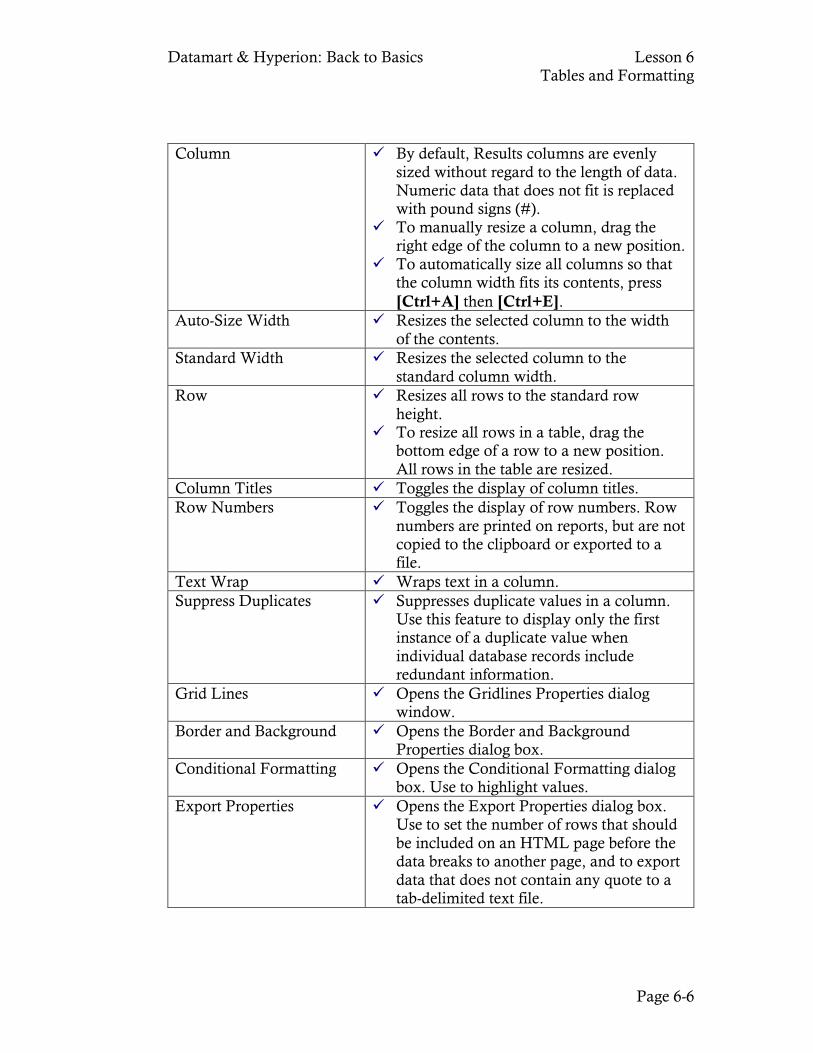
Datamart & Hyperion: Back to Basics Lesson 6 Tables and Formatting
Page 6-6
Column By default, Results columns are evenly sized without regard to the length of data. Numeric data that does not fit is replaced with pound signs (#).
To manually resize a column, drag the right edge of the column to a new position.
To automatically size all columns so that the column width fits its contents, press [Ctrl+A] then [Ctrl+E].
Auto-Size Width Resizes the selected column to the width of the contents.
Standard Width Resizes the selected column to the standard column width.
Row Resizes all rows to the standard row height.
To resize all rows in a table, drag the bottom edge of a row to a new position. All rows in the table are resized.
Column Titles Toggles the display of column titles. Row Numbers Toggles the display of row numbers. Row
numbers are printed on reports, but are not copied to the clipboard or exported to a file.
Text Wrap Wraps text in a column. Suppress Duplicates Suppresses duplicate values in a column.
Use this feature to display only the first instance of a duplicate value when individual database records include redundant information.
Grid Lines Opens the Gridlines Properties dialog window.
Border and Background Opens the Border and Background Properties dialog box.
Conditional Formatting Opens the Conditional Formatting dialog box. Use to highlight values.
Export Properties Opens the Export Properties dialog box. Use to set the number of rows that should be included on an HTML page before the data breaks to another page, and to export data that does not contain any quote to a tab-delimited text file.
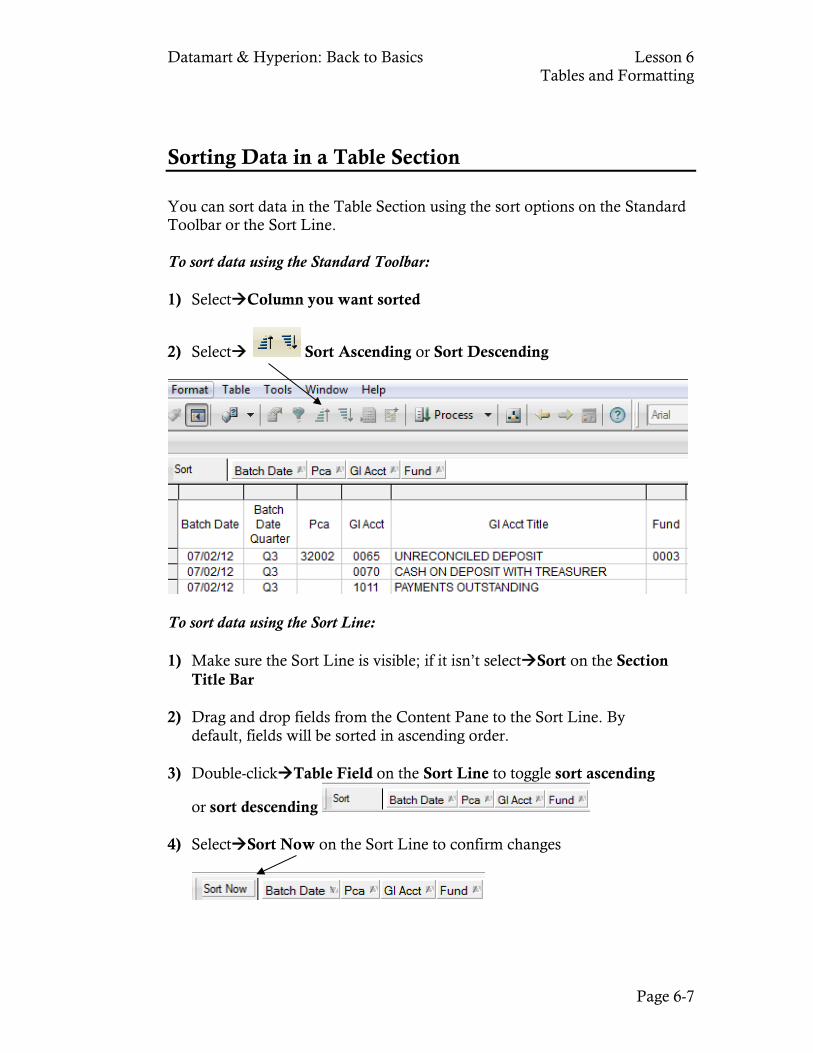
Datamart & Hyperion: Back to Basics Lesson 6 Tables and Formatting
Page 6-7
Sorting Data in a Table Section You can sort data in the Table Section using the sort options on the Standard Toolbar or the Sort Line. To sort data using the Standard Toolbar: 1) SelectColumn you want sorted
2) Select Sort Ascending or Sort Descending
To sort data using the Sort Line: 1) Make sure the Sort Line is visible; if it isn’t selectSort on the Section Title Bar 2) Drag and drop fields from the Content Pane to the Sort Line. By default, fields will be sorted in ascending order. 3) Double-clickTable Field on the Sort Line to toggle sort ascending
or sort descending 4) SelectSort Now on the Sort Line to confirm changes
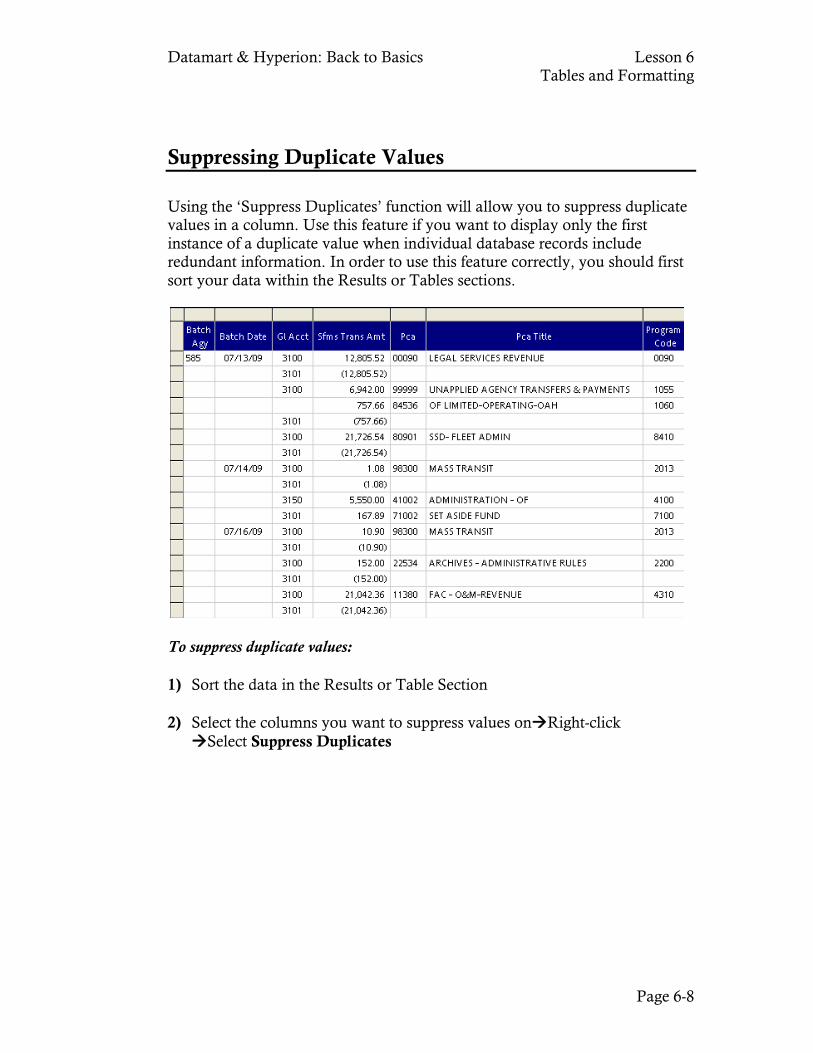
Datamart & Hyperion: Back to Basics Lesson 6 Tables and Formatting
Page 6-8
Suppressing Duplicate Values Using the ‘Suppress Duplicates’ function will allow you to suppress duplicate values in a column. Use this feature if you want to display only the first instance of a duplicate value when individual database records include redundant information. In order to use this feature correctly, you should first sort your data within the Results or Tables sections.
To suppress duplicate values: 1) Sort the data in the Results or Table Section 2) Select the columns you want to suppress values onRight-click Select Suppress Duplicates
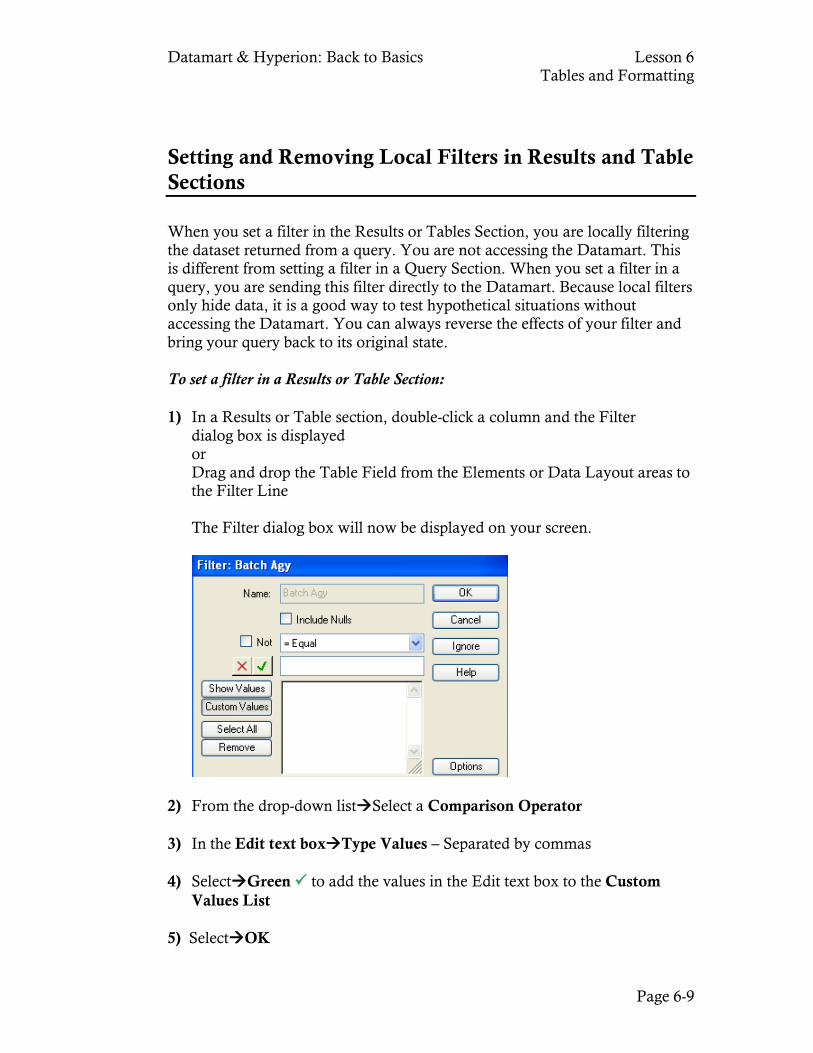
Datamart & Hyperion: Back to Basics Lesson 6 Tables and Formatting
Page 6-9
Setting and Removing Local Filters in Results and Table Sections When you set a filter in the Results or Tables Section, you are locally filtering the dataset returned from a query. You are not accessing the Datamart. This is different from setting a filter in a Query Section. When you set a filter in a query, you are sending this filter directly to the Datamart. Because local filters only hide data, it is a good way to test hypothetical situations without accessing the Datamart. You can always reverse the effects of your filter and bring your query back to its original state. To set a filter in a Results or Table Section: 1) In a Results or Table section, double-click a column and the Filter dialog box is displayed or Drag and drop the Table Field from the Elements or Data Layout areas to
the Filter Line
The Filter dialog box will now be displayed on your screen.
2) From the drop-down listSelect a Comparison Operator
3) In the Edit text boxType Values – Separated by commas
4) SelectGreen to add the values in the Edit text box to the Custom Values List 5) SelectOK
Datamart & Hyperion: Back to Basics Lesson 6 Tables and Formatting
Page 6-10
To remove a filter in a Results or Table Section: 1) Right-click the Filtered FieldSelect Remove To remove all filters in a Results or Table Section:
1) Right-click the area on the Filter LineSelect Remove
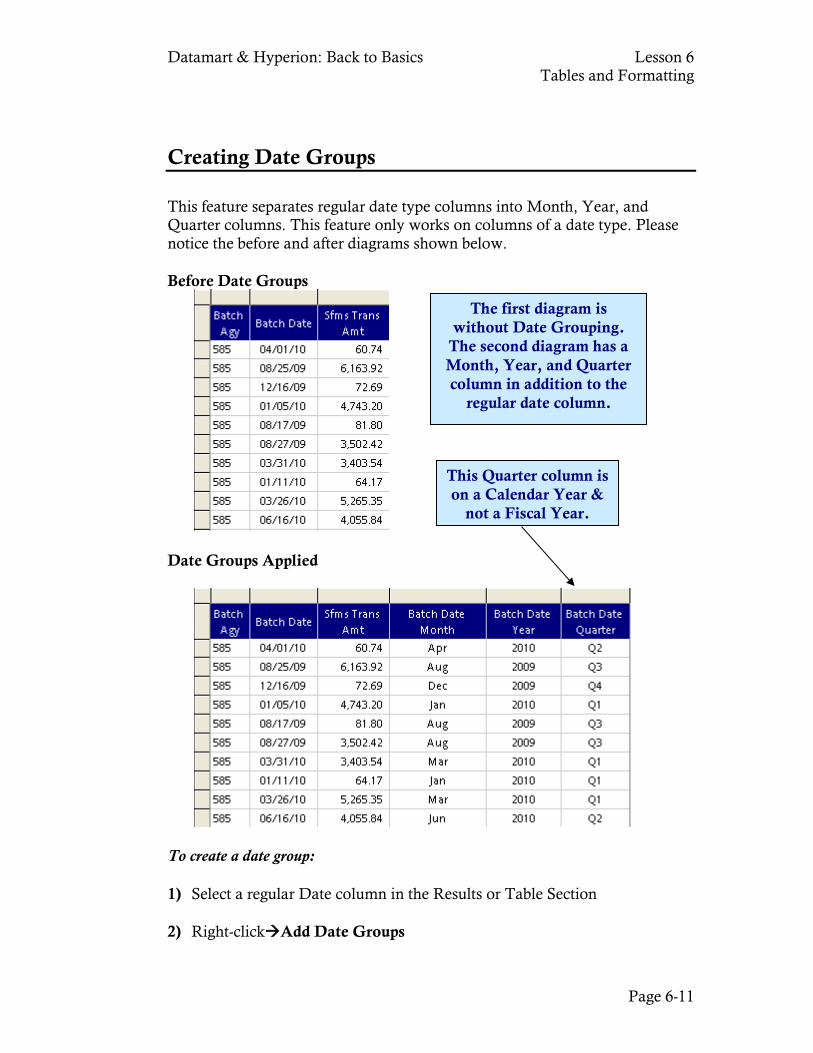
Datamart & Hyperion: Back to Basics Lesson 6 Tables and Formatting
Page 6-11
Creating Date Groups This feature separates regular date type columns into Month, Year, and Quarter columns. This feature only works on columns of a date type. Please notice the before and after diagrams shown below. Before Date Groups
Date Groups Applied
To create a date group: 1) Select a regular Date column in the Results or Table Section 2) Right-clickAdd Date Groups
The first diagram is without Date Grouping.
The second diagram has a Month, Year, and Quarter column in addition to the
regular date column.
This Quarter column is on a Calendar Year &
not a Fiscal Year.
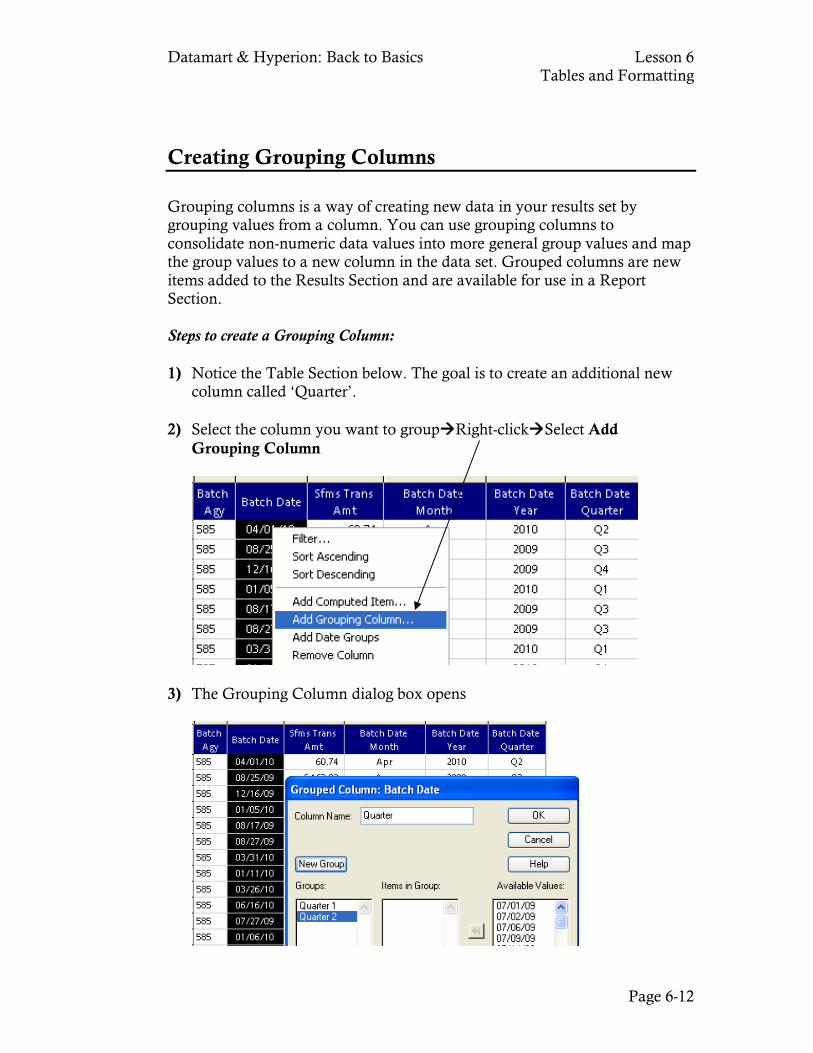
Datamart & Hyperion: Back to Basics Lesson 6 Tables and Formatting
Page 6-12
Creating Grouping Columns Grouping columns is a way of creating new data in your results set by grouping values from a column. You can use grouping columns to consolidate non-numeric data values into more general group values and map the group values to a new column in the data set. Grouped columns are new items added to the Results Section and are available for use in a Report Section. Steps to create a Grouping Column: 1) Notice the Table Section below. The goal is to create an additional new
column called ‘Quarter’. 2) Select the column you want to groupRight-clickSelect Add Grouping Column
3) The Grouping Column dialog box opens
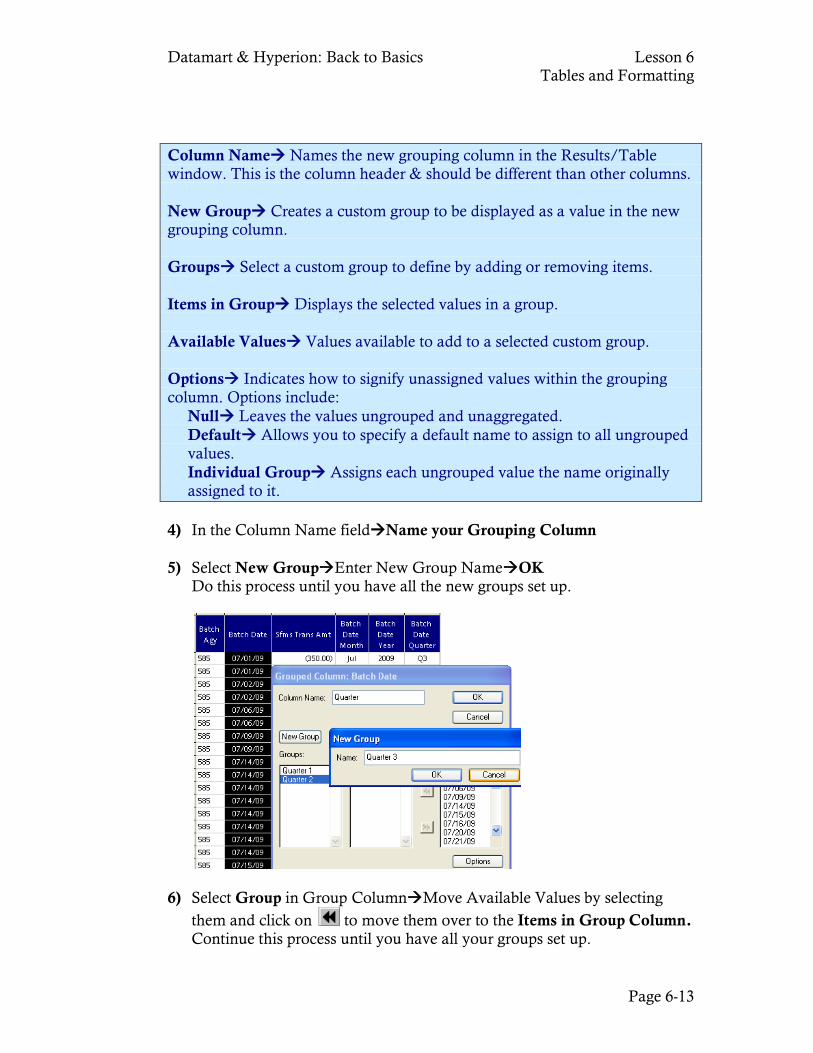
Datamart & Hyperion: Back to Basics Lesson 6 Tables and Formatting
Page 6-13
Column Name Names the new grouping column in the Results/Table window. This is the column header & should be different than other columns. New Group Creates a custom group to be displayed as a value in the new grouping column. Groups Select a custom group to define by adding or removing items. Items in Group Displays the selected values in a group. Available Values Values available to add to a selected custom group. Options Indicates how to signify unassigned values within the grouping column. Options include: Null Leaves the values ungrouped and unaggregated. Default Allows you to specify a default name to assign to all ungrouped values. Individual Group Assigns each ungrouped value the name originally assigned to it.
4) In the Column Name fieldName your Grouping Column 5) Select New GroupEnter New Group NameOK Do this process until you have all the new groups set up.
6) Select Group in Group ColumnMove Available Values by selecting
them and click on to move them over to the Items in Group Column. Continue this process until you have all your groups set up.
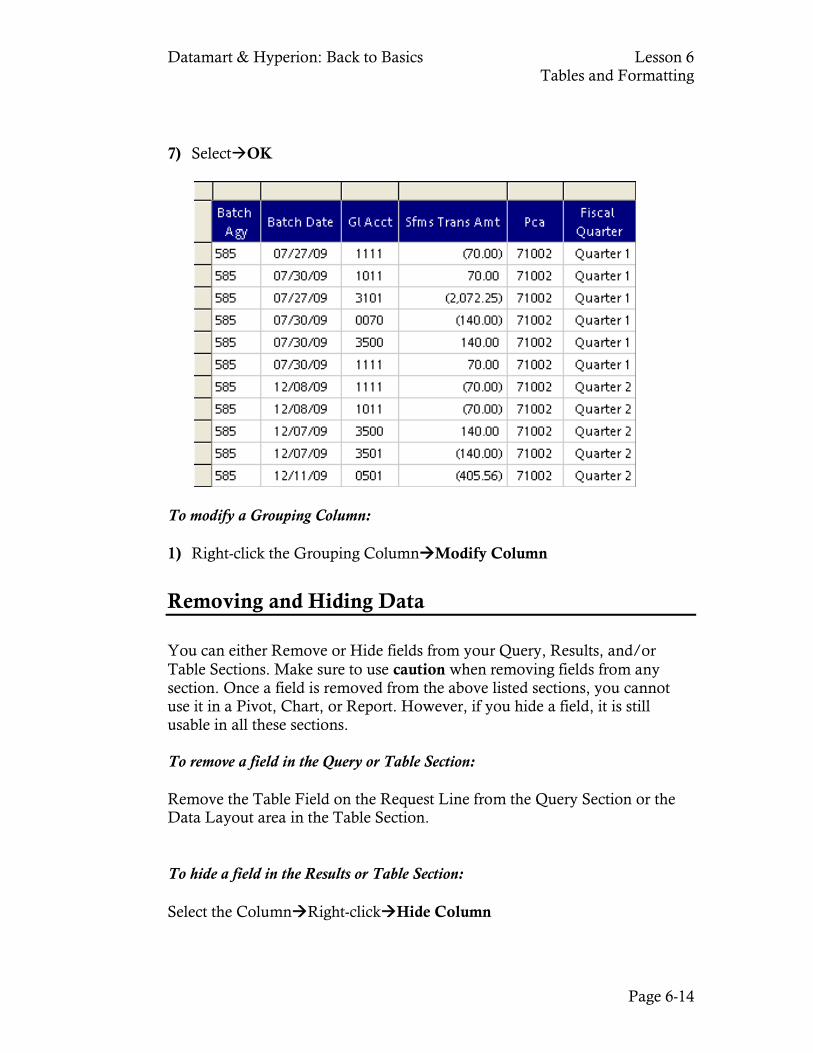
Datamart & Hyperion: Back to Basics Lesson 6 Tables and Formatting
Page 6-14
7) SelectOK
To modify a Grouping Column: 1) Right-click the Grouping ColumnModify Column
Removing and Hiding Data You can either Remove or Hide fields from your Query, Results, and/or Table Sections. Make sure to use caution when removing fields from any section. Once a field is removed from the above listed sections, you cannot use it in a Pivot, Chart, or Report. However, if you hide a field, it is still usable in all these sections. To remove a field in the Query or Table Section: Remove the Table Field on the Request Line from the Query Section or the Data Layout area in the Table Section. To hide a field in the Results or Table Section: Select the ColumnRight-clickHide Column
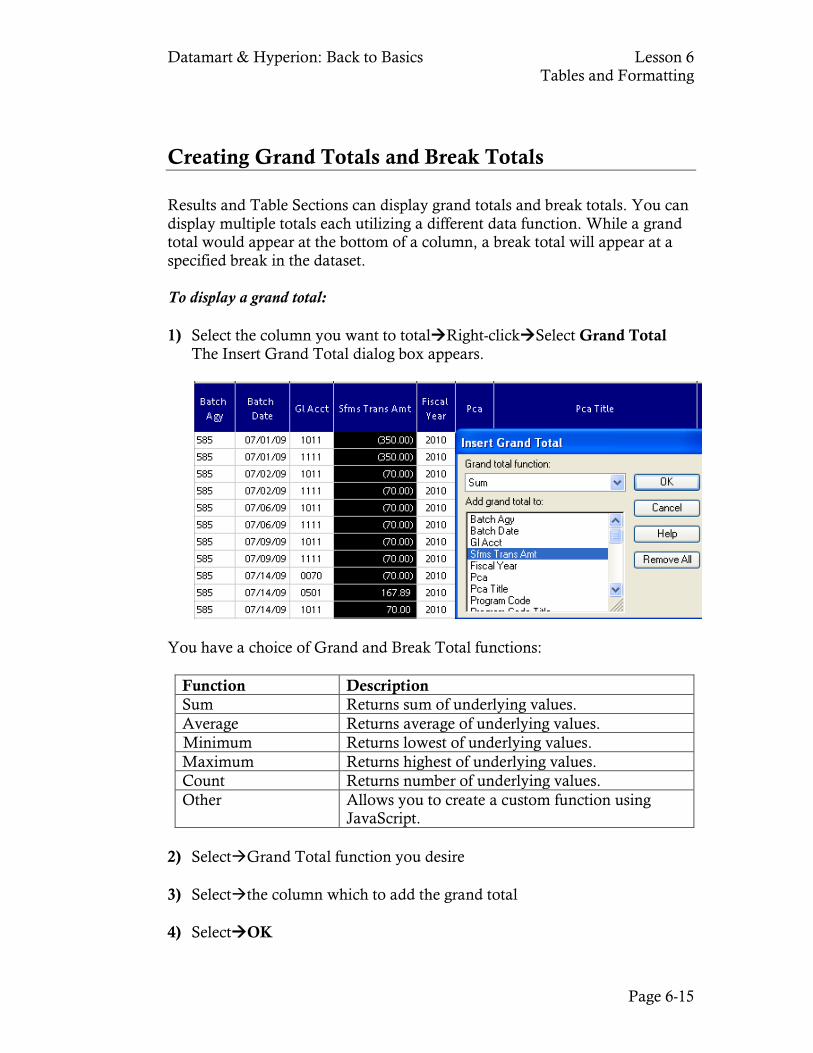
Datamart & Hyperion: Back to Basics Lesson 6 Tables and Formatting
Page 6-15
Creating Grand Totals and Break Totals
Results and Table Sections can display grand totals and break totals. You can display multiple totals each utilizing a different data function. While a grand total would appear at the bottom of a column, a break total will appear at a specified break in the dataset. To display a grand total: 1) Select the column you want to totalRight-clickSelect Grand Total The Insert Grand Total dialog box appears.
You have a choice of Grand and Break Total functions:
Function Description Sum Returns sum of underlying values. Average Returns average of underlying values.
Minimum Returns lowest of underlying values. Maximum Returns highest of underlying values. Count Returns number of underlying values. Other Allows you to create a custom function using
JavaScript. 2) SelectGrand Total function you desire 3) Selectthe column which to add the grand total 4) SelectOK
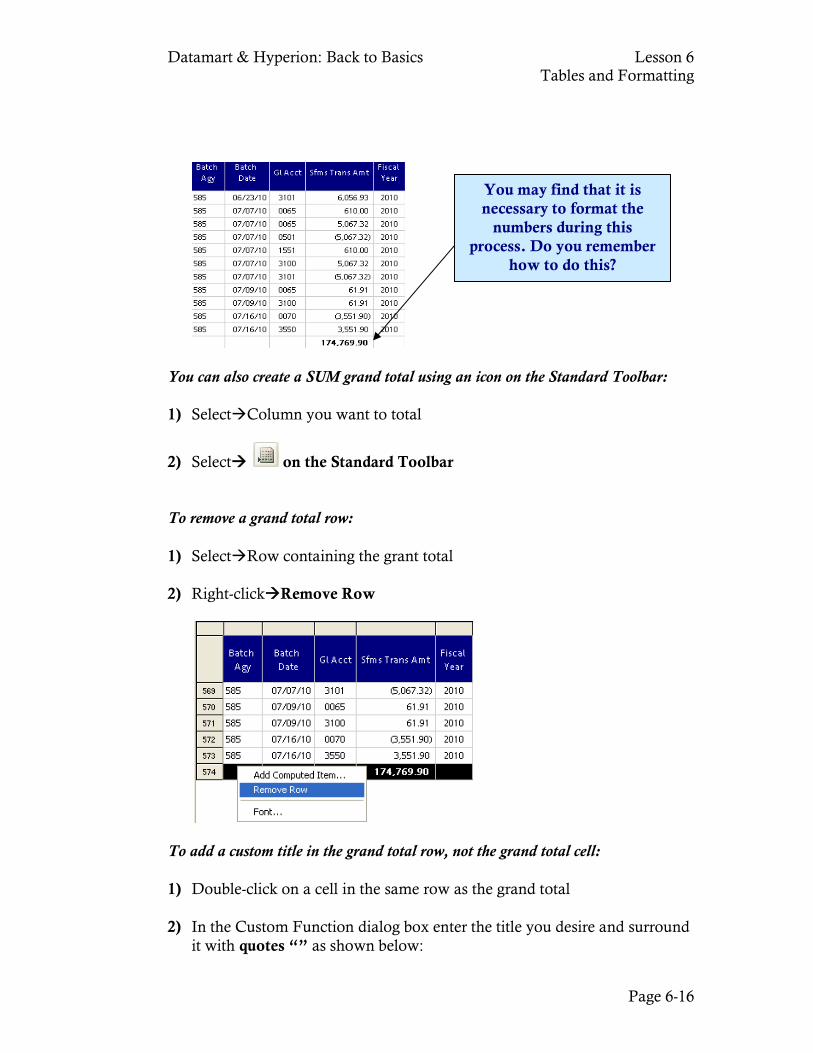
Datamart & Hyperion: Back to Basics Lesson 6 Tables and Formatting
Page 6-16
You can also create a SUM grand total using an icon on the Standard Toolbar: 1) SelectColumn you want to total
2) Select on the Standard Toolbar To remove a grand total row: 1) SelectRow containing the grant total 2) Right-clickRemove Row
To add a custom title in the grand total row, not the grand total cell: 1) Double-click on a cell in the same row as the grand total 2) In the Custom Function dialog box enter the title you desire and surround
it with quotes “” as shown below:
You may find that it is necessary to format the
numbers during this process. Do you remember
how to do this?
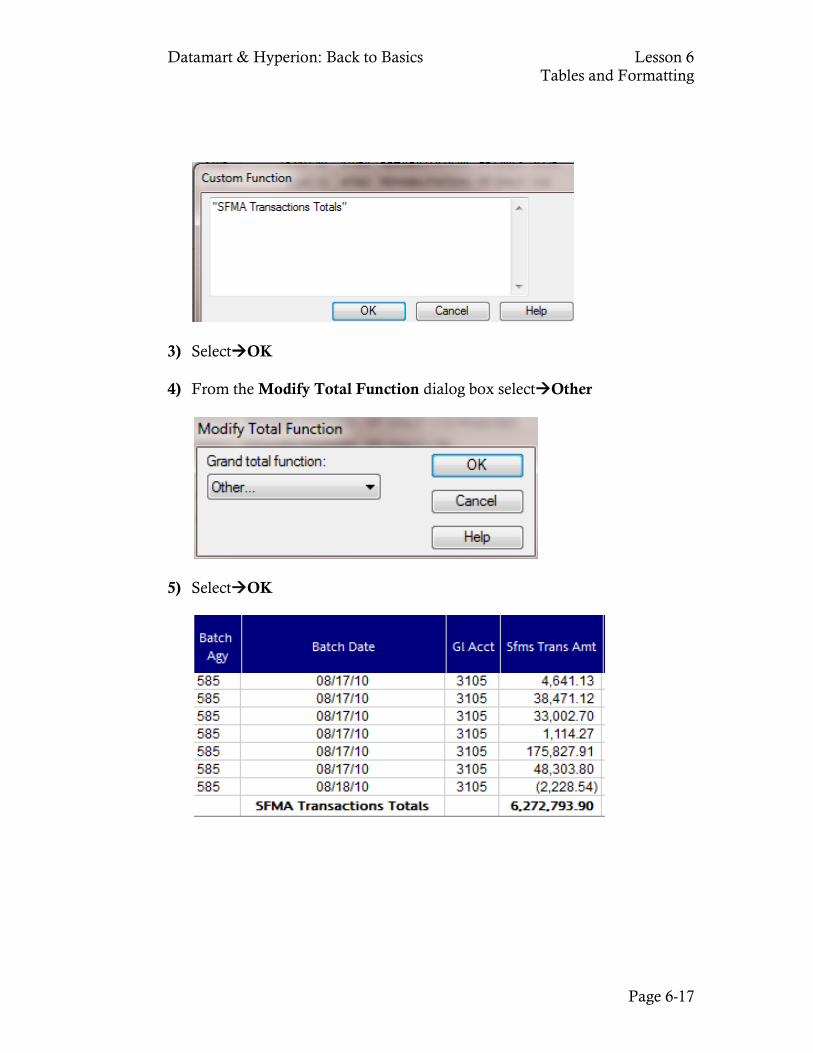
Datamart & Hyperion: Back to Basics Lesson 6 Tables and Formatting
Page 6-17
3) SelectOK 4) From the Modify Total Function dialog box selectOther
5) SelectOK
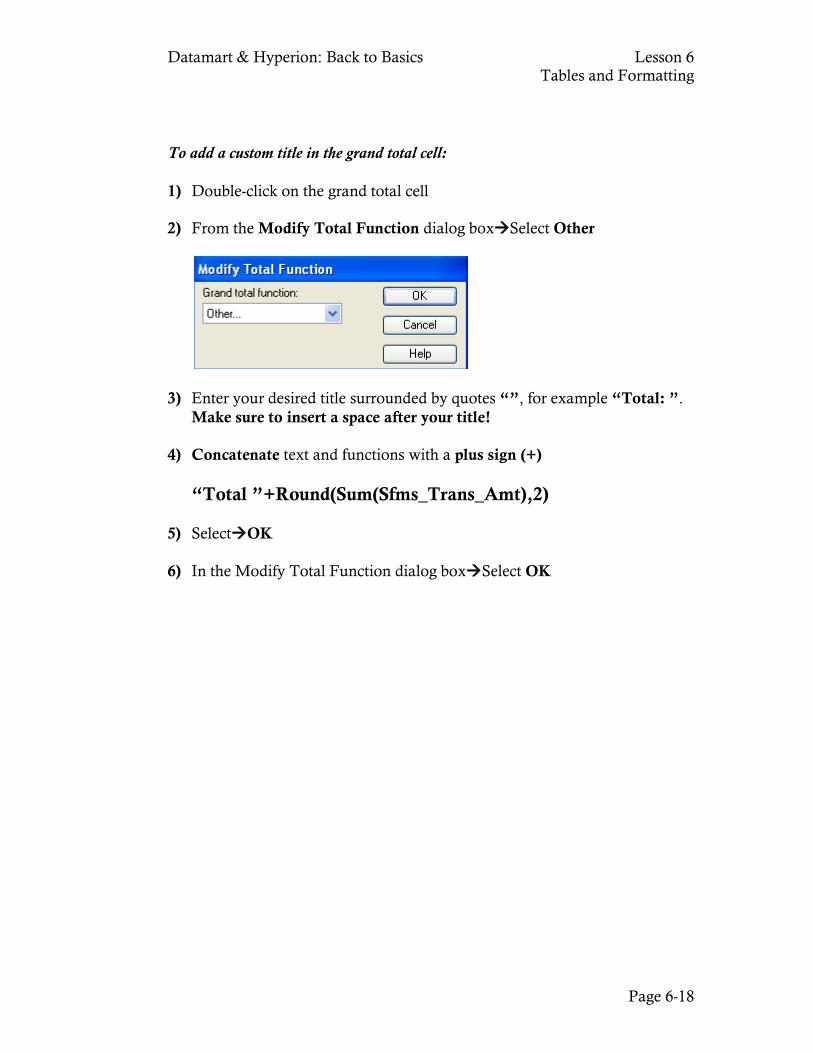
Datamart & Hyperion: Back to Basics Lesson 6 Tables and Formatting
Page 6-18
To add a custom title in the grand total cell: 1) Double-click on the grand total cell 2) From the Modify Total Function dialog boxSelect Other
3) Enter your desired title surrounded by quotes “”, for example “Total: ”. Make sure to insert a space after your title! 4) Concatenate text and functions with a plus sign (+)
“Total ”+Round(Sum(Sfms_Trans_Amt),2) 5) SelectOK 6) In the Modify Total Function dialog boxSelect OK
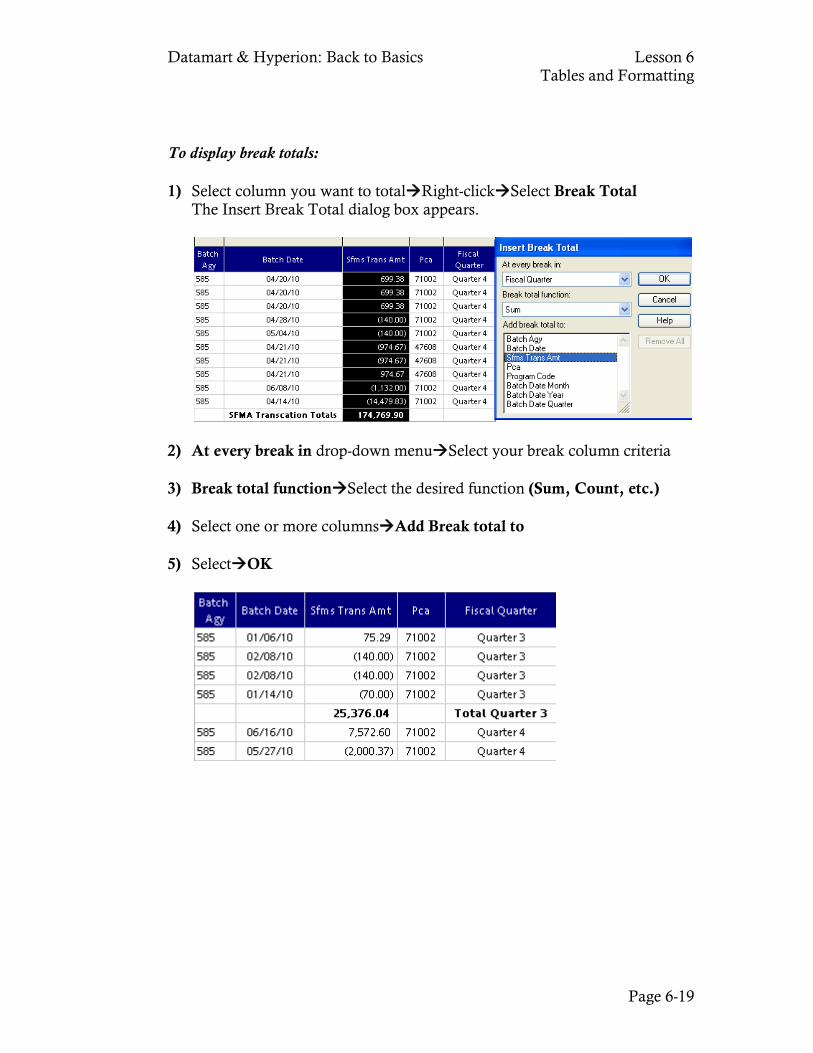
Datamart & Hyperion: Back to Basics Lesson 6 Tables and Formatting
Page 6-19
To display break totals: 1) Select column you want to totalRight-clickSelect Break Total The Insert Break Total dialog box appears.
2) At every break in drop-down menuSelect your break column criteria 3) Break total functionSelect the desired function (Sum, Count, etc.) 4) Select one or more columnsAdd Break total to 5) SelectOK
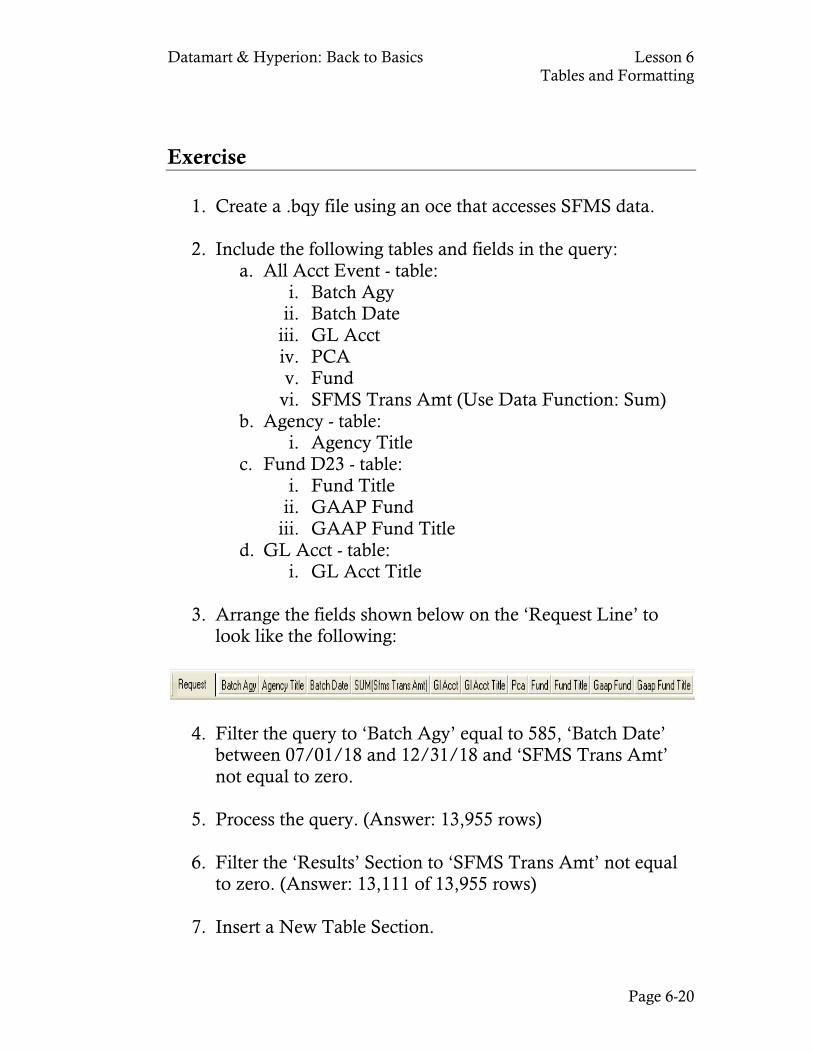
Datamart & Hyperion: Back to Basics Lesson 6 Tables and Formatting
Page 6-20
Exercise
1. Create a .bqy file using an oce that accesses SFMS data.
2. Include the following tables and fields in the query: a. All Acct Event - table:
i. Batch Agy ii. Batch Date
iii. GL Acct iv. PCA v. Fund
vi. SFMS Trans Amt (Use Data Function: Sum) b. Agency - table:
i. Agency Title c. Fund D23 - table:
i. Fund Title ii. GAAP Fund
iii. GAAP Fund Title d. GL Acct - table:
i. GL Acct Title
3. Arrange the fields shown below on the ‘Request Line’ to look like the following:
4. Filter the query to ‘Batch Agy’ equal to 585, ‘Batch Date’ between 07/01/18 and 12/31/18 and ‘SFMS Trans Amt’ not equal to zero.
5. Process the query. (Answer: 13,955 rows)
6. Filter the ‘Results’ Section to ‘SFMS Trans Amt’ not equal to zero. (Answer: 13,111 of 13,955 rows)
7. Insert a New Table Section.
Datamart & Hyperion: Back to Basics Lesson 6 Tables and Formatting
Page 6-21
8. Within the newly created Table, move the following fields from the ‘Elements Pane’ area to the ‘Data Layout’ section to allow the data to show on the Content Pane:
a. Batch Date b. PCA c. GL Acct d. GL Acct Title e. Fund f. Fund Title g. SFMS Trans Amt
9. Within the Table section, sort the following fields in
Ascending Order: ‘Batch Date’, ‘PCA’, ‘GL Acct’, and ‘Fund’. Also, create a Filter of ‘PCA’ beginning with 2 or 3.
10. Change the font of every column on your Table to Arial - size 9 and auto size the width of your columns. (Hint: To auto size use ‘Ctrl A’ & ‘Ctrl E’).
11. Suppress Duplicate values of the ‘PCA’, ‘Fund’ and ‘Fund Title’ field columns.
12. Add a ‘Date Group’ column from the ‘Batch Date’ data. Then hide the newly created ‘Batch Month’ and ‘Batch Year’ columns. Finally, move the ‘Batch Date Quarter’ column to the right of ‘Batch Date’.
13. Create a ‘Grouped Column’ entitled ‘CAFR Acct’. The new column is based on the ‘GL Acct’ column data. Add the following list of CAFR Account groups to the newly created ‘CAFR Acct’ column. Note: Input only the number of the group and not the entire CAFR Acct description shown below. For example, ‘010-Cash and Cash Equivalents’ becomes a group called ‘010’.
Datamart & Hyperion: Back to Basics Lesson 6 Tables and Formatting
Page 6-22
CAFR Account - Groups:
a. 010-Cash and Cash Equivalents b. 050-Accounts & Interest Receivable c. 060-Inventories d. 090-Accumulated Depreciation & Amortization e. 120-Accounts & Interest Payable f. 162-Compensated Abs Pay-Current g. 175-Compensated Abs Pay-Noncurrent h. 271-Encumbrance Control i. 301-Reserved for Encumbrances j. 307-GAAP Expenditure Offset k. 310-Unreserved, Undesignated Fund Balance l. 331-Nonspendable Fund Balance-Inventory m. 371-Invested in Capital Assets n. 375-Net Assets o. 999-Default Oregon
14. Assign the ‘Available Values’ to the new groups as follows:
a. CAFR Acct: 010 i. 0065
ii. 0070 iii. 0075
b. CAFR Acct: 050 i. Accounts beginning with 04 or 05
c. CAFR Acct: 060 i. 0601
d. CAFR Acct: 090 i. Accounts beginning with 08 or 09
e. CAFR Acct: 120 i. 1211
ii. 1216 f. CAFR Acct: 162
i. 1605 g. CAFR Acct: 175
i. 1718
Datamart & Hyperion: Back to Basics Lesson 6 Tables and Formatting
Page 6-23
h. CAFR Acct: 271 i. 2735
i. CAFR Acct: 301 i. 3011
j. CAFR Acct: 307 i. 3200
ii. 3600 k. CAFR Acct: 310
i. 3060 ii. 3075
iii. 3100 iv. 3101 v. 3150
vi. 3500 vii. 3501
viii. 3503 ix. 3550
l. CAFR Acct: 331 i. 3031
ii. 3037 m. CAFR Acct: 371
i. 3018 n. CAFR Acct: 375
i. 3074 o. CAFR Acct: 999
i. 1011 ii. 1111
iii. 2700 iv. 2701 v. 2900
vi. 2901 vii. 2904
viii. 2951 ix. 2954 x. 9010
xi. 9011
Datamart & Hyperion: Back to Basics Lesson 6 Tables and Formatting
Page 6-24
15. Select ‘Ok’ when finished, and format the new column as necessary.
16. Modify the newly created ‘CAFR Acct’ grouped column to show all unassigned values as Default’Error’. Hint: Right click on the ‘CAFR Acct’ column and select ‘Modify Column’. On the following pop up window, select the ‘Options’ button. Note: This update will allow any future ‘unassigned values’ to show within an ‘Error’ category, thus displaying a reminder to update the unassigned data.
17. Within the Table section, under the ‘SFMS Trans Amt’ column, input a summed ‘Grand Total’. (Answer: Grand Total – 46,596.68)
18. Alert the instructor after correctly completing the exercise.