Embed Size (px)
Citation preview
Reference Manual 26022019, Rev. 1.3
June 2019
DATALOG X-PRO 1.0
INTERNET OF THINGS MULTISENSOR WIRELESS DEVICE
Quick Start Guide
Read this manual before working with the product. For personal and system safety, and for optimum product performance, make sure you thoroughly understand the contents before installing, using, or maintaining this product.
If you encounter a problem with your Datalog X-PRO, review configuration information to verify that your selections are consistent with your application: input configurations; chosen limits; etc. If the problem persists after checking the above, you can get technical assistance on +57 (4) 2328381, Monday thru Friday, 7:00 a.m. to 5:00 p.m. Eastern Standard Time. You can also write to [email protected].
Specialized personnel will discuss your application case.
Please have the following information available:
➔ All Configuration Information ➔ All Provided Manuals ➔ Chip ID and Part list provided with the equipment.
Contact Information
To reach Datalog X-PRO manufacturer, refer to:
LATIN AMERICA:
Phone: +57 (4) 2328381
WhatsApp: +57 (317)4365062
Visit us: www.omicroning.co
www.omicroning.co 2 Oct. 2019
Index
Section 1: Quick Start Guide 4
1. Power the Datalog X-PRO: 4
2. Turn on the device: 4
3. Send data through Sigfox network: 5
3.1. Enter Service Mode: 5
3.2. Connect Datalog X-PRO to a Wi-Fi® network: 6
4. Enter to remote Monitoring Platform: 8
5. Review Device Dashboard on the Monitoring Platform: 9
6. Remote Configurator: 10
6.1. Access to the Dashboard Remote Configurator: 10
6.2. Enter the required information and save the configuration: 10
6.3. Remote Configurator Items: 11
6.4 Use the Remote Configurator: 12
Section 2: Troubleshoot 14
I can not force the device to send data: 14
I can not enter the remote Monitoring Platform: 14
After forcing the device to send data, I can not see updates on the platform: 14
www.omicroning.co 3 Oct. 2019
Section 1: Quick Start Guide This quick start guide is designed to quickly check the correct functioning of Datalog X-PRO;
even before being mounted. With the referred device it will be possible to measure multiple
sensors and variables, and then share the collected information to monitoring platform.
To follow this guide you will need:
● Datalog X-PRO 1.0. ● Magnet (provided by manufacturer).
● A device enabled for internet navigation (PC, Tablet, Smartphone, etc.).
● Sensors connected to Datalog X-PRO (optional).
1. Power the Datalog X-PRO: Datalog X-PRO is delivered from factory connected to its internal battery; with a minimum
battery level to test its operation.
Alternatively, to power Datalog X-PRO, you can connect it to a home electrical network
through its AC/DC adapter, or to a DC supply, as a solar panel.
2. Turn on the device: Datalog X-PRO is delivered turned off from factory. The device also shuts off when it is
disconnected from its power sources, or it is forced to do so after joining a magnet 10
seconds to its side furthest away from its antenna.
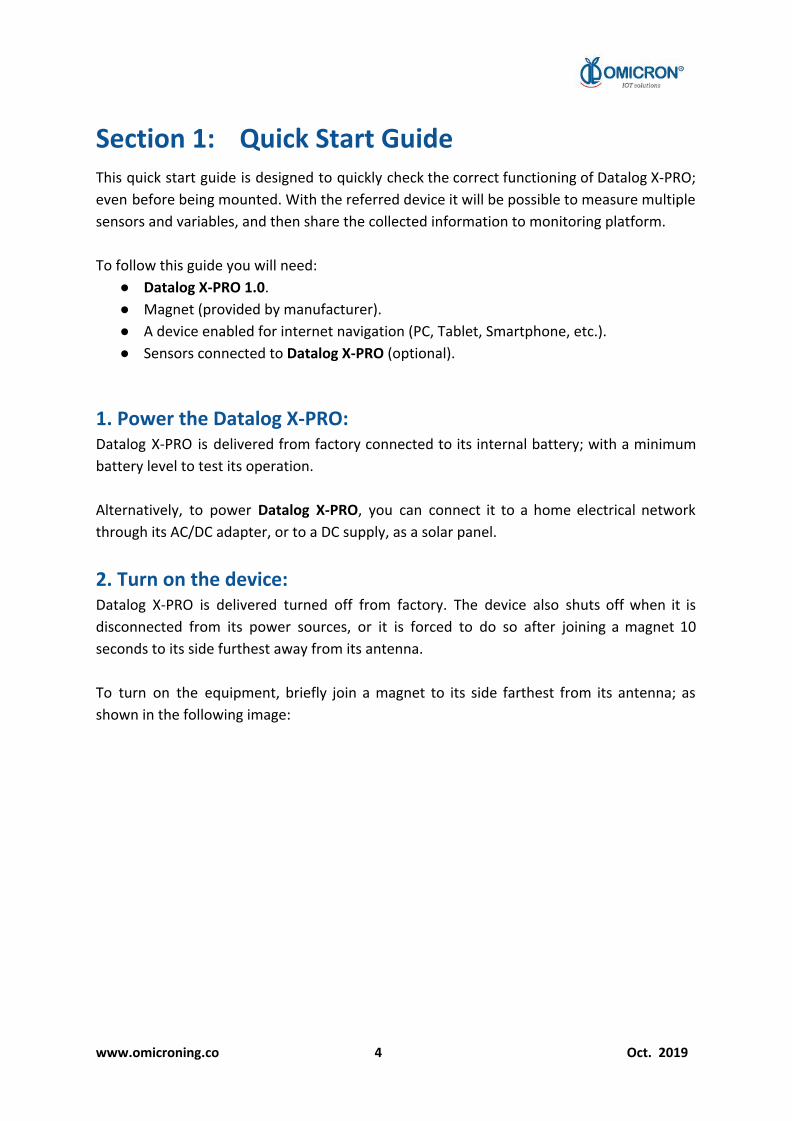
To turn on the equipment, briefly join a magnet to its side farthest from its antenna; as
shown in the following image:
www.omicroning.co 4 Oct. 2019
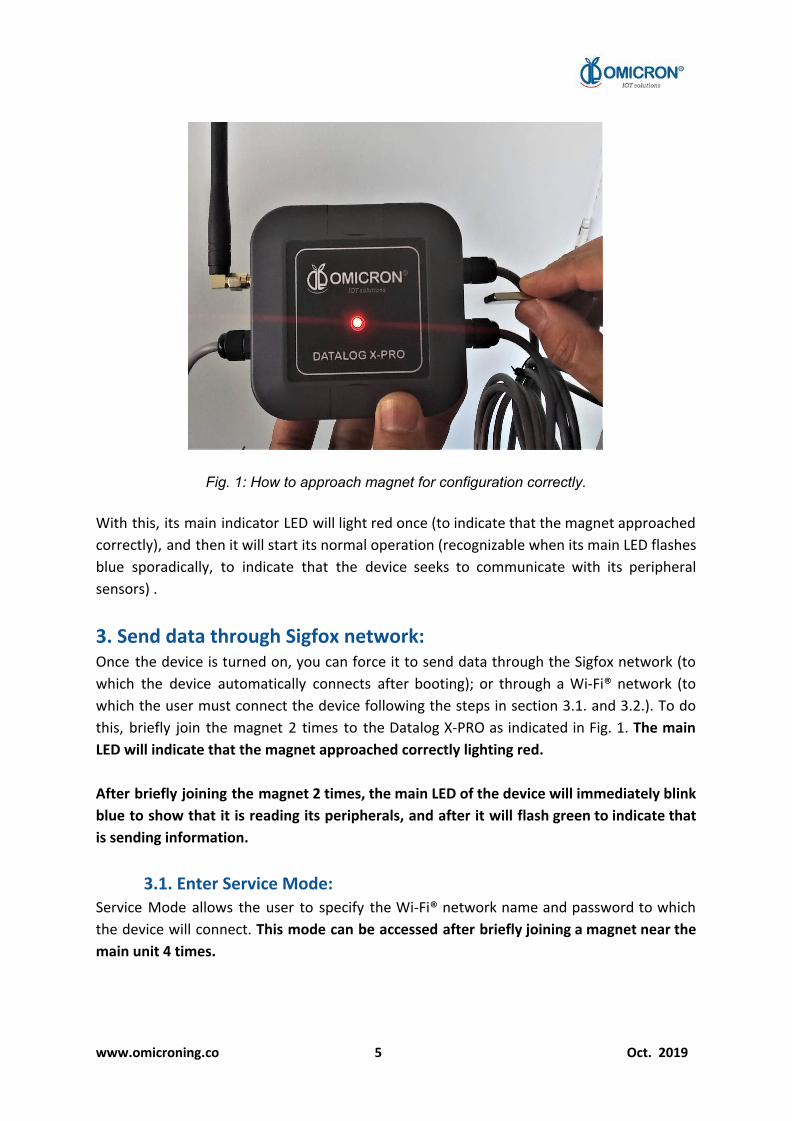
Fig. 1: How to approach magnet for configuration correctly.
With this, its main indicator LED will light red once (to indicate that the magnet approached
correctly), and then it will start its normal operation (recognizable when its main LED flashes
blue sporadically, to indicate that the device seeks to communicate with its peripheral
sensors) .
3. Send data through Sigfox network: Once the device is turned on, you can force it to send data through the Sigfox network (to
which the device automatically connects after booting); or through a Wi-Fi® network (to
which the user must connect the device following the steps in section 3.1. and 3.2.). To do
this, briefly join the magnet 2 times to the Datalog X-PRO as indicated in Fig. 1. The main
LED will indicate that the magnet approached correctly lighting red.
After briefly joining the magnet 2 times, the main LED of the device will immediately blink
blue to show that it is reading its peripherals, and after it will flash green to indicate that
is sending information.
3.1. Enter Service Mode: Service Mode allows the user to specify the Wi-Fi® network name and password to which
the device will connect. This mode can be accessed after briefly joining a magnet near the
main unit 4 times.
www.omicroning.co 5 Oct. 2019
After approaching the magnet as indicated, the visual indicator will light violet 4 times to
indicate that the device is about to enter Service Mode. Once the device has entered this
mode, the LED indicator will flash red every second.
In Service Mode, the built-in Wi-Fi® module of Datalog X-PRO generates a temporary
Wi-Fi® network (whose name is the prefix “IoTDevice_”, followed by Main Unit’s factory ID;
for example, “IoTDevice_bcddc212345”), to which a device suited for internet navigation
(such as a smartphone, or a PC) should connect.
Only after engaging to said network, a page with the IP address: 192.168.4.1 (whose
interface is shown in Fig. 2), can be accessed: there, a configuration menu will allow all
setups. It is possible to access the indicated page through any internet browser.
Fig. 2: Datalog X-PRO Configuration Home Page.
To quit Service Mode, hold a magnet close to the device one single time as in Fig. 1, and
wait for its main LED indicator to stop flashing red.
NOTE: Exit Service Mode only after making or reviewing the desired settings on the web interface with IP: 192.168.4.1.
3.2. Connect Datalog X-PRO to a Wi-Fi® network: To set the name of the network to which the device will connect, and its password, proceed
as follows:
www.omicroning.co 6 Oct. 2019
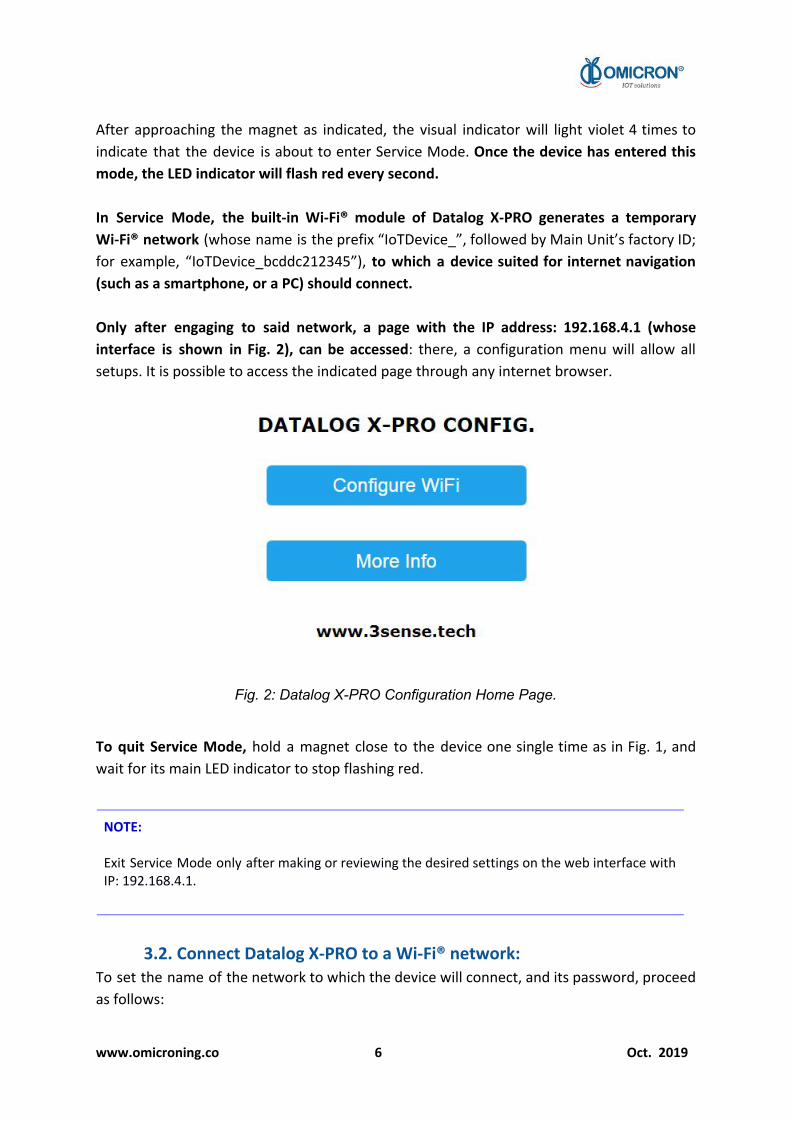
1. On the Home Page (Fig. 2), press the Configure Wi-Fi® button to be redirected to a
page where you can see a scan of Wi-Fi® networks detected by the device as
available, 2 input fields, and two buttons (Save and Scan).
The page that loads after selecting Configure Wi-Fi®, on Home Page, is presented in the
following image:
Fig. 3: Datalog X-PRO Wi-Fi® Configuration page.
2. In the fields at the bottom of the Configure Wi-Fi® page, enter the credentials (name
and password) of the network to which you want Datalog X-PRO to connect; then
press Save. If you want to connect the device to an open network, don’t enter a
password.
If the entered credentials are invalid, the next page will appear:
Fig. 4: Not Proper Wi-Fi® Configuration page.
Otherwise, you will see:
www.omicroning.co 7 Oct. 2019
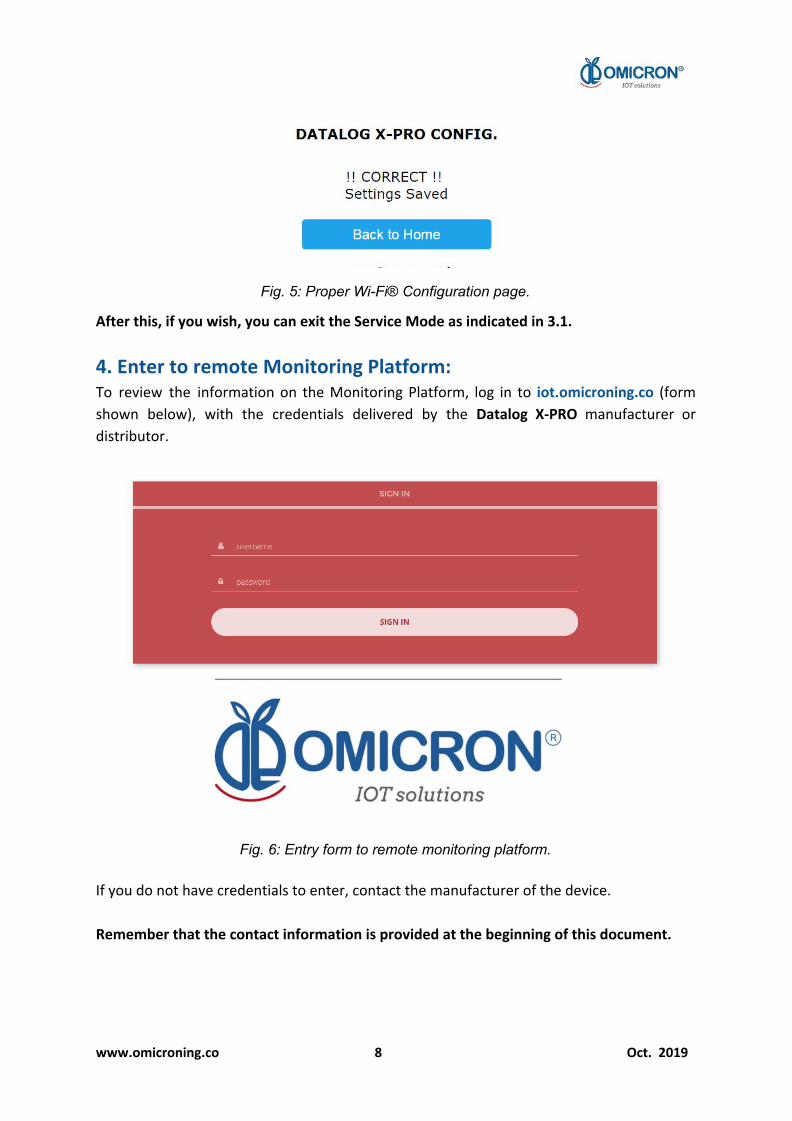
Fig. 5: Proper Wi-Fi® Configuration page.
After this, if you wish, you can exit the Service Mode as indicated in 3.1.
4. Enter to remote Monitoring Platform: To review the information on the Monitoring Platform, log in to iot.omicroning.co (form
shown below), with the credentials delivered by the Datalog X-PRO manufacturer or
distributor.
Fig. 6: Entry form to remote monitoring platform.
If you do not have credentials to enter, contact the manufacturer of the device.
Remember that the contact information is provided at the beginning of this document.
www.omicroning.co 8 Oct. 2019
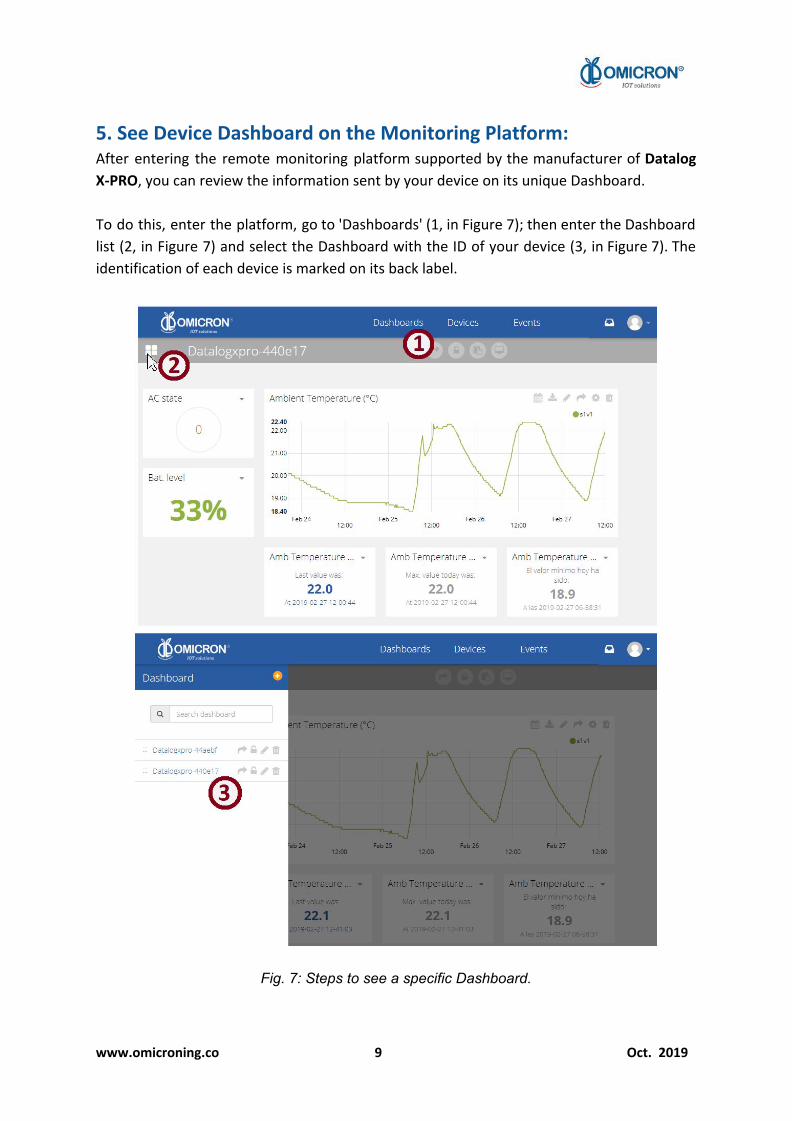
5. See Device Dashboard on the Monitoring Platform: After entering the remote monitoring platform supported by the manufacturer of Datalog
X-PRO, you can review the information sent by your device on its unique Dashboard.
To do this, enter the platform, go to 'Dashboards' (1, in Figure 7); then enter the Dashboard
list (2, in Figure 7) and select the Dashboard with the ID of your device (3, in Figure 7). The
identification of each device is marked on its back label.
Fig. 7: Steps to see a specific Dashboard.
www.omicroning.co 9 Oct. 2019
6. Remote Configurator: Users who make use of the remote monitoring platform offered by Omicron Eng., have
access to an interface that allows them to save configuration commands that the devices
download, once they are ready for it, and request them from the platform.
6.1. Access to the Dashboard Remote Configurator: Once you access the remote monitoring platform, you can go to the Dashboard named:
"Remote configurator". To do this, find and select the ‘Dashboards’ tab (1, in Figure 7); then
enter the list of Dashboards (2, in Figure 7) and select the Dashboard with the indicated
name (3, in Figure 7).
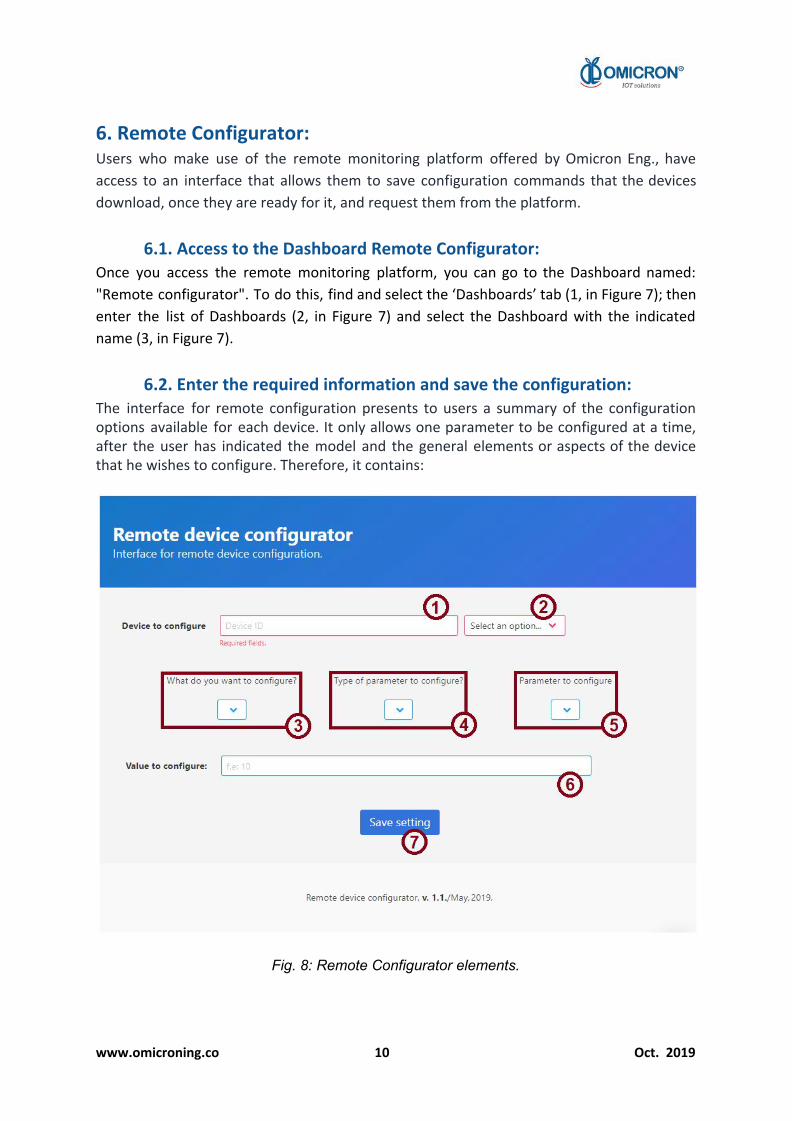
6.2. Enter the required information and save the configuration: The interface for remote configuration presents to users a summary of the configuration options available for each device. It only allows one parameter to be configured at a time, after the user has indicated the model and the general elements or aspects of the device that he wishes to configure. Therefore, it contains:
Fig. 8: Remote Configurator elements.
www.omicroning.co 10 Oct. 2019
6.3. Remote Configurator Items:
1. Field for device ID In this field, users must specify the UID of the device they wish to configure remotely. Said UID is printed on the back labels of the equipment; or it can be reviewed among the Device information stored by the platform (to do this, refer to point 2 of the Troubleshooting section).
2. Device type selector To select the model of the device to configure.
3. General aspect selector Here, the user must select the general aspect of the device you wish to configure.
4. Parameter type selector This list allows the user to specify the type of parameter to be configured, for the general aspect of the device chosen with selector 3.
5. Parameter selector Finally, this list shows the parameters available for configuration, according to what was chosen in lists 3 and 4.
6. Field for value to configure In this field, the user must specify the value he wants for the parameter to be configured, following the indications given by the interface.
7. Save command button Once the user has chosen the parameter that he wishes to configure, and has specified a configuration value, he must save the command on the platform so that the device downloads it once it is ready for it.
6.4 Use the Remote Configurator: To configure a parameter using the Remote Configurator, follow these steps: 1. Enter the identification information of the device to be configured in fields 1, and 2. 2. Select the parameter you want to configure using selection lists 3, 4 and 5. 3. Enter the value you wish to assign to the parameter to be configured, in field 6, following the indications that the interface presents over this field after choosing the parameter to be configured. 4. After selecting the parameter to be configured, and entering the value with which it will be configured; press the Save Command button. You will then be asked to confirm the action in a pop-up window; and in case the configuration is saved successfully, the page will display a message indicating it below the button. Pressing the button will not clear the information entered or selected, to make it easier to configure another device in the same way.
www.omicroning.co 11 Oct. 2019
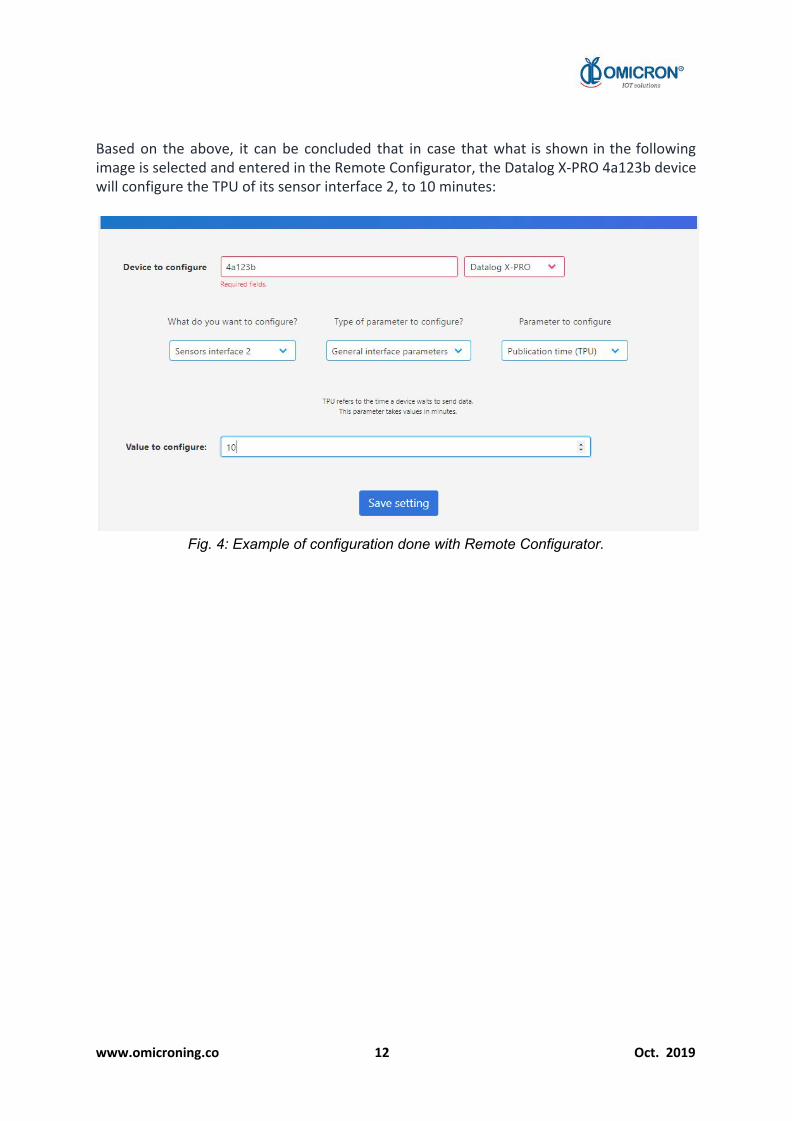
Based on the above, it can be concluded that in case that what is shown in the following image is selected and entered in the Remote Configurator, the Datalog X-PRO 4a123b device will configure the TPU of its sensor interface 2, to 10 minutes:
Fig. 4: Example of configuration done with Remote Configurator.
www.omicroning.co 12 Oct. 2019
Section 2: Troubleshoot
I can not force the device to send data: If the magnet is brought close to the device as many times as indicated to force it to send
data, but it does not behave as described in point 3, it is likely that you are not joining the
magnet with the frequency that is required. More detail, regarding how to force the device
to send data, can be observed in the video tutorial on how to force Datalog X-PRO to send
data through Sigfox or Wi-Fi®; provided by the manufacturer.
I can not enter the remote Monitoring Platform: To enter the remote Monitoring Platform, use the credentials provided by the manufacturer
exactly as they are given; i.e., if you get assigned an username or password with uppercase
characters: enter them as assigned.
If you verify that the username or password provided by the manufacturer does not allow
you to enter, ask the manufacturer to change it.
After forcing the device to send data, I can not see updates on the
platform: If after successfully forcing the device to send data (which can be checked by reviewing the
behavior of its main LED, and verifying that corresponds to what is described in 3), you can
not see updates on its Dashboard; do the following:
Verify that the device is configured for the appropriate Sigfox zone
Datalog X-PRO devices can be configured to connect to Sigfox networks in two
zones. If a device is configured for networks in an area that does not correspond to
the one in which the device is located, it won't send data.
The zones that correspond to the different territories in which Sigfox operates are:
USA, Mexico, Brazil: Sigfox Zone 2. Latin America and Australia: Sigfox Zone 4.
To change the device zone configuration, briefly join a magnet to Datalog X-PRO 10
times; after this, its main LED will respond blinking purple several times; and after it,
it will blink green (to indicate that is configuring the module). If it flashes purple 2
times (and after, green), the device has been set to work for Zone 2; otherwise, if it
flashes 4 times (and after, green), the device has been configured to work for Zone 4.
www.omicroning.co 13 Oct. 2019
Contact manufacturer
If after correctly configuring the Sigfox Zone for which your Datalog X-PRO operates,
you still can not force it to update data on the platform; contact the manufacturer.
Remember that contact information provided at the beginning of this document.
www.omicroning.co 14 Oct. 2019

www.omicroning.co 15 Oct. 2019


![Datalog: Bag Semantics via Set Semantics - arXiv · Datalog±share these properties: for instance, guarded [8], sticky and weakly-sticky [11] Datalog ± only allow restricted forms](https://img.pdfslide.us/doc/110x75/5e7e36effe39a8678f12fd4f/datalog-bag-semantics-via-set-semantics-arxiv-datalogshare-these-properties.jpg)