Embed Size (px)
Citation preview

Database Systems Journal vol. VI, no. 4/2015 1
Database Systems Journal BOARD
Director Prof. Ion Lungu, PhD, University of Economic Studies, Bucharest, Romania
Editors-in-Chief Prof. Adela Bara, PhD, University of Economic Studies, Bucharest, Romania Prof. Marinela Mircea, PhD, University of Economic Studies, Bucharest, Romania
Secretaries Conf. Iuliana Botha, PhD, University of Economic Studies, Bucharest, Romania Lect. Anda Velicanu, PhD, University of Economic Studies, Bucharest, Romania
Editorial Board Prof. Ioan Andone, PhD, A.I.Cuza University, Iasi, Romania Prof. Anca Andreescu, PhD, University of Economic Studies, Bucharest, Romania Prof. Emil Burtescu, PhD, University of Pitesti, Pitesti, Romania Joshua Cooper, PhD, Hildebrand Technology Ltd., UK Prof. Marian Dardala, PhD, University of Economic Studies, Bucharest, Romania Prof. Dorel Dusmanescu, PhD, Petrol and Gas University, Ploiesti, Romania Prof. Marin Fotache, PhD, A.I.Cuza University, Iasi, Romania Dan Garlasu, PhD, Oracle Romania Prof. Marius Guran, PhD, University Politehnica of Bucharest, Bucharest, Romania Lect. Ticiano Costa Jordão, PhD-C, University of Pardubice, Pardubice, Czech Republic Prof. Brijender Kahanwal, PhD, Galaxy Global Imperial Technical Campus, Ambala, India Prof. Dimitri Konstantas, PhD, University of Geneva, Geneva, Switzerland Prof. Hitesh Kumar Sharma, PhD, University of Petroleum and Energy Studies, India Prof. Mihaela I.Muntean, PhD, West University, Timisoara, Romania Prof. Stefan Nithchi, PhD, Babes-Bolyai University, Cluj-Napoca, Romania Prof. Corina Paraschiv, PhD, University of Paris Descartes, Paris, France Davian Popescu, PhD, Milan, Italy Prof. Gheorghe Sabau, PhD, University of Economic Studies, Bucharest, Romania Prof. Nazaraf Shah, PhD, Coventry University, Coventry, UK Prof. Ion Smeureanu, PhD, University of Economic Studies, Bucharest, Romania Prof. Traian Surcel, PhD, University of Economic Studies, Bucharest, Romania Prof. Ilie Tamas, PhD, University of Economic Studies, Bucharest, Romania Silviu Teodoru, PhD, Oracle Romania Prof. Dumitru Todoroi, PhD, Academy of Economic Studies, Chisinau, Republic of Moldova Prof. Manole Velicanu, PhD, University of Economic Studies, Bucharest, Romania Prof. Robert Wrembel, PhD, University of Technology, Poznan, Poland
Contact Calea Dorobanţilor, no. 15-17, room 2017, Bucharest, Romania Web: http://dbjournal.ro E-mail: [email protected]; [email protected]

2 Database Systems Journal vol. VI, no. 4/2015
CONTENTS
NoSQL Key-Value DBs Riak and Redis ................................................................................ 3 Cristian Andrei BARON
Boarding to Big data .............................................................................................................. 11 Oana Claudia BRATOSIN
The Importance of Data Warehouses in the Development of Computerized Decision Support Solutions. A Comparison between Data Warehouses and Data Marts ............. 18
Alexandru Adrian ȚOLE
Optimizing memory use in Java applications, garbage collectors..................................... 27 Ștefan PREDA
Data mining in healthcare: decision making and precision ............................................... 33 Ionuț ȚĂRANU

Database Systems Journal vol. VI, no. 4/2015 3
NoSQL Key-Value DBs Riak and Redis
Cristian Andrei BARON University of Economic Studies, Bucharest, Romania
In the context of today’s business needs we must focus on the NoSQL databases because they are the only alternative to the RDBMS that can resolve the modern problems related to storing different data structures, processing continue flows of data and fault tolerance. The object of the paper is to explain the NoSQL databases, the needs behind their appearance, the different types of NoSQL databases that current exist and to focus on two key-value databases, Riak and Redis. Keywords: NoSQL Databases, Key-Value, Riak, Redis, RDBMS
Introduction Nowadays, we talk more and more about NoSQL (Not Only SQL)
databases because we are dealing with very large volumes of information from different sources that have to be stored and analyzed in real time. For the last decades, the relational model has been the first and maybe for some times the only viable solution for both small and big companies. In the last years some of the biggest Internet companies such as Google, Facebook and Amazon have invested a lot of money in developing alternative solutions for the RDBMS to fulfill their needs. We don’t consider that the RDBMS will disappear in the future years because there is a strong community based on this type of databases, and big companies that are using enterprise applications will continue to use RDBMS mostly because of the support that the RDBMS vendors are offering. But a big part of the rest of companies and individuals will search to discover alternatives options, like schema-less, high availability, MapReduce, alternative data structures and horizontal scaling that are supported by the various types of NoSQL databases. When a new application that will need a storing and retrieval data mechanism, begins to be developed, we should first analyze deeply the business needs of the enterprise, the structure, amount and speed of the data that will be managed
and decide if we will proceed with the standard RDBMS or we will choose a type or a combination of NoSQL data store types. The NoSQL databases are divided in a variety of genres, many of them are part of one of these major categories: key-value, wide column, graph, and document-based. It is important to learn for what kinds of problems they are best suited, what aspects they resolve that the RDBMS cannot, if they are focused on flexible schemas and querying mechanism or they are focused on storing large amounts of data across several machines. When choosing the correct NoSQL database there are several questions that we must answer. First one refers to the way that you can talk to the database, this means that you must check the variety of connections, if it has or not a command-line interface, in what programming language is written (C, Erlang, JavaScript) and what protocols it supports (REST, Thrift). A second question can refer to the aspects that make the NoSQL database unique, some can allow querying on arbitrary fields; others can provide indexing for rapid lookup or support ad hoc queries. The last questions can refer to performance and scalability; this aspects are in strong relationship with the unique qualities of NoSQL databases because sometimes we may be constrained to give up from performance or scalability in order to enjoy some unique functionality. Aspects related to performance may include supporting
1
4 NoSQL Key-Value DBs Riak and Redis
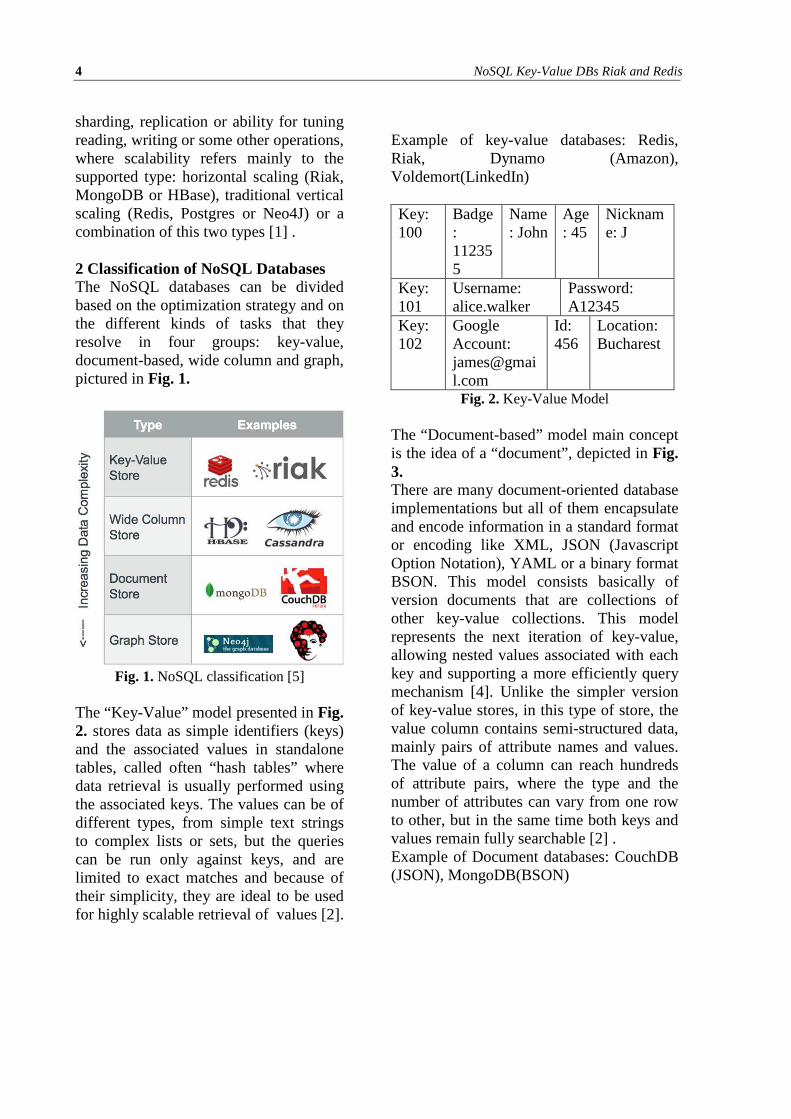
sharding, replication or ability for tuning reading, writing or some other operations, where scalability refers mainly to the supported type: horizontal scaling (Riak, MongoDB or HBase), traditional vertical scaling (Redis, Postgres or Neo4J) or a combination of this two types [1] . 2 Classification of NoSQL Databases The NoSQL databases can be divided based on the optimization strategy and on the different kinds of tasks that they resolve in four groups: key-value, document-based, wide column and graph, pictured in Fig. 1.
Fig. 1. NoSQL classification [5]
The “Key-Value” model presented in Fig. 2. stores data as simple identifiers (keys) and the associated values in standalone tables, called often “hash tables” where data retrieval is usually performed using the associated keys. The values can be of different types, from simple text strings to complex lists or sets, but the queries can be run only against keys, and are limited to exact matches and because of their simplicity, they are ideal to be used for highly scalable retrieval of values [2].
Example of key-value databases: Redis, Riak, Dynamo (Amazon), Voldemort(LinkedIn) Key: 100
Badge: 112355
Name: John
Age: 45
Nickname: J
Key: 101
Username: alice.walker
Password: A12345
Key: 102
Google Account: [email protected]
Id: 456
Location: Bucharest
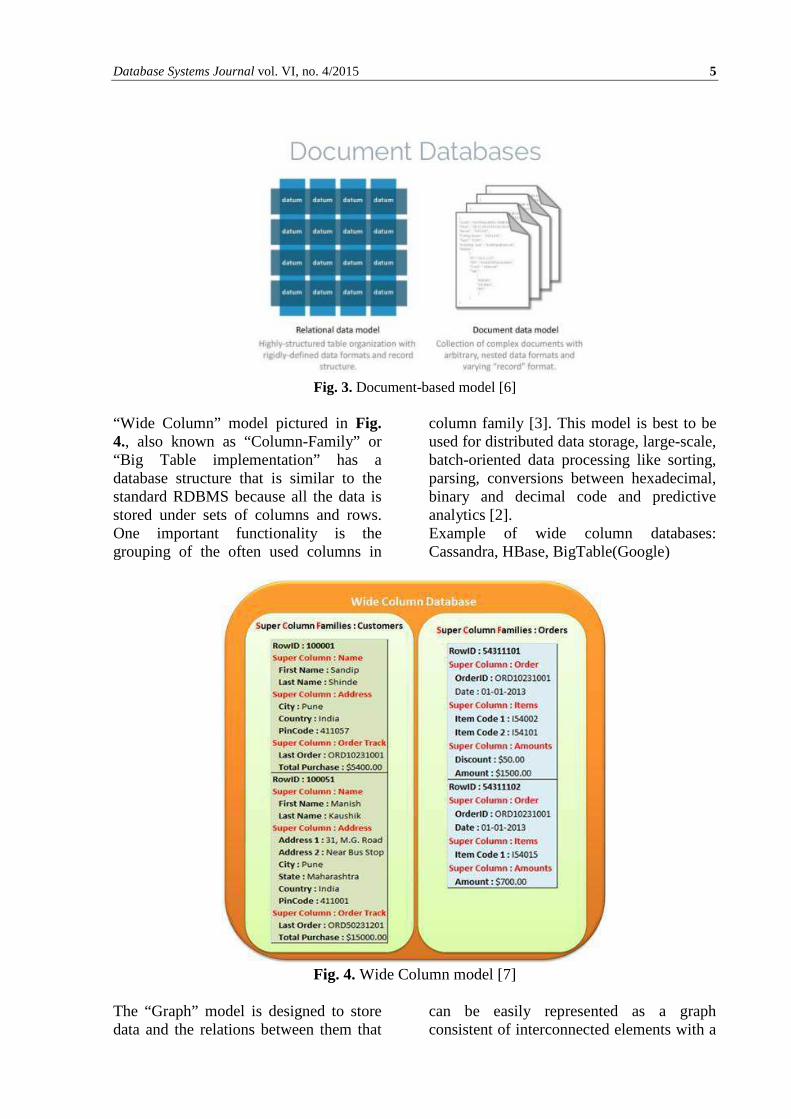
Fig. 2. Key-Value Model The “Document-based” model main concept is the idea of a “document”, depicted in Fig. 3. There are many document-oriented database implementations but all of them encapsulate and encode information in a standard format or encoding like XML, JSON (Javascript Option Notation), YAML or a binary format BSON. This model consists basically of version documents that are collections of other key-value collections. This model represents the next iteration of key-value, allowing nested values associated with each key and supporting a more efficiently query mechanism [4]. Unlike the simpler version of key-value stores, in this type of store, the value column contains semi-structured data, mainly pairs of attribute names and values. The value of a column can reach hundreds of attribute pairs, where the type and the number of attributes can vary from one row to other, but in the same time both keys and values remain fully searchable [2] . Example of Document databases: CouchDB (JSON), MongoDB(BSON)
Database Systems Journal vol. VI, no. 4/2015 5
Fig. 3. Document-based model [6]
“Wide Column” model pictured in Fig. 4., also known as “Column-Family” or “Big Table implementation” has a database structure that is similar to the standard RDBMS because all the data is stored under sets of columns and rows. One important functionality is the grouping of the often used columns in
column family [3]. This model is best to be used for distributed data storage, large-scale, batch-oriented data processing like sorting, parsing, conversions between hexadecimal, binary and decimal code and predictive analytics [2]. Example of wide column databases: Cassandra, HBase, BigTable(Google)
Fig. 4. Wide Column model [7]
The “Graph” model is designed to store data and the relations between them that
can be easily represented as a graph consistent of interconnected elements with a
6 NoSQL Key-Value DBs Riak and Redis
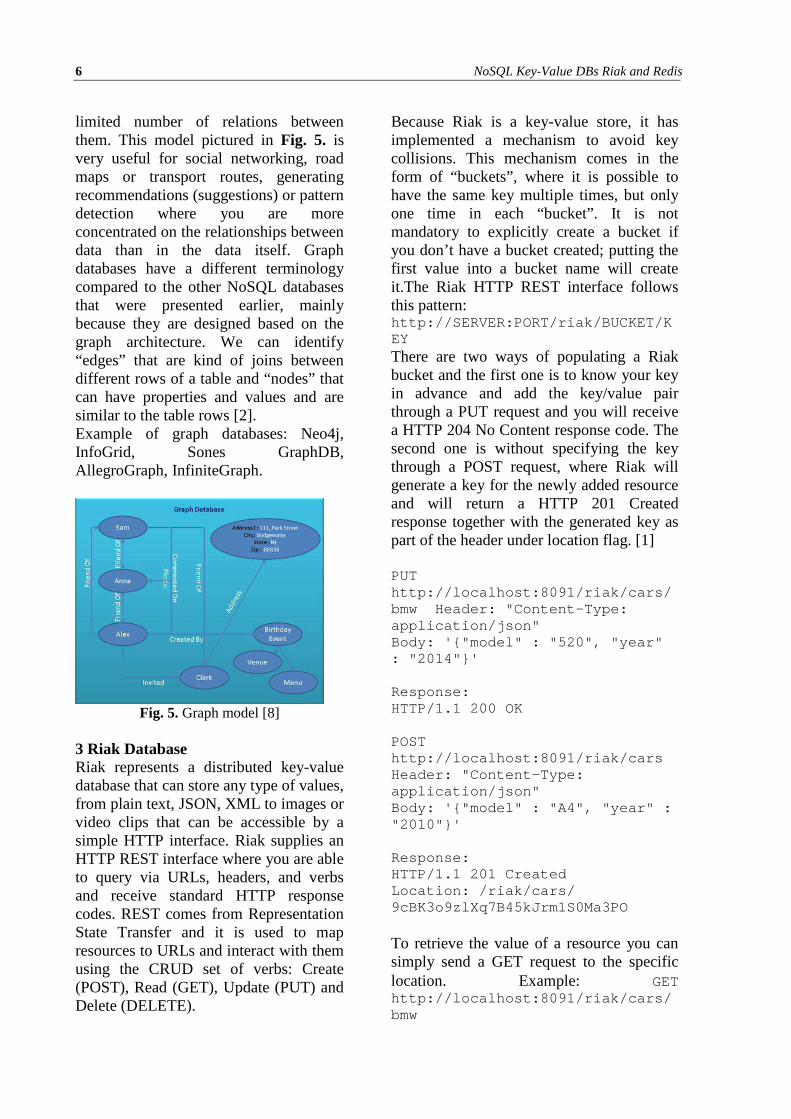
limited number of relations between them. This model pictured in Fig. 5. is very useful for social networking, road maps or transport routes, generating recommendations (suggestions) or pattern detection where you are more concentrated on the relationships between data than in the data itself. Graph databases have a different terminology compared to the other NoSQL databases that were presented earlier, mainly because they are designed based on the graph architecture. We can identify “edges” that are kind of joins between different rows of a table and “nodes” that can have properties and values and are similar to the table rows [2]. Example of graph databases: Neo4j, InfoGrid, Sones GraphDB, AllegroGraph, InfiniteGraph.
Fig. 5. Graph model [8]
3 Riak Database Riak represents a distributed key-value database that can store any type of values, from plain text, JSON, XML to images or video clips that can be accessible by a simple HTTP interface. Riak supplies an HTTP REST interface where you are able to query via URLs, headers, and verbs and receive standard HTTP response codes. REST comes from Representation State Transfer and it is used to map resources to URLs and interact with them using the CRUD set of verbs: Create (POST), Read (GET), Update (PUT) and Delete (DELETE).
Because Riak is a key-value store, it has implemented a mechanism to avoid key collisions. This mechanism comes in the form of “buckets”, where it is possible to have the same key multiple times, but only one time in each “bucket”. It is not mandatory to explicitly create a bucket if you don’t have a bucket created; putting the first value into a bucket name will create it.The Riak HTTP REST interface follows this pattern: http://SERVER:PORT/riak/BUCKET/KEY There are two ways of populating a Riak bucket and the first one is to know your key in advance and add the key/value pair through a PUT request and you will receive a HTTP 204 No Content response code. The second one is without specifying the key through a POST request, where Riak will generate a key for the newly added resource and will return a HTTP 201 Created response together with the generated key as part of the header under location flag. [1] PUT http://localhost:8091/riak/cars/bmw Header: "Content-Type: application/json" Body: '{"model" : "520", "year" : "2014"}' Response: HTTP/1.1 200 OK POST http://localhost:8091/riak/cars Header: "Content-Type: application/json" Body: '{"model" : "A4", "year" : "2010"}' Response: HTTP/1.1 201 Created Location: /riak/cars/ 9cBK3o9zlXq7B45kJrm1S0Ma3PO To retrieve the value of a resource you can simply send a GET request to the specific location. Example: GET http://localhost:8091/riak/cars/bmw

Database Systems Journal vol. VI, no. 4/2015 7
To remove a key/value pair, simply send a DELETE request to the specific location and you will receive a HTTP 204 response code in case of success or a HTTP 404 in the case of error. Example:DELETE http://localhost:8091/riak/cars/bmw Riak databases introduce the “Links” concept in order to support relations between keys. A “Link” is a metadata that associates multiple keys and it consist of two parts: the key where the value links to, and a string tag describing how the link relates to this value. (Link: </riak/bucket/key>; riaktag="contains")
PUT http://localhost:8091/riak/dealer/bmwShop
Header: "Content-Type: application/json" ”Link: </riak/cars/bmw>; riaktag="contains")” Body: '{"cars" : "20", "address" : "Bucharest, Street Paris, Number 10"}'
MapReduce is an algorithm and a programming model to process and generate large data sets. The associated implementation breaks the problem into two parts. The first part is to specify a map() function that can process a key/value pair to generate a set of intermediate key/value pairs and the second part is a reduce() function that converts the second list of intermediate key/value pairs into one or more scalar values [9]. Following this pattern, Riak allows a system to divide tasks into smaller components and run them across a massive cluster of servers in parallel. When it comes to availability and scalability, Riak exceeds some of the RDBMS such as MySQL and document databases like CouchDB, maintaining
replication of data on a number of its nodes, controlled by a value called the N-Value. By default for Riak the value of N is 3 for all the nodes, which means that Riak will replicate all the information for three times, but with Riak this value can be overridden on each bucket. Riak databases are designed to be used as distributed systems and by adding nodes to the cluster, the data read and write, as well as the execution of the map/reduce queries will be faster [10]. 4 Redis database Redis database if part of the Key-Value NoSQL database group that supports data structures more advanced than the Riak database, but less than a document-oriented database and it supports a set-based query operations. It is one of the fastest NoSQL databases trading durability over speed. Redis can be considered more a toolkit of useful data structure algorithms than an ordinary member of a database group because it contains a list of processes and functionalities like a blocking queue or stack, a publisher-subscriber system and a list of configurable features as expiry policies, durability levels and replication options [1]. In Redis, the operations to create and update data are made using the SET and MSET keywords. The syntax follows this patterns: SET <key> <value> or MSET <key1> <value1> <key2> <value2>. MSET keyword is used to specify a multiple set operation provided by Redis for reducing the traffic. In the case of successful adding or updating the data, the Redis server will respond with an “OK” message. Example: “SET bmw 320i” vs “MSET bmw 320i audi A4” For data retrieval we have the counterpart keywords GET and MGET using the following syntax: “GET <key> ” vs “MGET <key1> <key2> ” Redis can store not only string text values but also numeric ones and will recognize integers and will provide some simple operations for them, like INCR/INCRBY
8 NoSQL Key-Value DBs Riak and Redis
(increment / increment by) and DECR/DECRBY (decrement /decrement by). In comparison to Riak, the previous key-value database type presented, Redis add the transaction concept using the MULTI block atomic commands that offer the possibility to execute multiple operations like SET or INCR in a single block that will complete either successfully or not at all. Different from the traditional transaction concept from RDBMS, in Redis when it is decided to stop a transaction with the DISCARD command there will be no rollback triggered and no reverts in the database because the commands will not have been executed. The effects are the same, even though there is a different mechanism (transaction rollback vs operation cancellation). Redis popularity does not rise from running operations with simple types like text strings or integers, but from processing operations with complex data types as lists, hashes, sets and sorted sets over a huge number of values up to 232 elements per each key. Hashes can take
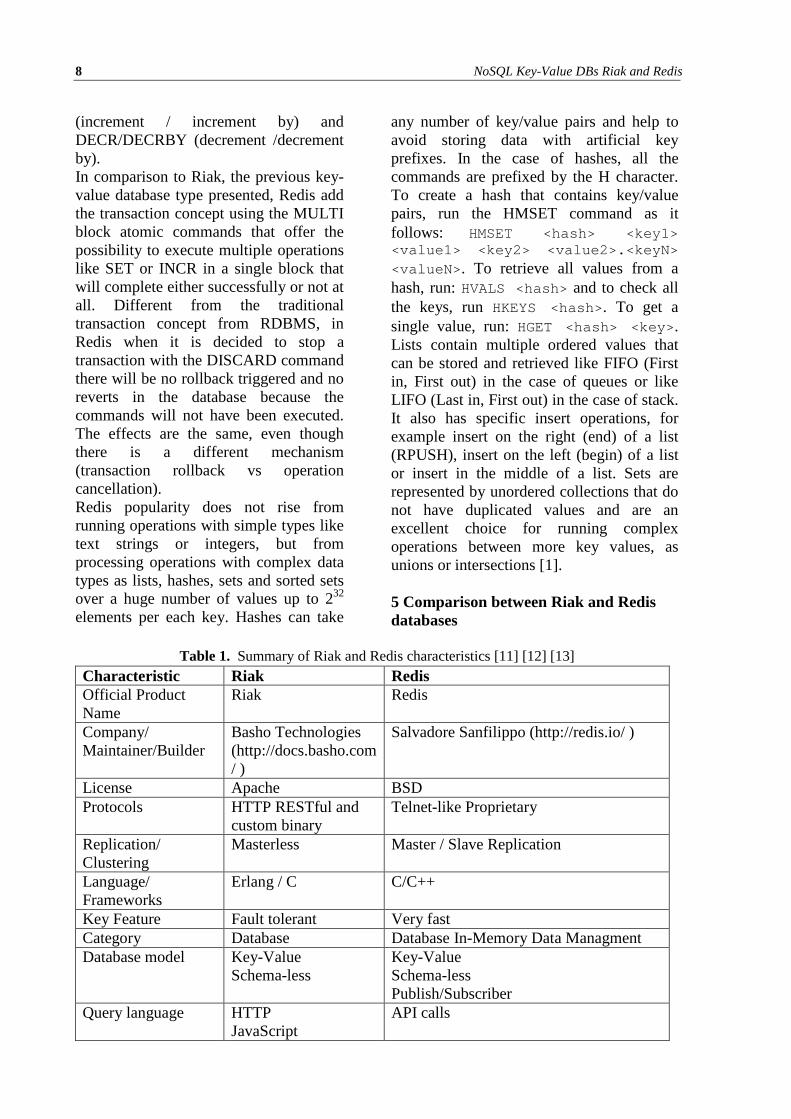
any number of key/value pairs and help to avoid storing data with artificial key prefixes. In the case of hashes, all the commands are prefixed by the H character. To create a hash that contains key/value pairs, run the HMSET command as it follows: HMSET <hash> <key1> <value1> <key2> <value2>.<keyN> <valueN> . To retrieve all values from a hash, run: HVALS <hash> and to check all the keys, run HKEYS <hash> . To get a single value, run: HGET <hash> <key> . Lists contain multiple ordered values that can be stored and retrieved like FIFO (First in, First out) in the case of queues or like LIFO (Last in, First out) in the case of stack. It also has specific insert operations, for example insert on the right (end) of a list (RPUSH), insert on the left (begin) of a list or insert in the middle of a list. Sets are represented by unordered collections that do not have duplicated values and are an excellent choice for running complex operations between more key values, as unions or intersections [1]. 5 Comparison between Riak and Redis databases
Table 1. Summary of Riak and Redis characteristics [11] [12] [13]
Characteristic Riak Redis Official Product Name
Riak Redis
Company/ Maintainer/Builder
Basho Technologies (http://docs.basho.com/ )
Salvadore Sanfilippo (http://redis.io/ )
License Apache BSD Protocols HTTP RESTful and
custom binary Telnet-like Proprietary
Replication/ Clustering
Masterless Master / Slave Replication
Language/ Frameworks
Erlang / C C/C++
Key Feature Fault tolerant Very fast Category Database Database In-Memory Data Managment Database model Key-Value
Schema-less Key-Value Schema-less Publish/Subscriber
Query language HTTP JavaScript
API calls

Database Systems Journal vol. VI, no. 4/2015 9
REST Erlang
Data types Binary/Data structures/JSON
Data structures
MapReduce Yes No ACID properties CID (Consistency,
Isolation and Durability)
ACID(Atomicity, Consistency, Isolation and Durability)
Transactions No Yes Server operating systems
Linux, OS X, BSD, Linux, OS X, Windows
Has hashes, sets and lists
No Yes
Buckets Yes No Best for High availability,
Partition tolerance, Persistence
For rapidly changing data, Frequently written, rarely read statistical data
Table 1 describes the comparisons between the main characteristics of two key-value database types: Riak vs Redis. It can be observed the programming language they are written in, Erlang/C for Riak and C/C++ for Redis, the main protocols used to communicate; Riak is using a more friendly HTTP RESTful interface. The main features of both databases are presented, Riak excels at high availability, partition tolerance and on the other hand Redis is well known as very fast database used in scenarios where we have rapidly changing data. 5 Conclusions Even if NoSQL databases have been present in our business from some years they are still in a continuing development process, mainly because of the problem’s that the real world is having managing real-time data flows that are evolving every day. We are living in some interesting days where many new products, devices are invented each day and devices produce new data with some new structures that have to be stored in some database. This structures will probably be stored in a well-known NoSQL database or a new model will be developed to fulfill the needs of the modern life.
The key-value model of NoSQL databases can resolve most of the actual common problems to store data, provide functionalities like schema-less, MapReduce and high availability. Redis and Riak databases are two of the most popular key-value NoSQL databases. Redis is the type that you choose when you need to move data with fast speed but it is not the ideal solution when you store data. On the other hand, Riak is not so fast but is fault tolerant, maintains the integrity of data and supports tuning for writes and reads [11]. When choosing the right type of key-value database you have to analyze first the business requirements that you need to fulfill and then properly analyze the unique functionalities of each type of database. References [1] Eric Redmond, Jim R. Wilson.
“ Seven Databases in Seven Weeks, A Guide to Modern Databases and the NoSQL Movement”. Dallas, Texas, North Carolina: The Pragmatic Bookshelf, May 2012. pp. 1-7, 51-99,261-307. ISBN-13:978-1-93435-692-0.
[2] A.B.M. Moniruzzaman, Syed Akther Hossain, NoSQL Database:
10 NoSQL Key-Value DBs Riak and Redis
New Era of Databases for Big data Analytics - Classification, Characteristics and Comparison, International Journal of Database Theory and Application Vol. 6, No. 4. 2013.
[3] Veronika Abramova , Jorge Bernardino, Pedro Furtado, Experimental Evaluation Of NoSQL Databases, International Journal of Database Management Systems ( IJDMS ) Vol.6, No.3, June 2014
[4] A SHORT HISTORY OF DATABASES: FROM RDBMS TO NOSQL & BEYOND. www.3pillarglobal.com.[Read: 16 April 2016.] http://www.3pillarglobal.com/insights/short-history-databases-rdbms-nosql-beyond.
[5] NOSQL DATABASES. www.sqrrl.com.[Read: 15 April 2016.] https://sqrrl.com/product/nosql/
[6] Mahdi Atawneh, “01 NoSql and multi model database”, http://www.slideshare.net/MahdiAtawneh. [Read: 15 April 2016.] http://www.slideshare.net/MahdiAtawneh/01-nosql-and-multi-model-database
[7] Sandip Shinde, “What is Wide Column Stores?”, SQL Server Business Intelligence and Big Data, [Read: 16 April 2016.], https://bi-bigdata.com/2013/01/13/what-is-wide-column-stores/
[8] Sandip Shinde,” What is Graph Databases?”, SQL Server Business
Intelligence and Big Data, [Read: 16 April 2016.], https://bi-bigdata.com/2013/01/14/what-is-graph-databases/
[9] Jeffrey Dean, Sanjay Ghemawat, “MapReduce: Simplified Data Processing on Large Clusters”, Google Research Publications, http://research.google.com/archive/mapreduce.html
[10] Yousaf Muhammad, “Evaluation and Implementation of Distributed NoSQL Database for MMO Gaming Environment”, October 2011, Department of Information Technology, http://www.diva-portal.org/smash/get/diva2:447210/FULLTEXT01.pdf
[11] “Not So Versus, Riak Versus Redis”, https://compositecode.com/, [Read: 16 April 2016.], https://compositecode.com/2013/02/10/riak-redis/
[12] Riak vs Redis, http://vschart.com/ [Read: 16 April 2016.], http://vschart.com/compare/riak/vs/redis-database
[13] Ahmed Oussous , Fatima-Zahra Benjelloun , Ayoub Ait Lahcen , Samir Belfkih, Comparison and Classification of NoSQL Databases for Big Data., [Read: 16 April 2016.], https://www.researchgate.net/profile/Ayoub_Ait_Lahcen/publication/278963532_Comparison_and_Classication_of_NoSQL_Databases_for_Big_Data/links/55880d3408ae65ae5a4dfa26.pdf
Cristian Andrei Baron has graduated the Faculty of Economic Cybernetics, Statistic and Informatics of the Bucharest University of Economic Studies in 2011. In 2013, he graduated the master program “Economic Informatics” at Faculty of Economic Cybernetics, Statistic and Informatics of the Bucharest University of Economic Studies. At present he is studying for the doctor's degree at the Academy of Economic Studies from Bucharest.

Database Systems Journal vol. VI, no. 4/2015 11
Boarding to Big data
Oana Claudia BRATOSIN University of Economic Studies, Bucharest, Romania
Today Big data is an emerging topic, as the quantity of the information grows exponentially, laying the foundation for its main challenge, the value of the information. The information value is not only defined by the value extraction from huge data sets, as fast and optimal as possible, but also by the value extraction from uncertain and inaccurate data, in an innovative manner using Big data analytics. At this point, the main challenge of the businesses that use Big data tools is to clearly define the scope and the necessary output of the business so that the real value can be gained. This article aims to explain the Big data concept, its various classifications criteria, architecture, as well as the impact in the world wide processes. Keywords: Big data, Predictive Analytics, Data mining, Internet of Things
Introduction Doug Laney introduced the big data concept by using the 3V model,
Volume, Velocity and Variety, concept extended a few years later to 7V. Data volume is getting more and more wider, generating this way an inverse connection with the data value, which decreases as much as data volume increases. The velocity that that the data is extracted and transformed to information turns out to be one of the most competitive attribute that makes the difference between the Big data tools. The last big attribute, variety, stands on the multiple and various data sources, with incompatible data format and unsubstantial data format. [1] Next to the three previously described attributes for Big data, it follows the value and veracity of data. Now the model is extended to 5V, but it lays on some elements described on the first attributes. The veracity is defined by three main characteristics, the first one is represented by quality, consistency and data accuracy. Next come the source and data origins and the last one is represented by the purpose of using data. [2] The last extension of the model comes
from the variability of the data sense and from the visualization, as the information derived from data must be understood properly and as fast as possible. This attributes generate a lot of implications of Big data over all the companies as they define the last level of data accuracy. [3] 2 Big data classification There are different criteria to classify Big data, but the most meaningful ones are the analysis type, processing methodology, content format and data sources. Besides these, Big data can be classified also by data frequency, data type, data consumers or even by the hardware. [4] The analysis type defines the velocity attribute of Big data and it stands on the data processing system, divided in three categories grounding on time criteria. The first one, real time processing, is defined as a synchronous process where an input request is sent, processed and an output response is received immediately after the processing is completely finished. Significant examples about this processing type are the bank ATMs, radar systems, fraud detection or customer care services, as here an instant processing is completely needful. Near real-time processing stands right next to real time processing, with the difference
1
12 Boarding to Big Data
of the time unit. Here, the processing time is managed in minutes, while in real time it leads to seconds. An example of near real-time processing is the operational intelligence to run query analysis on real data. The batch processing is managed by
batch jobs that can run up to several hours, even days. The process starts first with data retrieval, then the data is processed and finally it is sent to output. Most of the payroll and billing operations are managed at the end of the month or year through batch processing.
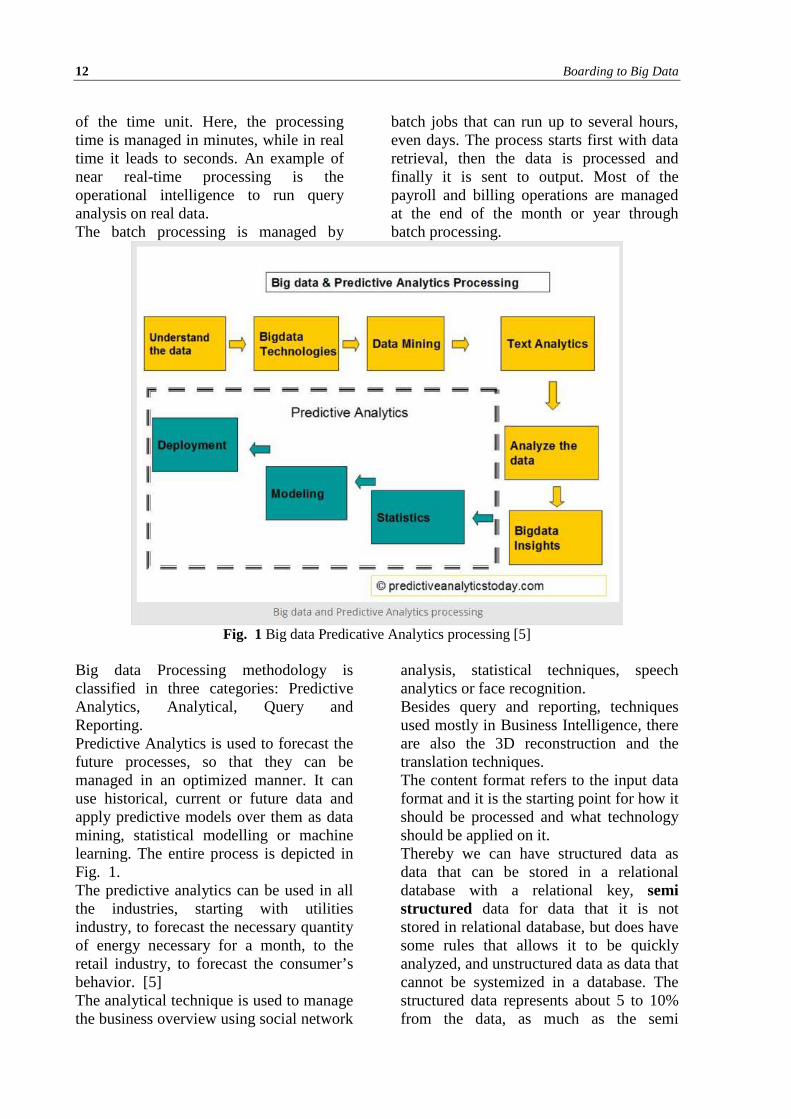
Fig. 1 Big data Predicative Analytics processing [5]
Big data Processing methodology is classified in three categories: Predictive Analytics, Analytical, Query and Reporting. Predictive Analytics is used to forecast the future processes, so that they can be managed in an optimized manner. It can use historical, current or future data and apply predictive models over them as data mining, statistical modelling or machine learning. The entire process is depicted in Fig. 1. The predictive analytics can be used in all the industries, starting with utilities industry, to forecast the necessary quantity of energy necessary for a month, to the retail industry, to forecast the consumer’s behavior. [5] The analytical technique is used to manage the business overview using social network
analysis, statistical techniques, speech analytics or face recognition. Besides query and reporting, techniques used mostly in Business Intelligence, there are also the 3D reconstruction and the translation techniques. The content format refers to the input data format and it is the starting point for how it should be processed and what technology should be applied on it. Thereby we can have structured data as data that can be stored in a relational database with a relational key, semi structured data for data that it is not stored in relational database, but does have some rules that allows it to be quickly analyzed, and unstructured data as data that cannot be systemized in a database. The structured data represents about 5 to 10% from the data, as much as the semi

Database Systems Journal vol. VI, no. 4/2015 13
structured data. Examples of semi-structured data are the CSV files, XML files, NoSQL databases. The rest of the data, about 80% is own by the unstructured data, for example satellite images, photographs, social media data or web site content. Various data sources for Big data define the scope from the business perspective: web and social media, machine generated, human generated, internal data sources, transaction data, biometric data, via data providers and via data originator. Each business can definitely have more than one data sources, for example a
simple healthcare business can have machine generated data, transactional data, web data and human data. [4] 3 Big data architecture The main component of the Big data architecture is the data pipelines, as they pick the raw data and transform it to value. Over this process a very important role has the Big data engineer, as he is the one that takes the most important decisions regarding the methods to process the data and how to build it in a proper form so that it can be easily understood and used by the final end user.
Fig. 2 Big data architecture [6]
In Fig. 2 it is pictured the Big data architecture over the Hadoop framework; it is the most representative architecture model for Big data. The first architecture’s component is the ingest, so how the data will be loaded. There are two options to load the data, batch load and event driven load. The batch ingest can be applied for structured data sources as for data from a relational database using Apache Sqoop, but the most complex case is for the file loading due to their location. It is recommended to use the event ingest for file loading whenever it is possible, so
that it can skipped the bulk load of files. The event ingest relies on agents configured to buffer data and to exchange data between them. One main aspect here is the tuning of the events that leap from one agent to another, as it will ensure smaller latencies and faster responses. The staging follows data loading. At this point, the data is standardized to the right format, encoded and compressed. Next to the staging comes the data processing step. First data is transformed and then analytic models are applied over it. Once the results are gathered, they must be represented in a proper form to the user.
14 Boarding to Big Data
This means to provide them proper access, for each user category. [6] 4 Big data market forecasts Big data development process continues to increase over the time, leading to the market growth from the vendor revenue
by selling Big data products and large business that are willing to use the Big data tools. The Big data market is measured by the revenue obtained from the selling of Big data related hardware, software and services.
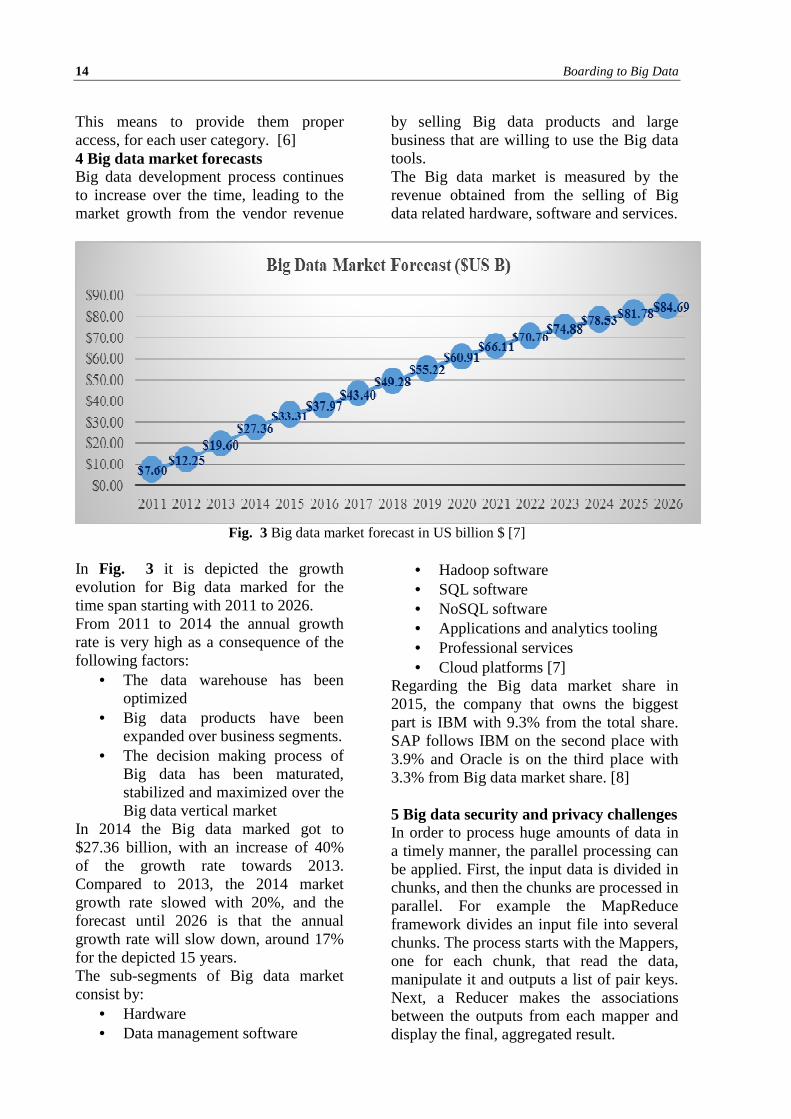
Fig. 3 Big data market forecast in US billion $ [7]
In Fig. 3 it is depicted the growth evolution for Big data marked for the time span starting with 2011 to 2026. From 2011 to 2014 the annual growth rate is very high as a consequence of the following factors:
• The data warehouse has been optimized
• Big data products have been expanded over business segments.
• The decision making process of Big data has been maturated, stabilized and maximized over the Big data vertical market
In 2014 the Big data marked got to $27.36 billion, with an increase of 40% of the growth rate towards 2013. Compared to 2013, the 2014 market growth rate slowed with 20%, and the forecast until 2026 is that the annual growth rate will slow down, around 17% for the depicted 15 years. The sub-segments of Big data market consist by:
• Hardware • Data management software
• Hadoop software • SQL software • NoSQL software • Applications and analytics tooling • Professional services • Cloud platforms [7]
Regarding the Big data market share in 2015, the company that owns the biggest part is IBM with 9.3% from the total share. SAP follows IBM on the second place with 3.9% and Oracle is on the third place with 3.3% from Big data market share. [8] 5 Big data security and privacy challenges In order to process huge amounts of data in a timely manner, the parallel processing can be applied. First, the input data is divided in chunks, and then the chunks are processed in parallel. For example the MapReduce framework divides an input file into several chunks. The process starts with the Mappers, one for each chunk, that read the data, manipulate it and outputs a list of pair keys. Next, a Reducer makes the associations between the outputs from each mapper and display the final, aggregated result.
Database Systems Journal vol. VI, no. 4/2015 15
At this point, two main issues are raised, one to secure the mappers and another one to secure the data for untrusted mappers. These issues can lead to inconsistent results and information leaks. NoSQL databases are not yet matured enough from the security level point of view, as the security was not part of the NoSQL database design model. To ensure the security for this kind of database, the developers often include the security in the middleware. Data is usually automatically stored in multi-tier storage media. The security levels are directly related to the tires, so that the lower tiers have a lower level of security, comparing to the higher tiers where the security level is increased. In this case an attack can appear over the wrongly tiered data, for example bank account information or money transfers that are wrongly tiered on a lower level, therefore a lower level of security is applied on very sensitive data. Another security challenge lays on trusting the input data. All the big businesses collect data from many sources represented by hardware devices and software solutions. This data needs to be analyzed to define if it is trustful and filtered by malicious intruders.
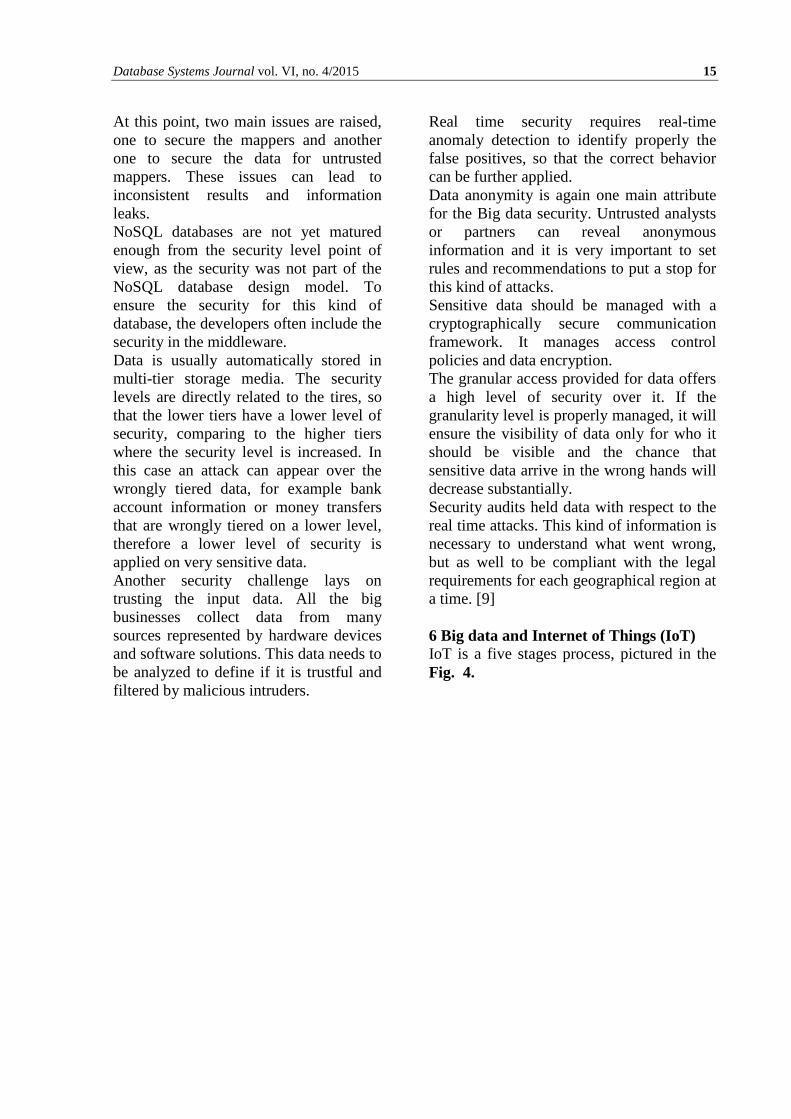
Real time security requires real-time anomaly detection to identify properly the false positives, so that the correct behavior can be further applied. Data anonymity is again one main attribute for the Big data security. Untrusted analysts or partners can reveal anonymous information and it is very important to set rules and recommendations to put a stop for this kind of attacks. Sensitive data should be managed with a cryptographically secure communication framework. It manages access control policies and data encryption. The granular access provided for data offers a high level of security over it. If the granularity level is properly managed, it will ensure the visibility of data only for who it should be visible and the chance that sensitive data arrive in the wrong hands will decrease substantially. Security audits held data with respect to the real time attacks. This kind of information is necessary to understand what went wrong, but as well to be compliant with the legal requirements for each geographical region at a time. [9] 6 Big data and Internet of Things (IoT) IoT is a five stages process, pictured in the Fig. 4.
16 Boarding to Big Data
Fig. 4 The Information Value loop [10]
The first stage is the creation one, where sensors are used to generate data about indicator or physical events. Next, in the communication stage, previously generated data is passed between several sources. Following comes the aggregation stage, where data coming from various sources and different time units is grouped together for the analysis stage. Here, data is transformed to information that it is used in the last stage, acting, where a behavior is applied accordingly. Each stage from the information value loop is correlated to its preceding stage, using one of the following technologies:
• Sensors – devices that produce an electronic signal as a result of an event or physical condition
• Networks – transmission environment for the electronic signals
• Standards – instructions for actions • Augmented intelligence – related to
the analytical tools to improve the capability to predict, describe and
manage relationships between the events
• Augmented behavior – improve the agreements with the corresponding actions. [10]
All this interconnected devices will generate a lot of data and here the Big data makes its entrance. Combining Big data with IoT will open new doors for the top companies to evolve and innovate the business processes, to perform faster and to met the clients values. The connection of Big data with IoT starts with the Big data capability to organize and analyze different types of data, structured, semi structured or unstructured, even if it comes from various data sources in a various format. Once data collected, Big data analytics manages huge volume of data and extract the value of information from it. Here comes again the Big data’s challenge to ensure data privacy and security over the entire process. [11] 7 Conclusions Big data is an emerging matter, laying on
Database Systems Journal vol. VI, no. 4/2015 17
the quantity of information that is growing faster and faster over the time. It is very important to understand the Big data attributes, so that the proper tools and consulting services can be applied for each business, individually. Nowadays it is very important to ensure the security of data, custom for each model and enterprise. References [1] S. M. Y. Z. V. C. L. Min Chen, Big
Data: Related Technologies, Challenges and Future Prospects, Springer, 2014.
[2] C. Ballard, Information Governance Principles and Practices for a Big Data Landscape, 2014: Information Governance Principles and Practices for a Big Data Landscape.
[3] M. V. Rijmenam, Think Bigger: Developing a Successful Big Data Strategy for Your Business, AMACOM, 2014.
[4] S. K. S. J. Divakar Mysore, "How to classify big data into categories," IBM, September 2013. [Online]. Available: http://www.ibm.com/developerworks/library/bd-archpatterns1/.
[5] N. Merolla, "Big Data Analytics and Predicitve Analytics," Predicitive analytics today, December 2013. [Online]. Available: http://www.predictiveanalyticstoday.com/big-data-analytics-and-predictive-analytics/#content-anchor.
[6] L. George, "Getting Started with Big Data Architecture," Cloudera, September 2014. [Online]. Available: http://blog.cloudera.com/blog/2014/09/getting-started-with-big-data-architecture/.
[7] J. Kelly, "Big Data Vendor Revenue and Market Forecast, 2016-2026," Wikibon, 2015.
[8] R. Finos, "2015 Big Data Market Shares," Wikibon, 2016.
[9] C. s. alliance, "Top Ten Big Data Security and Privacy Challenges," 2012.
[10] M. M. M. E. R. M. C. Jonathan Holdowsky, "Inside the Internet of Things (IoT)," Deloitte university Press, 2015.
[11] Datameer, "Big Data Analytics and the internet of Things," 2015. [Online]. Available: http://www.datameer.com/pdf/eBook-Internet-of-Things.pdf.
Oana Claudia BRATOSIN graduated the Faculty of Cybernetics, Statistics and Economic Informatics of the University of Economic Studies in 2011 and gained the Master title in Cybernetics and Quantitative Economy at the same university in 2013. Currently she is studying to earn her PhD Diploma in Economic Informatics.
18 The Importance of Data Warehouses in the Development…
The Importance of Data Warehouses in the Development of Computerized Decision Support Solutions.
A Comparison between Data Warehouses and Data Marts
Alexandru Adrian ȚOLE Romanian – American University, Bucharest, Romania
[email protected] In the last decade, the amount of data that an organization processes and stores has grown exponentially. In most cases, the data stored is used to support the business process through accurate and up-to-date information about the business environment and activity of the company. In order for a company's managers to be capable of generating the reports they need to make decisions, one needs a computer system able to store complex and very large quantities of data. At the same time, for the development of such an information system, one must take into account the cost of it. Keywords: Data Warehouse, Data Mart, Top-down, Bottom-up, database, architecture, management system
Introduction Data Warehouses (DW) by means of its data organization and usage
elements, are meant to provide helpful tools to assist managers in the decision-making process. Many companies deem the implementation of DW tools as most useful because the instruments that these systems offer help with the maintenance and development of the economic unit. Companies invest large sums in the development and implementation of such solutions as they provide essential elements that companies can use to retain customers and, at the same time, increase their number. Data Warehouses were originally intended for use in areas such as banking, telecommunications and retailing. However, later, they became hugely popular in other areas as well. According to the literature, it is the banking field and the telecommunications domain that uses these solutions most frequently, allocating the largest amounts for the development of data warehouses. Inmon estimates the costs for the development of a solution of the Data Warehouse type as being between 500,000 $ and $ 1,000,000 per terabyte [1] and this includes only the infrastructure. From this perspective, the
companies that do not have such financial resources may resort to the implementation of Data Marts (DM), whose costs are much lower. As far as the definition is concerned, the data warehouse term can be presented as "a database that is maintained separately from the operational databases of the organization" [2]. By this, we mean that the information is extracted from operational databases, goes through an ETL type process, following to be loaded into the Data Warehouse. These data warehouses are used to support the decision-making process by storing information in the decision-making process. As the main features of data bases, we distinguish the following [3]:
• Integration; • Data persistence; • Historical character; • Guidance on topics.
The "integration" characteristic of data warehouses refers to the fact that the source of the information stored is not singular. The data existing in a DW originate from sources such as relational databases, files (e.g. excel, word, xml), etc. This information, before being loaded into the DW, goes through
1

Database Systems Journal vol. VI, no. 4/2015 19
processing to be used later in the analysis performed using other Informatics solutions. Another feature of Data Warehouses is that they focus on topics that are specific for the activity of the company, removing information that is not relevant for the decision-making process. Traditional systems focused more on the particular data requested by certain departments (compartments) of the economic unit. Over time, these systems have been developed to support the implementation of processes from the beginning to the end. The historical character of Data Warehouses is that they store information for an undetermined period of time. This helps in the achievement of the decision-making process because the decision-makers can make statistical calculations for certain key indicators. The information stored in a data warehouse is permanent and cannot be changed. Therefore, any changes made in the DW data sources will have new data as a result, without modifying or deleting the existing data. It follows that a data warehouse is stored separately from the data processed by other applications. Normally, the operations in a data warehouse are the loading of data and the access to this information. Another feature of a DW is that related to the origin of the data. It can have simultaneously, internal and external information sources (Fig. 2 - Sources of information) to help the decision-making process. At the same time, DW includes tools with which users can quickly access data.
(Files, Databases) Fig. 1 Sources of information
The notion of "data warehousing" is very often used in the making of a data warehouse. The development of a data warehouse involves processes such as data integration, cleansing and consolidating them. In order to use a data warehouse one needs most often various applications that help with the interpretation of this information. These applications allow the decision-making structures to use information in a convenient and easy way for the decisions-making process. As far as the "data warehousing" term is concerned, this is interpreted as the process of the making of the data warehouse. For the use of the DW it is the Warehouse Database Management System [3] term that is used.. The process of data warehousing is useful because it helps the integration of heterogeneous data sources. It is well-known that large companies collect various types of information and load them into databases for later use in the development of statistics and/or calculation of trends. The integration of information, as well as an as easy as possible access to them constitute a priority for companies. With regard to traditional databases, the integration of heterogeneous databases is carried out by means of two elements: wrappers and integrators. As for example, when performing a site query, it is a dictionary of metadata that is used to transform this search into a query appropriate for the sites involved. The result received from various sources is integrated in the global response of the query performed. The concept of data query will result in a complex process of integration and filtering that is reflected on the processing resources. Thus, it is ineffective and can become expensive, in terms of hardware architecture, to achieve frequent queries, especially if they require aggregations. Data warehousing provides an alternative to the traditional concept regarding the integration of databases via the "update-driven" [4]
20 The Importance of Data Warehouses in the Development…
characteristic, through which the data from sources are queried and stored in the data warehouse to be analyzed later. For example, in contrast to the databases that store information on accessing the email by Yahoo users, a data warehouse does not present information updated in real time. Although a data warehouse has the disadvantage of supplying recent data, it provides a high performance by integrating databases whereas data is copied, processed, summarized and restructured into a semantic data collection [5]. At the same time, the process of data warehouse query does not interfere with processes from local sources. A data warehouse is also advantageous due to the fact that it stores and integrates historical data and provides facilities regarding advanced query features. Data warehouse provides access to the integrated data of the company, which had been previously blocked or restricted. Users can establish a secure connection to the data warehouse via a PC. Security is provided on the one hand by means of the user interface (UI) and on the other hand through the database server. The data warehouse has the quality of providing a single version of the truth. The information available in the DW have a high quality due to the transformation process they have gone through. This is so if a single data source is used, thus putting an end to the debate on the veracity of the data. The data warehouse comes to be a unique source of information for the top-management. It should be noted that the existence of a single variant of truth is dependent upon firm agreement on the terms used. For example, the term "possible client" can have multiple meanings, such as former clients, customers whose contracts are about to expire, the entities addressed offering deals etc. Surely these issues influence the decision-making process.
The fact that a data warehouse integrates historical data determines the relevance of decisions taken by managers because, in general, decisions are based on previous experiences as well. For example, comparing monthly reports leads to the making of decisions regarding investments. Data warehouses can be used to accurately record the past, making the OLTP systems available to focus on the correct registration of current transactions. Historical data are loaded and integrated with other existing data in the DW to provide rapid access. The types of dynamic reports as well as the OLAP query tools allow users to visualize the data from DW from different perspectives and at different levels of detail. These possibilities offered by Data Warehouses reduce time and effort concerning the collection, processing and filtering of information coming from various sources. The operational processes are vastly different as compared to the decision-making processes. The attempt to integrate the decision-making information with the operational information makes system maintenance became a major problem. Thus, starting from the operational processes, the Data Warehouse provides a separate architecture in relation to the implementation of decisions. 2 Databases architecture A data warehouse consists of a very large database, which contains data that can be used by end-users. In a Data Warehouse there are several types of information that correspond to the users ' needs, such as the following:
� Detailed data; � Aggregate data; � Metadata.
Metadata is information embedded in the data warehouse containing data relating to the content stored. Metadata includes information showing the structure of the existing data in the data warehouse, their origin, transformation rules, aggregation and calculation. They have a very important role
Database Systems Journal vol. VI, no. 4/2015 21
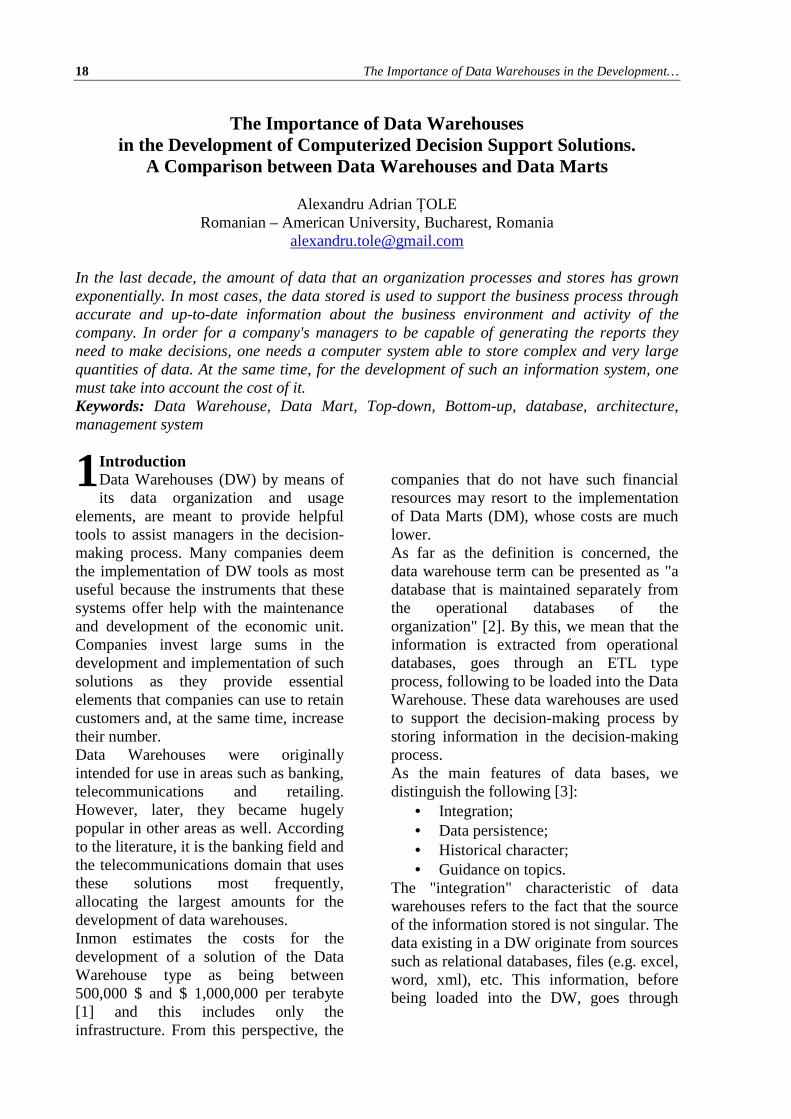
in powering the data warehouse, being used in all the processes of loading of data and are updated throughout the life of the data warehouse. The existence of aggregate data in the data warehouse increases data redundancy, but it is required, however, to reduce response times regarding Data Warehouse queries. A logical flowchart regarding the basic architecture of a data warehouse can be seen below (Fig. 3 – Basic architecture of a DW).
(Operational databases, Text files, Other sources – Data Warehouse – Metadata, Aggregated data, Detailed data – Analysis, Reporting)
Fig. 2 Basic architecture of a DW Data warehouses are generally intended for use by analysts or persons engaged in decision-making processes concerning the development of the economic entity. To achieve this, they need powerful tools that facilitate access to and use of the information stored in data warehouses. These tools are mostly provided by the data warehouse. At the same time, a DW solution can also integrate tools which meet the need of users for rapid access to information or quickly generate reports. There are specialized tools that can transform the information in the data warehouse so as to be presented in the form of graphics and/or diagrames. Here one can fiind specialized OLAP instruments and data mining. The OLAP-type instruments focus more on a multidimensional representation of information and allow for rapid analysis of data by means of processes such as drill down, slice, etc. Thus, the user can
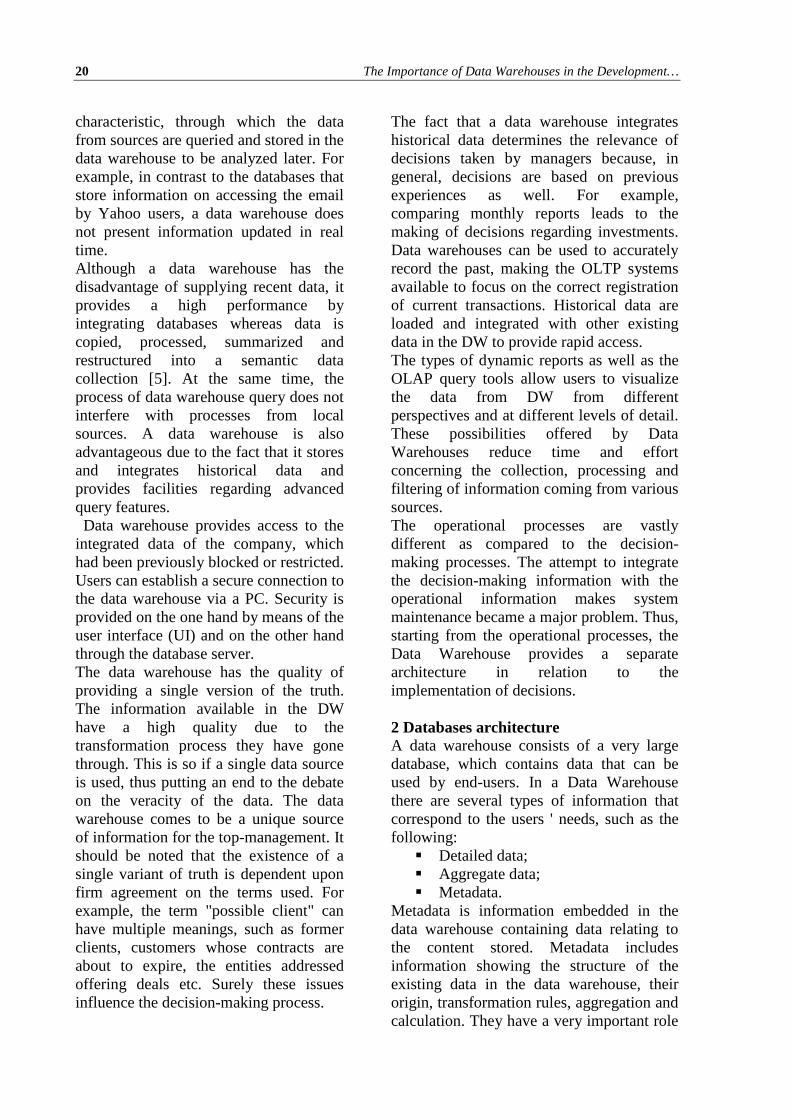
obtain results rapidly and can work at different levels of synthesis. Data mining -type tools are helping transform information into knowledge, thus the term Data Mining is often confused with the Knowledge Discovery in Databases term [6]. 3 Architecture of data warehouses on three levels From the architecture described above we can build a software solution that is capable of meeting the requirements of all users of the data warehouse. Figure 4 shows a data warehouse architecture on three levels: Bottom Tier, Middle Tier și Top Tier[7].
Fig. 3 Architecture of data warehouses on three
levels (Analysis, Reports, Exit, OLAP Server, Data
Warehouse, Internal data, External Data) a) Bottom tier: Includes the server of the data warehouse and of the data marts. Typically, the databases used for building the data warehouse are relational databases. The data warehouse is loaded with internal information (from the company, from various departments) and external (third party applications used by employees, information collected online, files etc.). The information is loaded into the data
22 The Importance of Data Warehouses in the Development…
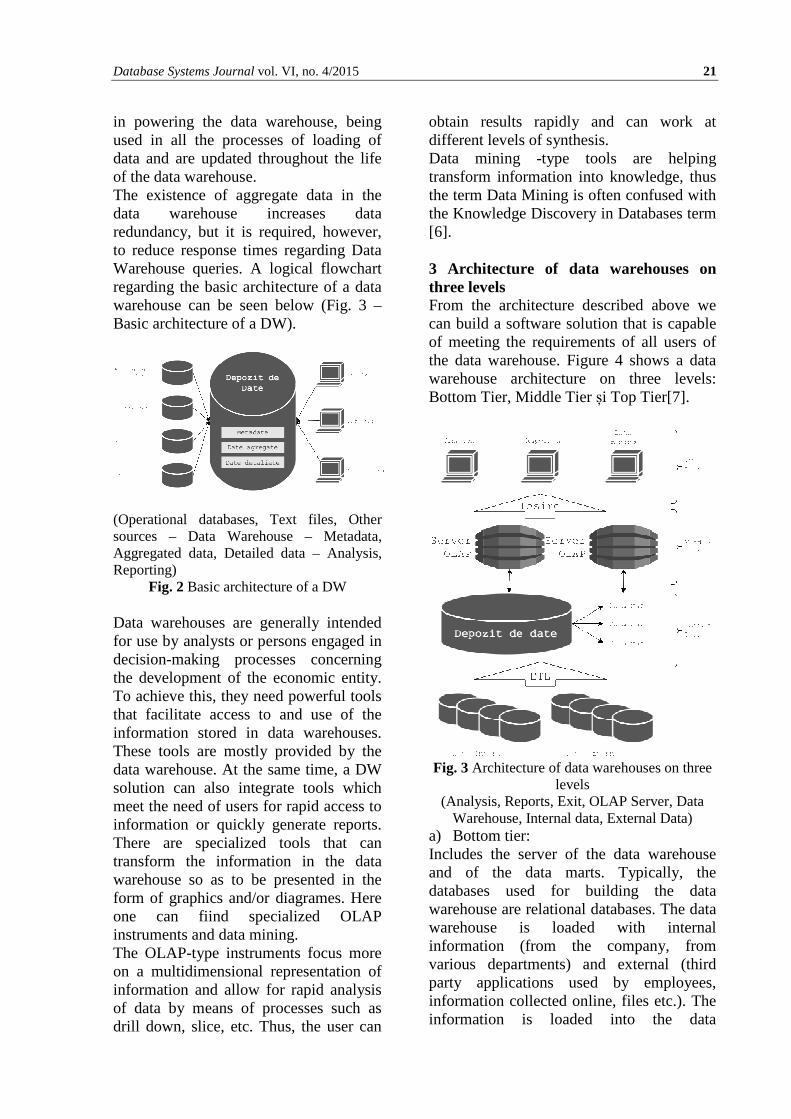
warehouse after they were extracted and processed. At the same time, from the database one obtains the information to be loaded on the data marts to be made available to users. b) Middle tier: It is made up of OLAP servers. It uses either a relational model (ROLAP) or a multidimensional one (MOLAP). c) Top tier: It is the level at which the user interacts with the computer system. At this level you can generate reports, you can create a data analysis by means of the tools or you can achieve the data mining. Ralph Kimball and William Inmon had different opinions with regard to the design and architecture of data warehouses. Inmon supported a "Data Mart" structure, dependent on data, a method which is called "top-down". This method describes an approach by means of which the data warehouse is done first, followed by the creation of Data Marts, as satellites that contain data. Kimball has approached the problem differently, in the sense that he started from the development of Data Marts to the realization of the data warehouse. This approach is called "bottom-up”. 4 Top-Down Method Inmon has noticed that it takes the transfer of data from various OLTP systems and centralizing them for further analysis. He considers that the data must be organized in structures that are "embedded, non-volatile, subject-oriented and variable in time "[8]. At the same time, he thinks that the data must be accessed in a detailed enough level to allow the use of data mining tools. The Data Marts, in this case, are seen as being data sub-sets of the Data Warehouse. Data Marts are developed for in each department, so as to later meet the analysis requirements of the department for which the data warehouse has been developed .
The top-down method (Fig. 5-Top-Down), in an OLAP environment, starts with data extraction from the operational data sources. Afterwards, they are loaded into the waiting area, where they are validated and consolidated in order to ensure a high level of data quality. They are then transferred to the Operational Data Store (ODS). This stage (ODS) is often omitted in cases where there occurs a doubling of operational databases. At the same time, detailed data are constantly extracted from the operational data warehouse and hosted temporarily in the transfer area, following extraction and upload (ETL) in the data warehouse.
Fig. 4 Top-Down
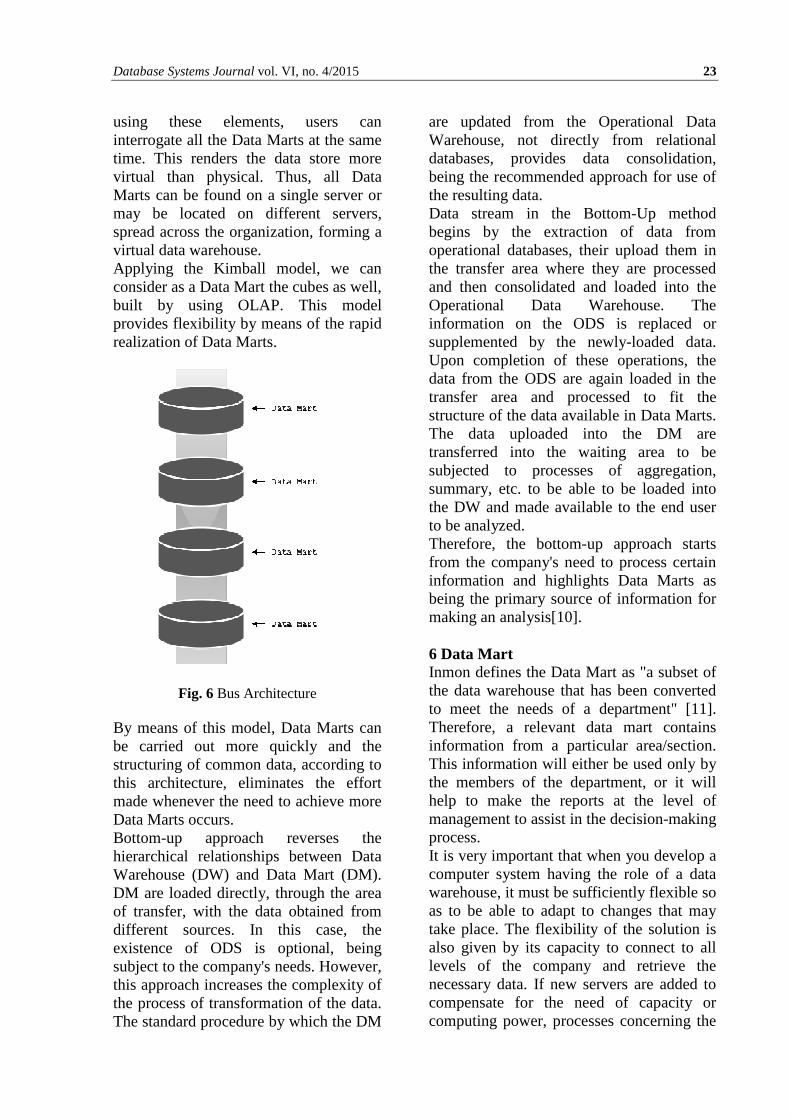
The need for an Operational Data Warehouse is given by the needs of the business process. Whenever the situation calls for the existence of detailed data in the data warehouse, then the implementation of an ODS is justified. Once the data warehouse processes concerning the aggregation and centralization come to an end, the cycle of Data Marts updateis resumed by means of data extraction and upload into the transfer zone in order to subject them to transformations. This helps to structure data. Upon successful completion of these processes, Data Marts can be loaded with data with a view to be available to users who work in an OLAP environment. 5 Bottom-Up Method Ralph Kimball designed data warehouses using Data Marts connected to it by means of a "bus" [9] type architecture (Fig. 6-Bus Architecture). This architecture encompassed all the common elements of a Data Mart. Kimball considered that by
Database Systems Journal vol. VI, no. 4/2015 23
using these elements, users can interrogate all the Data Marts at the same time. This renders the data store more virtual than physical. Thus, all Data Marts can be found on a single server or may be located on different servers, spread across the organization, forming a virtual data warehouse. Applying the Kimball model, we can consider as a Data Mart the cubes as well, built by using OLAP. This model provides flexibility by means of the rapid realization of Data Marts.
Fig. 6 Bus Architecture
By means of this model, Data Marts can be carried out more quickly and the structuring of common data, according to this architecture, eliminates the effort made whenever the need to achieve more Data Marts occurs. Bottom-up approach reverses the hierarchical relationships between Data Warehouse (DW) and Data Mart (DM). DM are loaded directly, through the area of transfer, with the data obtained from different sources. In this case, the existence of ODS is optional, being subject to the company's needs. However, this approach increases the complexity of the process of transformation of the data. The standard procedure by which the DM
are updated from the Operational Data Warehouse, not directly from relational databases, provides data consolidation, being the recommended approach for use of the resulting data. Data stream in the Bottom-Up method begins by the extraction of data from operational databases, their upload them in the transfer area where they are processed and then consolidated and loaded into the Operational Data Warehouse. The information on the ODS is replaced or supplemented by the newly-loaded data. Upon completion of these operations, the data from the ODS are again loaded in the transfer area and processed to fit the structure of the data available in Data Marts. The data uploaded into the DM are transferred into the waiting area to be subjected to processes of aggregation, summary, etc. to be able to be loaded into the DW and made available to the end user to be analyzed. Therefore, the bottom-up approach starts from the company's need to process certain information and highlights Data Marts as being the primary source of information for making an analysis[10]. 6 Data Mart Inmon defines the Data Mart as "a subset of the data warehouse that has been converted to meet the needs of a department" [11]. Therefore, a relevant data mart contains information from a particular area/section. This information will either be used only by the members of the department, or it will help to make the reports at the level of management to assist in the decision-making process. It is very important that when you develop a computer system having the role of a data warehouse, it must be sufficiently flexible so as to be able to adapt to changes that may take place. The flexibility of the solution is also given by its capacity to connect to all levels of the company and retrieve the necessary data. If new servers are added to compensate for the need of capacity or computing power, processes concerning the
24 The Importance of Data Warehouses in the Development…
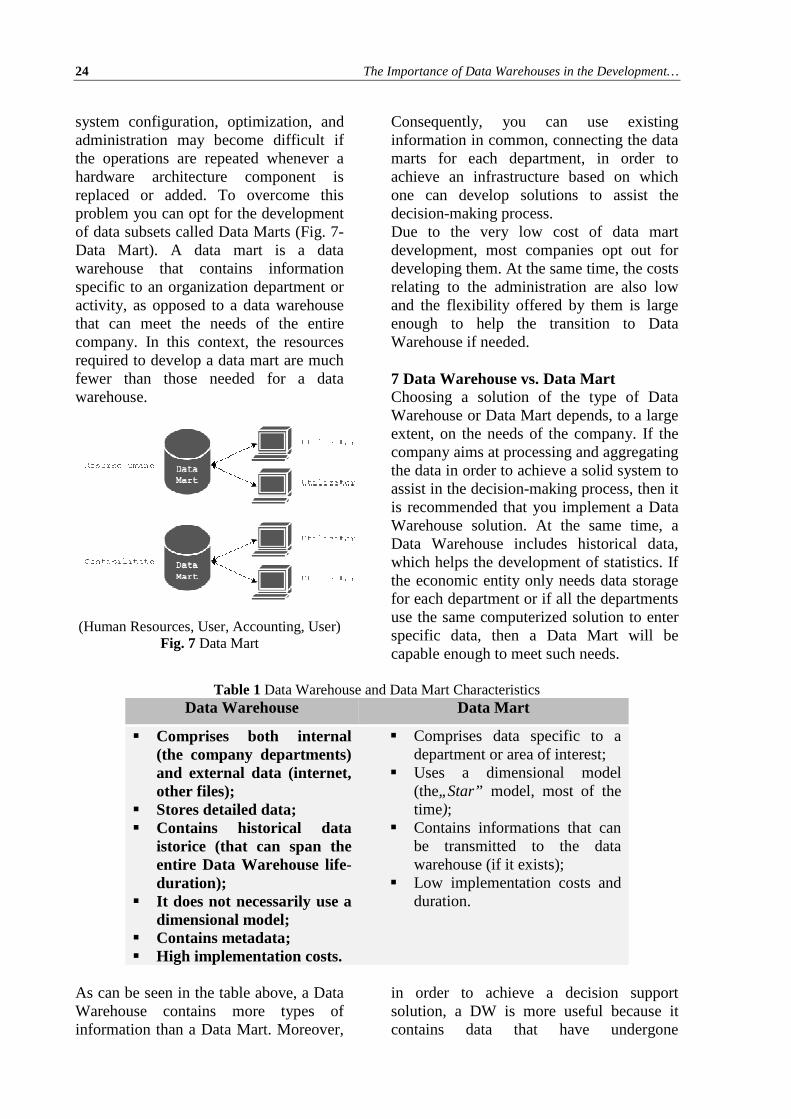
system configuration, optimization, and administration may become difficult if the operations are repeated whenever a hardware architecture component is replaced or added. To overcome this problem you can opt for the development of data subsets called Data Marts (Fig. 7-Data Mart). A data mart is a data warehouse that contains information specific to an organization department or activity, as opposed to a data warehouse that can meet the needs of the entire company. In this context, the resources required to develop a data mart are much fewer than those needed for a data warehouse.
(Human Resources, User, Accounting, User)
Fig. 7 Data Mart
Consequently, you can use existing information in common, connecting the data marts for each department, in order to achieve an infrastructure based on which one can develop solutions to assist the decision-making process. Due to the very low cost of data mart development, most companies opt out for developing them. At the same time, the costs relating to the administration are also low and the flexibility offered by them is large enough to help the transition to Data Warehouse if needed. 7 Data Warehouse vs. Data Mart Choosing a solution of the type of Data Warehouse or Data Mart depends, to a large extent, on the needs of the company. If the company aims at processing and aggregating the data in order to achieve a solid system to assist in the decision-making process, then it is recommended that you implement a Data Warehouse solution. At the same time, a Data Warehouse includes historical data, which helps the development of statistics. If the economic entity only needs data storage for each department or if all the departments use the same computerized solution to enter specific data, then a Data Mart will be capable enough to meet such needs.
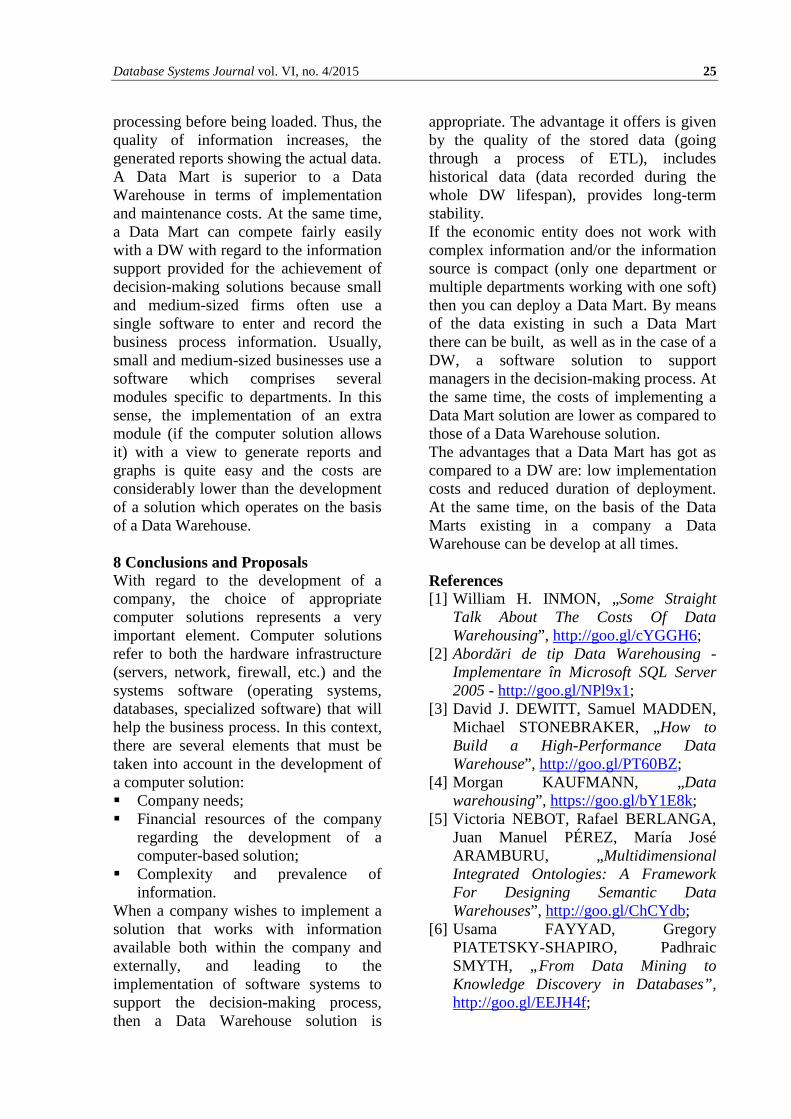
Table 1 Data Warehouse and Data Mart Characteristics Data Warehouse Data Mart
� Comprises both internal (the company departments) and external data (internet, other files);
� Stores detailed data; � Contains historical data
istorice (that can span the entire Data Warehouse life-duration);
� It does not necessarily use a dimensional model;
� Contains metadata; � High implementation costs.
� Comprises data specific to a department or area of interest;
� Uses a dimensional model (the„Star” model, most of the time);
� Contains informations that can be transmitted to the data warehouse (if it exists);
� Low implementation costs and duration.
As can be seen in the table above, a Data Warehouse contains more types of information than a Data Mart. Moreover,
in order to achieve a decision support solution, a DW is more useful because it contains data that have undergone
Database Systems Journal vol. VI, no. 4/2015 25
processing before being loaded. Thus, the quality of information increases, the generated reports showing the actual data. A Data Mart is superior to a Data Warehouse in terms of implementation and maintenance costs. At the same time, a Data Mart can compete fairly easily with a DW with regard to the information support provided for the achievement of decision-making solutions because small and medium-sized firms often use a single software to enter and record the business process information. Usually, small and medium-sized businesses use a software which comprises several modules specific to departments. In this sense, the implementation of an extra module (if the computer solution allows it) with a view to generate reports and graphs is quite easy and the costs are considerably lower than the development of a solution which operates on the basis of a Data Warehouse. 8 Conclusions and Proposals With regard to the development of a company, the choice of appropriate computer solutions represents a very important element. Computer solutions refer to both the hardware infrastructure (servers, network, firewall, etc.) and the systems software (operating systems, databases, specialized software) that will help the business process. In this context, there are several elements that must be taken into account in the development of a computer solution: � Company needs; � Financial resources of the company
regarding the development of a computer-based solution;
� Complexity and prevalence of information.
When a company wishes to implement a solution that works with information available both within the company and externally, and leading to the implementation of software systems to support the decision-making process, then a Data Warehouse solution is
appropriate. The advantage it offers is given by the quality of the stored data (going through a process of ETL), includes historical data (data recorded during the whole DW lifespan), provides long-term stability. If the economic entity does not work with complex information and/or the information source is compact (only one department or multiple departments working with one soft) then you can deploy a Data Mart. By means of the data existing in such a Data Mart there can be built, as well as in the case of a DW, a software solution to support managers in the decision-making process. At the same time, the costs of implementing a Data Mart solution are lower as compared to those of a Data Warehouse solution. The advantages that a Data Mart has got as compared to a DW are: low implementation costs and reduced duration of deployment. At the same time, on the basis of the Data Marts existing in a company a Data Warehouse can be develop at all times. References [1] William H. INMON, „Some Straight
Talk About The Costs Of Data Warehousing”, http://goo.gl/cYGGH6;
[2] Abordări de tip Data Warehousing - Implementare în Microsoft SQL Server 2005 - http://goo.gl/NPl9x1;
[3] David J. DEWITT, Samuel MADDEN, Michael STONEBRAKER, „How to Build a High-Performance Data Warehouse”, http://goo.gl/PT60BZ;
[4] Morgan KAUFMANN, „Data warehousing”, https://goo.gl/bY1E8k;
[5] Victoria NEBOT, Rafael BERLANGA, Juan Manuel PÉREZ, María José ARAMBURU, „Multidimensional Integrated Ontologies: A Framework For Designing Semantic Data Warehouses”, http://goo.gl/ChCYdb;
[6] Usama FAYYAD, Gregory PIATETSKY-SHAPIRO, Padhraic SMYTH, „From Data Mining to Knowledge Discovery in Databases”, http://goo.gl/EEJH4f;

26 The Importance of Data Warehouses in the Development…
[7] Sandeepak BHANDARI, Tarun SHARMA, Jagpreet SINGH, Sarabjit KAUR, „A Review: Data Warehousing, Its Issues, Architecture and Tools”, International Journal for Innovative Research in Science & Technology, Volume 1, Issue 3, August 2014, ISSN: 2349-6010;
[8] Joseph M. FIRESTONE, „DKMS Brief No. Six: Data Warehouses, Data Marts, and Data Warehousing: New Definitions and New Conceptions”, http://goo.gl/VcSOkp;
[9] Ralph KIMBALL, Margy ROSS, „The Data Warehouse Toolkit: Second Edition” , Wiley Computer Publishing, 2002, ISBN 0-471-20024-7;
[10] TDWI Data Warehousing Architectures: Choosing The Right Data Warehousing Approach, 2005, http://goo.gl/rpdmV6;
[11] W. H. INMON, Claudia IMHOFF, Ryan SOUSA, ” Corporate Information Factory, 2nd Edition”, John Wiley & Sons, 2001, ISBN: 978-0-471-39961-2;
Alexandru Adrian ȚOLE (born in 1986, Romania) graduated from the School of Domestic and International Business, Banking and Finance, the Romanian – American University, in 2009. He also graduated the Scientific Master Program in Finance, Banking and Insurance. He works at the Ministry for Information Society. He is pursuing a PhD Program in the area of Executive Information Systems.
Database Systems Journal vol. VI, no. 4/2015 27
Optimizing memory use in Java applications, garbage collectors
Ștefan PREDA Oracle, Bucharest, Romania
[email protected] Java applications are diverse, depending by use case, exist application that use small amount of memory till application that use huge amount, tens or hundreds of gigabits. Java Virtual Machine is designed to automatically manage memory for applications. Even in this case due diversity of hardware, software that coexist on the same system and applications itself, these automatic decision need to be accompanied by developer or system administrator to triage optimal memory use. After developer big role to write optimum code from memory allocation perspective , optimizing memory use at Java Virtual Machine and application level become in last year’s one of the most important task. This is explained in special due increased demand in applications scalability. Keywords: Java Virtual Machine, garbage collector, Concurrent Mark Sweep (CMS), G1 GC, Shenandoah an Ultra-Low-Pause-Time Garbage Collector.
Introduction Java applications run in a Java Virtual Machine (JVM or Java HotSpot VM).
Memory management is assured automatically based on a set of rules, grouped in a set named garbage collector (GC). In Java Virtual Machine can run a variety of applications from small applets that run in browser through web-services that responds to huge number of requests per time unit, and which runs on big server. From this reason Java Virtual Machine has by default many garbage collectors, each one appropriate to a specific application type. Java Virtual Machine selects automatically a garbage collector based on application and on a hardware on which is running. Often, chosen GC may not be suitable for application performance, and in such cases developer need to select a specific GC and to make supplementary tuning. One target in memory optimization is to provide good JVM performance with minimum parameter tuning, this feature is named ergonomics. Using ergonomics JVM try in specified criteria from above to select for application, one of the best: garbage collector, heap size and run-time compiler. Java Heap is a memory area created by Java Virtual Machine at start-up. From
heap is allocated memory to all instances of objects and to arrays allocated. Heap is shared between threads that run inside Java Virtual Machine. Heap can be fixed size or variable size, means it can be expanded based on application demand. Initial heap size is controlled by option -Xms. Maximum java heap size is controlled by option -Xmx. 2 Garbage collector Objects are not explicitly released and reallocated from Heap, this task is performed automatically by GC. A simple description for GC [3] is that it searches for objects that are not in use and free memory occupied by those. Free space is used further to allocate other objects. After releasing unused objects, memory space can become fragmented, from this reason allocation for big objects can be a problem. To overcome this, GC do compaction after memory free. All GC do: search for unused objects, free space and compact it. Differentiation between GC's consists in approach on how those operations are performed. Like a basic principle garbage collection is based on fact that when a previously allocated memory is no referenced by any pointers it can be reclaimed for new use. GC find and recycle those memory locations.
1
28 Optimizing memory use in Java applications, garbage collectors
GC work is multiple threads and usual application is multi threads, when moving objects for GC a challenge is to move objects while no application access to those is. From this reason sometime there are pauses when all application threads are stopped (and GC do his job of moving objects) and from here one of the most important aspect of GC tuning: minimize pauses. Pauses are named usual as “stop-the-world pauses”. Generations in garbage collectors. Some Java objects are used for short time, other for some more time and there may exist objects that are used for long time, thus heap is organized in areas named generations. We have: • old (tenured) generation • young generation • eden • survivor spaces A Java application usual have many temporary objects, thus those are stored in young generation. According with [1] Objects in general are allocated initial in young generation, more exactly in eden space. Survivor space is empty always, it serve only like a destination from where object will be moved to a next place (or to the tenured space). When young generation is filled, garbage collector stop (pause) application threads, objects that are not in use from young generation are discarded and those that are still in use are moved to other place. Operation is named “minor GC”, term minor is because operation is fast due fact that young generation represent only a part of entire heap area, pause will be shorter than situation when garbage collector work with entire heap. 3 Garbage collector types Java Virtual Machine depending by necessary application scalability and hardware can use one of the following collectors: • Serial collector • Parallel collector • Mostly concurrent collector
• Concurrent Mark Sweep (CMS) Collector
• Garbage-First Garbage Collector (G1 GC)
• Shenandoah: An Ultra-Low-Pause-Time Garbage Collector
Serial collector. It use a single thread to perform memory management task, this collector is good for applications with small data set (less than 100Mb), having only one thread, managing inter – threads communications does not apply, from this reason it is relative efficient for small applications. It is good for machines also with a single processor. Like drawback it is not suitable for multiprocessor hardware due single thread work. Collector is selected automatically on specific hardware like single CPU systems, or it can be selected automatically using -XX:+UseSerialGC option. Parallel collector or throughput collector performs many minor collections in parallel, reducing Garbage Collection overhead. Parallel collector is suitable and is automatically selected if hardware is multiprocessor, multithreaded and or application is medium or large. We can choose parallel collector explicit starting Java Virtual Machine with option: -XX:+UseParallelGC. Once used parallel collector it enable implicit parallel compacting. Running parallel compacting, major collections are also multi thread. Parallel compactation can be disabled using option: -XX:-UseParallelOldGC. Very important, this is not recommended because it make major collection single thread which is not suitable for medium-large applications. If we need good performance and garbage collector pauses around 1 seconds are acceptable, then parallel collector is suitable. Mostly concurrent collector, it make GC tasks simultaneous (or concurrent) while application is running, resulting in very short GC pauses. This collector is for big applications or for medium applications that need fast response. In Java
Database Systems Journal vol. VI, no. 4/2015 29
Development Kit (JDK) 8 we have two kind of mostly concurrent collectors: - Concurrent Mark Sweep (CMS) Collector - Garbage-First Garbage Collector (G1 GC) Concurrent Mark Sweep (CMS) Collector. This collector has minor and major collections. Major collections are performed using separate threads to track heap objects concurrently with application execution threads resulting thus small pauses time. During a major collection there is a small pause at the beginning (all applications threads are paused, this pause is named initial mark pause), and a second pause, a little longer, near the middle of the collection time (this is named remark pause). Running concurrently GC threads and applications threads, application throughput may decrease because part of the CPU's threads are used by GC in detriment of application threads, thus CMS is suitable for multi processor and multi threads architectures. Running garbage collector threads simultaneously with application threads is needed such as collection of tenured objects to finish before it become full. If this is not happening we have concurrent mode failure, in this case application threads are paused till collection is completed. Concurrent mode failure event is a sign that GC CMS parameters need to be changed or tuned. Time spent with garbage collection, ideal should be as small as possible, while percent of heap recovered need to be as much as possible. When more than 98% time is spent with garbage collection, but less than 2% heap size is recovered, then OutOfMemoryError is thrown. This can be disabled using option: -XX:-UseGCOverheadLimit. This is not recommended because mentioned percents 98%, 2% usual show that application is running without progressing and this need to be fixed by tuning. Usually long time spent with garbage collector is associated with
concurrent mode failure events. Concurrent collection in CMS start when tenured generation increase over 92%. This threshold depend by JDK release, value can be adjusted using option XX:CMSInitiatingOccupancyFraction=<percent> CMS collector use one or more CPU during object tracing process, also one CPU is used during concurrent sweep phase, CPU is not released voluntary to the application, this can influence application throughput and response time. To solve this problem CMS have incremental mode or i-cms mode, this mode break up concurrent phases in short bursts scheduled at midway of minor pauses. CMS voluntary release CPU to application after a percentage of time between young generation collections, this percent is named duty cycle. Midway is default, this can be changed using option: XX:CMSIncrementalOffset=<N> To enable incremental mode we use option: -XX:+CMSIncrementalMode Sample combination of options for CMS: -XX:+UseConcMarkSweepGC \ -XX:+CMSIncrementalMode \ -XX:+PrintGCDetails \ -XX:+PrintGCTimeStamps Here option UseConcMarkSweepGC enable CMS, CMSIncrementalMode enable i-cms, PrintGCDetails and PrintGCTimeStamps print GC activity details for troubleshooting purposes. Garbage-First Garbage Collector (G1 GC). This collector is suitable for programs that have very large heap which run on multiprocessor servers. The challenge for memory management in case of applications that require very large amount of memory is that garbage collector heap operations can take big time while heap increase, is such situation interruptions can become proportional with heap or data size. To overcome this G1 GC use similar technique like CMS, i.e. garbage collector heap operations threads are performed concurrently with application threads, and

30 Optimizing memory use in Java applications, garbage collectors
supplementary G1 GC use heap partitioning. Heap is partitioned in equal contiguous memory regions. G1 GC concurrently checks each regions marking in this way if objects are still live. After this phase G1 collect regions that are empty or almost empty resulting a big free space. As collector concentrate first on doing collection and compaction on regions that are almost full with garbage objects it is named “Garbage-First” or G1. To fulfil pause time demanded by application, G1 GC use a prediction model to select that regions and number of those such as resulting pause do not increase over imposed application limit. After marking regions, collector copies objects from selected regions to a single heap region and in the same time compact it, reduce fragmentation and free up space, doing this simultaneous, result is a decreased pause time and better throughput. As G1 GC use a prediction model, it is not a real-time collector, means pause time target is not strictly fulfilled, it is just realized with a high probability. Probability is accurate. G1 collector can provide a good memory management for applications which need large heap and small garbage collector latency, for example a 6 GB application can run with a estimated pause time under 0.5 seconds. Based on [1] CMS and G1 GC collectors are comparable and specific applications can benefit of both. Both collectors are good for applications that have traits like: • more than 50% heap is occupied by
data • object allocation or promotion rate vary
in time • applications is experiencing long GC or
compactation pauses (between 0.5 – 1 second)
Because G1 is a compacting collector and G1 predicted pauses are very good predictable, according with [1] in the future intention is that G1 GC will replace CMS.
G1 collections are running usual simultaneous with application, due this exist probability that application allocate object faster that GC relocate and free space, this event is named “Allocation (Evacuation) Failure” it is very similar with CMS “Concurrent Mode Failure”. When “Allocation (Evacuation) Failure” is happening there can be no space for application to allocate live objects, in this case GC G1 will start a full GC collection. An object can die during G1 collection, and thus not be collected, that can result in improper space released. To prevent this G1 GC consider that any object that is live at start of concurrent marking is considered live for collection (this technique is named snapshot-at-the-beginning (SATB) ). SATB allow floating garbage similar with CMS incremental. G1 GC keeps information about old generations pointers to young generation objects in a data structure named a remembered set. A particular kind of remembered set is named card table, which is an array of bytes. Each byte is referred as a card that corresponds to a range of heap addresses. When such byte is changed such as to contain a new pointer from the old generation to the young generation, operation is named “dirtying a card”, and value of changed byte is named “dirty value”. Having “old generation to young generation pointer” information GC G1 can do something with this information, for example transferring it to other data structure, operation is named “Processing a card”. For GC G1 a concurrent marking phase (marking all live objects from heap) when heap is occupied over a specific percent. This is controlled by a parameter named InitiatingHeapOccupancyPercent means by option: XX:InitiatingHeapOccupancyPercent=<NN> By default InitiatingHeapOccupancyPercent is 45.

Database Systems Journal vol. VI, no. 4/2015 31
The other important parameters of GC G1 are: MaxGCPauseMillis which represent a maximum pause time accepted and GCPauseIntervalMillis which is time interval during which pause can occur. Shenandoah: An Ultra-Low-Pause-Time Garbage Collector. Just looking in previous discussion about different garbage collectors, evolution was tight related to hardware complexity. The last evolution in hardware is big machine, like Exadata or Exalogic for example, with multi-core machines which should run applications with very large heaps (about 100 GB, as mentioned in [4]) This evolution conduct to a new garbage collector: Shenandoah Ultra-Low-Pause-Time Garbage Collector. Shenandoah garbage collector is still in draft according with [5]. Shenandoah is designed to manage applications that have over 100GB heaps with pause less than 10ms. Shenandoah garbage collector is similar with G1 GC, a “region-based” collector, it works also in phases. First is marking phase when all live objects from heap are marked, a count also of live objects in every region is maintained. In second phase, is similar like in G1 collector, evacuation phase where live objects from best regions to collect are copied to new regions. Then follow concurrent marking phase and then phase where evacuated regions are reclaimed concurrently. Concurrent evacuation is based on fact that application threads and garbage collector threads know and agree about the location of objects. To achieve this Shenandoah garbage collector use “brooks forwarding pointer”. Application threads reads are accomplished indirectly via forwarding pointer. Writes of objects in targeted regions copy objects and then writes those in new location. Forwarding pointer is main difference compared with G1 GC. Shenandoah using forwarding pointer is focused on working with regions with most
garbage regardless by age (it is not focused on young generation like other collectors). Referring to huge systems, similar collector with Shenandoah is Zing/Azul collector [6]. This collector have similar features: is a predictable garbage collector, have comparable response time with Shenandoah, scale to huge heap sizes (hundreds of GB's), good application scalability. 4. About garbage collectors in embedded or limited devices. According with [7] embedded devices have limited resources thus garbage collectors are rarely used! Nevertheless is very important to mention that such kind of devices that use Java Platform, Micro Edition are embedded software devices and use Garbage Colector, usually garbage collector from Java ME is a serial collector. Initial using garbage collector in embedded devices was introduced very slow because Garbage Collection come with a performance cost, garbage collector use between 30-150% more address space than a classic memory management algorithm. Also garbage collector can sometime, on embedded or limited devices, to increase high water mark of memory usage and also to lead to high CPU usage. This was one reason why garbage collector was not introduced early on mobile platforms. Based on [8] new embedded JVM handle garbage collector more efficiently, main improvement area is to perform garbage collection faster. For this is used a “hybrid garbage collection approach”, thus memory is divided in multiple regions, there will be frequent generation garbage collections in “nursery” followed by mark-and-sweep stage over all regions. garbage collector needs is anticipated using heuristics algorithms. Garbage collector can be tailored according with application needs.
32 Optimizing memory use in Java applications, garbage collectors
5 Conclusions. Memory optimization in java application is a complex problem which depends by many factors: hardware, CPU, memory, application itself, connectivity, etc. Garbage collector try to make this optimization automatically. JVM have many garbage collectors available, based on the application and on hardware system, a specific garbage collector is selected automatically for the application. This automatic selection simplifies considerable programmer and system administrator work. Nevertheless it is only a first steps, every garbage collector can require parameter tuning, a simple explanation is that even if the systems are identical like hardware, applications aren't, and even if we will presume that we have the same applications on two systems, there may exist different other applications that are running, or there will be differences, which explain why those garbage collector will beehive different. Apart from tuning we mention that the main task still remain for programmers: means to write code that consume as less memory as possible. Garbage collector evolution was in to main directions first to assure scalability on hardware that become more and more complex like CPU and memory resources. The second, a new direction in last year's is to include also garbage collector in embedded or limited devices.
References [1] Java Platform, Standard Edition HotSpot Virtual Machine Garbage Collection Tuning Guide https://docs.oracle.com/javase/8/docs/technotes/guides/vm/gctuning/ [2] The Java® Language Specification. Java SE 8 Edition https://docs.oracle.com/javase/specs/jls/se8/html/index.html [3] Java Performance: The Definitive Guide, By: Scott Oaks, Publisher: O'Reilly Media, Inc. Pub. Date: April 21, 2014, Print ISBN-13: 978-1-4493-5845-7 [4] GC Algorithms: Implementations https://plumbr.eu/handbook/garbage-collection-algorithms-implementations#shenandoah [5] OpenJDK JEP 189: Shenandoah: An Ultra-Low-Pause-Time Garbage Collector http://openjdk.java.net/jeps/189 [6] Pauseless Garbage Collection for Java https://www.azul.com/products/zing/pgc/ [7] Garbage collection (computer science) https://en.wikipedia.org/wiki/Garbage_collection_%28computer_science%29 [8] Real-Time Garbage Collection Speeds Embedded Java http://electronicdesign.com/embedded/real-time-garbage-collection-speeds-embedded-java
Stefan PREDA graduated the Faculty of Economic Cybernetics, Statistics and Informatics, with a bachelor degree in Economic Informatics in 2013. In 2015 he got his master degree from the same faculty of the Bucharest University of Economic Studies, specialization in Databases Support for Business. Currently he is working on Oracle Corporation, like Principal Technical Support Engineer, software analyst, in Fusion Middleware, EMEA Identity Management team.
Database Systems Journal vol. VI, no. 4/2015 33
Data mining in healthcare: decision making and precision
Ionuț ȚĂRANU University of Economic Studies, Bucharest, Romania
[email protected] The trend of application of data mining in healthcare today is increased because the health sector is rich with information and data mining has become a necessity. Healthcare organizations generate and collect large volumes of information to a daily basis. Use of information technology enables automation of data mining and knowledge that help bring some interesting patterns which means eliminating manual tasks and easy data extraction directly from electronic records, electronic transfer system that will secure medical records, save lives and reduce the cost of medical services as well as enabling early detection of infectious diseases on the basis of advanced data collection. Data mining can enable healthcare organizations to anticipate trends in the patient's medical condition and behaviour proved by analysis of prospects different and by making connections between seemingly unrelated information. The raw data from healthcare organizations are voluminous and heterogeneous. It needs to be collected and stored in organized form and their integration allows the formation unite medical information system. Data mining in health offers unlimited possibilities for analyzing different data models less visible or hidden to common analysis techniques. These patterns can be used by healthcare practitioners to make forecasts, put diagnoses, and set treatments for patients in healthcare organizations. Keywords: Data Mining, Big Data, Knowledge Discovery
Introduction Health organizations today are capable of generating and collecting a large
amount of data. This increase in data volume automatically requires the data to be retrieved when needed. With the use of data mining techniques is possible to extract the knowledge and determine interesting and useful patterns. The knowledge gained in this way can be used in the proper order to improve work efficiency and enhance the quality of decision making. Above the foregoing is a great need for new generation of theories and computational tools to help people with extracting useful information from the growing volume of digital data [1]. Information technologies are implemented increasingly often in healthcare organizations to meet the needs of physicians in their daily decision making. Computer systems used in data mining can be very useful to control human limitations such as subjectivity and error due to fatigue and to provide guidance to decision-making processes [2]. The essence of data mining is
to identify relationships, patterns and models which support predictions and decision-making process for diagnosis and treatment planning. These can be called predictive models, and integrated in hospitals information systems as models of decision making, reduce subjectivity and the necessity for reducing the time for decision making. In addition, the use of information technology in healthcare enables the comprehensive management of medical knowledge and its secure exchange between healthcare providers and beneficiaries [3]. Obtaining information using computers can help the quality of decision-making and avoiding human error. When there is a large volume of data that must be processed by the people, making decisions is generally of poor quality [4]. Data mining is the process of analyzing the raw data using a computer and extracts their meaning. The process is often defined as the discovery of previously unknown and potentially useful information from large volumes of data (unstructured) [5].
1
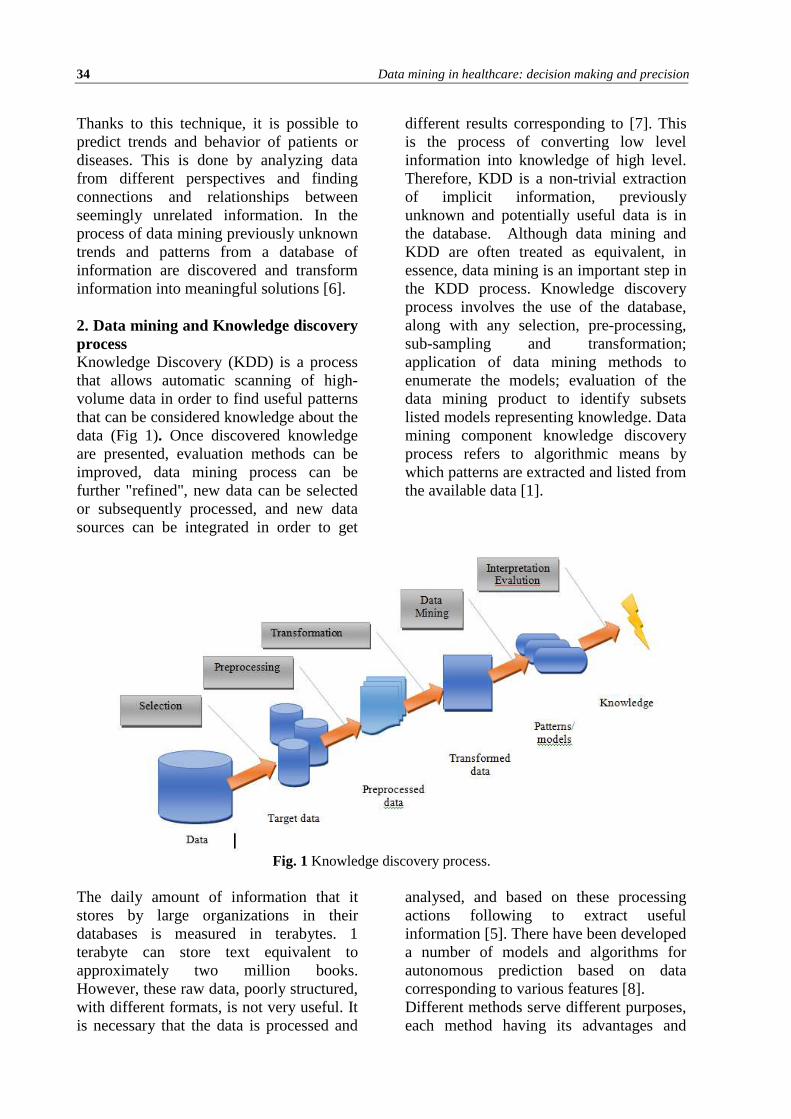
34 Data mining in healthcare: decision making and precision
Thanks to this technique, it is possible to predict trends and behavior of patients or diseases. This is done by analyzing data from different perspectives and finding connections and relationships between seemingly unrelated information. In the process of data mining previously unknown trends and patterns from a database of information are discovered and transform information into meaningful solutions [6]. 2. Data mining and Knowledge discovery process Knowledge Discovery (KDD) is a process that allows automatic scanning of high-volume data in order to find useful patterns that can be considered knowledge about the data (Fig 1). Once discovered knowledge are presented, evaluation methods can be improved, data mining process can be further "refined", new data can be selected or subsequently processed, and new data sources can be integrated in order to get
different results corresponding to [7]. This is the process of converting low level information into knowledge of high level. Therefore, KDD is a non-trivial extraction of implicit information, previously unknown and potentially useful data is in the database. Although data mining and KDD are often treated as equivalent, in essence, data mining is an important step in the KDD process. Knowledge discovery process involves the use of the database, along with any selection, pre-processing, sub-sampling and transformation; application of data mining methods to enumerate the models; evaluation of the data mining product to identify subsets listed models representing knowledge. Data mining component knowledge discovery process refers to algorithmic means by which patterns are extracted and listed from the available data [1].
Fig. 1 Knowledge discovery process.
The daily amount of information that it stores by large organizations in their databases is measured in terabytes. 1 terabyte can store text equivalent to approximately two million books. However, these raw data, poorly structured, with different formats, is not very useful. It is necessary that the data is processed and
analysed, and based on these processing actions following to extract useful information [5]. There have been developed a number of models and algorithms for autonomous prediction based on data corresponding to various features [8]. Different methods serve different purposes, each method having its advantages and

Database Systems Journal vol. VI, no. 4/2015 35
disadvantages. Data mining tasks can be divided into descriptive and predictive [9]. While descriptive tasks aim to find a human interpretation of forms and associations, after reviewing the data and the entire construction of the model, prediction tasks tend to predict an outcome of interest. The main tasks of predictive and descriptive data mining can be classified as follows [10]: • Classification and Regression - identification of new templates with predefined objectives; These tasks are predictive and they include the creation of models to predict target, or dependent variable from the set of explained or independent variables. • Association rule – association rule analysis type represents a descriptive task which includes determining patterns, or associations, between elements in data sets • Cluster analysis – descriptive data mining task with the goal to group similar objects in the same cluster and different ones in the different clusters. • Text mining – most of the available data is in the form of unstructured or partially structured text, and it is different from conventional data that are completely structured. While text mining tasks usually fall under classification, clustering and association rule data mining categories, it is the best to observe them separately, because unstructured text demands a specific consideration. In particular, method for representation of textual data is critical. • Link analysis – Form of network analysis that examines the associations between objects. Link classification provides category of an object, not just based on its features, but also on connections in which it takes part, and features of objects connected with certain path [11]. 3. Application of data mining in healthcare Healthcare abounds various information which causes the necessity of data mining
application. It is well known that healthcare is a complex area where new knowledge is being accumulated daily in a growing rate. Big part of this knowledge is in the form of paperwork, resulting from a studies conducted on data and information collected from the patient’s healthcare records. There is a big tendency today to make this information available in electronic form, converting information to knowledge, which is not an easy thing to do [12]. All healthcare institutions need an expert analysis of their medical data, project that is time consuming and expensive [13]. The ability to use a data in databases in order to extract useful information for quality health care is a key of success of healthcare institutions [4]. In medical research, data mining begins with the hypothesis and results are adjusted accordingly, different from standard data mining practice, that begins with a set of data without obvious hypothesis [14]. While the traditional data mining is focused on patterns and trends in data sets, data mining in healthcare is more focused on minority that is not in accordance with patterns and trends. The fact that standard data mining is more focused on describing and not explaining the patterns and trends, is the one thing that deepens the difference between standard and healthcare data mining. Healthcare needs these explanations since the small difference can stand between life and death of a patient. Here are some of the techniques of data mining, which are successfully used in healthcare, such as artificial neural networks, decision trees, and genetic algorithms and nearest neighbour method. Artificial neural networks are analytical techniques that are formed on the basis of superior learning processes in the human brain. Neural networks are groups of connected input/output units where each connection has its own weight (Fig 2) [15].
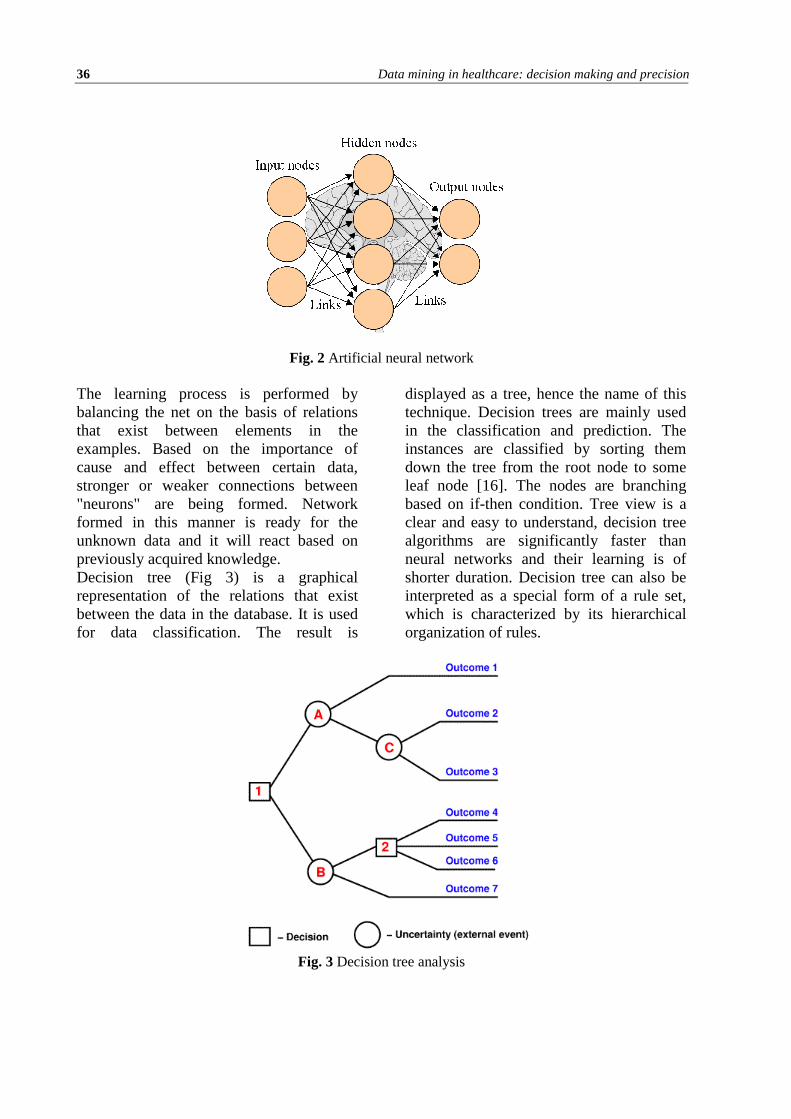
36 Data mining in healthcare: decision making and precision
Fig. 2 Artificial neural network
The learning process is performed by balancing the net on the basis of relations that exist between elements in the examples. Based on the importance of cause and effect between certain data, stronger or weaker connections between "neurons" are being formed. Network formed in this manner is ready for the unknown data and it will react based on previously acquired knowledge. Decision tree (Fig 3) is a graphical representation of the relations that exist between the data in the database. It is used for data classification. The result is
displayed as a tree, hence the name of this technique. Decision trees are mainly used in the classification and prediction. The instances are classified by sorting them down the tree from the root node to some leaf node [16]. The nodes are branching based on if-then condition. Tree view is a clear and easy to understand, decision tree algorithms are significantly faster than neural networks and their learning is of shorter duration. Decision tree can also be interpreted as a special form of a rule set, which is characterized by its hierarchical organization of rules.
Fig. 3 Decision tree analysis
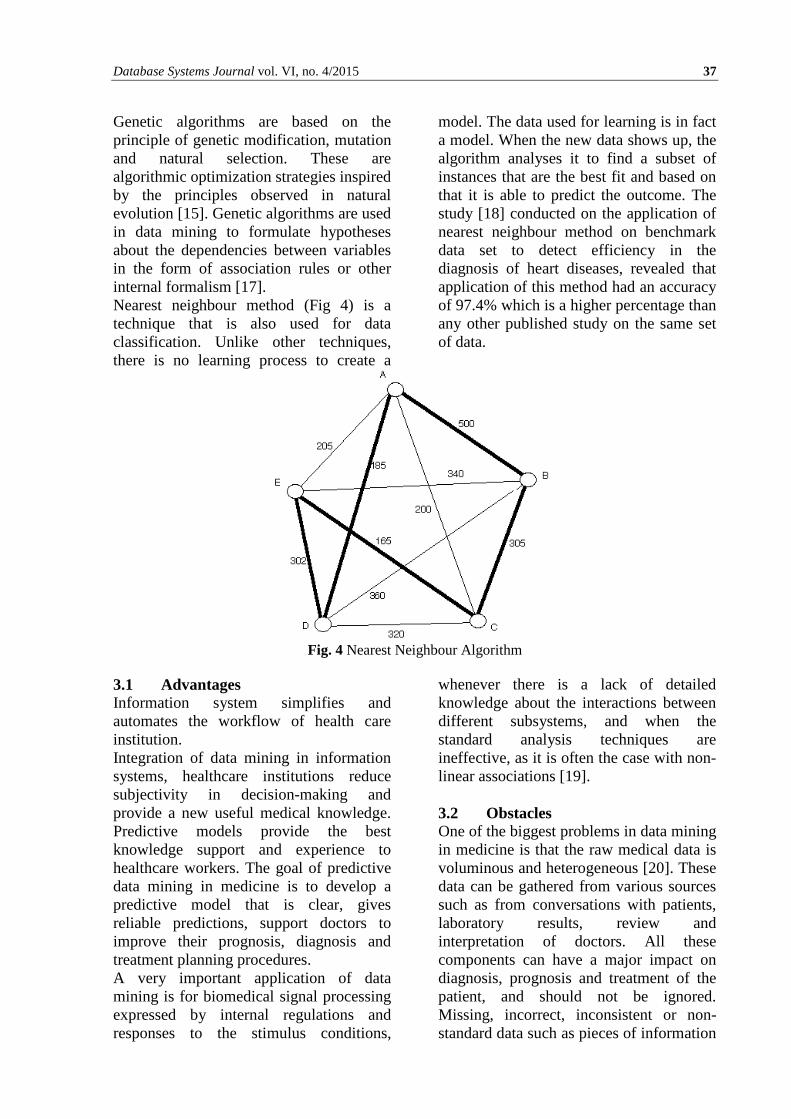
Database Systems Journal vol. VI, no. 4/2015 37
Genetic algorithms are based on the principle of genetic modification, mutation and natural selection. These are algorithmic optimization strategies inspired by the principles observed in natural evolution [15]. Genetic algorithms are used in data mining to formulate hypotheses about the dependencies between variables in the form of association rules or other internal formalism [17]. Nearest neighbour method (Fig 4) is a technique that is also used for data classification. Unlike other techniques, there is no learning process to create a
model. The data used for learning is in fact a model. When the new data shows up, the algorithm analyses it to find a subset of instances that are the best fit and based on that it is able to predict the outcome. The study [18] conducted on the application of nearest neighbour method on benchmark data set to detect efficiency in the diagnosis of heart diseases, revealed that application of this method had an accuracy of 97.4% which is a higher percentage than any other published study on the same set of data.
Fig. 4 Nearest Neighbour Algorithm
3.1 Advantages Information system simplifies and automates the workflow of health care institution. Integration of data mining in information systems, healthcare institutions reduce subjectivity in decision-making and provide a new useful medical knowledge. Predictive models provide the best knowledge support and experience to healthcare workers. The goal of predictive data mining in medicine is to develop a predictive model that is clear, gives reliable predictions, support doctors to improve their prognosis, diagnosis and treatment planning procedures. A very important application of data mining is for biomedical signal processing expressed by internal regulations and responses to the stimulus conditions,
whenever there is a lack of detailed knowledge about the interactions between different subsystems, and when the standard analysis techniques are ineffective, as it is often the case with non-linear associations [19]. 3.2 Obstacles One of the biggest problems in data mining in medicine is that the raw medical data is voluminous and heterogeneous [20]. These data can be gathered from various sources such as from conversations with patients, laboratory results, review and interpretation of doctors. All these components can have a major impact on diagnosis, prognosis and treatment of the patient, and should not be ignored. Missing, incorrect, inconsistent or non-standard data such as pieces of information
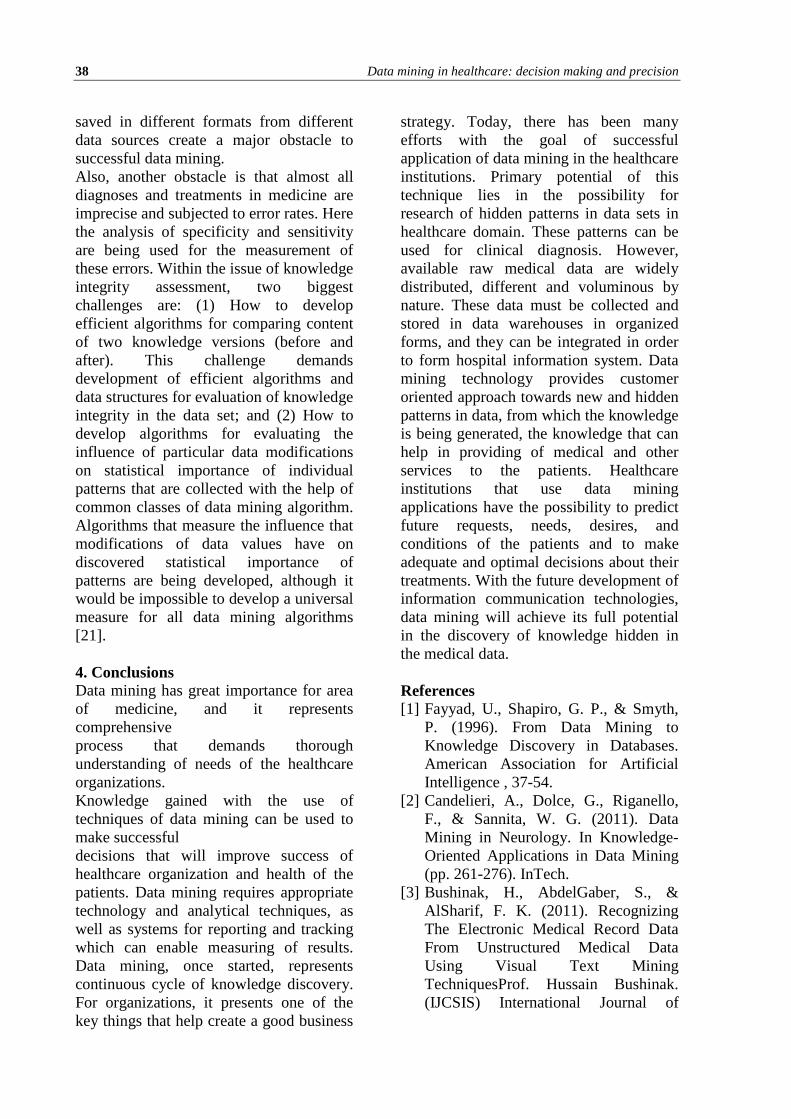
38 Data mining in healthcare: decision making and precision
saved in different formats from different data sources create a major obstacle to successful data mining. Also, another obstacle is that almost all diagnoses and treatments in medicine are imprecise and subjected to error rates. Here the analysis of specificity and sensitivity are being used for the measurement of these errors. Within the issue of knowledge integrity assessment, two biggest challenges are: (1) How to develop efficient algorithms for comparing content of two knowledge versions (before and after). This challenge demands development of efficient algorithms and data structures for evaluation of knowledge integrity in the data set; and (2) How to develop algorithms for evaluating the influence of particular data modifications on statistical importance of individual patterns that are collected with the help of common classes of data mining algorithm. Algorithms that measure the influence that modifications of data values have on discovered statistical importance of patterns are being developed, although it would be impossible to develop a universal measure for all data mining algorithms [21]. 4. Conclusions Data mining has great importance for area of medicine, and it represents comprehensive process that demands thorough understanding of needs of the healthcare organizations. Knowledge gained with the use of techniques of data mining can be used to make successful decisions that will improve success of healthcare organization and health of the patients. Data mining requires appropriate technology and analytical techniques, as well as systems for reporting and tracking which can enable measuring of results. Data mining, once started, represents continuous cycle of knowledge discovery. For organizations, it presents one of the key things that help create a good business
strategy. Today, there has been many efforts with the goal of successful application of data mining in the healthcare institutions. Primary potential of this technique lies in the possibility for research of hidden patterns in data sets in healthcare domain. These patterns can be used for clinical diagnosis. However, available raw medical data are widely distributed, different and voluminous by nature. These data must be collected and stored in data warehouses in organized forms, and they can be integrated in order to form hospital information system. Data mining technology provides customer oriented approach towards new and hidden patterns in data, from which the knowledge is being generated, the knowledge that can help in providing of medical and other services to the patients. Healthcare institutions that use data mining applications have the possibility to predict future requests, needs, desires, and conditions of the patients and to make adequate and optimal decisions about their treatments. With the future development of information communication technologies, data mining will achieve its full potential in the discovery of knowledge hidden in the medical data. References [1] Fayyad, U., Shapiro, G. P., & Smyth,
P. (1996). From Data Mining to Knowledge Discovery in Databases. American Association for Artificial Intelligence , 37-54.
[2] Candelieri, A., Dolce, G., Riganello, F., & Sannita, W. G. (2011). Data Mining in Neurology. In Knowledge-Oriented Applications in Data Mining (pp. 261-276). InTech.
[3] Bushinak, H., AbdelGaber, S., & AlSharif, F. K. (2011). Recognizing The Electronic Medical Record Data From Unstructured Medical Data Using Visual Text Mining TechniquesProf. Hussain Bushinak. (IJCSIS) International Journal of
Database Systems Journal vol. VI, no. 4/2015 39
Computer Science and Information Security, Vol. 9, No. 6 , 25-35.
[4] Eapen, A. G. (2004). Application of Data mining in Medical Applications. Ontario, Canada, 2004: University of Waterloo.
[5] Milovic, B. (2011). Usage of Data Mining in Making Business Decision. YU Info 2012 & ICIST 2012, (pp. 153-157).
[6] boirefillergroup.com. (2010). Data Mining Methodology. Retrieved 06 12, 2012,from Boire-Filler Group: http://www.boirefillergroup.com/methodology.php
[7] Zaïane, O. R. (1999). Principles of Knowledge Discovery in Databases. Department of Computing Science, University of Alberta.
[8] Kusiak, A., Kernstine, K., Kern, J., McLaughlin, K., & Tseng, T. (2000). Data Mining: Medical and Engineering Case Studies. Industrial Engineering Research 2000 Conference, (pp. 1-7). Cleveland, Ohio.
[9] Bellazzi, R., & Zupan, B. (2008). Predictive data mining in clinical medicine: Current issues and guidelines. international journal of medical informatics 77 , 81–97.
[10] Weiss, G. M., & Davison, B. D. (2010). Data Mining. Handbook of Technology Management, H. Bidgoli (Ed.), John Wiley and Sons .
[11] Getoor, L. (2003). Link Mining: A New Data Mining Challenge. SIGKDD Explorations Volume 4, Issue 2 .
[12] Ceusters, W. (2001). Medical Natural Language Understanding as a Supporting Technology for Data Mining in Healthcare. KJ Cios (ed.) Medical Data Mining and Knowledge Discovery, Physica-verlag Heidelberg, (pp. 41-67). New York.
[13] Matheus, C. J., Shapiro, G. P., & McNeill, D. (1996). Selecting and Reporting What is Interesting: The KEFIR Application to Healthcare
Data. Advances in Knowledge Discovery and Data Mining, AAAI/MIT Press , 445-463.
[14] Canlas, R. D. (2009). Data Mining in Healthcare: Current Applications and Issues. Carnegie Mellon University, Australia.
[15] Gupta, S., Kumar, D., & Sharma, A. (2011). Data Mining Classification Techniques Applied For Breast Cancer Diagnosis And Prognosis. Indian Journal of Computer Science and Engineering (IJCSE) 188-195.
[16] Khan, F. S., Anwer, R. M., Torgersson, O., & Falkman, G. (2008). Data Mining in Oral Medicine Using Decision Trees. World Academy of Science, Engineering and Technology 37, (pp. 225-230).
[17] Ngan, P. S., Wong, M. L., Lam, W., Leung, K. S., & Cheng, J. C. (1999). Medical data mining using evolutionary computation. Artificial Intelligence in Medicine 16, (pp. 73–96).
[18] Shouman, M., Turner, T., & Stocker, R. (2012). Applying k-Nearest Neighbour in Diagnosing Heart Disease Patients. 2012 International Conference on Knowledge Discovery (ICKD 2012) IPCSIT Vol. XX. Singapore: IACSIT Press.
[19] Stühlinger, W., Hogl, O., Stoyan, H., & Müller, M. (2000). Intelligent Data Mining for Medical Quality Management. Proc. Fifth Workshop Intelligent Data Analysis in Medicine and Pharmacology (IDAMAP2000), Workshop Notes of the 14th European Conf. Artificial Intelligence.
[20] Cios, K. J., & Moore, G. W. (2002). Uniqueness of Medical Data Mining. To appear in Artificial Intelligence in Medicine journal .
[21] Yang, Q., & Wu, X. (2006). 10 Challenging problems in data mining research. International Journal of Information Technology & Decision Making Vol. 5, No. 4 , 597–604.

40 Data mining in healthcare: decision making and precision
Ionuţ ŢĂRANU graduated from the Faculty of Cybernetics, Statistics and Economic Informatics of the Academy of Economic Studies in 1996, having its Master degree on “Database support for business”. At present is in the process of getting his title of doctor in economy in the specialty of “Soft-computing methods for early medical diagnosis”. He has been an Assistant Professor for 4 years at “Titu Maiorescu” University and also for 4 years at Academy of Economic Studies from Bucharest. He published a
series of articles, from which the most important are Applying ABCD Rule of Dermatoscopy using cognitive systems and ABCDE Rule in Dermoscopy – Registration and determining the impact of parameter E for evolution in diagnosing skin cancer using soft computing algorithms. Mr. Taranu is currently the General Manager of Stima Soft company. He has more than 15 years of experience as a project manager and a business analyst with over 13 years of expertise in Software development, Business Process Management, Enterprise Architecture design and Outsourcing services. He is also involved in research projects, from which the most relevant are:
• Development of an Intelligent System for predicting, analyzing and monitoring performance indicators of technological and business processes in renewable energy area;
• Development of an eHealth platform for improving quality of life and the personalization of therapy at patients with diabetes;
• Development of an Educational Portal and integrated electronic system of education at the University of Medicine and Pharmacy "Carol Davila” to develop medical performance in dermatological oncology field;