Embed Size (px)
Citation preview
Database Basics
• Overview of Databases
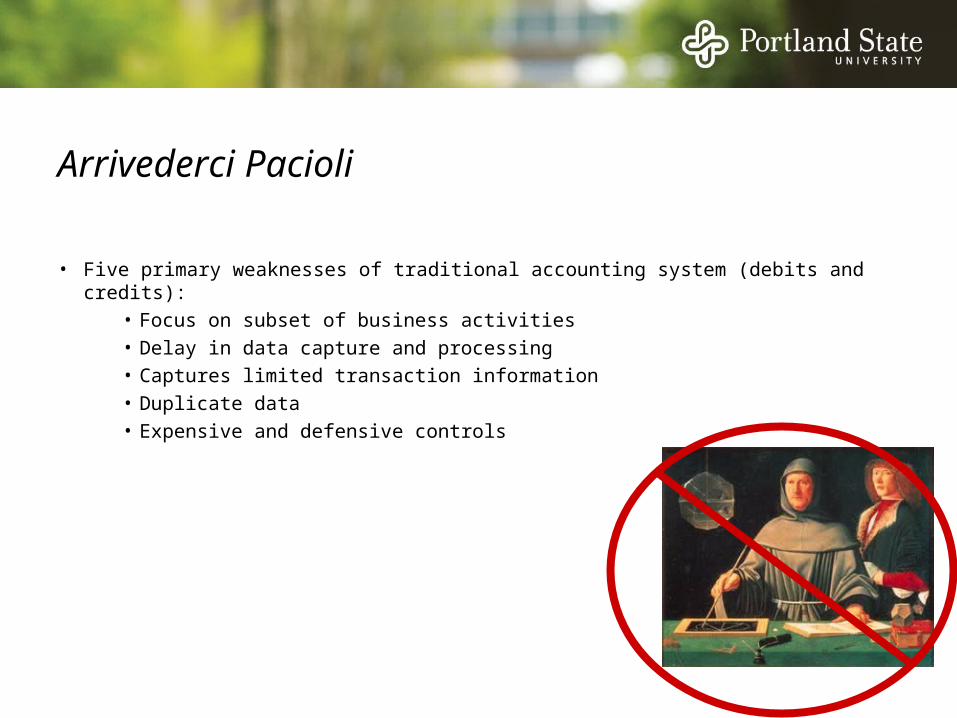
Arrivederci Pacioli
• Five primary weaknesses of traditional accounting system (debits and credits):• Focus on subset of business activities• Delay in data capture and processing• Captures limited transaction information• Duplicate data• Expensive and defensive controls
Why is understanding relational databases important?
• All modern accounting software / ERP software is supported by relational databases.
• To understand how these systems operate, you need to understand relational databases.
• Custom reports are created using query writing languages to pull information from the database. If you do not understand the databases, it is very difficult to create reports.
Motivation for“REA” Component
• Modern IS’s run on top of databases, making it important to understand how databases store and process information.
• E-R is the standard for modeling RDBMS• REA models provide an intermediate view of business
processes.– Value chain, value system, and strategy are high level
analyses– REA is intermediate level– Flowcharts are low level
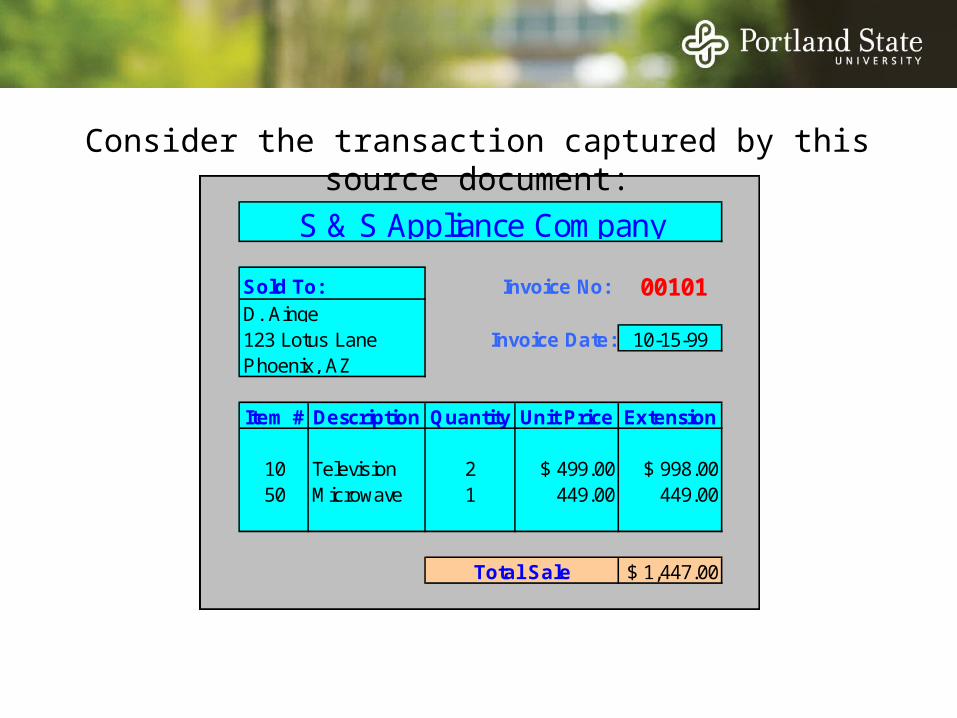
00101
10-15-99
Item # Description Quantity Unit Price Extension
10 Television 2 $ 499.00 $ 998.0050 Microwave 1 449.00 449.00
$ 1,447.00
S & S Appliance Company
Total Sale
Sold To:D. Ainge123 Lotus LanePhoenix, AZ
Invoice No:
Invoice Date:
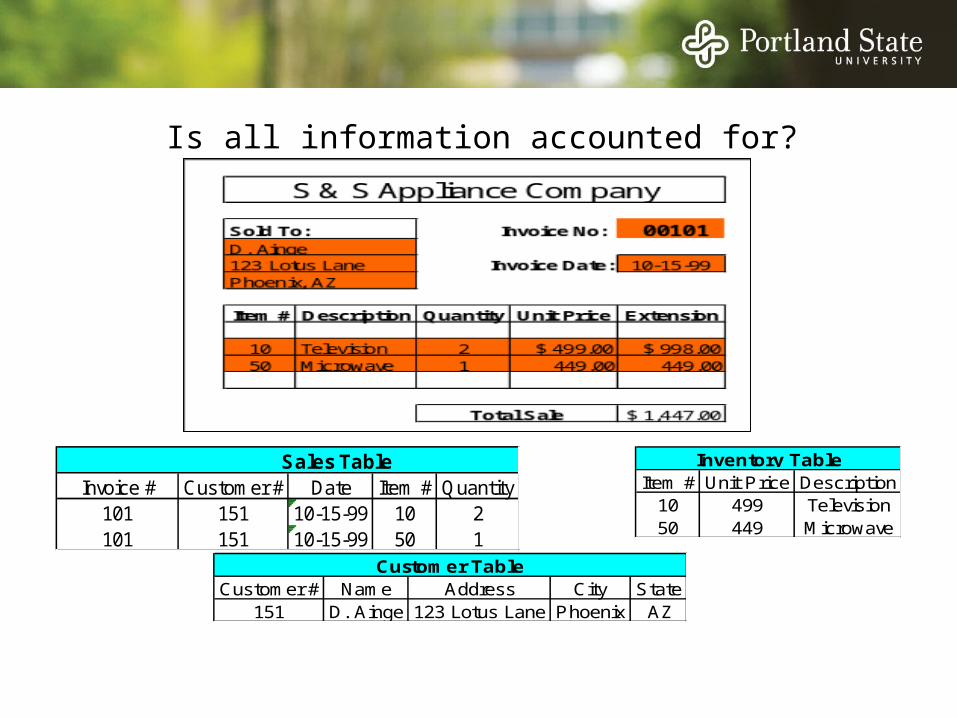
Consider the transaction captured by this source document:
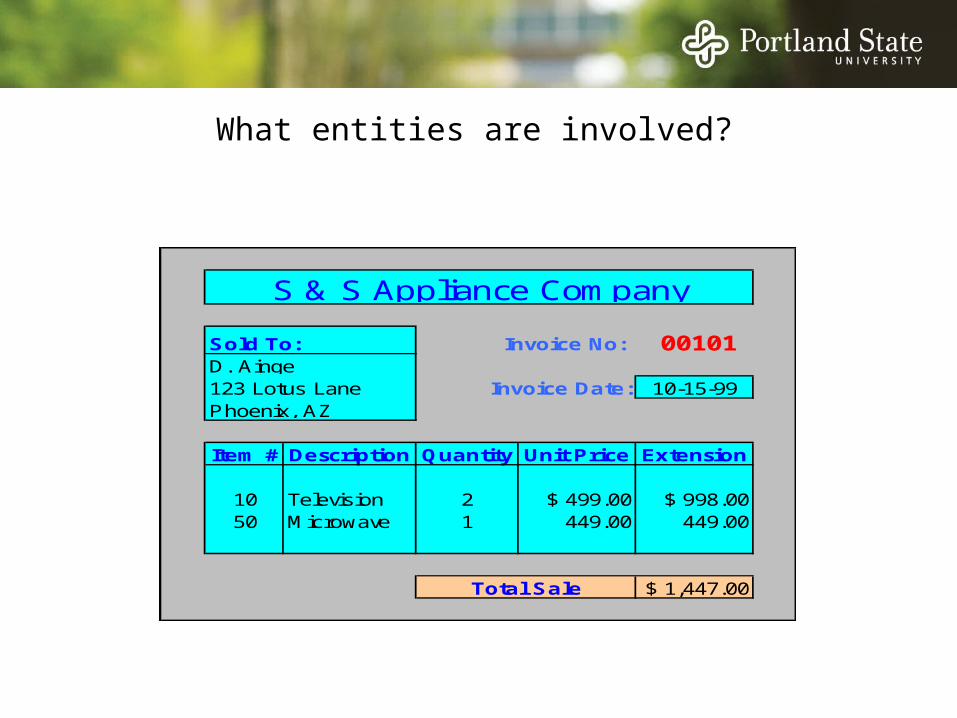
00101
10-15-99
Item # Description Quantity Unit Price Extension
10 Television 2 $ 499.00 $ 998.0050 Microwave 1 449.00 449.00
$ 1,447.00
S & S Appliance Company
Total Sale
Sold To:D. Ainge123 Lotus LanePhoenix, AZ
Invoice No:
Invoice Date:
What entities are involved?
Customer # Name Address City State151 D. Ainge 123 Lotus Lane Phoenix AZ
Customer TableItem # Unit Price Description10 499 Television50 449 Microwave
Inventory Table
Invoice # Customer # Date Item # Quantity Extension101 151 10-15-99 10 2 998101 151 10-15-99 50 1 449
Sales Table
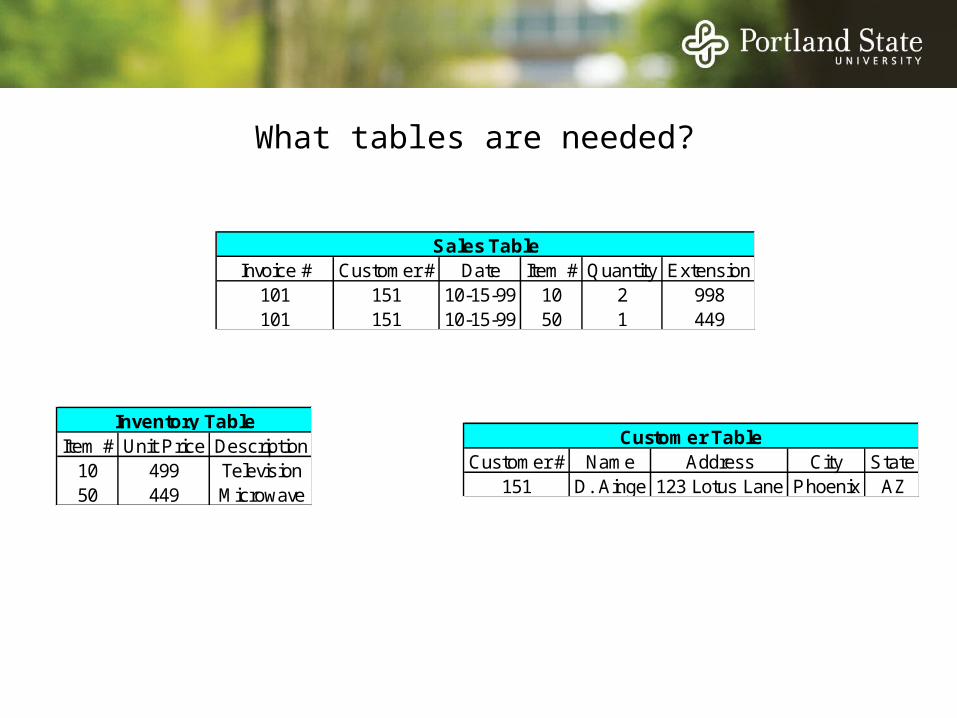
What tables are needed?
Customer # Name Address City State151 D. Ainge 123 Lotus Lane Phoenix AZ
Customer Table
Item # Unit Price Description10 499 Television50 449 Microwave
Inventory Table
Invoice # Customer # Date Item # Quantity101 151 10-15-99 10 2101 151 10-15-99 50 1
Sales Table
Is all information accounted for?
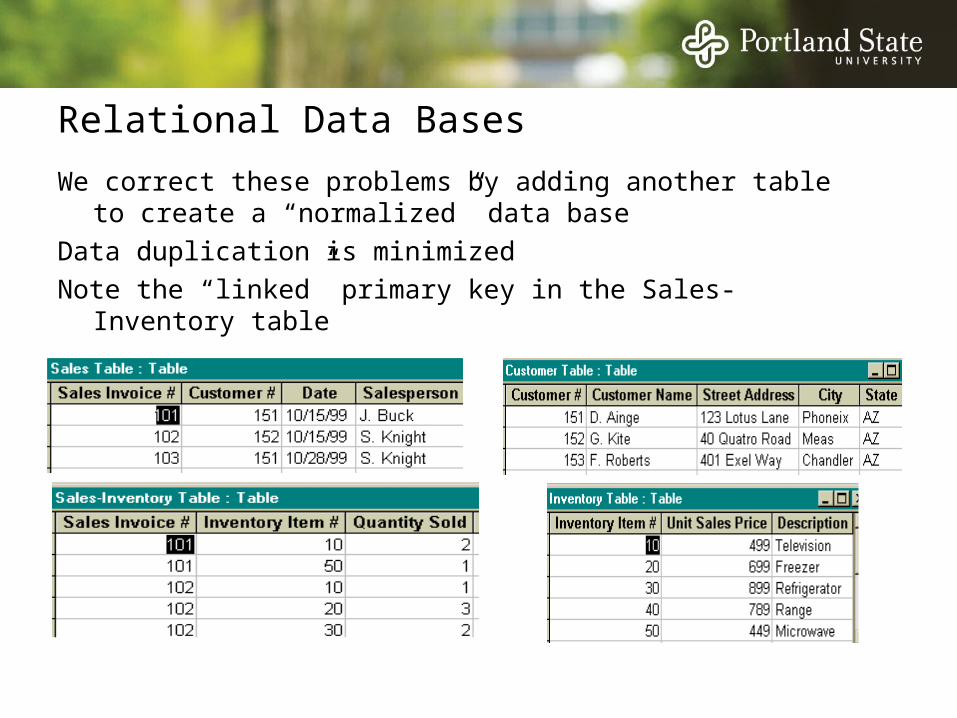
Relational Data Bases
We correct these problems by adding another table to create a “normalized” data base
Data duplication is minimizedNote the “linked” primary key in the Sales-Inventory table
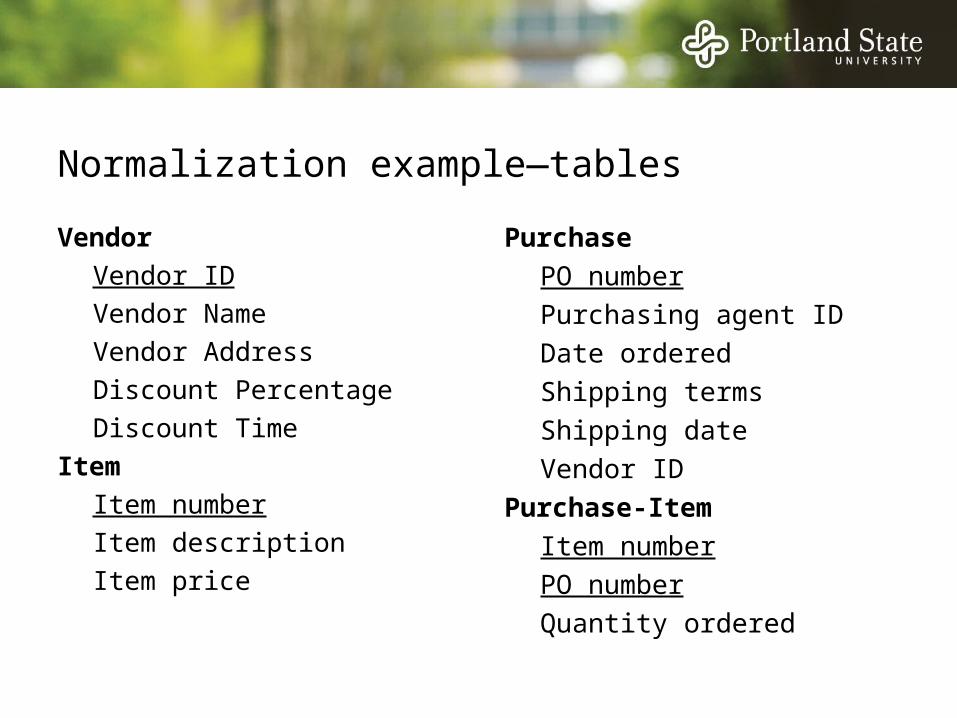
Normalization example—tables
VendorVendor IDVendor NameVendor AddressDiscount PercentageDiscount Time
ItemItem numberItem descriptionItem price
PurchasePO numberPurchasing agent IDDate orderedShipping termsShipping dateVendor ID
Purchase-ItemItem numberPO numberQuantity ordered
Entity-Relationship (E-R) Modeling
• E-R Modeling is one of many ways to draw pictures of businesses.
• Other modeling choices include:– Data flow diagrams (DFD)– Flowchart
• E-R modeling is an ART—may be a bit of a stretch...it is not a science.
Entity-Relationship—(E-R) Modeling
• Entities represent– People – Places – Things – Occurrences in time (like transactions)
• Relationship– Link related entities
E-R Modeling Example
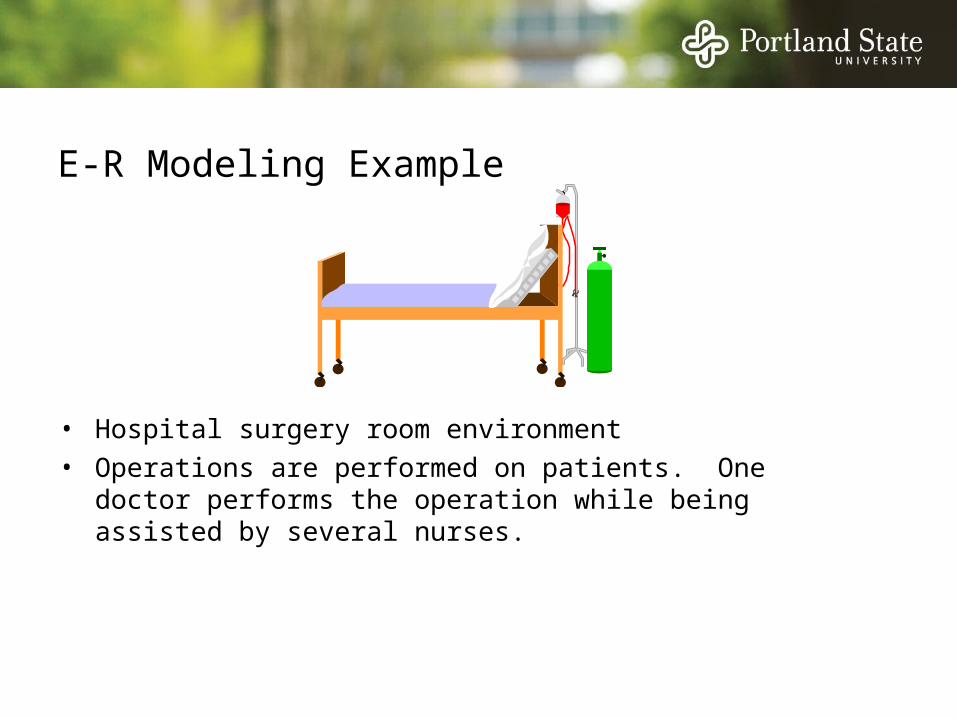
• Hospital surgery room environment• Operations are performed on patients. One doctor
performs the operation while being assisted by several nurses.
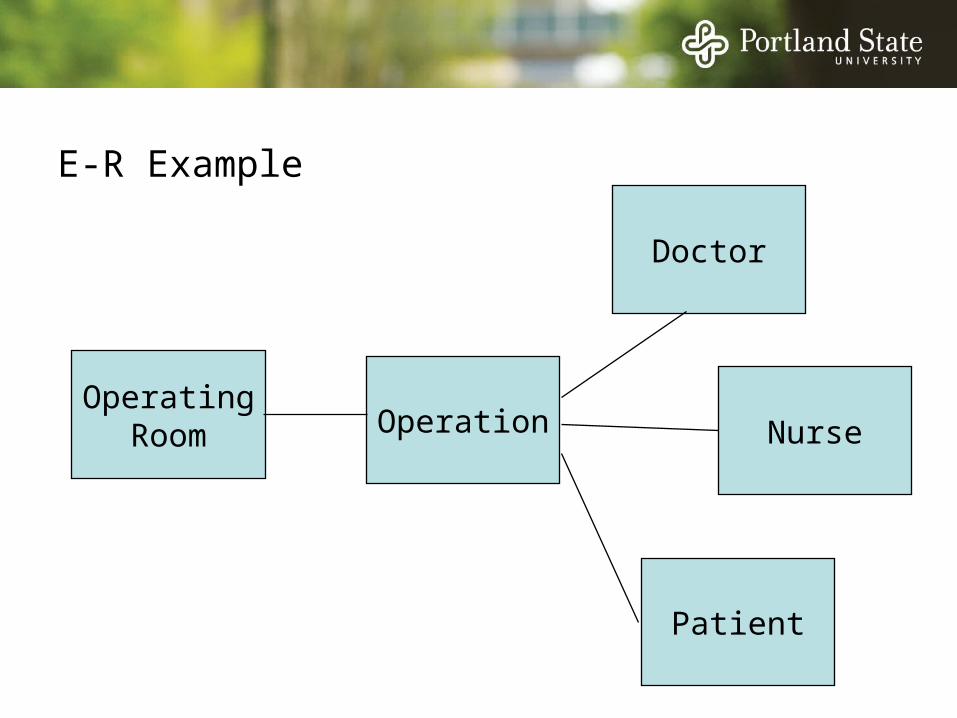
E-R Example
Nurse
Patient
Doctor
OperationOperating
Room
REA vs. E-R
• The REA framework says that the world consists solely of Resources, Events, and Agents (Locations?)
• E-R modeling is a method of drawing pictures.
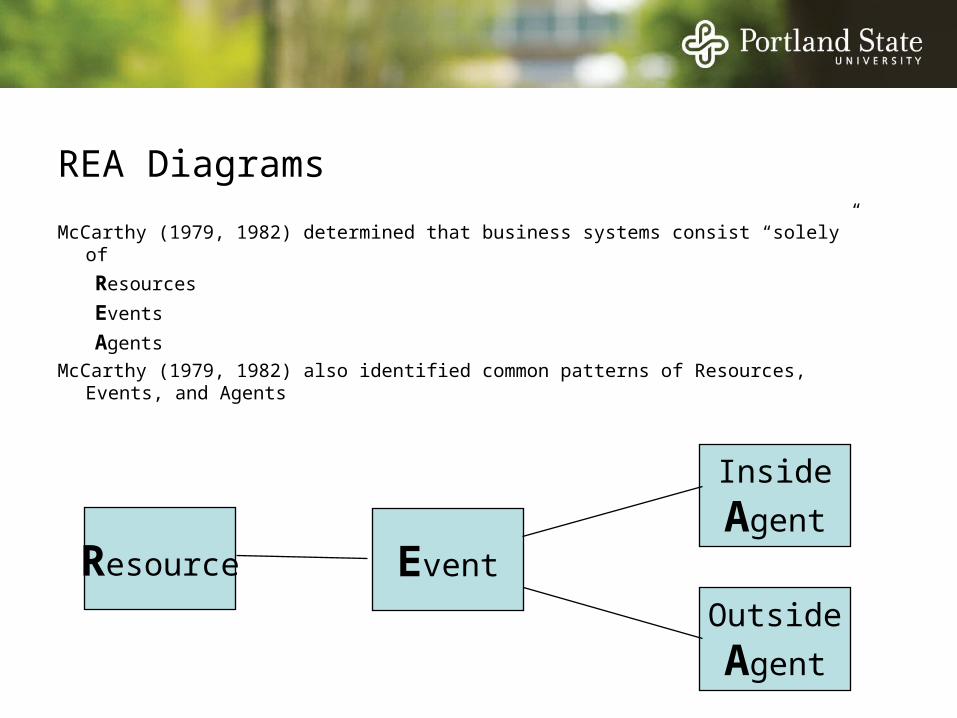
REA Diagrams
McCarthy (1979, 1982) determined that business systems consist “solely” of
Resources
Events
Agents
McCarthy (1979, 1982) also identified common patterns of Resources, Events, and Agents
Resource Event
Inside
Agent
Outside
Agent
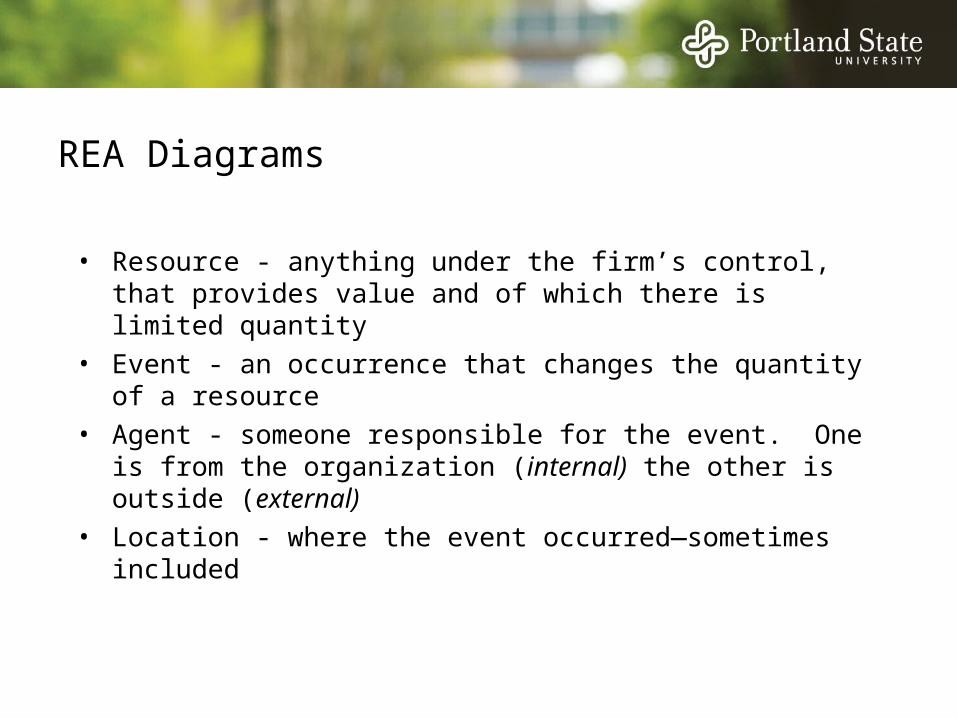
REA Diagrams
• Resource - anything under the firm’s control, that provides value and of which there is limited quantity
• Event - an occurrence that changes the quantity of a resource
• Agent - someone responsible for the event. One is from the organization (internal) the other is outside (external)
• Location - where the event occurred—sometimes included
ResourceIncrease
EventOutsideAgent
InsideAgent
ResourceDecrease
EventOutsideAgent
InsideAgent
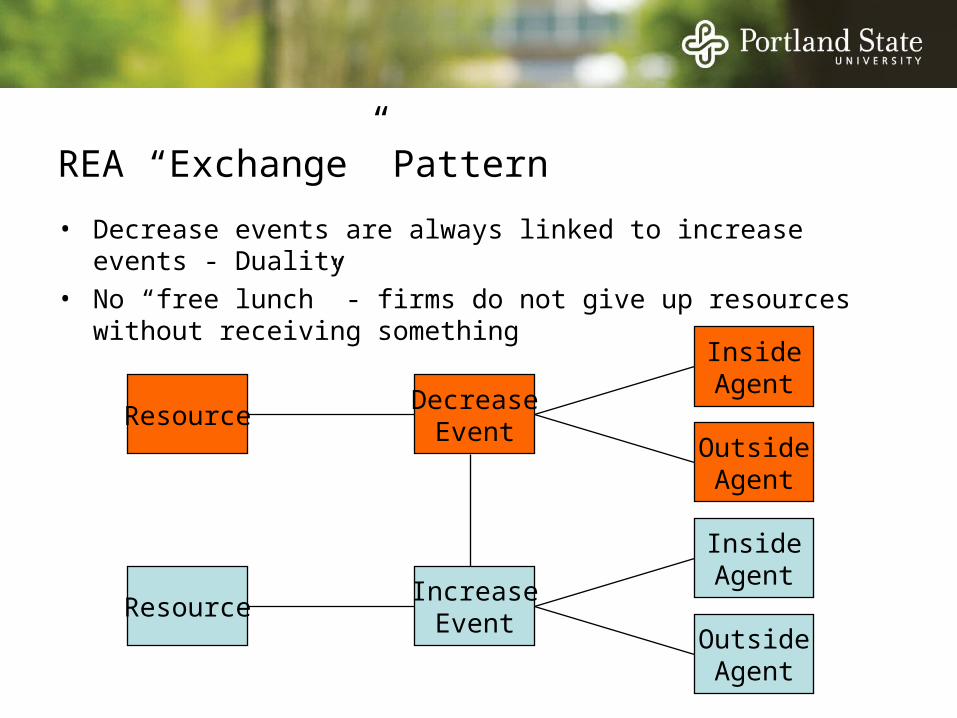
REA “Exchange” Pattern
• Decrease events are always linked to increase events - Duality
• No “free lunch” - firms do not give up resources without receiving something
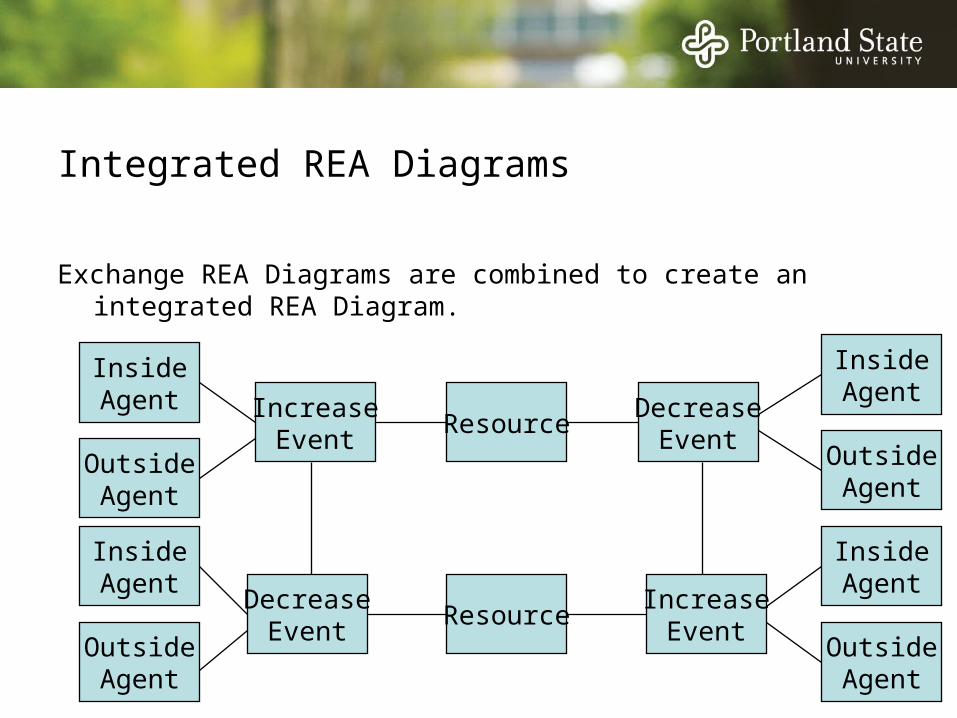
Integrated REA Diagrams
Exchange REA Diagrams are combined to create an integrated REA Diagram.
ResourceIncrease
EventOutsideAgent
InsideAgent
ResourceDecrease
EventOutsideAgent
InsideAgent
IncreaseEvent
DecreaseEvent
InsideAgent
InsideAgent
OutsideAgent
OutsideAgent
Integrated REA Diagrams
• Complete Integrated REA Diagrams include an increase event and a decrease event for each resource.
• Resources must come from somewhere• Resources must go somewhere• May choose not to model complete system.
This is a new model, new field, developing field...but the concepts are well-accepted in the database field
• UN/CEFACT (Center for Trade Facilitation)• ISO
REA Data Modeling Process
REA framework - provides conceptual model
Tables - Identify required tables and fields
Database - Build tables, establish relationships, and input data into relational database
Cardinalities
• Definition: the number of times each individual entity can participate in the relationship
• Relationships between entities determine how tables must be related...entities lead to tables
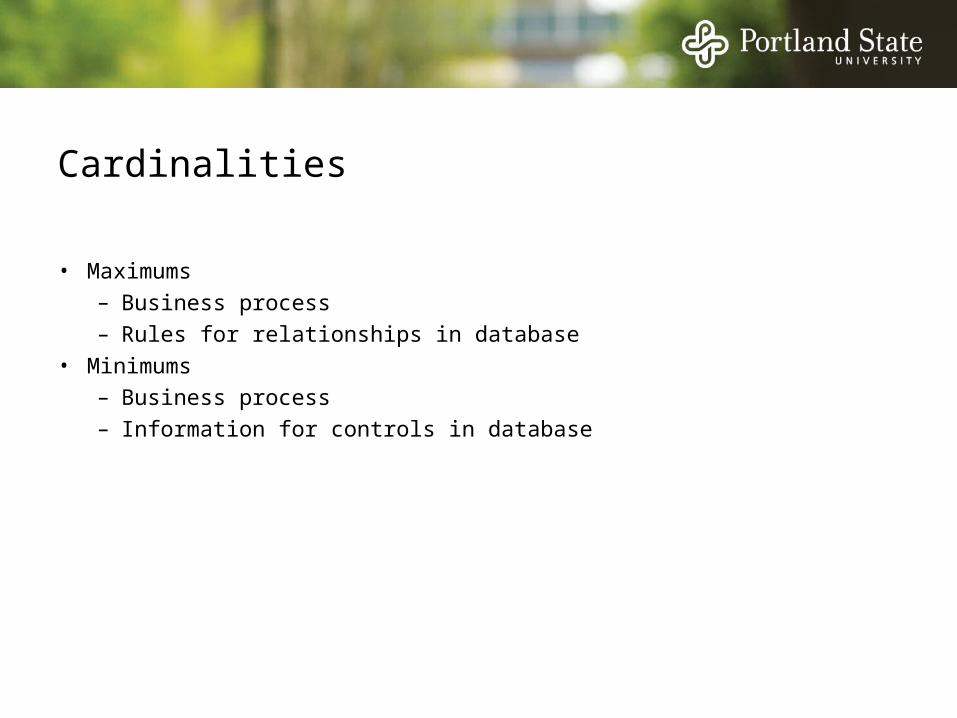
Cardinalities
• Maximums– Business process– Rules for relationships in database
• Minimums– Business process– Information for controls in database
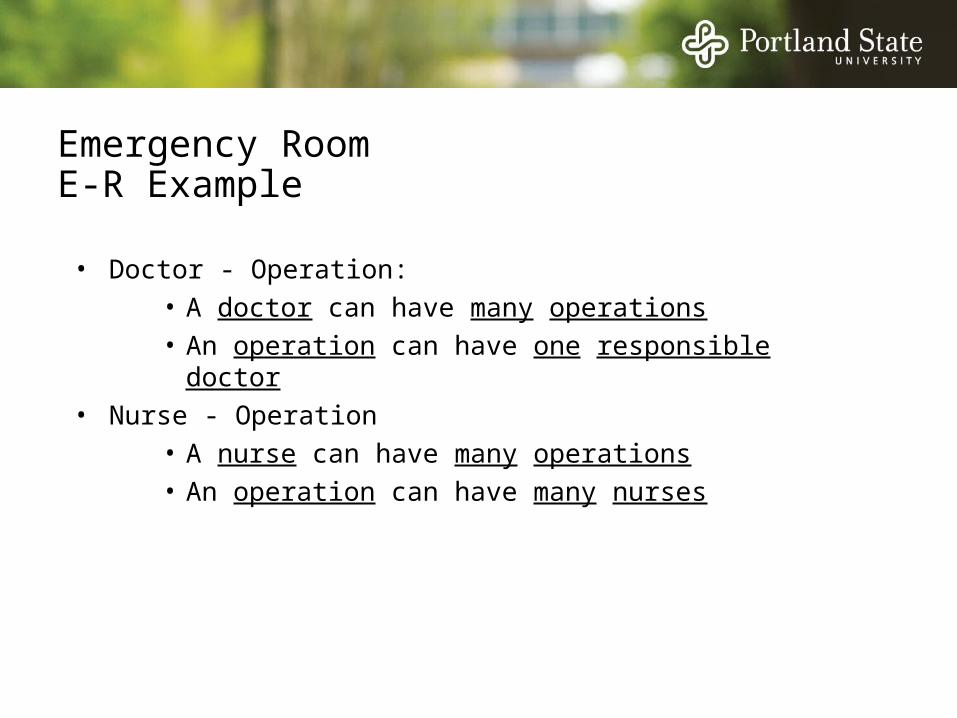
Emergency RoomE-R Example
• Doctor - Operation: • A doctor can have many operations • An operation can have one responsible doctor
• Nurse - Operation• A nurse can have many operations• An operation can have many nurses
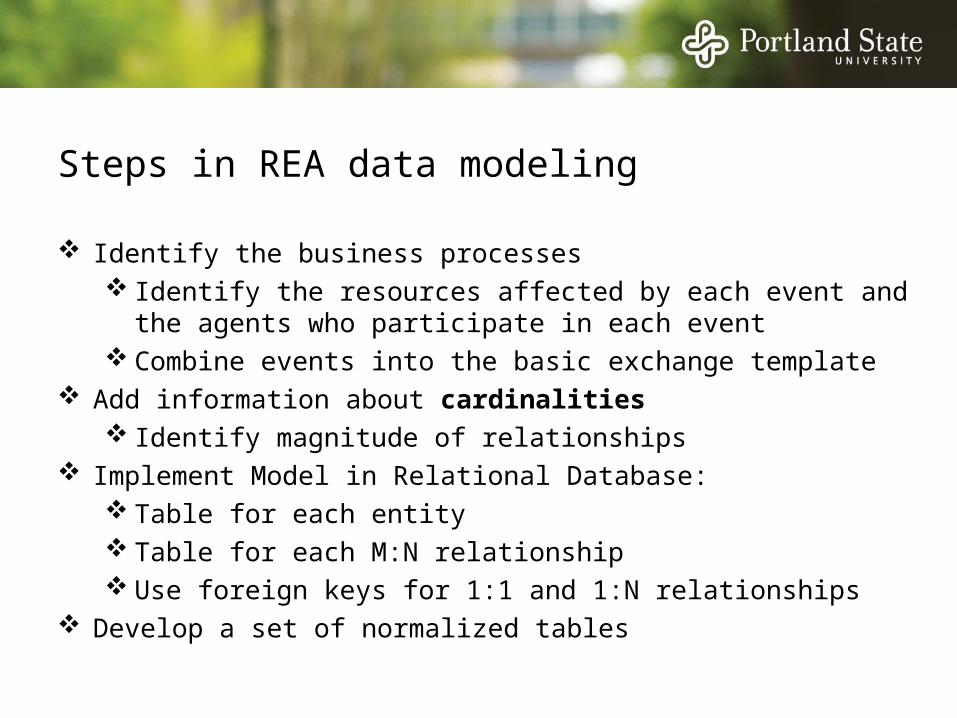
Steps in REA data modeling
Identify the business processes Identify the resources affected by each event and the
agents who participate in each event Combine events into the basic exchange template
Add information about cardinalities Identify magnitude of relationships
Implement Model in Relational Database: Table for each entity Table for each M:N relationship Use foreign keys for 1:1 and 1:N relationships
Develop a set of normalized tables
Queries—putting it back together
• Some query basics• Database languages...data definition, data
manipulation, data query
• Data dictionary...to see what the data look like
• Structured query language (SQL)...standardized query language with many specializations