Embed Size (px)
Citation preview

1
DDAATTAABBAASSEE
Data Warehouse
OLTP Database3NF tables
Operationsdata
Predefinedreports
Data warehouseStar configuration
Daily datatransfer
Interactivedata analysis
Flat files

2
DDAATTAABBAASSEE
Data Warehouse Goals
Existing databases optimized for Online Transaction Processing (OLTP)
Online Analytical Processing (OLAP) requires fast retrievals, and only bulk writes.
Different goals require different storage, so build separate dta warehouse to use for queries.
Extraction, Transformation, Transportation (ETT) Data analysis
Ad hoc queries Statistical analysis Data mining (specialized automated tools)

3
DDAATTAABBAASSEE
Extraction, Transformation, and Transportation (ETT)
Data warehouse:All data must be consistent.
Customers
Convert Client to Customer
Apply standard product numbers
Convert currencies
Fix region codes
Transaction data from diverse systems.

4
DDAATTAABBAASSEE
OLTP v. OLAP

5
DDAATTAABBAASSEE
Multidimensional Cube
TimeSale Date
CustomerLocation
Categ
ory
Pet StoreItem SalesAmount = Quantity*Sale Price

6
DDAATTAABBAASSEE
Sales Date: Time Hierarchy
Year
Quarter
Month
Week
Day
Levels Roll-upTo get higher-level totals
Drill-downTo get lower-level details

7
DDAATTAABBAASSEE
Star Design
SalesQuantity
Amount=SalePrice*Quantity
Fact Table
Products
CustomerLocation
Sales Date
Dimension Tables

8
DDAATTAABBAASSEE
Snowflake Design
SaleIDItemIDQuantitySalePriceAmount
OLAPItems
ItemIDDescriptionQuantityOnHandListPriceCategory
Merchandise
SaleIDSaleDateEmployeeIDCustomerIDSalesTax
Sale
CustomerIDPhoneFirstNameLastNameAddressZipCodeCityID
Customer
CityIDZipCodeCityState
City
Dimension tables can join to other dimension tables.

9
DDAATTAABBAASSEE
OLAP Computation Issues
Compute Quantity*Price in base query, then add to get $23.00
If you use Calculated Measure in the Cube, it will add first and multiply second to get $45.00, which is wrong.

10
DDAATTAABBAASSEE
OLAP Data Browsing
11
DDAATTAABBAASSEE
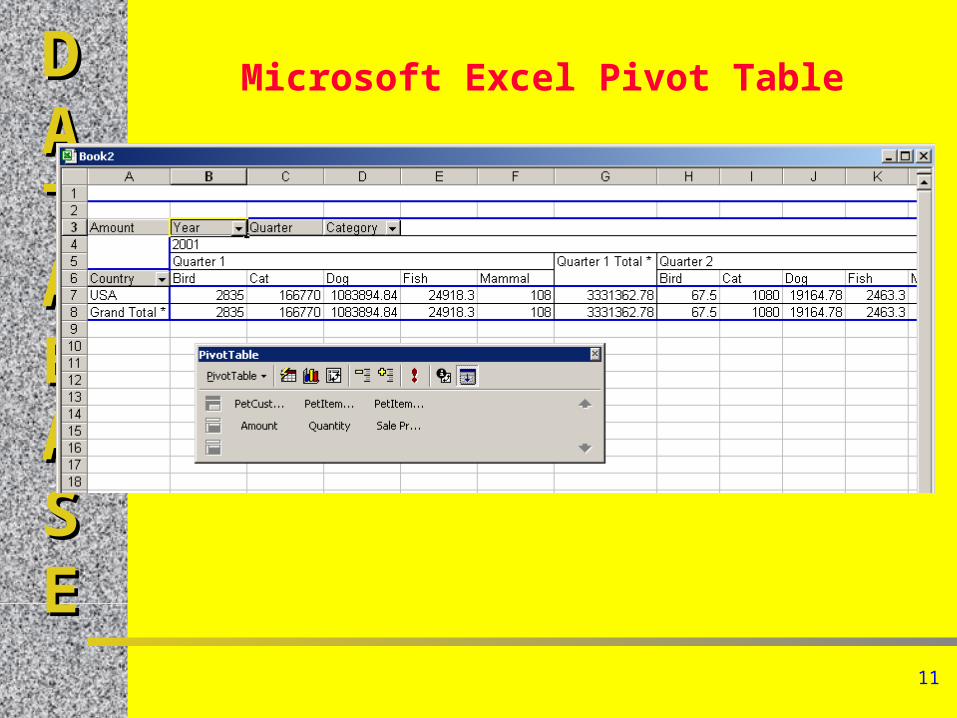
Microsoft Excel Pivot Table

12
DDAATTAABBAASSEE
Excel Pivot Table Reports
Can place data in rows or columns.By grouping months, can instantly get quarterly or monthly totals.
Quarter MonthQuarter 1 Quarter 2 Quarter 3 Quarter 4 Grand Total
LastName EmployeeIDDataCarpenter 8 Sum of Animal 1,668.91 606.97 426.39 7.20 2,709.47
Sum of Merchandise 324.90 78.30 99.00 128.70 630.90Eaton 6 Sum of Animal 522.37 341.85 562.50 1,426.72
Sum of Merchandise 30.60 54.90 107.10 192.60Farris 7 Sum of Animal 5,043.36 1,059.70 796.47 6,899.53
Sum of Merchandise 826.92 188.10 306.00 1,321.02Gibson 2 Sum of Animal 4,983.51 1,549.83 2,556.10 9,089.44
Sum of Merchandise 668.25 238.50 450.90 1,357.65Hopkins 4 Sum of Animal 3,747.96 1,194.88 372.65 128.41 5,443.90
Sum of Merchandise 476.91 252.90 121.50 7.20 858.51James 5 Sum of Animal 3,282.77 2,373.08 437.88 150.11 6,243.84
Sum of Merchandise 505.89 693.45 99.00 99.00 1,397.34O'Connor 9 Sum of Animal 2,643.69 180.91 510.12 3,334.72
Sum of Merchandise 263.70 83.70 55.80 403.20Reasoner 3 Sum of Animal 4,577.43 625.74 589.68 2,500.24 8,293.09
Sum of Merchandise 762.30 89.10 116.80 396.90 1,365.10Reeves 1 Sum of Animal 1,120.93 1,120.93
Sum of Merchandise 263.88 263.88Shields 10 Sum of Animal 1,008.76 162.15 1,170.91
Sum of Merchandise 62.10 22.50 84.60Total Sum of Animal 28,599.69 7,591.11 2,840.72 6,701.03 45,732.55Total Sum of Merchandise 4,185.45 1,624.05 569.50 1,495.80 7,874.80

13
DDAATTAABBAASSEE
OLAP in SQL 99Category Month Amount
Bird 1 $135.00
Bird 2 $45.00
Bird 3 $202.50
Bird 6 $67.50
Bird 7 $90.00
Bird 9 $67.50
Cat 1 $396.00
Cat 2 $113.85
Cat 3 $443.70
Cat 4 $2.25
SELECT Category, Month(SaleDate) AS Month, Sum(Quantity*SalePrice) AS Amount
FROM Sale INNER JOIN (Merchandise INNER JOIN SaleItem ON Merchandise.ItemID = SaleItem.ItemID) ON Sale.SaleID = SaleItem.SaleIDGROUP BY Category, Month(SaleDate);
GROUP BY two columns
Gives you totals for each month within each category.
You do not get super-aggregate totals for the category, or the month, or the overall total.

14
DDAATTAABBAASSEE
SQL ROLLUP
SELECT Category, Month…, Sum …FROM …GROUP BY ROLLUP (Category, Month...)
Bird 1 135.00Bird 2 45.00…Bird (null) 607.50Cat 1 396.00Cat 2 113.85…Cat (null) 1293.30…(null) (null) 8451.79
Category Month Amount

15
DDAATTAABBAASSEE
Missing Values Cause ProblemsIf there are missing values in the groups, it can be difficult to identify the super-aggregate rows.
Bird 1 135.00Bird 2 45.00…Bird (null) 32.00Bird (null) 607.50Cat 1 396.00Cat 2 113.85…Cat (null) 1293.30…(null) (null) 8451.79
Category Month Amount
Super-aggregate
Missing date
16
DDAATTAABBAASSEE
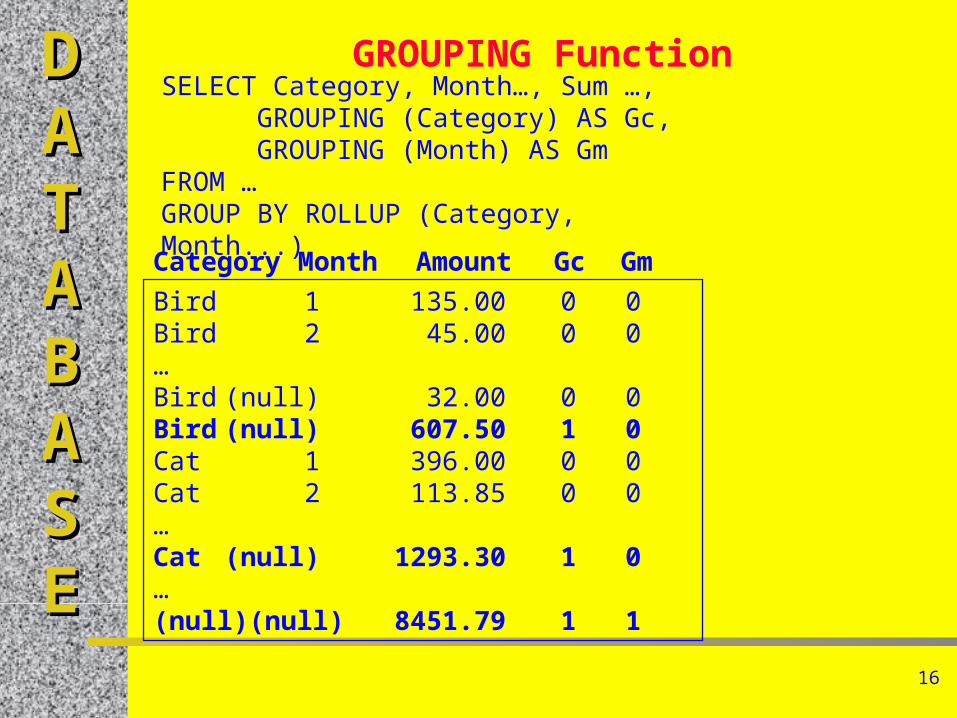
GROUPING FunctionSELECT Category, Month…, Sum …,
GROUPING (Category) AS Gc, GROUPING (Month) AS Gm
FROM …GROUP BY ROLLUP (Category, Month...)
Bird 1 135.00 0 0Bird 2 45.00 0 0…Bird (null) 32.00 0 0Bird (null) 607.50 1 0Cat 1 396.00 0 0Cat 2 113.85 0 0…Cat (null) 1293.30 1 0…(null) (null) 8451.79 1 1
Category Month Amount Gc Gm

17
DDAATTAABBAASSEE
CUBE Option
Bird 1 135.00 0 0Bird 2 45.00 0 0…Bird (null) 32.00 0 0Bird (null) 607.50 1 0Cat 1 396.00 0 0Cat 2 113.85 0 0…Cat (null) 1293.30 1 0(null) 1 1358.8 0 1(null) 2 1508.94 0 1(null) 3 2362.68 0 1…(null) (null) 8451.79 1 1
Category Month Amount Gc Gm
SELECT Category, Month, Sum, GROUPING (Category) AS Gc, GROUPING (Month) AS Gm
FROM …GROUP BY CUBE (Category, Month...)
18
DDAATTAABBAASSEE
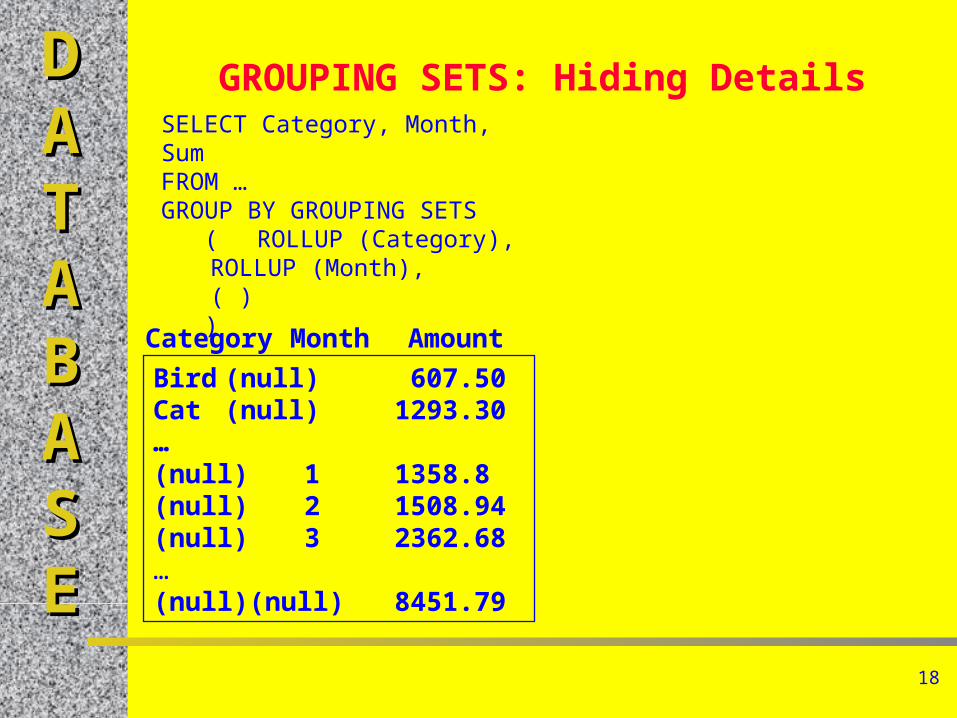
GROUPING SETS: Hiding Details
Bird (null) 607.50Cat (null) 1293.30…(null) 1 1358.8(null) 2 1508.94(null) 3 2362.68…(null) (null) 8451.79
Category Month Amount
SELECT Category, Month, SumFROM …GROUP BY GROUPING SETS ( ROLLUP (Category),
ROLLUP (Month),( )
)
19
DDAATTAABBAASSEE
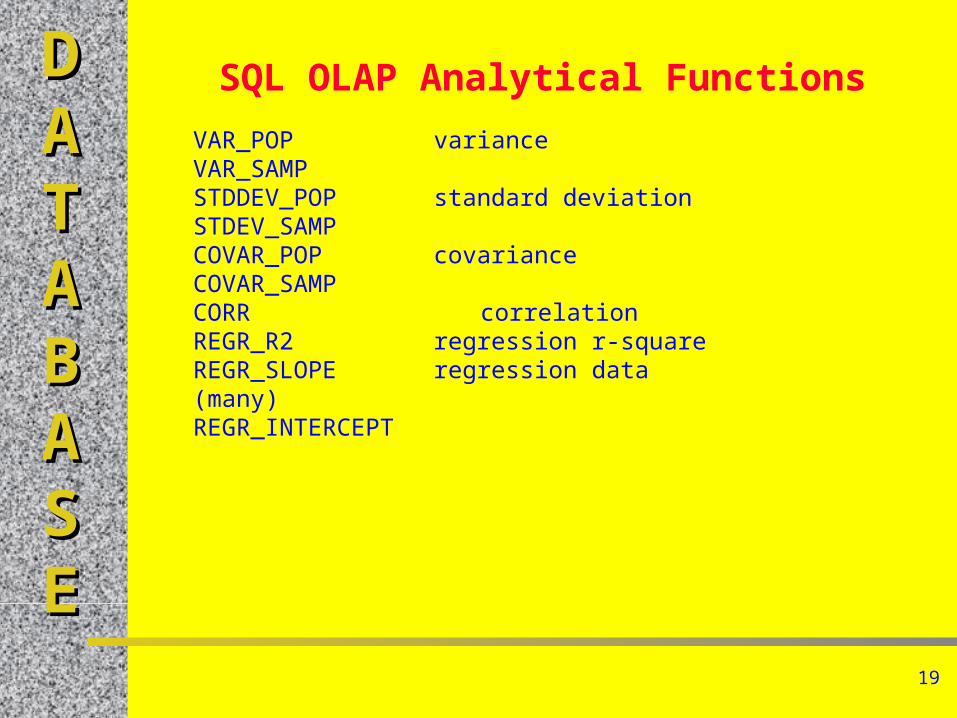
SQL OLAP Analytical Functions
VAR_POP varianceVAR_SAMPSTDDEV_POP standard deviationSTDEV_SAMPCOVAR_POP covarianceCOVAR_SAMPCORR correlationREGR_R2 regression r-squareREGR_SLOPE regression data (many)REGR_INTERCEPT

20
DDAATTAABBAASSEE
SQL RANK FunctionsSELECT Employee, SalesValue RANK() OVER (ORDER BY SalesValue DESC) AS rankDENSE_RANK() OVER (ORDER BY SalesValue DESC) AS denseFROM SalesORDER BY SalesValue DESC, Employee;
Employee SalesValue rank dense
Jones 18,000 1 1
Smith 16,000 2 2
Black 16,000 2 2
White 14,000 4 3DENSE_RANK does not skip numbers

21
DDAATTAABBAASSEE
SQL OLAP WindowsSELECT Category, SaleMonth, MonthAmount, AVG(MonthAmount) OVER (PARTITION BY Category ORDER BY SaleMonth ASC ROWS 2 PRECEDING) AS MAFROM qryOLAPSQL99ORDER BY SaleMonth ASC;
Category SaleMonth MonthAmount MABird 200101 1500.00Bird 200102 1700.00Bird 200103 2000.00 1600.00Bird 200104 2500.00 1850.00…Cat 200101 4000.00Cat 200102 5000.00Cat 200103 6000.00 4500.00Cat 200104 7000.00 5500.00…

22
DDAATTAABBAASSEE
Ranges: OVER
SELECT SaleDate, ValueSUM(Value) OVER (ORDER BY SaleDate) AS running_sum,SUM(Value) OVER (ORDER BY SaleDate RANGE
BETWEEN UNBOUNDED PRECEDING AND CURRENT ROW) AS running_sum2,
SUM (Value) OVER (ORDER BY SaleDate RANGEBETWEEN CURRENT ROWAND UNBOUNDED FOLLOWING) AS remaining_sum;
FROM …
Sum1 computes total from beginning through current row.
Sum2 does the same thing, but more explicitly lists the rows.
Sum3 computes total from current row through end of query.
23
DDAATTAABBAASSEE
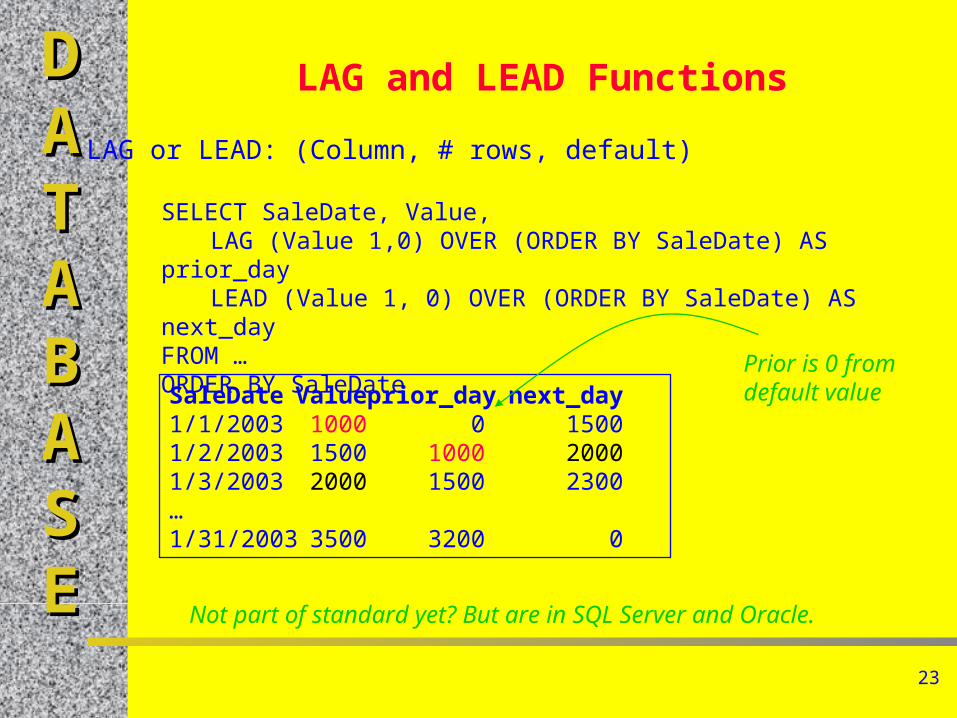
LAG and LEAD Functions
SELECT SaleDate, Value, LAG (Value 1,0) OVER (ORDER BY SaleDate) AS prior_dayLEAD (Value 1, 0) OVER (ORDER BY SaleDate) AS next_day
FROM …ORDER BY SaleDate
LAG or LEAD: (Column, # rows, default)
SaleDate Value prior_day next_day1/1/2003 1000 0 15001/2/2003 1500 1000 20001/3/2003 2000 1500 2300…1/31/2003 3500 3200 0
Prior is 0 from default value
Not part of standard yet? But are in SQL Server and Oracle.

24
DDAATTAABBAASSEE
Data Mining
Goal: To discover unknown relationships in the data that can be used to make better decisions.
Databases
Reports
Queries
OLAP
Data Mining
Transactions and operations
Specific ad hoc questions
Aggregate, compare, drill down
Unknown relationships

25
DDAATTAABBAASSEE
Exploratory Analysis
Data Mining usually works autonomously.Supervised/directedUnsupervisedOften called a bottom-up approach that scans the data to
find relationships
Some statistical routines, but they are not sufficientStatistics relies on averagesSometimes the important data lies in more detailed pairs
26
DDAATTAABBAASSEE
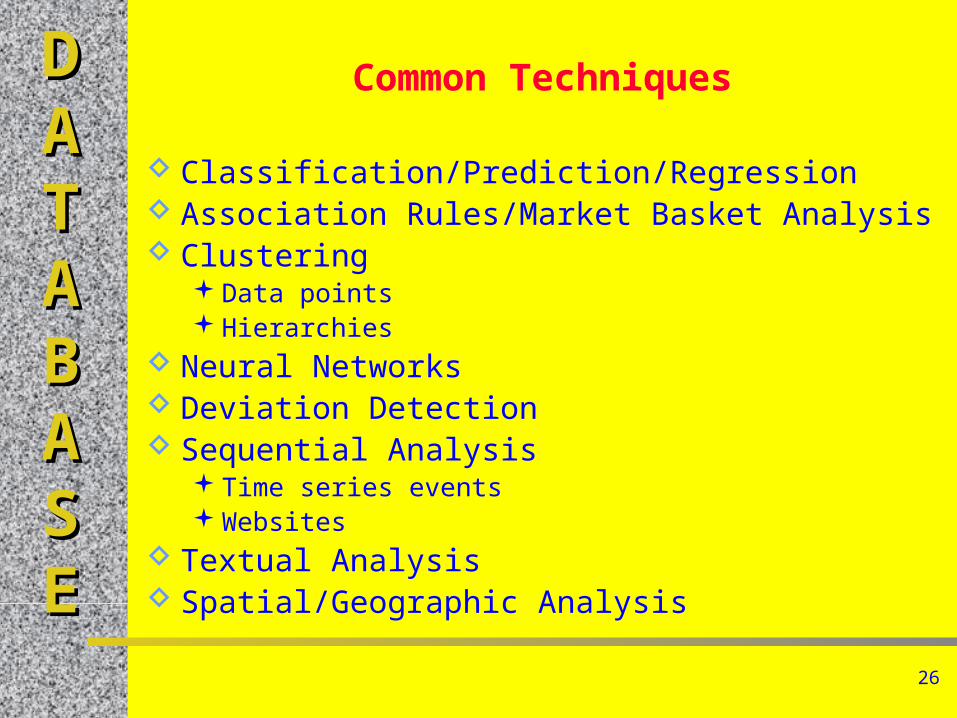
Common Techniques
Classification/Prediction/Regression Association Rules/Market Basket Analysis Clustering
Data pointsHierarchies
Neural Networks Deviation Detection Sequential Analysis
Time series eventsWebsites
Textual Analysis Spatial/Geographic Analysis

27
DDAATTAABBAASSEE
Classification Examples
ExamplesWhich borrowers/loans are most likely to be successful?Which customers are most likely to want a new item?Which companies are likely to file bankruptcy?Which workers are likely to quit in the next six months?Which startup companies are likely to succeed?Which tax returns are fraudulent?

28
DDAATTAABBAASSEE
Classification Process Clearly identify the outcome/dependent variable. Identify potential variables that might affect the outcome.
Supervised (modeler chooses) Unsupervised (system scans all/most)
Use sample data to test and validate the model. System creates weights that link independent variables to
outcome.
Income Married Credit History Job Stability Success
50000 Yes Good Good Yes
25000 Yes Bad Bad No
75000 No Good Good No

29
DDAATTAABBAASSEE
Classification Techniques
Regression Bayesian Networks Decision Trees (hierarchical) Neural Networks Genetic Algorithms
ComplicationsSome methods require categorical dataData size is still a problem

30
DDAATTAABBAASSEE
Association/Market Basket
Examples What items are customers likely to buy together? What Web pages are closely related? Others?
Classic (early) example: Analysis of convenience store data showed customers often buy
diapers and beer together. Importance: Consider putting the two together to increase cross-
selling.

31
DDAATTAABBAASSEE
Association Details (two items)
Rule evaluation (A implies B) Support for the rule is measured by the percentage of all
transactions containing both items: P(A ∩ B) Confidence of the rule is measured by the transactions with A that
also contain B: P(B | A) Lift is the potential gain attributed to the rule—the effect compared
to other baskets without the effect. If it is greater than 1, the effect is positive:
P(A ∩ B) / ( P(A) P(B) ) P(B|A)/P(B)
Example: Diapers implies Beer Support: P(D ∩ B) = .6 P(D) = .7 P(B) = .5 Confidence: P(B|D) = .857 = P(D ∩ B)/P(D) = .6/.7 Lift: P(B|D) / P(B) = 1.714 = .857 / .5

32
DDAATTAABBAASSEE
Association Challenges If an item is rarely purchased, any other item bought with it
seems important. So combine items into categories.
Some relationships are obvious. Burger and fries.
Some relationships are meaningless. Hardware store found that toilet rings sell well only when a new
store first opens. But what does it mean?
Item Freq.
1 “ nails 2%
2” nails 1%
3” nails 1%
4” nails 2%
Lumber 50%
Item Freq.
Hardware 15%
Dim. Lumber 20%
Plywood 15%
Finish lumber 15%

33
DDAATTAABBAASSEE
Cluster Analysis Examples
Are there groups of customers? (If so, we can cross-sell.) Do the locations for our stores have elements in common? (So we
can search for similar clusters for new locations.) Do our employees (by department?) have common characteristics?
(So we can hire similar, or dissimilar, people.) Problem: Many dimensions and large datasets
Small intracluster distance
Large intercluster distance

34
DDAATTAABBAASSEE
Geographic/Location Examples
Customer location and sales comparisonsFactory sites and costEnvironmental effects
Challenge: Map data, multiple overlays