Embed Size (px)
Citation preview
This project is funded by European Union
Data4Water12th Symposium and Summer School On Service-Oriented Computing, June 25 – June 29, 2018 in Crete, Greece
Prof. Dr. Adrian Paschke
Director Data Analytics Center, Fraunhofer FOKUS
Head of Corporate Semantic Web, Freie Universität Berlin
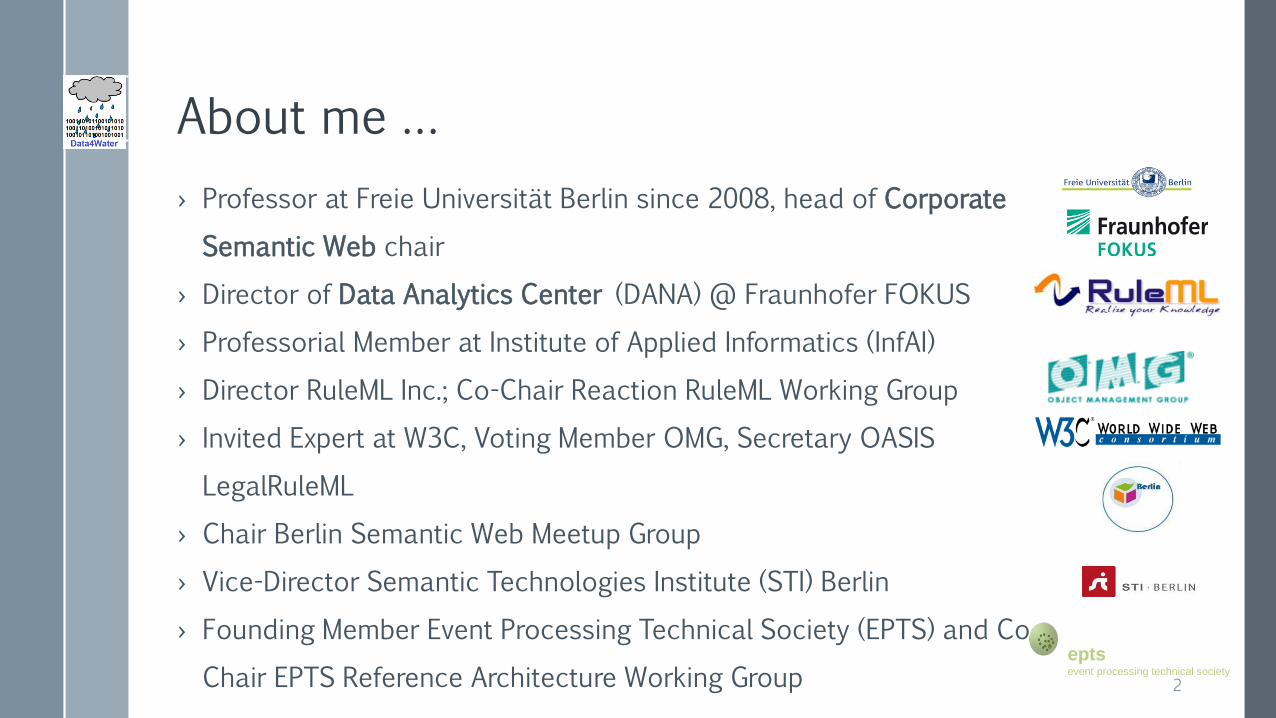
About me …
› Professor at Freie Universität Berlin since 2008, head of Corporate
Semantic Web chair
› Director of Data Analytics Center (DANA) @ Fraunhofer FOKUS
› Professorial Member at Institute of Applied Informatics (InfAI)
› Director RuleML Inc.; Co-Chair Reaction RuleML Working Group
› Invited Expert at W3C, Voting Member OMG, Secretary OASIS
LegalRuleML
› Chair Berlin Semantic Web Meetup Group
› Vice-Director Semantic Technologies Institute (STI) Berlin
› Founding Member Event Processing Technical Society (EPTS) and Co-
Chair EPTS Reference Architecture Working Group 2
eptsevent processing technical society
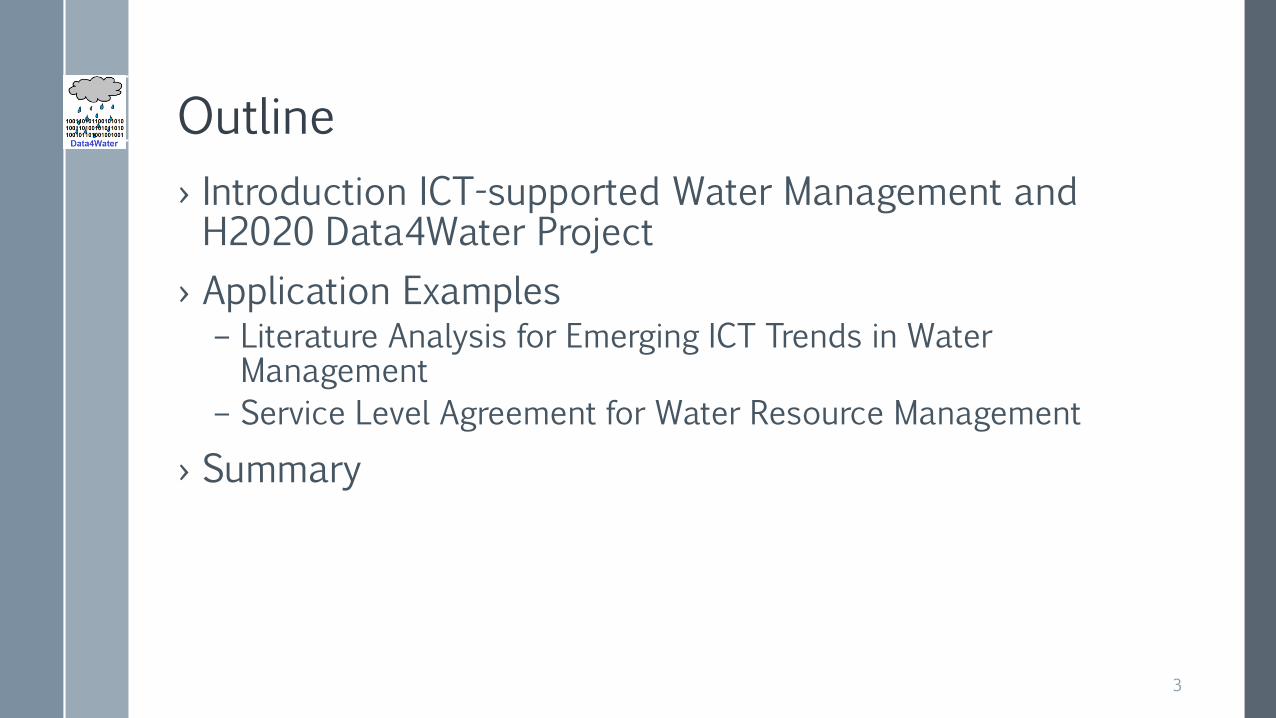
Outline
› Introduction ICT-supported Water Management and H2020 Data4Water Project
› Application Examples– Literature Analysis for Emerging ICT Trends in Water Management
– Service Level Agreement for Water Resource Management
› Summary
3
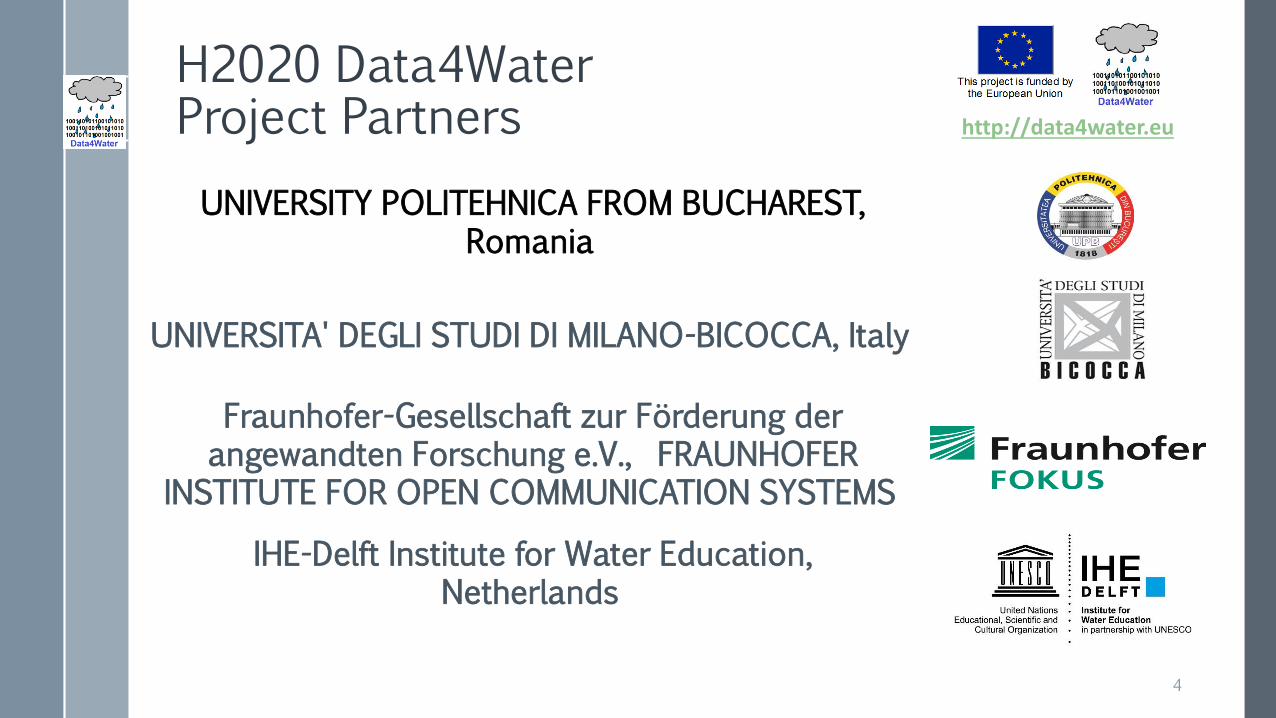
H2020 Data4Water Project Partners
UNIVERSITY POLITEHNICA FROM BUCHAREST, Romania
UNIVERSITA' DEGLI STUDI DI MILANO-BICOCCA, Italy
Fraunhofer-Gesellschaft zur Förderung der angewandten Forschung e.V., FRAUNHOFER
INSTITUTE FOR OPEN COMMUNICATION SYSTEMS
IHE-Delft Institute for Water Education,Netherlands
4
http://data4water.eu
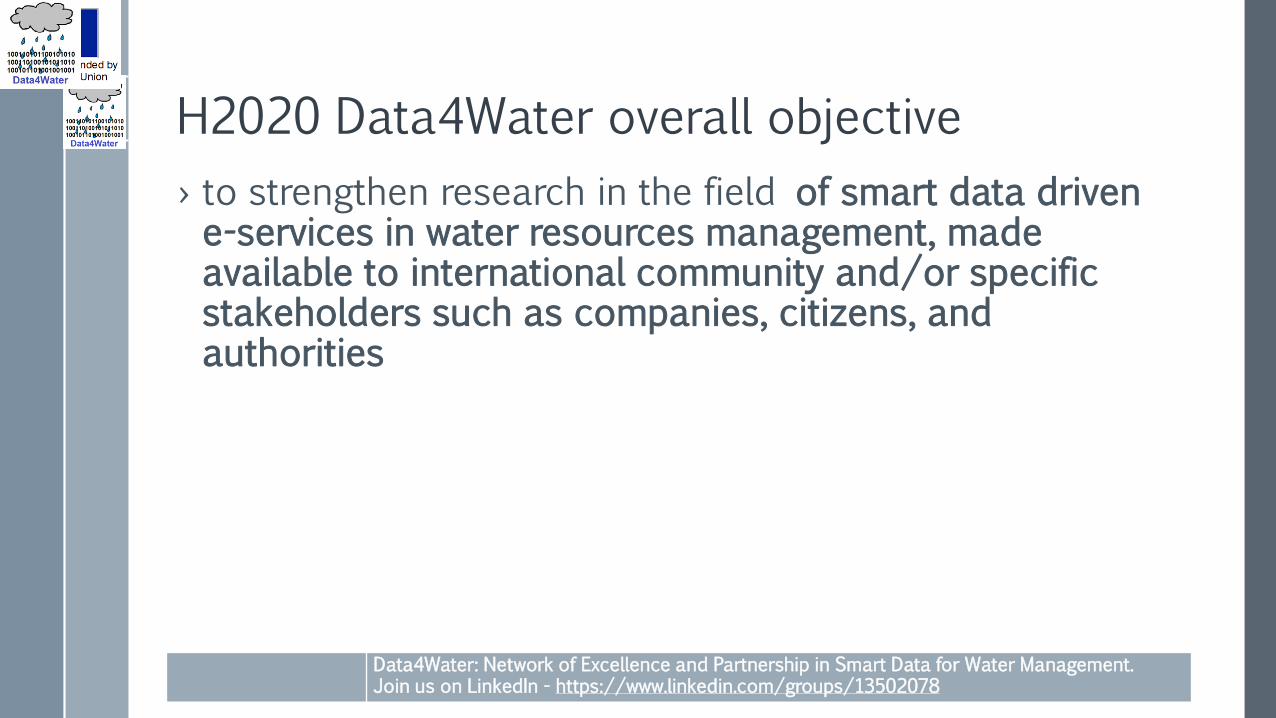
H2020 Data4Water overall objective
› to strengthen research in the field of smart data driven e-services in water resources management, made available to international community and/or specific stakeholders such as companies, citizens, and authorities
5
Data4Water: Network of Excellence and Partnership in Smart Data for Water Management.Join us on LinkedIn - https://www.linkedin.com/groups/13502078
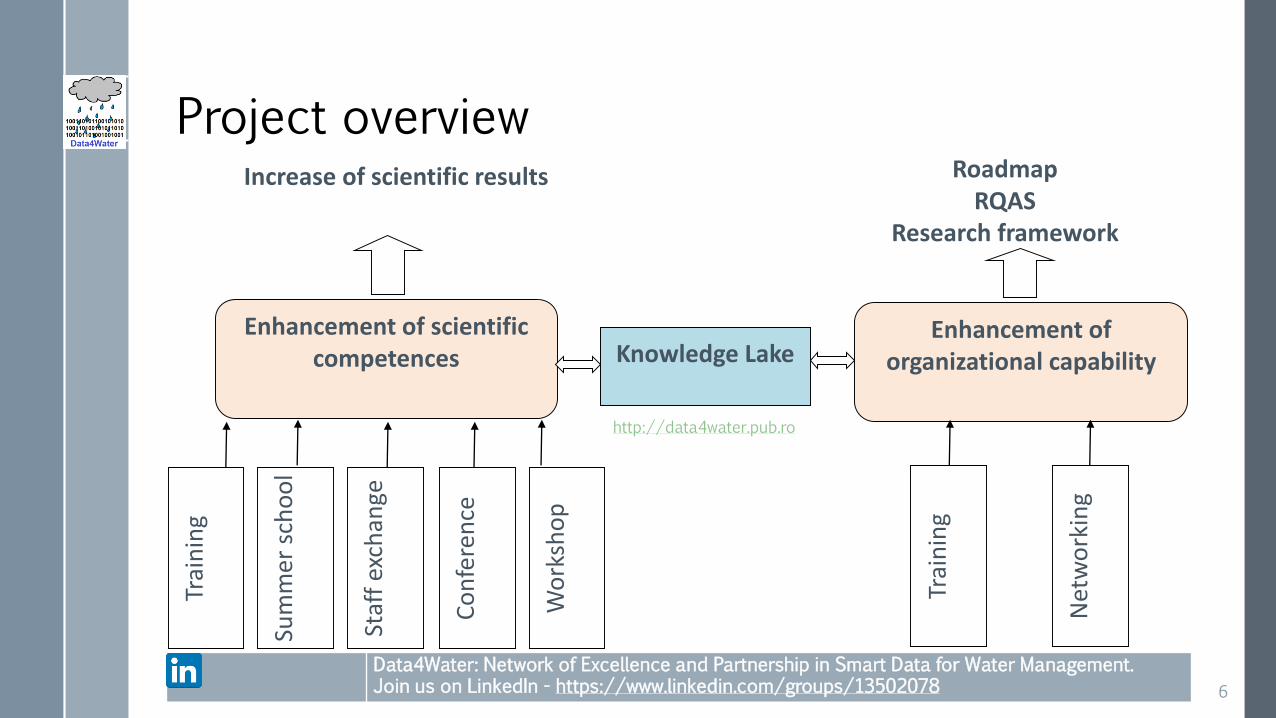
Project overview
Enhancement of scientific competences
Enhancement of organizational capability
Trai
nin
g
Sum
mer
sch
oo
l
Staf
f ex
chan
ge
Co
nfe
ren
ce
Wo
rksh
op
Net
wo
rkin
g
Trai
nin
g
Knowledge Lake
Increase of scientific results RoadmapRQAS
Research framework
6
http://data4water.pub.ro
Data4Water: Network of Excellence and Partnership in Smart Data for Water Management.Join us on LinkedIn - https://www.linkedin.com/groups/13502078
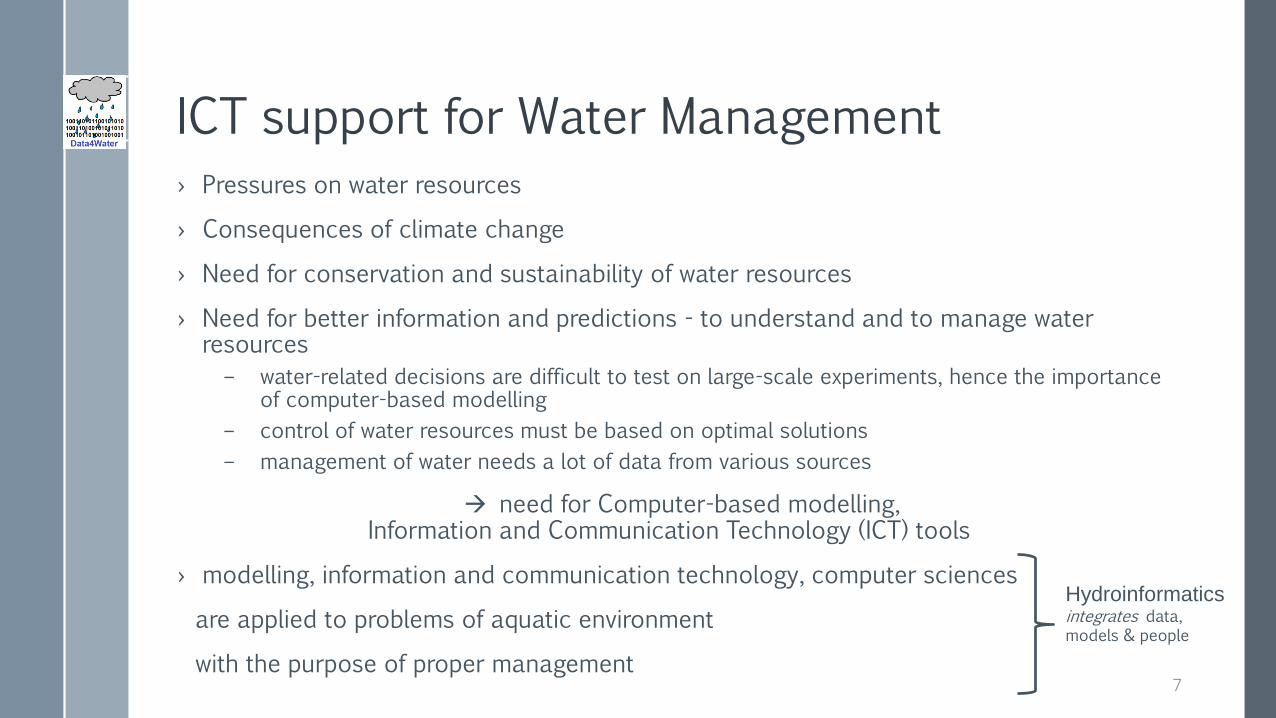
ICT support for Water Management
› Pressures on water resources
› Consequences of climate change
› Need for conservation and sustainability of water resources
› Need for better information and predictions - to understand and to manage water resources
– water-related decisions are difficult to test on large-scale experiments, hence the importance of computer-based modelling
– control of water resources must be based on optimal solutions
– management of water needs a lot of data from various sources
need for Computer-based modelling, Information and Communication Technology (ICT) tools
› modelling, information and communication technology, computer sciences
are applied to problems of aquatic environment
with the purpose of proper management
Hydroinformaticsintegrates data, models & people
7
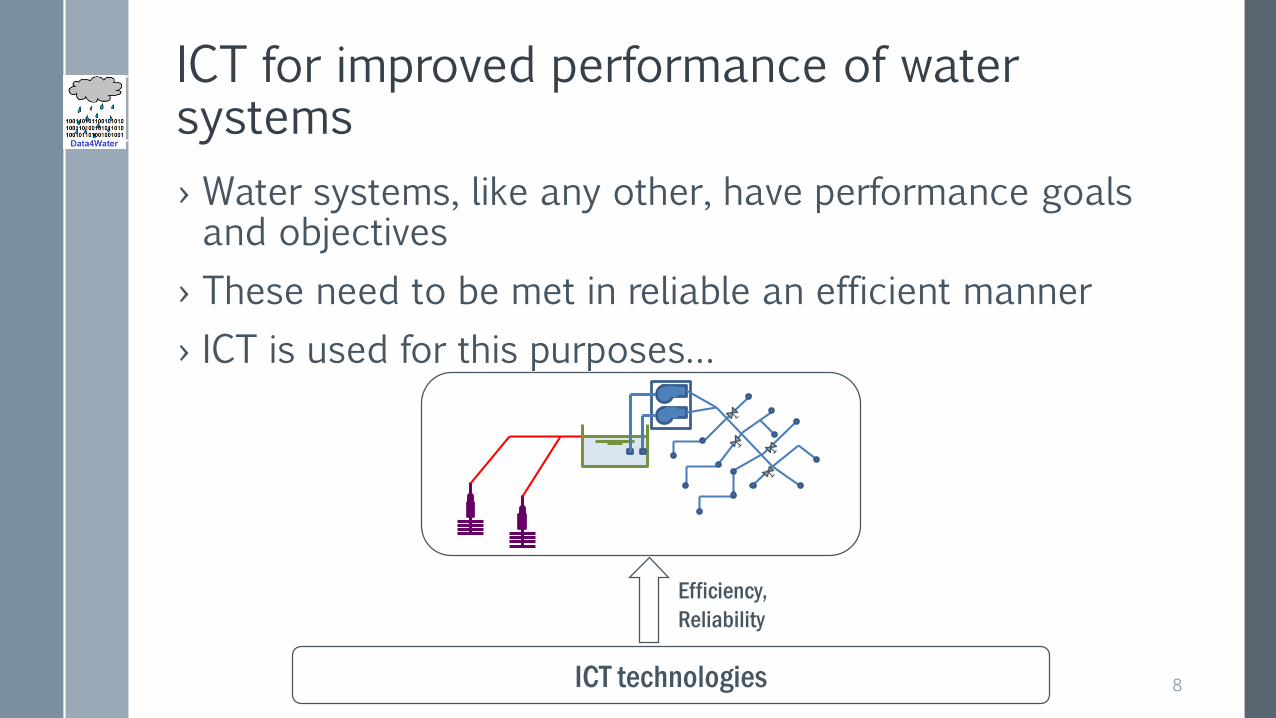
ICT for improved performance of water systems
› Water systems, like any other, have performance goals and objectives
› These need to be met in reliable an efficient manner
› ICT is used for this purposes…
ICT technologies
Efficiency,
Reliability
8
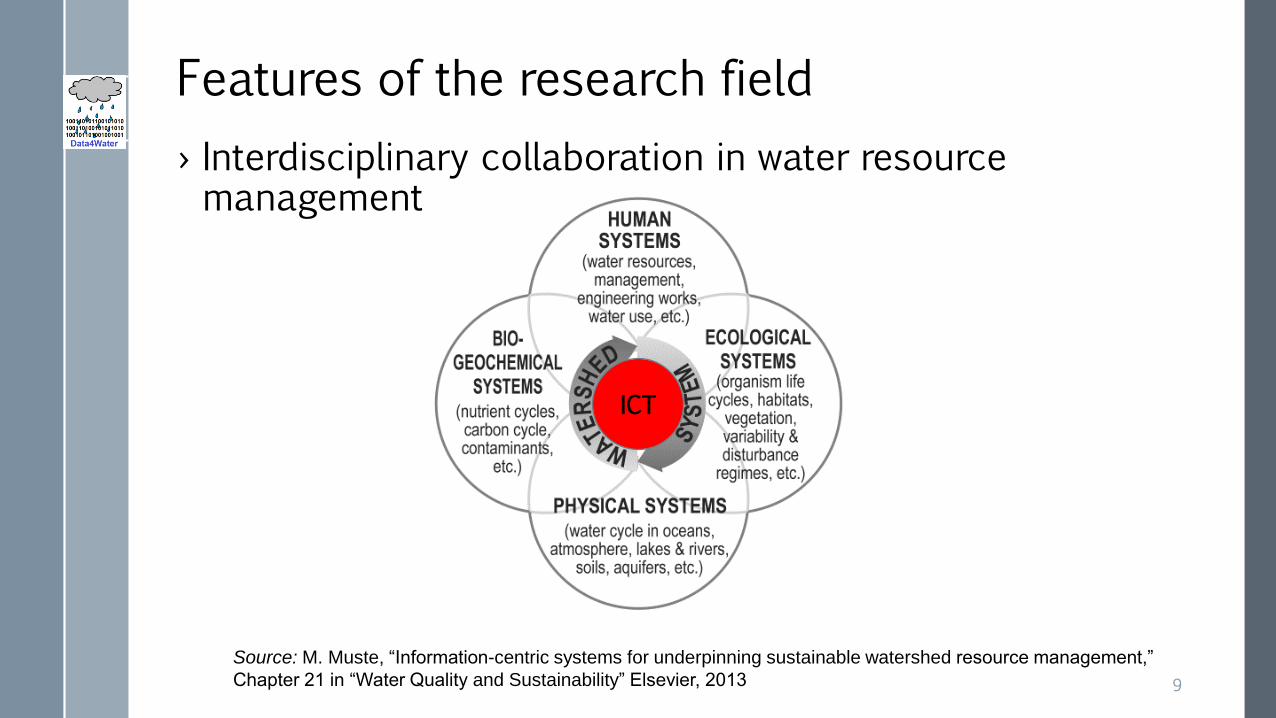
Features of the research field
› Interdisciplinary collaboration in water resource management
Source: M. Muste, “Information-centric systems for underpinning sustainable watershed resource management,”
Chapter 21 in “Water Quality and Sustainability” Elsevier, 2013
ICT
9
Features of the research field
› Shift of approach paradigm– traditional pillars of the natural systems scientific studies are
› observation (plus experiment),
› theory, and
› analysis (plus computation).
– modern information and communication technology capabilities› allow to address a new class of problems around the organization of data and information leading to knowledge extraction.
10
Outline
› Introduction ICT-supported Water Management and Data4Water
› Application Examples– Literature Analysis for Emerging ICT Trends in Water Management
– Service Level Agreement for Water Resource Management
› Summary
11
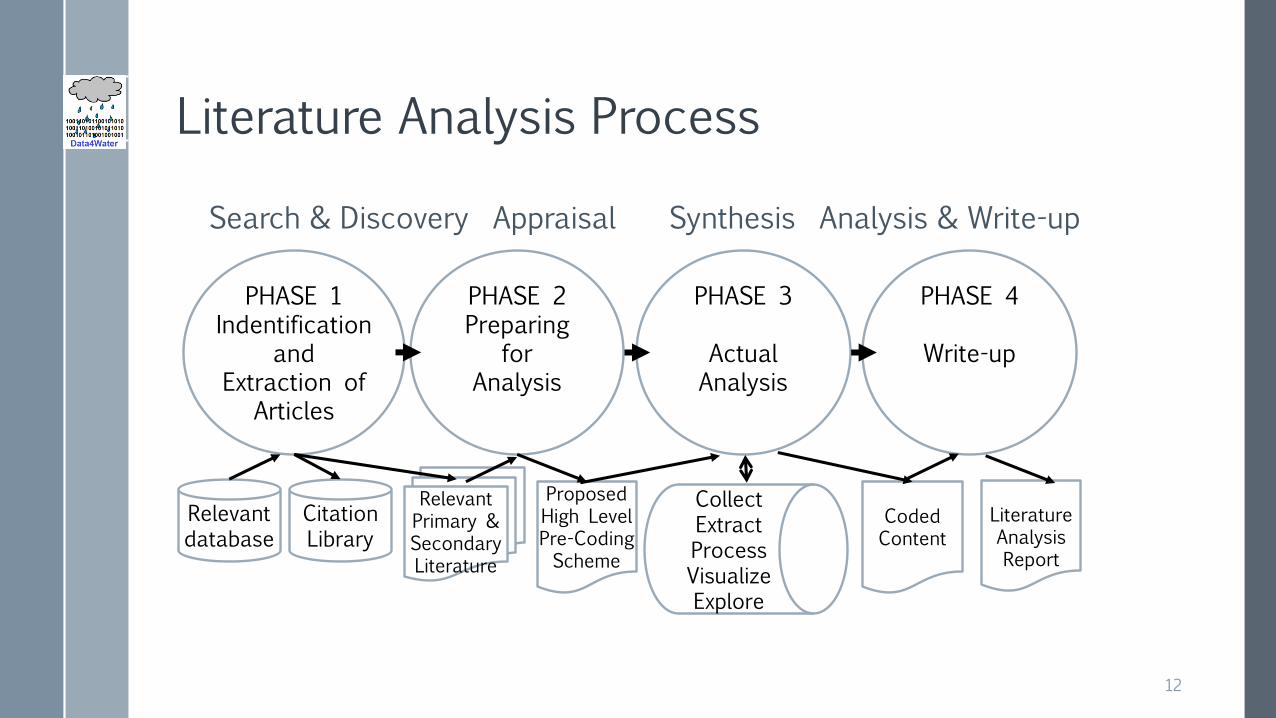
Literature Analysis Process
PHASE 1Indentification
andExtraction of
Articles
PHASE 2Preparing
forAnalysis
PHASE 3
ActualAnalysis
PHASE 4
Write-up
Relevant database
CitationLibrary
Relevant Primary & SecondaryLiterature
ProposedHigh Level Pre-CodingScheme
CollectExtractProcessVisualizeExplore
CodedContent
LiteratureAnalysis Report
Search & Discovery Appraisal Synthesis Analysis & Write-up
12
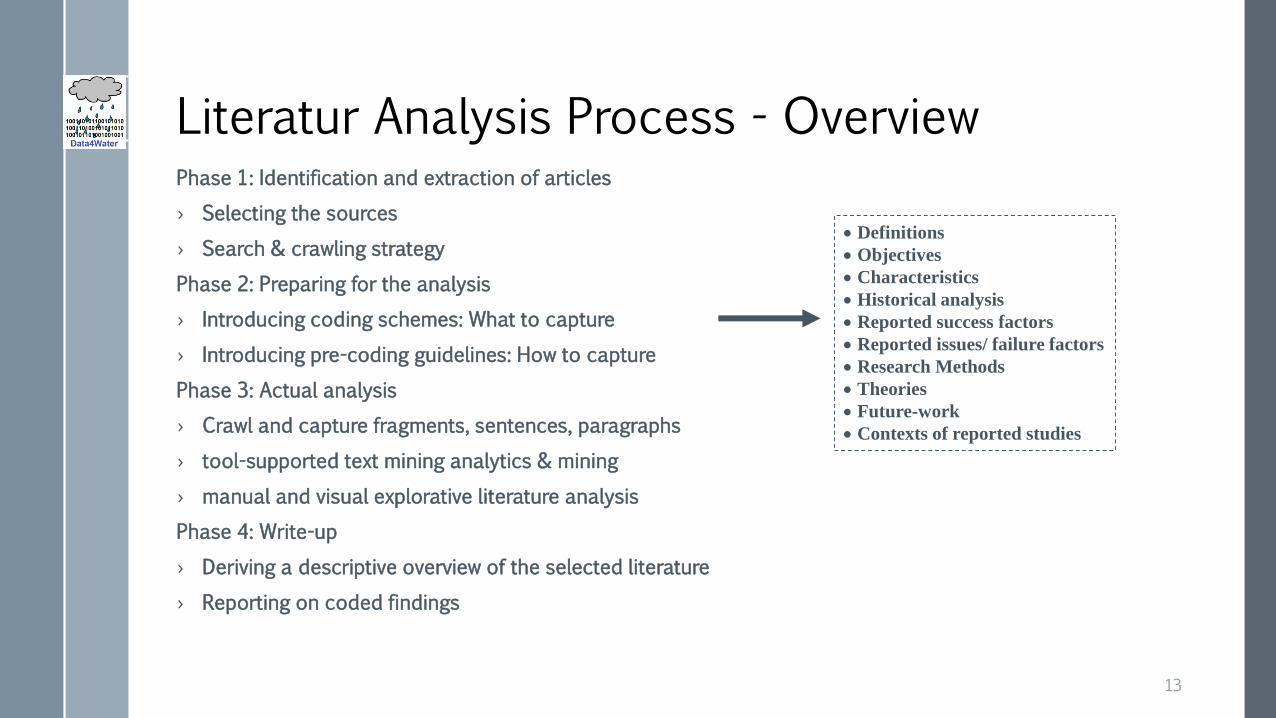
Literatur Analysis Process - OverviewPhase 1: Identification and extraction of articles
› Selecting the sources
› Search & crawling strategy
Phase 2: Preparing for the analysis
› Introducing coding schemes: What to capture
› Introducing pre-coding guidelines: How to capture
Phase 3: Actual analysis
› Crawl and capture fragments, sentences, paragraphs
› tool-supported text mining analytics & mining
› manual and visual explorative literature analysis
Phase 4: Write-up
› Deriving a descriptive overview of the selected literature
› Reporting on coded findings
13
Definitions
Objectives
Characteristics
Historical analysis
Reported success factors
Reported issues/ failure factors
Research Methods
Theories
Future-work
Contexts of reported studies

Comparison of different content analysis approaches
14
Type of contentanalysis
Study starts with Timing of definingcodes
Source of codes
Conventionalcontentanalysis
Observation Codes are definedduring dataanalysis
Codes are derivedfrom data
Directed contentanalysis
Theory / Hypothesis
Codes are definedbefore and duringdata analysis
Codes are derivedfrom theory orrelevant researchfindings
Summative contentanalysis
Keywords Keywords areidentifiedbefore and duringdataanalysis
Keywords arederivedfrom interest of researchers orreview of literature
(Source: Hsieh & Shannon, 2005)
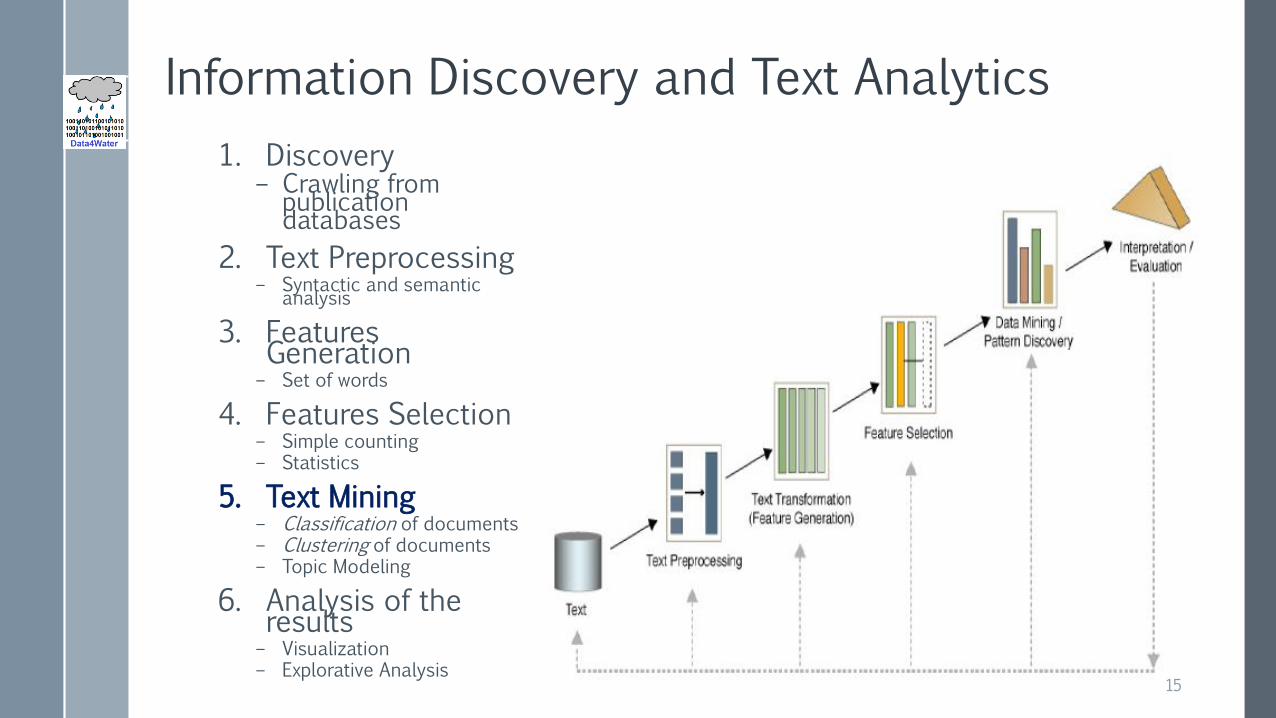
Information Discovery and Text Analytics
1. Discovery– Crawling from
publication databases
2. Text Preprocessing– Syntactic and semantic
analysis
3. Features Generation
– Set of words
4. Features Selection– Simple counting– Statistics
5. Text Mining– Classification of documents– Clustering of documents– Topic Modeling
6. Analysis of the results
– Visualization– Explorative Analysis
15
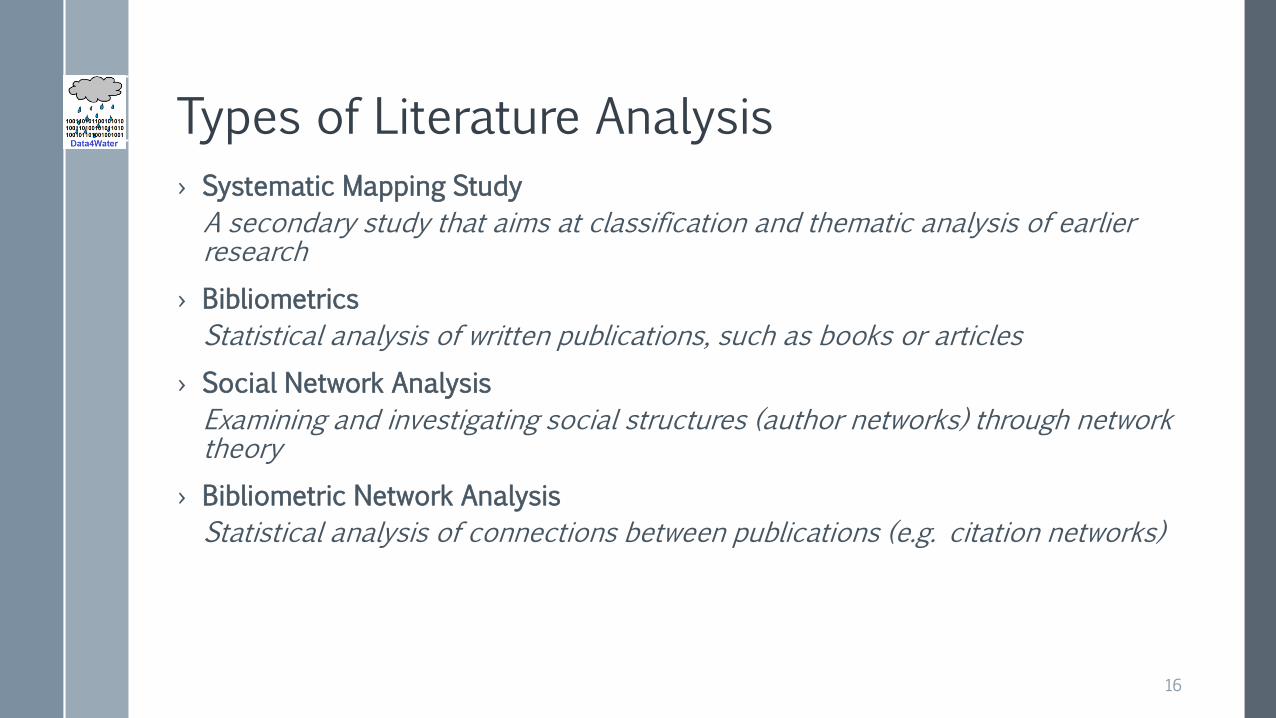
Types of Literature Analysis
› Systematic Mapping Study
A secondary study that aims at classification and thematic analysis of earlier research
› Bibliometrics
Statistical analysis of written publications, such as books or articles
› Social Network Analysis
Examining and investigating social structures (author networks) through network theory
› Bibliometric Network Analysis
Statistical analysis of connections between publications (e.g. citation networks)
16
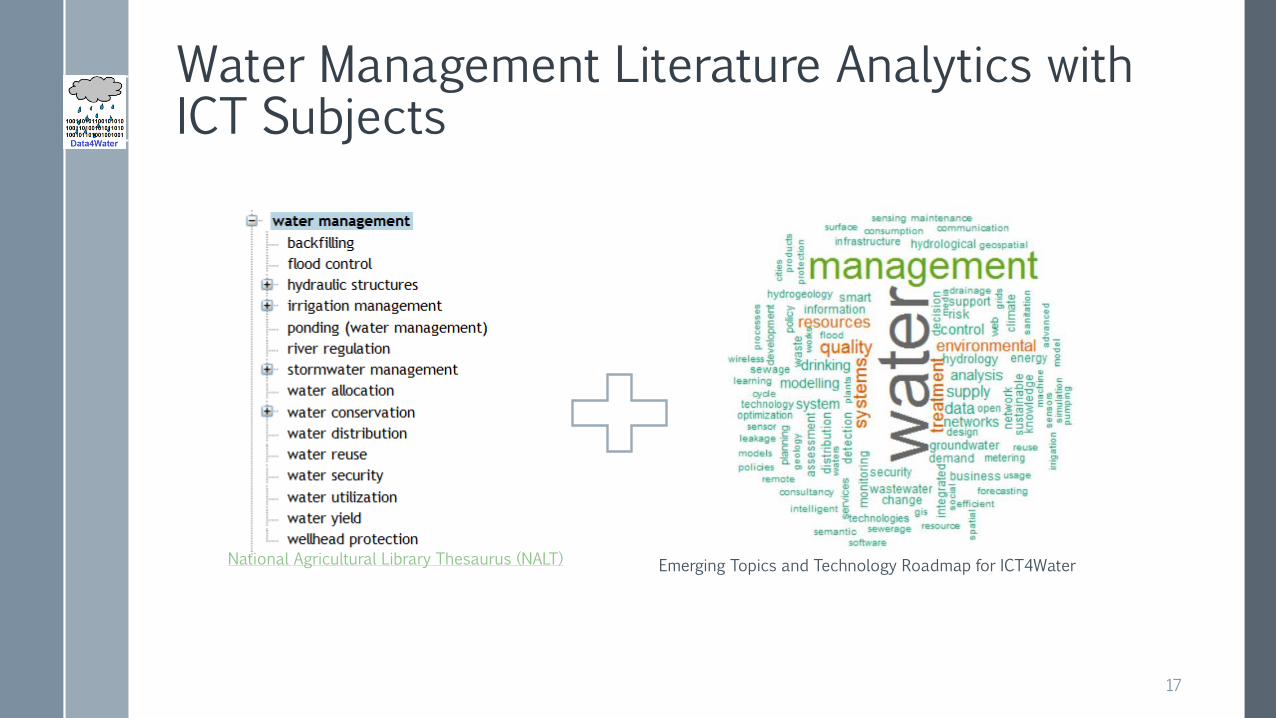
Water Management Literature Analytics withICT Subjects
National Agricultural Library Thesaurus (NALT) Emerging Topics and Technology Roadmap for ICT4Water
17
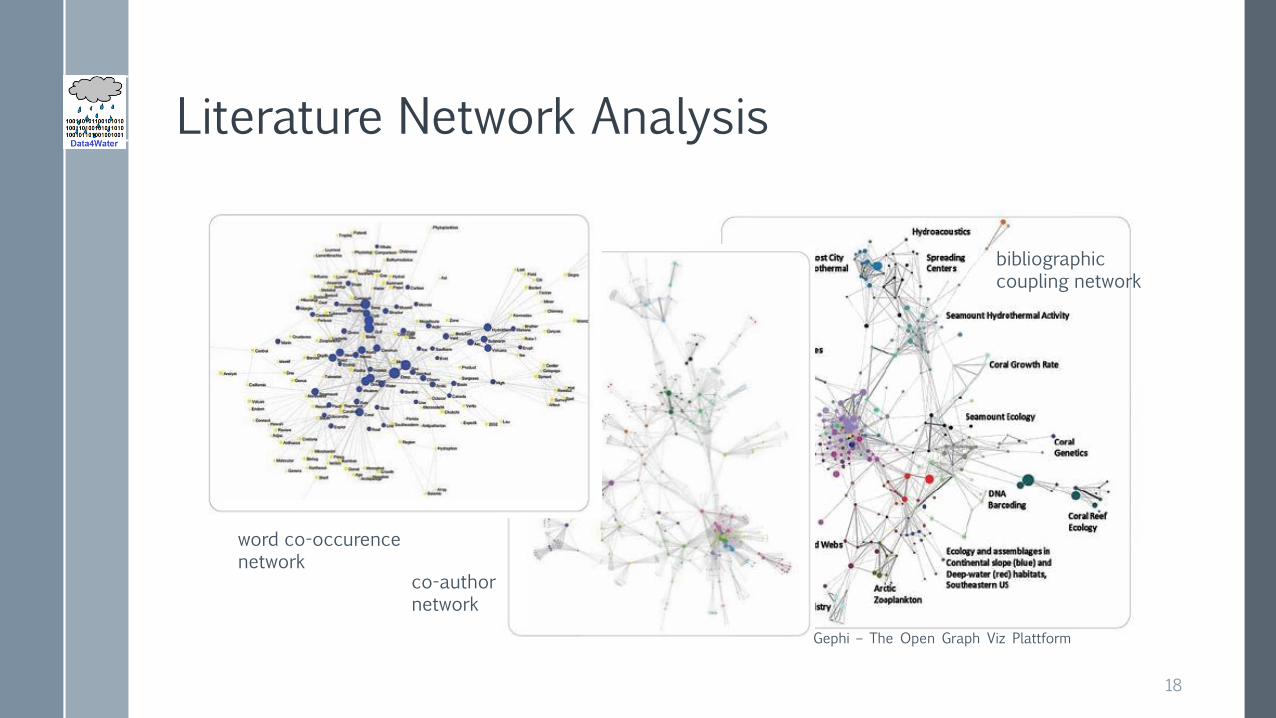
Literature Network Analysis
word co-occurencenetwork
co-authornetwork
bibliographiccoupling network
18
Gephi – The Open Graph Viz Plattform
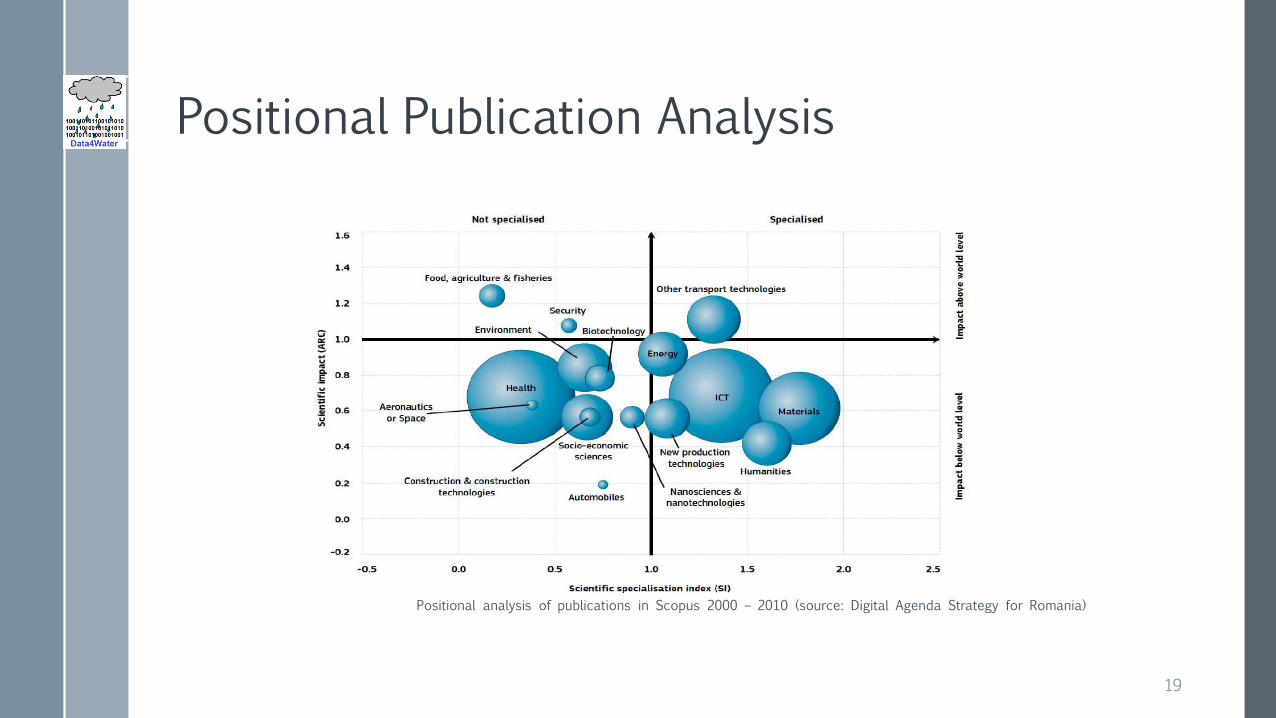
Positional Publication Analysis
Positional analysis of publications in Scopus 2000 – 2010 (source: Digital Agenda Strategy for Romania)
19
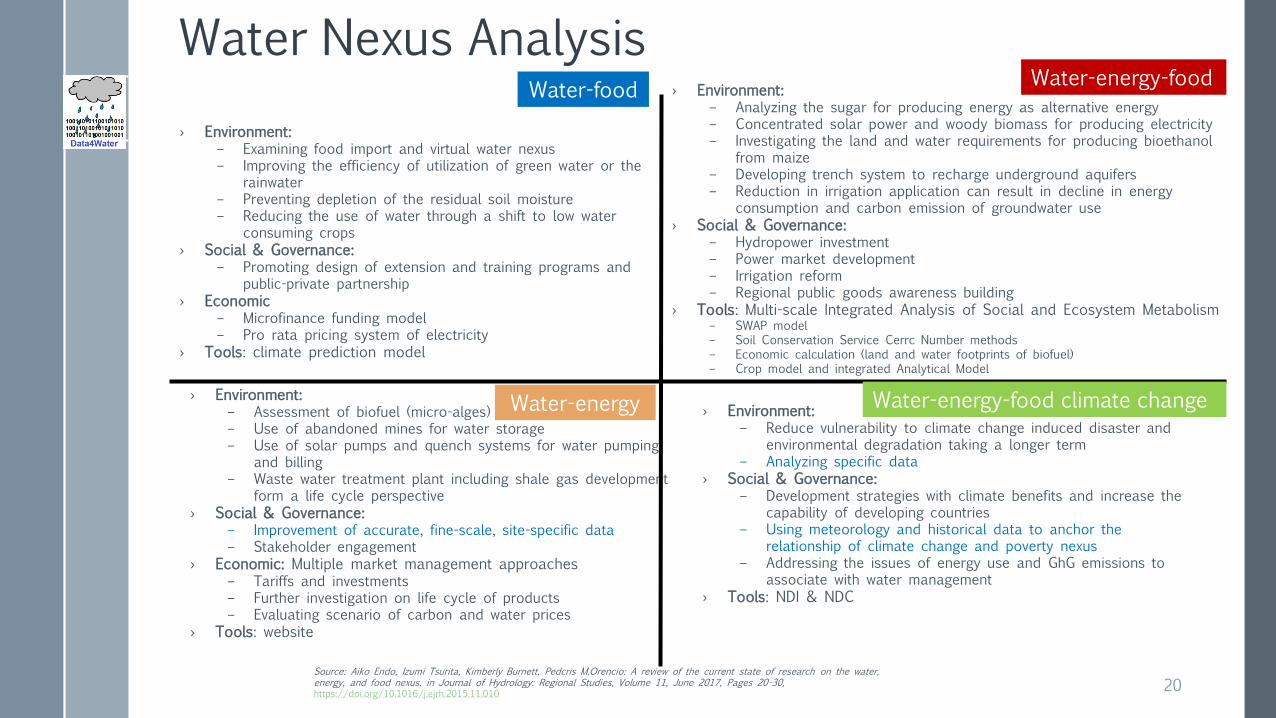
Water Nexus Analysis
› Environment:– Examining food import and virtual water nexus– Improving the efficiency of utilization of green water or the
rainwater– Preventing depletion of the residual soil moisture– Reducing the use of water through a shift to low water
consuming crops
› Social & Governance:– Promoting design of extension and training programs and
public-private partnership
› Economic– Microfinance funding model– Pro rata pricing system of electricity
› Tools: climate prediction model
Source: Aiko Endo, Izumi Tsurita, Kimberly Burnett, Pedcris M.Orencio: A review of the current state of research on the water, energy, and food nexus, in Journal of Hydrology: Regional Studies, Volume 11, June 2017, Pages 20-30, https://doi.org/10.1016/j.ejrh.2015.11.010
› Environment:– Assessment of biofuel (micro-alges)– Use of abandoned mines for water storage– Use of solar pumps and quench systems for water pumping
and billing– Waste water treatment plant including shale gas development
form a life cycle perspective
› Social & Governance:– Improvement of accurate, fine-scale, site-specific data– Stakeholder engagement
› Economic: Multiple market management approaches– Tariffs and investments– Further investigation on life cycle of products– Evaluating scenario of carbon and water prices
› Tools: website
› Environment:– Analyzing the sugar for producing energy as alternative energy– Concentrated solar power and woody biomass for producing electricity– Investigating the land and water requirements for producing bioethanol
from maize– Developing trench system to recharge underground aquifers– Reduction in irrigation application can result in decline in energy
consumption and carbon emission of groundwater use
› Social & Governance:– Hydropower investment– Power market development– Irrigation reform– Regional public goods awareness building
› Tools: Multi-scale Integrated Analysis of Social and Ecosystem Metabolism– SWAP model – Soil Conservation Service Cerrc Number methods– Economic calculation (land and water footprints of biofuel)– Crop model and integrated Analytical Model
› Environment:– Reduce vulnerability to climate change induced disaster and
environmental degradation taking a longer term– Analyzing specific data
› Social & Governance:– Development strategies with climate benefits and increase the
capability of developing countries– Using meteorology and historical data to anchor the
relationship of climate change and poverty nexus– Addressing the issues of energy use and GhG emissions to
associate with water management
› Tools: NDI & NDC
Water-energy-food climate change
Water-energy-foodWater-food
Water-energy
20
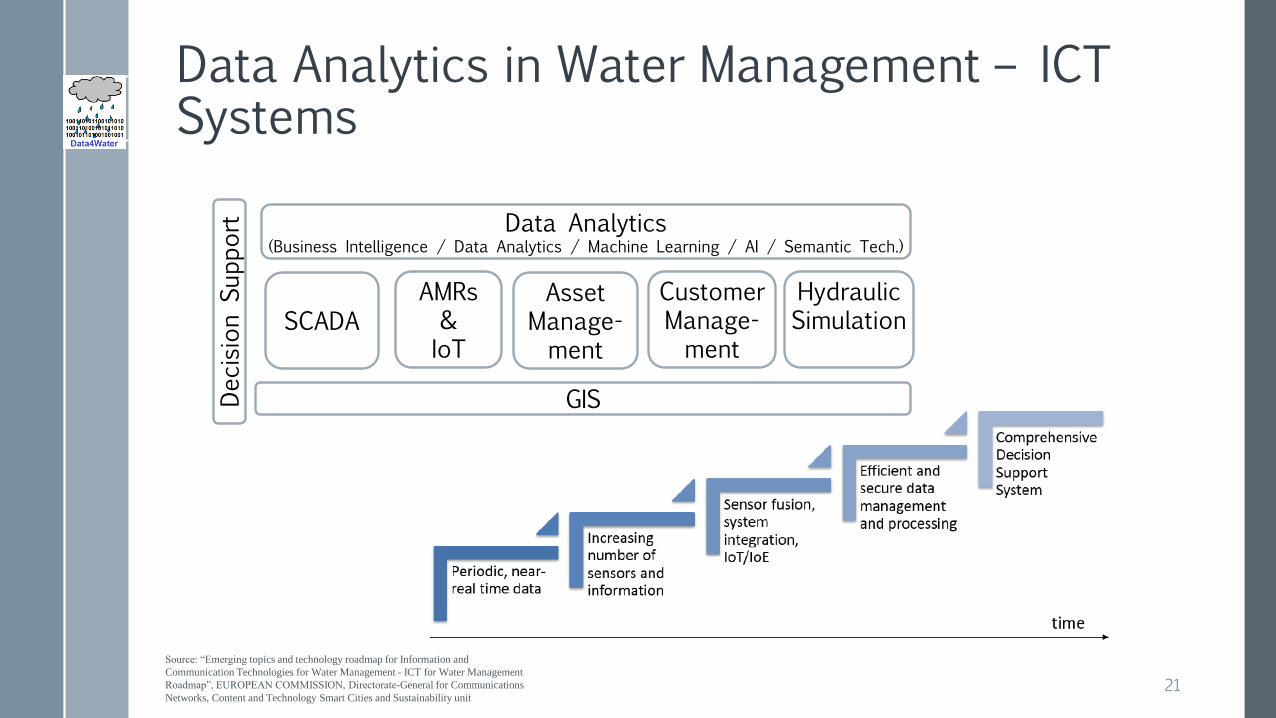
Data Analytics in Water Management – ICT Systems
Decision
Support Data Analytics
(Business Intelligence / Data Analytics / Machine Learning / AI / Semantic Tech.)
SCADA
AMRs & IoT
Asset Manage-ment
Customer Manage-ment
HydraulicSimulation
GIS
Source: “Emerging topics and technology roadmap for Information and
Communication Technologies for Water Management - ICT for Water Management
Roadmap”, EUROPEAN COMMISSION, Directorate-General for Communications
Networks, Content and Technology Smart Cities and Sustainability unit21
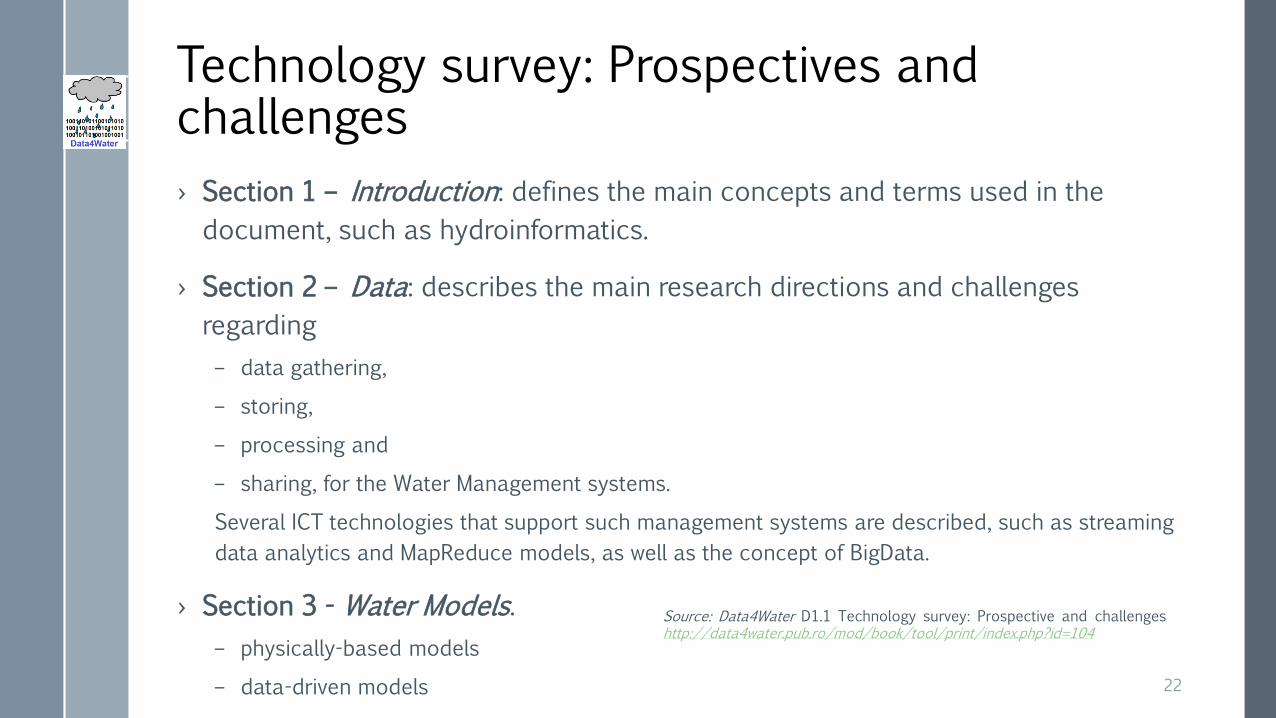
Technology survey: Prospectives and challenges
› Section 1 – Introduction: defines the main concepts and terms used in the
document, such as hydroinformatics.
› Section 2 – Data: describes the main research directions and challenges
regarding
– data gathering,
– storing,
– processing and
– sharing, for the Water Management systems.
Several ICT technologies that support such management systems are described, such as streaming
data analytics and MapReduce models, as well as the concept of BigData.
› Section 3 - Water Models.
– physically-based models
– data-driven models
Source: Data4Water D1.1 Technology survey: Prospective and challenges http://data4water.pub.ro/mod/book/tool/print/index.php?id=104
22
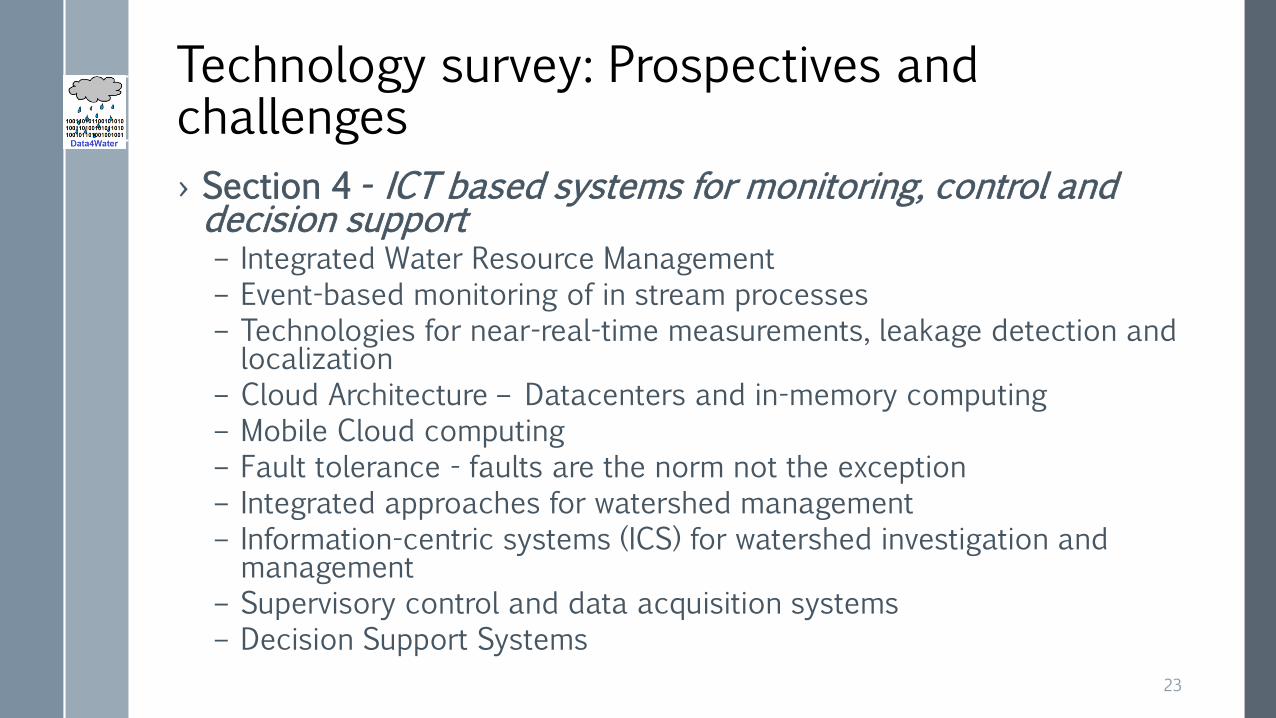
Technology survey: Prospectives and challenges
› Section 4 - ICT based systems for monitoring, control and decision support – Integrated Water Resource Management
– Event-based monitoring of in stream processes
– Technologies for near-real-time measurements, leakage detection and localization
– Cloud Architecture – Datacenters and in-memory computing
– Mobile Cloud computing
– Fault tolerance - faults are the norm not the exception
– Integrated approaches for watershed management
– Information-centric systems (ICS) for watershed investigation and management
– Supervisory control and data acquisition systems
– Decision Support Systems
23
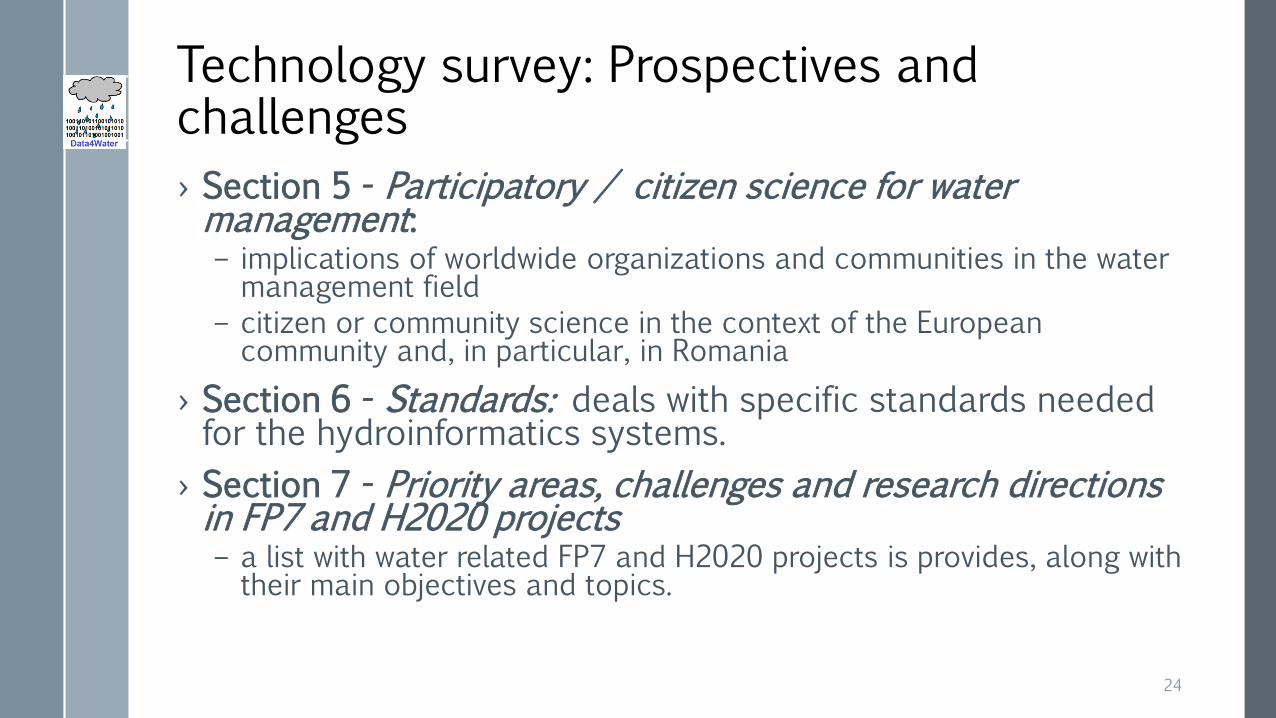
Technology survey: Prospectives and challenges
› Section 5 - Participatory / citizen science for water management: – implications of worldwide organizations and communities in the water management field
– citizen or community science in the context of the European community and, in particular, in Romania
› Section 6 - Standards: deals with specific standards needed for the hydroinformatics systems.
› Section 7 - Priority areas, challenges and research directions in FP7 and H2020 projects– a list with water related FP7 and H2020 projects is provides, along with their main objectives and topics.
24
Technology survey: Prospectives and challenges
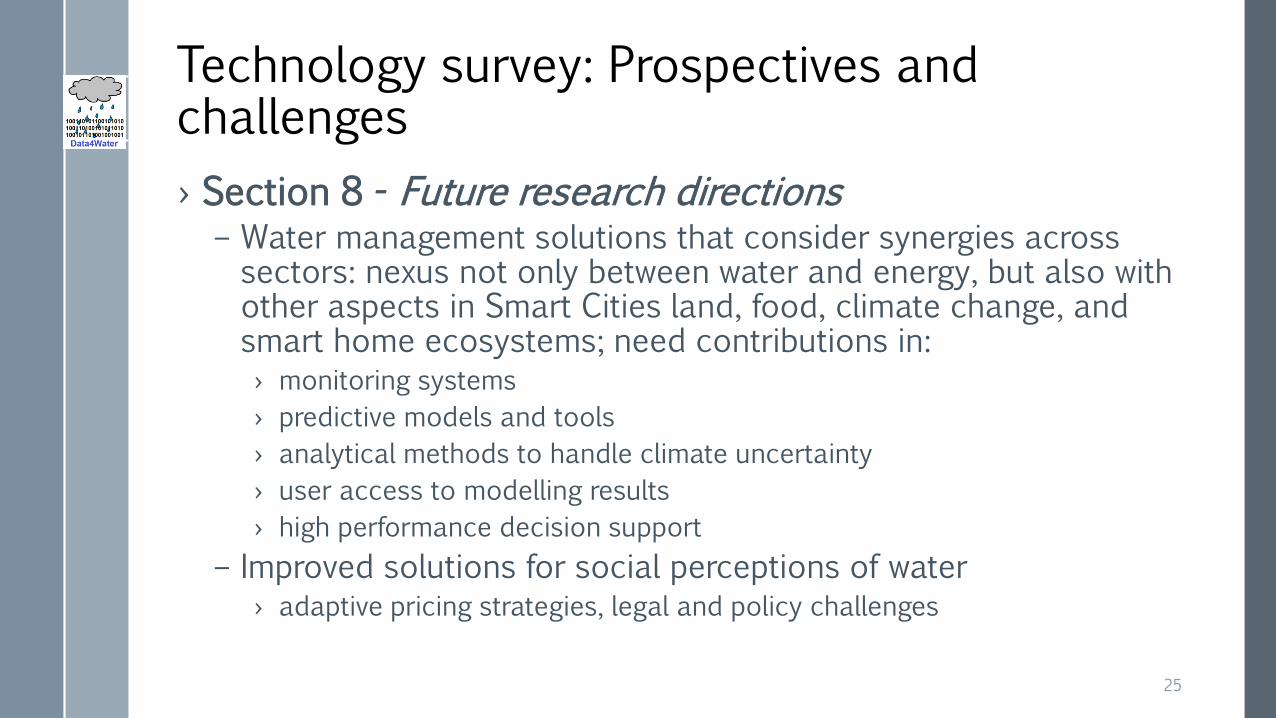
› Section 8 - Future research directions – Water management solutions that consider synergies across sectors: nexus not only between water and energy, but also with other aspects in Smart Cities land, food, climate change, and smart home ecosystems; need contributions in: › monitoring systems
› predictive models and tools
› analytical methods to handle climate uncertainty
› user access to modelling results
› high performance decision support
– Improved solutions for social perceptions of water › adaptive pricing strategies, legal and policy challenges
25
Technology survey: Prospectives and challenges
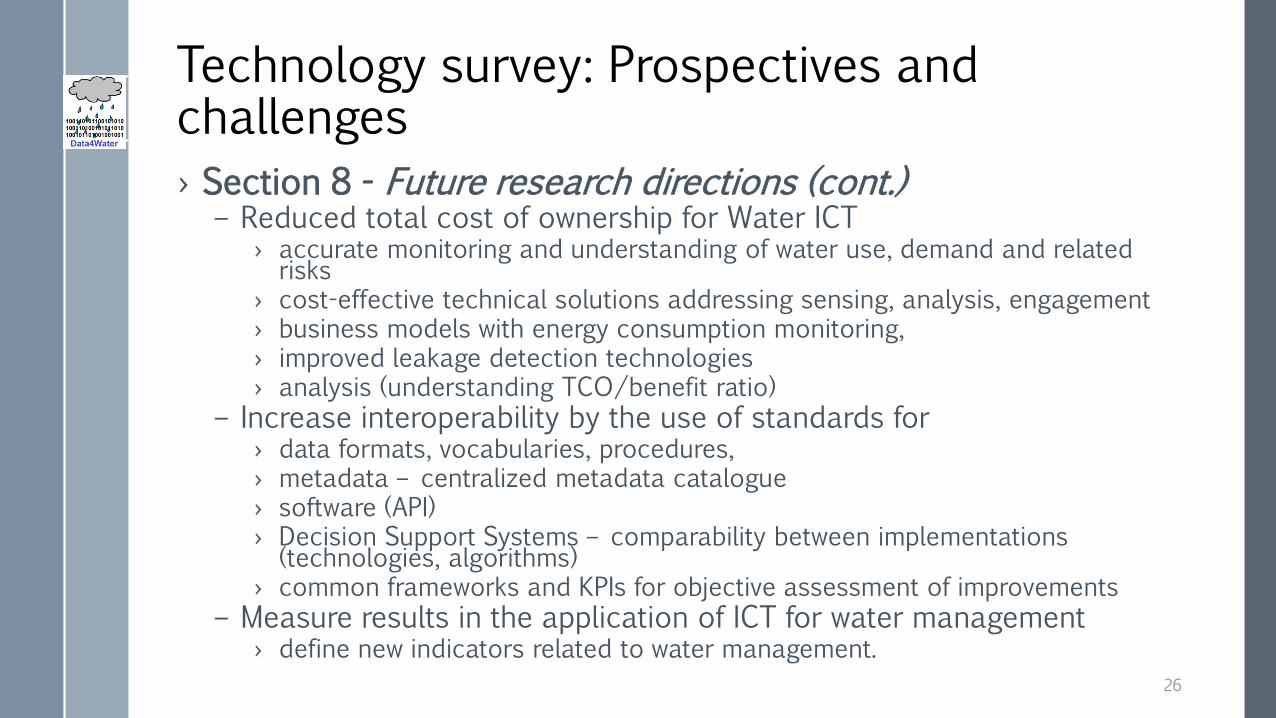
› Section 8 - Future research directions (cont.)– Reduced total cost of ownership for Water ICT
› accurate monitoring and understanding of water use, demand and related risks
› cost-effective technical solutions addressing sensing, analysis, engagement› business models with energy consumption monitoring,› improved leakage detection technologies› analysis (understanding TCO/benefit ratio)
– Increase interoperability by the use of standards for › data formats, vocabularies, procedures,› metadata – centralized metadata catalogue› software (API)› Decision Support Systems – comparability between implementations
(technologies, algorithms)› common frameworks and KPIs for objective assessment of improvements
– Measure results in the application of ICT for water management › define new indicators related to water management.
26
Outline
› Introduction ICT-supported Water Management and Data4Water
› Application Examples– Literature Analysis for Emerging ICT Trends in Water Management
– Service Level Agreement for Water Resource Management
› Summary
27
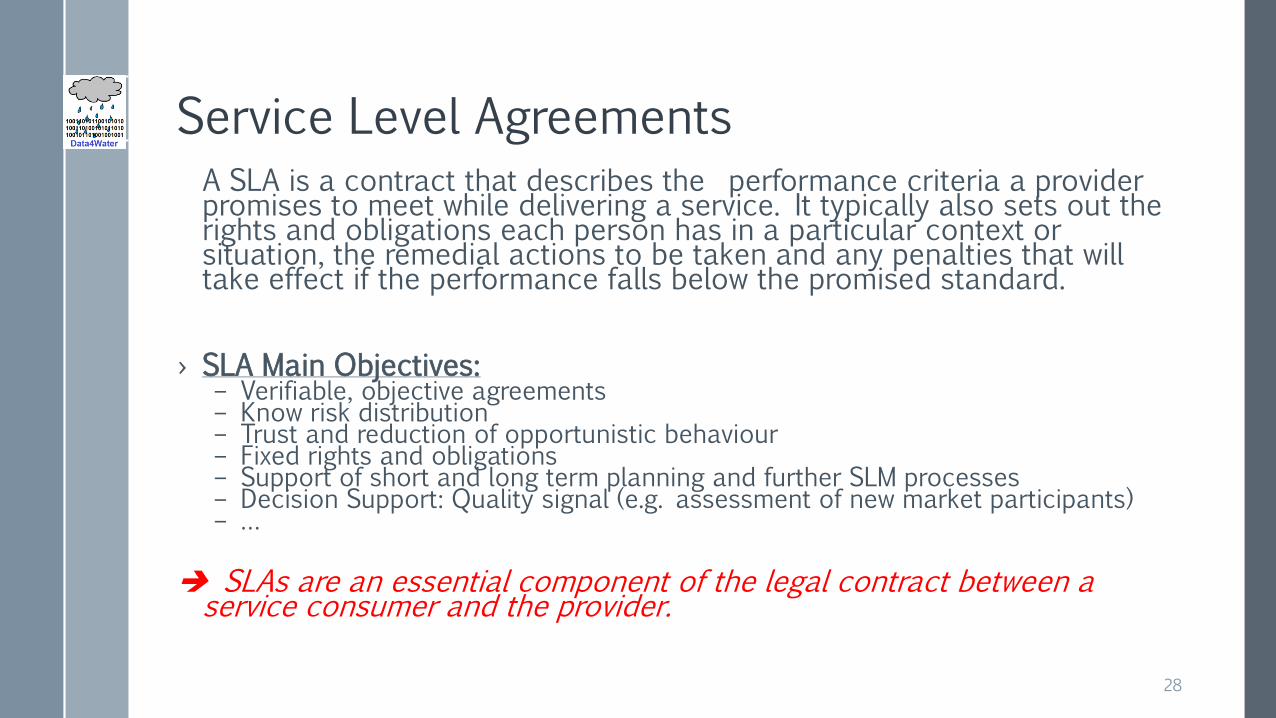
Service Level AgreementsA SLA is a contract that describes the performance criteria a provider promises to meet while delivering a service. It typically also sets out the rights and obligations each person has in a particular context or situation, the remedial actions to be taken and any penalties that will take effect if the performance falls below the promised standard.
› SLA Main Objectives:– Verifiable, objective agreements– Know risk distribution– Trust and reduction of opportunistic behaviour– Fixed rights and obligations – Support of short and long term planning and further SLM processes– Decision Support: Quality signal (e.g. assessment of new market participants)– …
SLAs are an essential component of the legal contract between a service consumer and the provider.
28
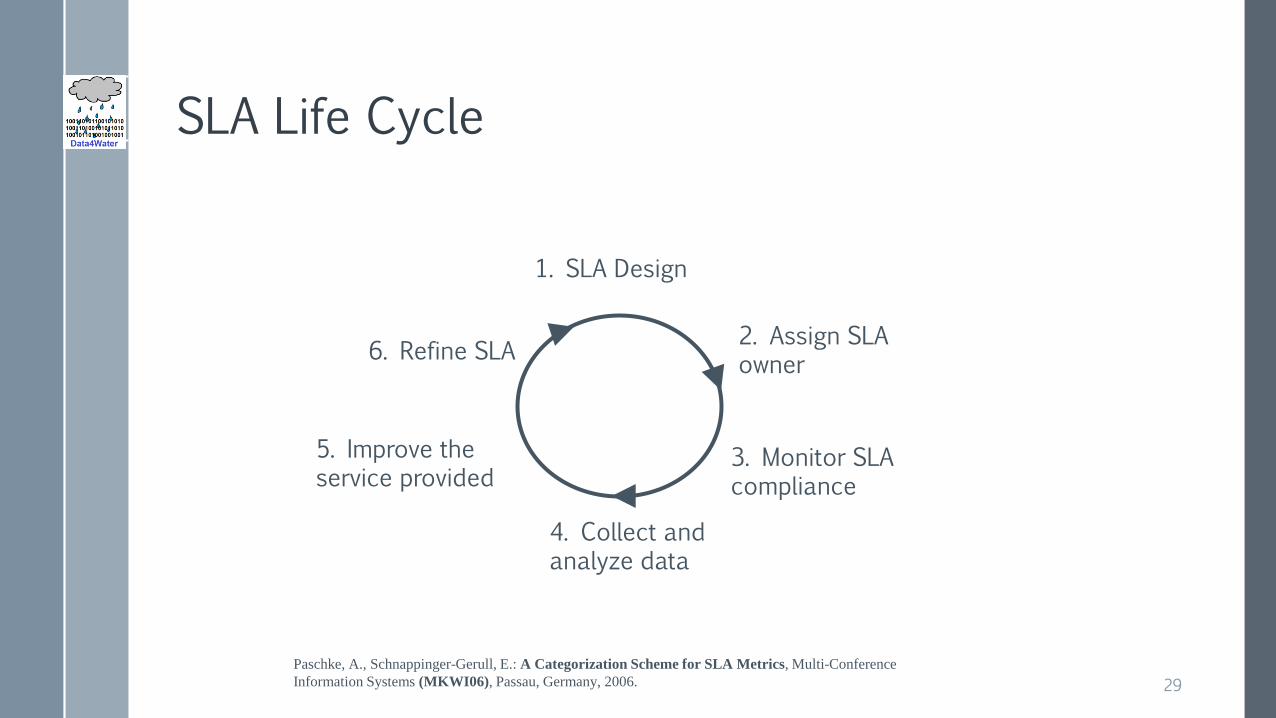
SLA Life Cycle
1. SLA Design
2. Assign SLA owner
3. Monitor SLA compliance
4. Collect and analyze data
5. Improve the service provided
6. Refine SLA
Paschke, A., Schnappinger-Gerull, E.: A Categorization Scheme for SLA Metrics, Multi-Conference
Information Systems (MKWI06), Passau, Germany, 2006. 29
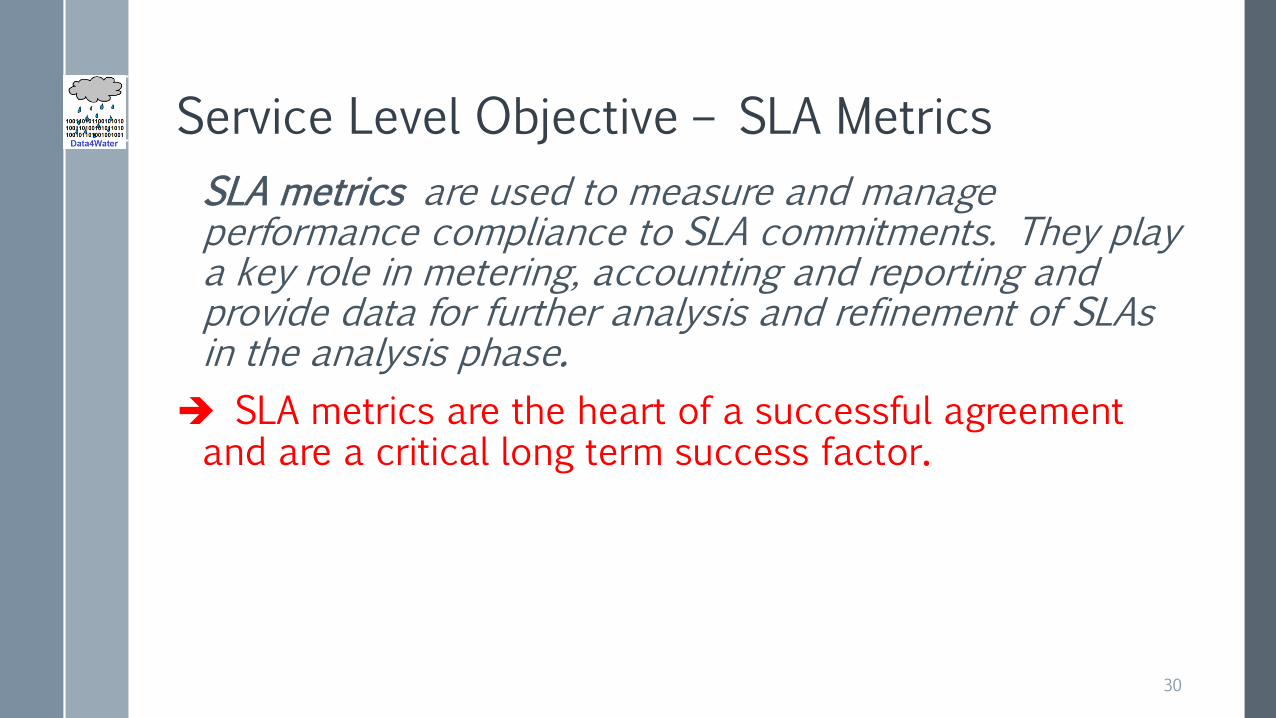
Service Level Objective – SLA Metrics
SLA metrics are used to measure and manage performance compliance to SLA commitments. They play a key role in metering, accounting and reporting and provide data for further analysis and refinement of SLAs in the analysis phase.
SLA metrics are the heart of a successful agreement and are a critical long term success factor.
30
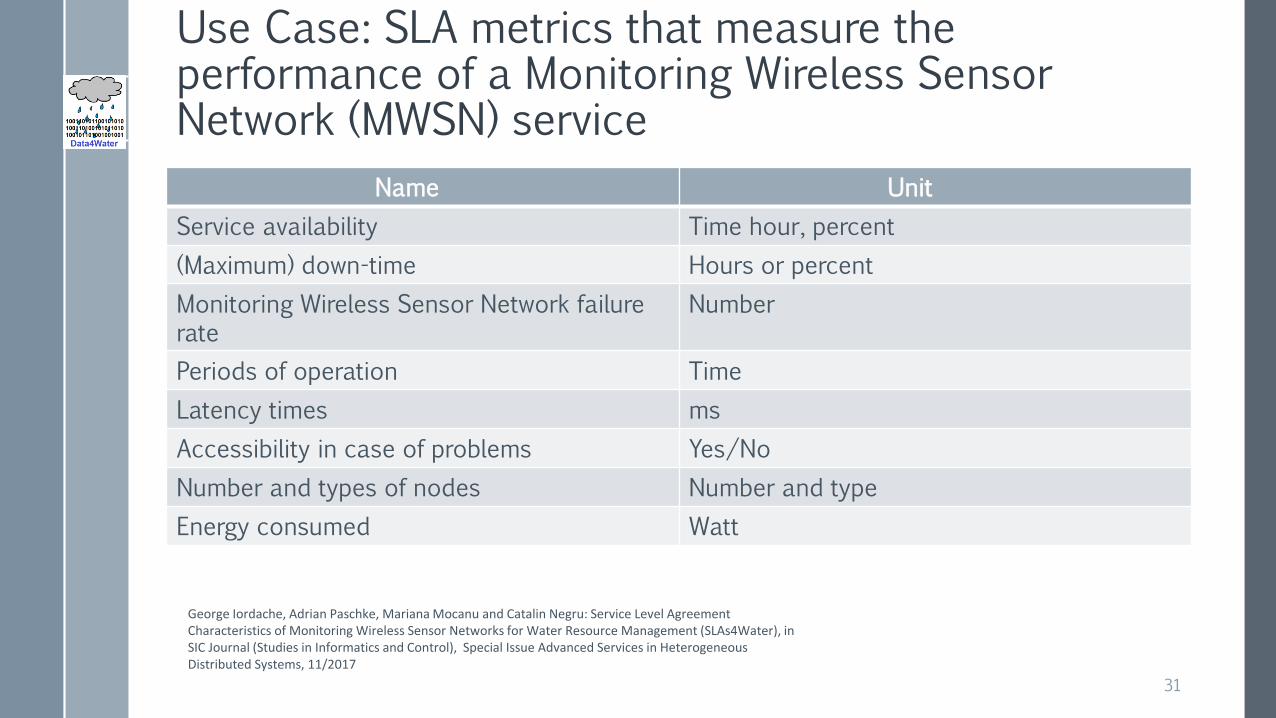
Use Case: SLA metrics that measure the performance of a Monitoring Wireless Sensor Network (MWSN) service
Name Unit
Service availability Time hour, percent
(Maximum) down-time Hours or percent
Monitoring Wireless Sensor Network failure rate
Number
Periods of operation Time
Latency times ms
Accessibility in case of problems Yes/No
Number and types of nodes Number and type
Energy consumed Watt
George Iordache, Adrian Paschke, Mariana Mocanu and Catalin Negru: Service Level Agreement Characteristics of Monitoring Wireless Sensor Networks for Water Resource Management (SLAs4Water), in SIC Journal (Studies in Informatics and Control), Special Issue Advanced Services in Heterogeneous Distributed Systems, 11/2017
31
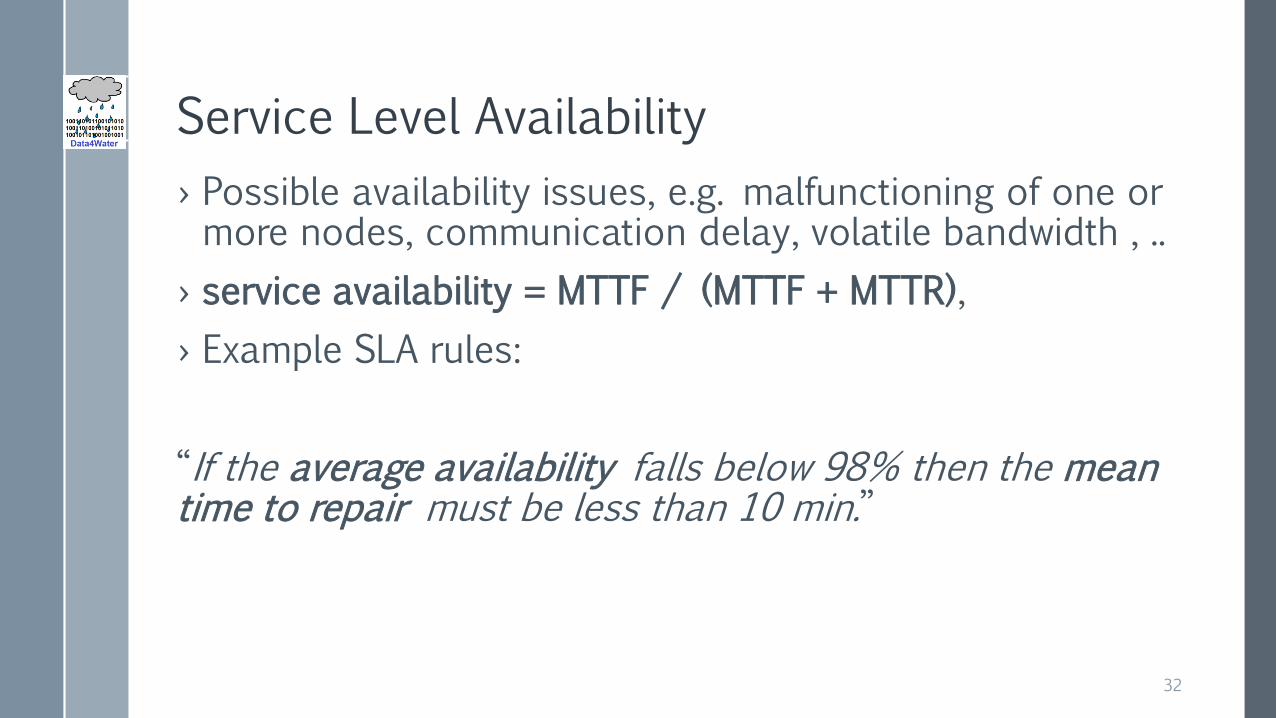
Service Level Availability
› Possible availability issues, e.g. malfunctioning of one or more nodes, communication delay, volatile bandwidth , ..
› service availability = MTTF / (MTTF + MTTR),
› Example SLA rules:
“If the average availability falls below 98% then the mean time to repair must be less than 10 min.”
32
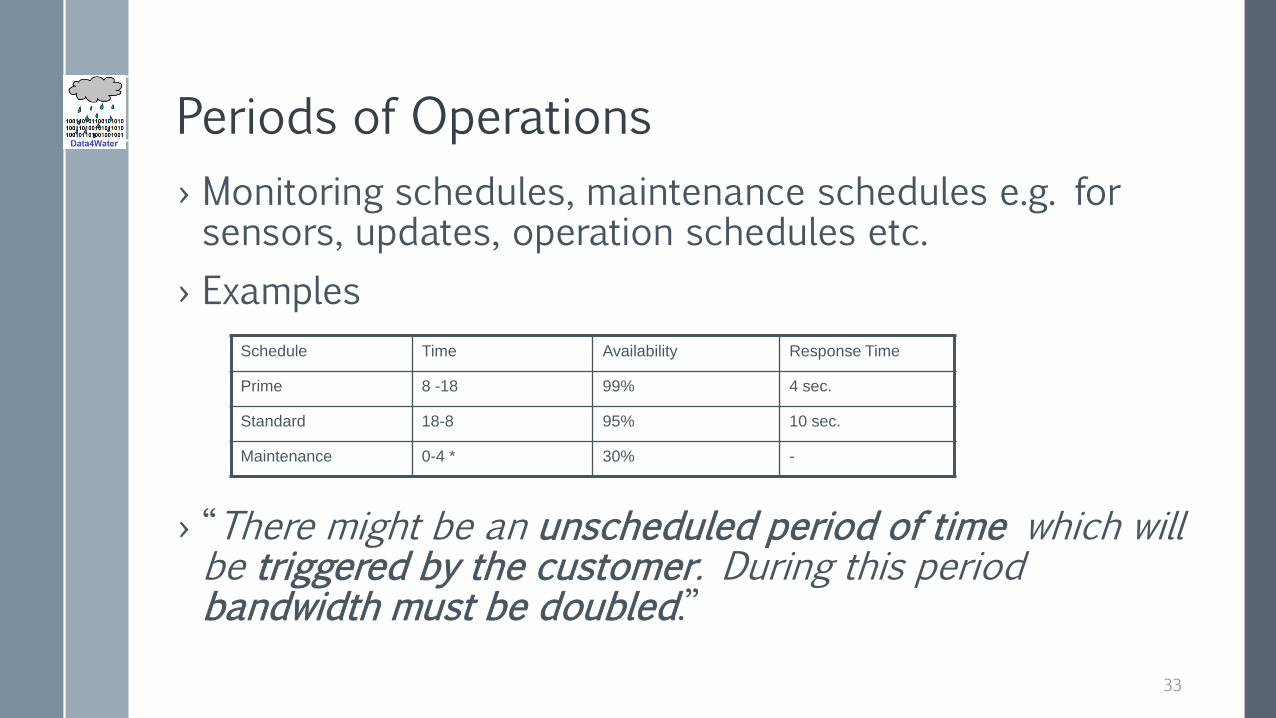
Periods of Operations
› Monitoring schedules, maintenance schedules e.g. forsensors, updates, operation schedules etc.
› Examples
› “There might be an unscheduled period of time which will be triggered by the customer. During this period bandwidth must be doubled.”
Schedule Time Availability Response Time
Prime 8 -18 99% 4 sec.
Standard 18-8 95% 10 sec.
Maintenance 0-4 * 30% -
33
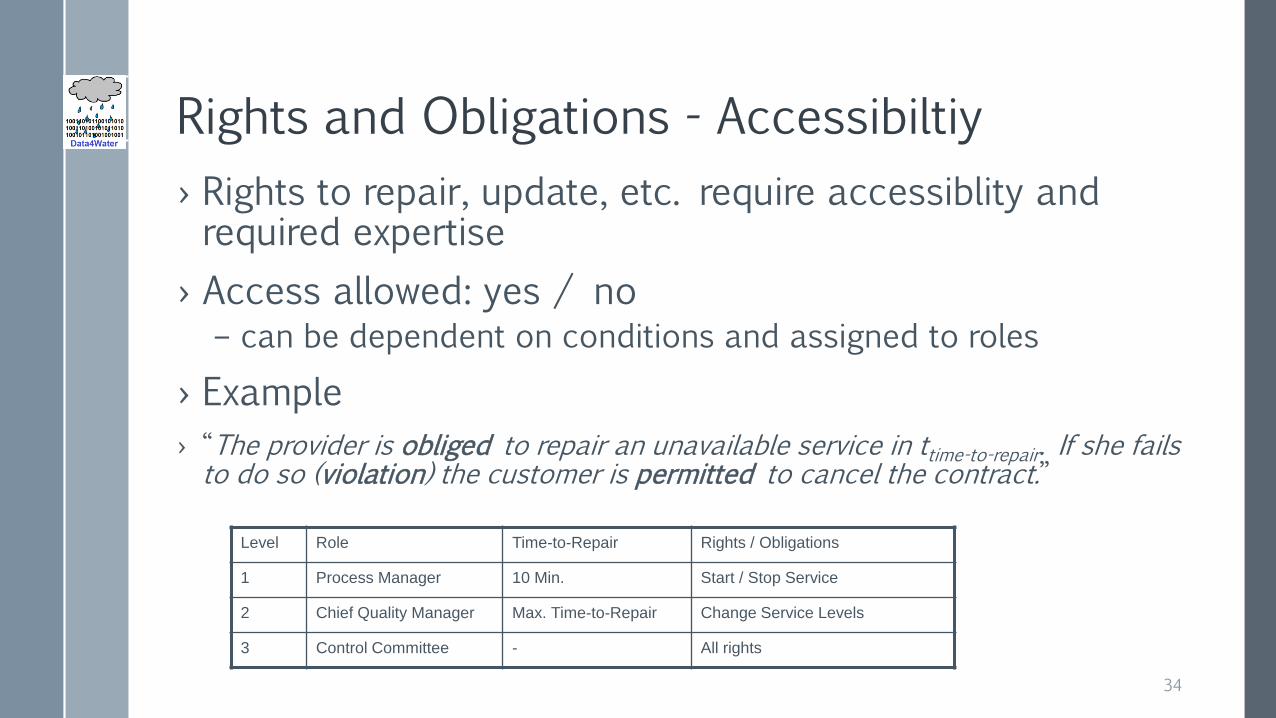
Rights and Obligations - Accessibiltiy
› Rights to repair, update, etc. require accessiblity andrequired expertise
› Access allowed: yes / no– can be dependent on conditions and assigned to roles
› Example
› “The provider is obliged to repair an unavailable service in ttime-to-repair. If she fails to do so (violation) the customer is permitted to cancel the contract.”
Level Role Time-to-Repair Rights / Obligations
1 Process Manager 10 Min. Start / Stop Service
2 Chief Quality Manager Max. Time-to-Repair Change Service Levels
3 Control Committee - All rights
34
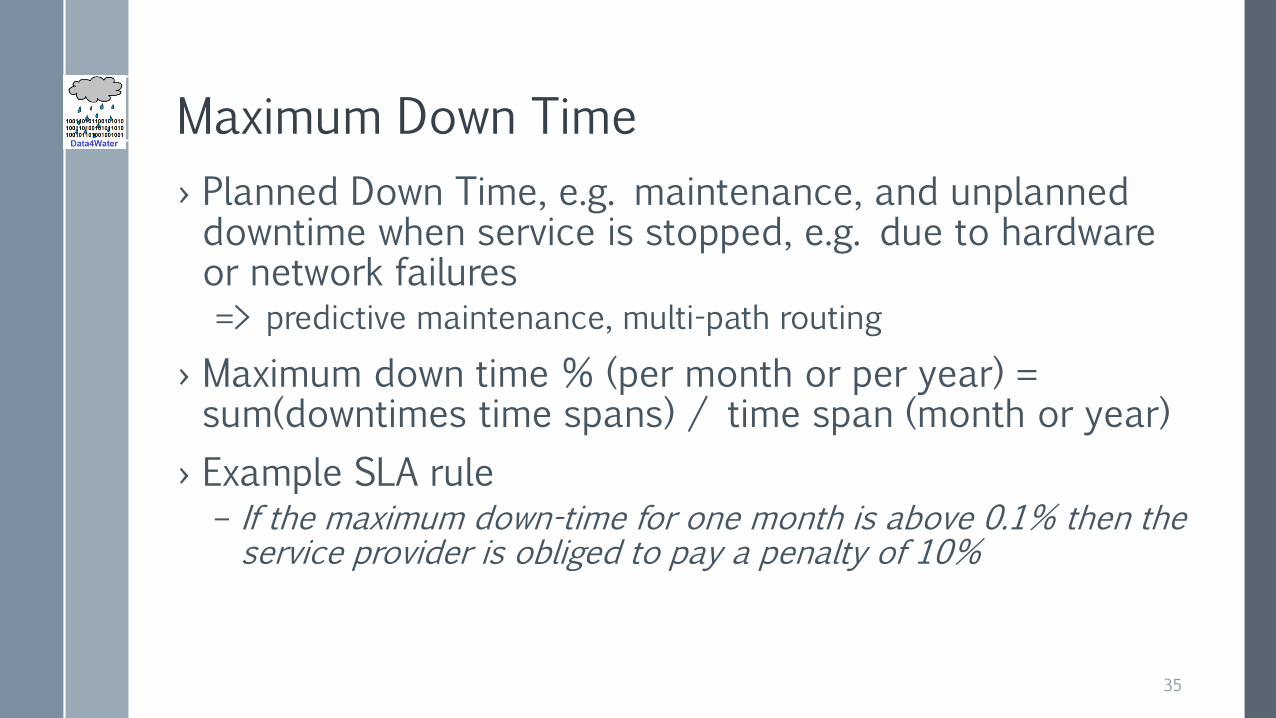
Maximum Down Time
› Planned Down Time, e.g. maintenance, and unplanneddowntime when service is stopped, e.g. due to hardwareor network failures=> predictive maintenance, multi-path routing
› Maximum down time % (per month or per year) = sum(downtimes time spans) / time span (month or year)
› Example SLA rule– If the maximum down-time for one month is above 0.1% then the service provider is obliged to pay a penalty of 10%
35
Failure Rate
› Number of failures during the life cycle time
› λ = number of failures / life cycle time period
› Mean Time Between Failures MTBF = 1/λ
› Example SLA rule:
› If the failure rate for one year is above 0.0011 failures per hour then the service provider is obliged to pay a penalty of 5%
36
Latency Times
› Important for data aggregation
› latency times in terms of fractions of seconds (e.g. ms) or multiples of seconds
› Example SLA rule:
If the latency times is bigger than 100ms then after two such violations the service provider is obliged to pay a penalty of 5% for every new violation
37
Number of nodes and types
› refers to how many monitoring nodes and their types were specified in the SLA contract (during design time)
› Examples
› If the MWSN number of nodes parameter has the value below the agreed value (e.g. 5 nodes) then the MWSN provider needs to solve this problem in 10 minutes otherwise it will pay a penalty of 10% for this violation
› If the MWSN types of nodes parameter is smaller than the agreed ones (e.g. 5 different types of nodes) then the MWSN provider needs to solve this problem in 10 minutes otherwise it will pay a penalty of 10% for this violation
38
Energy Consumption
› MWSN energy consumed parameter refers at how much energy in terms of Watts the MWSN consumes
› Example SLA rule:
› If the monthly cost of a Monitoring Wireless Sensor Network is bigger than a specified sum per month (e.g. 100$) then the MWSN customer can revoke the contract with the provider
39
Application Example: Water Quality Monitoring Wireless Sensor Networks (WQMWSN) - Availability
› there is a need for robust sensors because the operation of these sensors in a water environment can generate sensor malfunctioning; in the case of node(s) malfunctioning the node(s) that is(are) broken need(s) to be replaced;
› the process of sensor maintenance should be as less frequent as it is possible, and it should last as little time as it is possible;
› providing a power source (battery) that allows the WQMWSN provider to deploy the WQMWSN for as long time as possible; the lifetime of the power source depends on various aspects such as the sensor(s) type and monitoring frequency
40
WQMWSN Down-time and Failure-Rate
› WQMWSN typically operates on batteries that are replaced when discharged in a certain period of operation
› weekly calibration of the network must be done to get correct results
› possibility that one or more nodes of the network doesn’t function any more – data transmitted by the WQMWSN is continuously monitored and actions are taken usually after a cycle time which is specified in the order of minutes, e.g. 20 minutes, 30 minutes
› failure rate usually this parameter depends on the ability of the WQMWSN to function when one or more sensor node(s) stop(s) functioning – Monitor sensors and replace them (at best pro-active predictive maintenance)
41
WQMWSN Number and Type of Nodes › Dependent on the type of measurements of the WQMWSN, e.g.
› WQMWSN 1› I. Submersible Temperature Meter; › II. Water pH Meter; › III. Water Conductivity Meter; › IV. Dissolved Oxygen Sensor; › V. Water Turbidity Meter; › VI. Water Level Meter.
› WQMWSN 2› I. pH sensor that senses the acidity of the water, › II. temperature sensor and› III. turbidity sensor based on photo-transistor.
› WQMWSN 3› I. fluctuations in pH, › II. temperature, › III. dissolved oxygen.
42
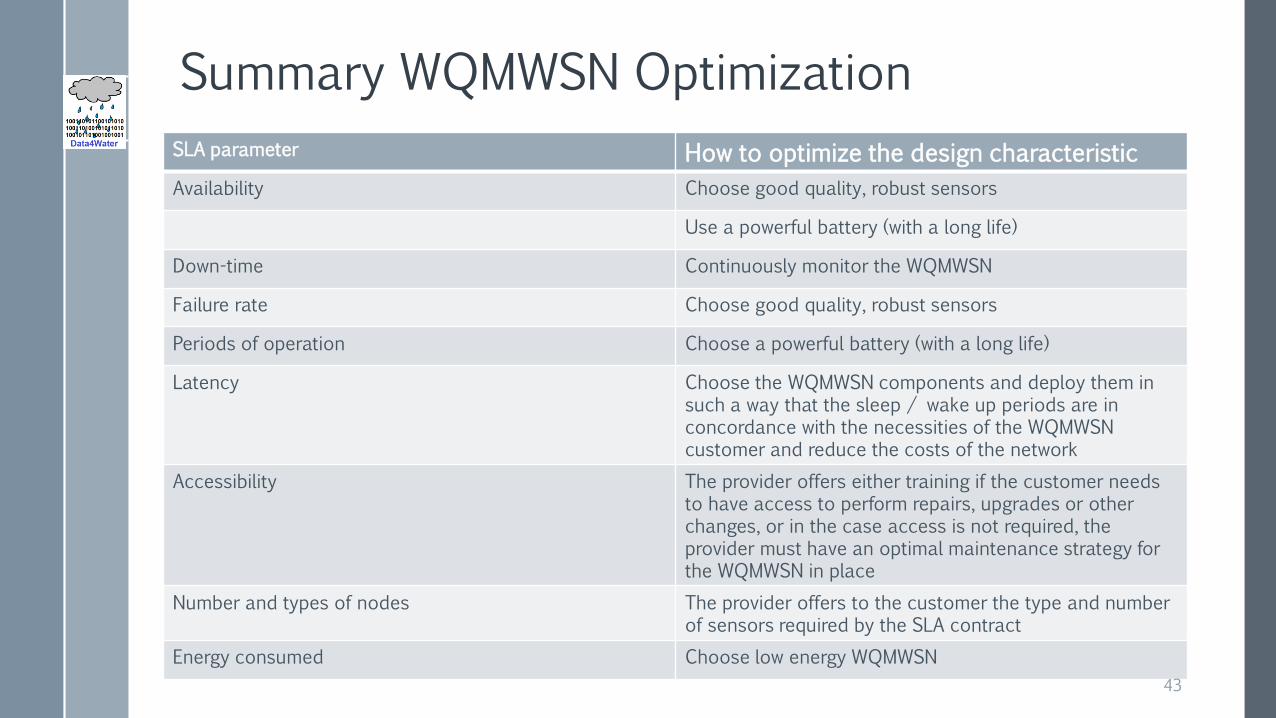
Summary WQMWSN Optimization
SLA parameter How to optimize the design characteristic
Availability Choose good quality, robust sensors
Use a powerful battery (with a long life)
Down-time Continuously monitor the WQMWSN
Failure rate Choose good quality, robust sensors
Periods of operation Choose a powerful battery (with a long life)
Latency Choose the WQMWSN components and deploy them in such a way that the sleep / wake up periods are in concordance with the necessities of the WQMWSN customer and reduce the costs of the network
Accessibility The provider offers either training if the customer needs to have access to perform repairs, upgrades or other changes, or in the case access is not required, the provider must have an optimal maintenance strategy for the WQMWSN in place
Number and types of nodes The provider offers to the customer the type and number of sensors required by the SLA contract
Energy consumed Choose low energy WQMWSN
43
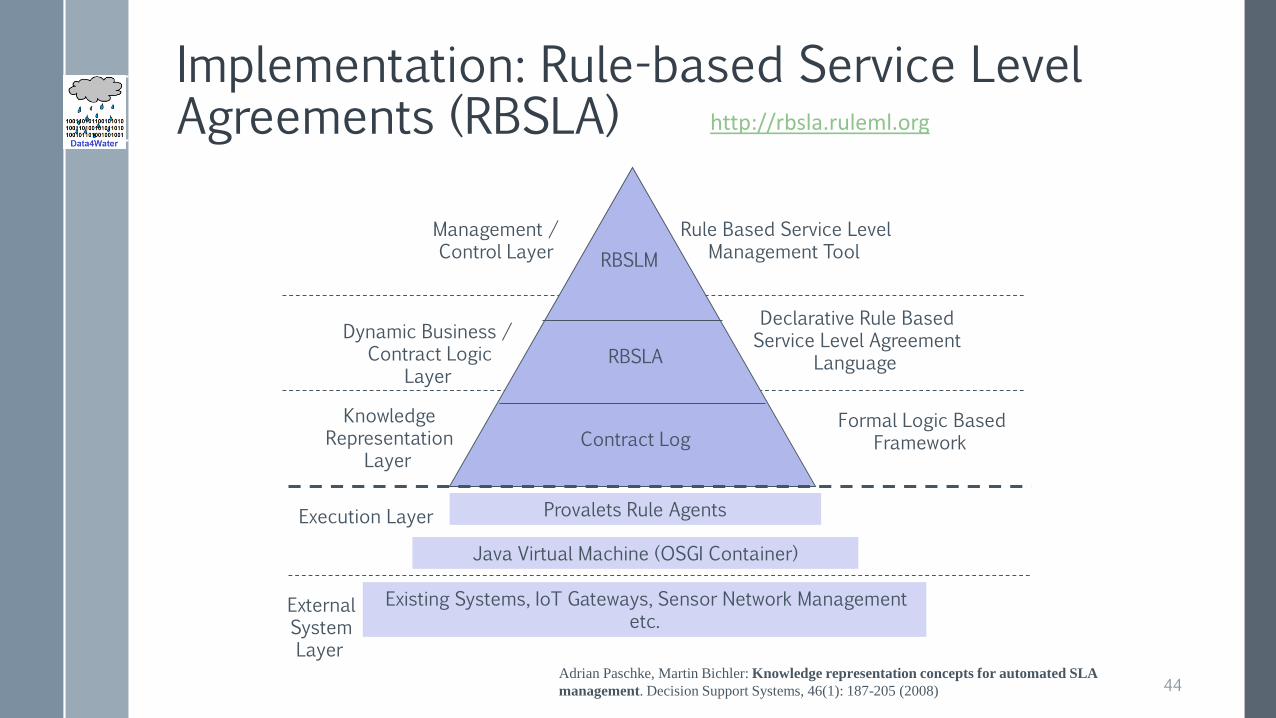
Implementation: Rule-based Service Level Agreements (RBSLA)
Contract Log
RBSLA
RBSLM
Rule Based Service Level Management Tool
Provalets Rule Agents
Existing Systems, IoT Gateways, Sensor Network Management etc.
Dynamic Business / Contract Logic
Layer
Execution Layer
Java Virtual Machine (OSGI Container)
Management / Control Layer
Declarative Rule Based Service Level Agreement
Language
Knowledge Representation
Layer
External System Layer
Formal Logic Based Framework
Adrian Paschke, Martin Bichler: Knowledge representation concepts for automated SLA
management. Decision Support Systems, 46(1): 187-205 (2008) 44
http://rbsla.ruleml.org
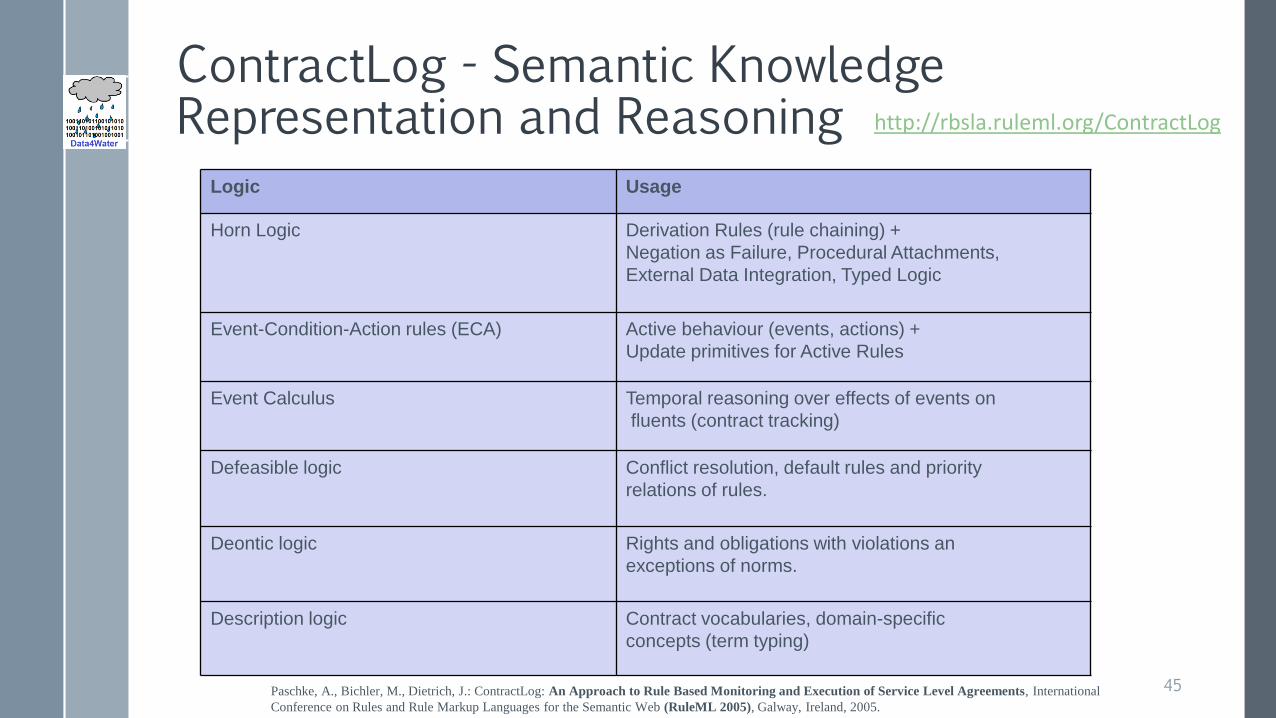
ContractLog - Semantic Knowledge Representation and Reasoning
Logic Usage
Horn Logic Derivation Rules (rule chaining) +
Negation as Failure, Procedural Attachments,
External Data Integration, Typed Logic
Event-Condition-Action rules (ECA) Active behaviour (events, actions) +
Update primitives for Active Rules
Event Calculus Temporal reasoning over effects of events on
fluents (contract tracking)
Defeasible logic Conflict resolution, default rules and priority
relations of rules.
Deontic logic Rights and obligations with violations an
exceptions of norms.
Description logic Contract vocabularies, domain-specific
concepts (term typing)
Paschke, A., Bichler, M., Dietrich, J.: ContractLog: An Approach to Rule Based Monitoring and Execution of Service Level Agreements, International
Conference on Rules and Rule Markup Languages for the Semantic Web (RuleML 2005), Galway, Ireland, 2005.
45
http://rbsla.ruleml.org/ContractLog
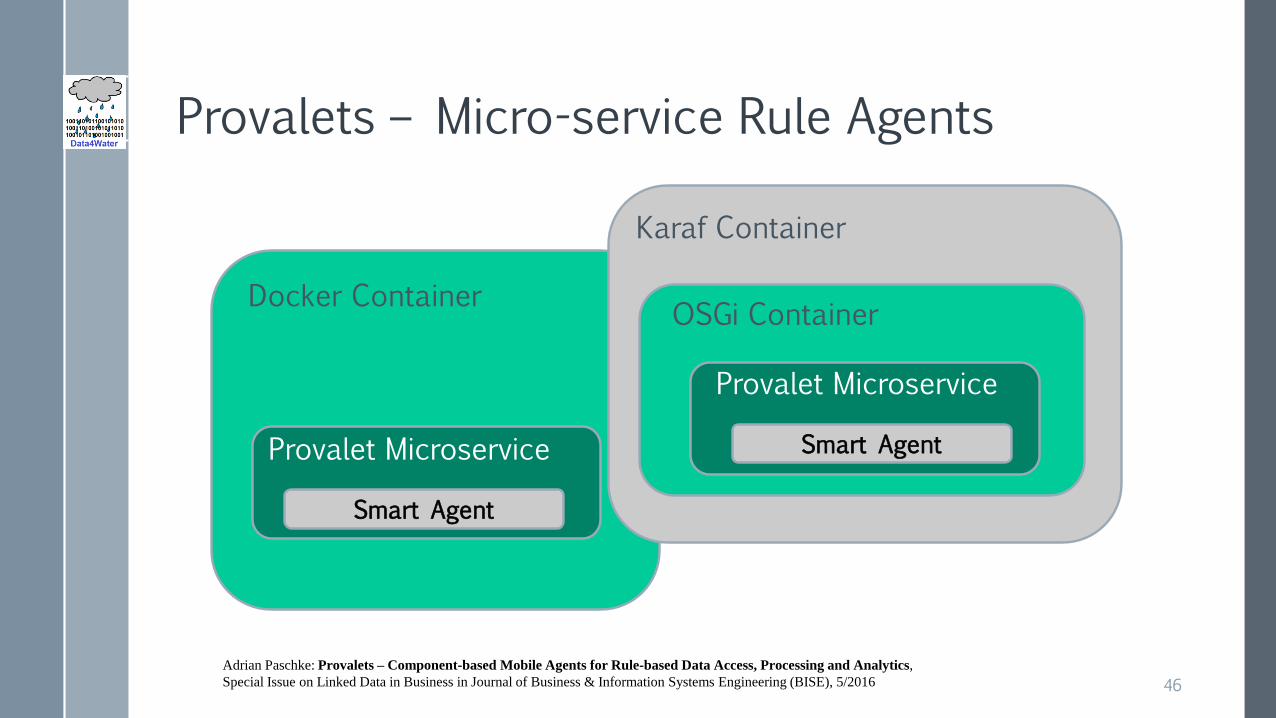
Provalets – Micro-service Rule Agents
Docker Container
Karaf Container
OSGi Container
Provalet Microservice
Smart AgentProvalet Microservice
Smart Agent
Adrian Paschke: Provalets – Component-based Mobile Agents for Rule-based Data Access, Processing and Analytics,
Special Issue on Linked Data in Business in Journal of Business & Information Systems Engineering (BISE), 5/2016 46
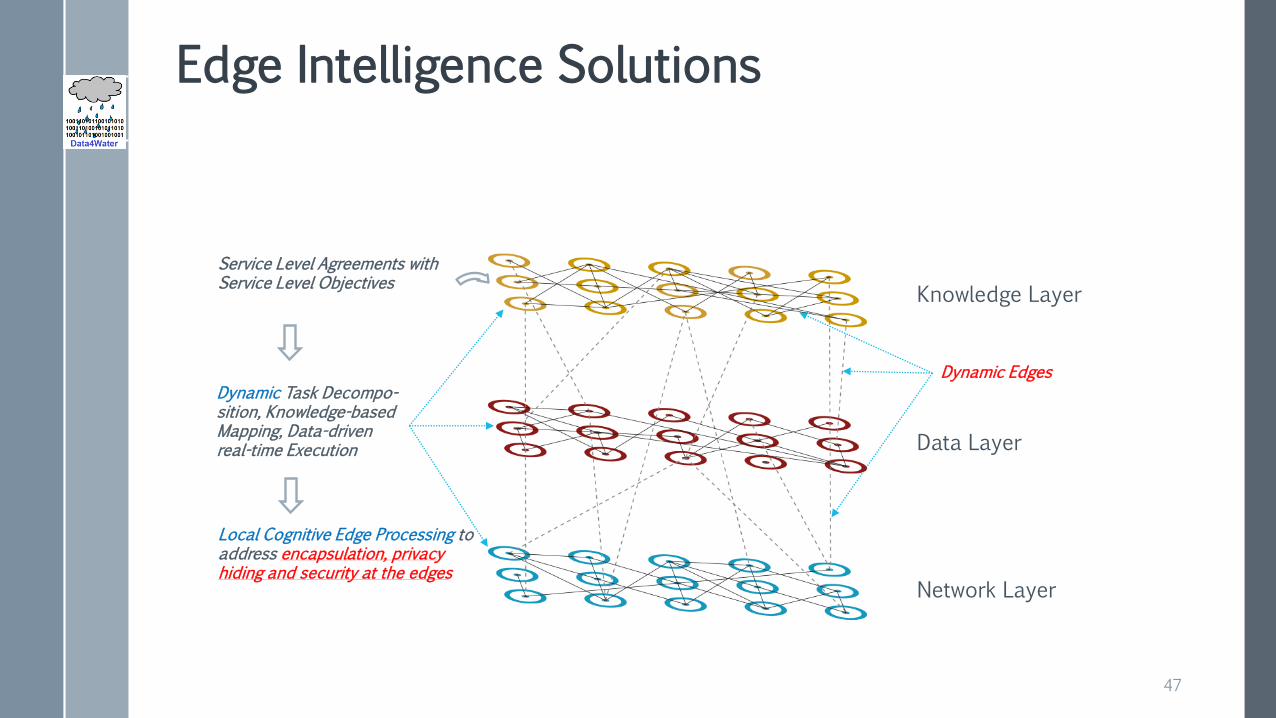
Edge Intelligence Solutions
Data Layer
Network Layer
Knowledge Layer
Dynamic Edges
Service Level Agreements with Service Level Objectives
Local Cognitive Edge Processing to address encapsulation, privacy hiding and security at the edges
Dynamic Task Decompo-sition, Knowledge-based Mapping, Data-driven real-time Execution
47
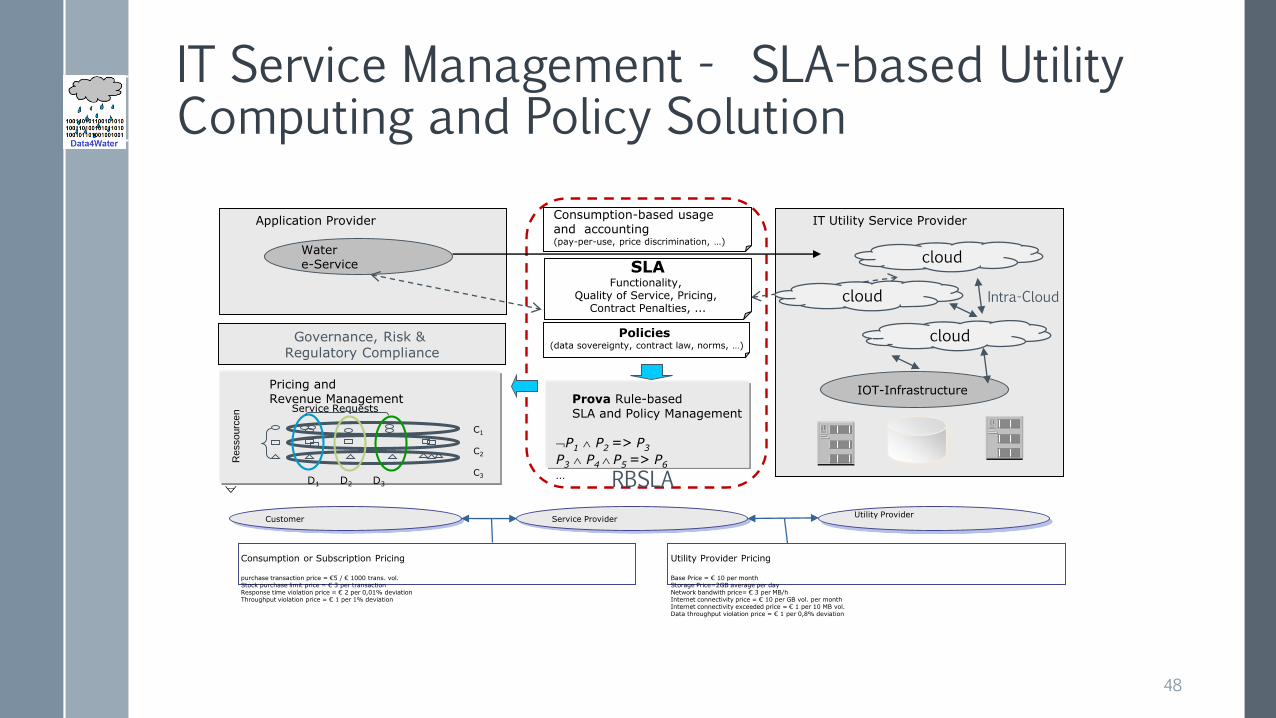
IT Service Management - SLA-based Utility Computing and Policy Solution
IOT-Infrastructure
Watere-Service
Application Provider IT Utility Service ProviderConsumption-based usage and accounting(pay-per-use, price discrimination, …)
SLAFunctionality,
Quality of Service, Pricing, Contract Penalties, ...
P1 P2 => P3
P3 P4 P5 => P6
...
Prova Rule-based SLA and Policy Management
Re
sso
urc
en
C1
C2
C3
Service Requests
D1 D2 D3
Pricing and Revenue Management
Customer Service ProviderUtility Provider
Consumption or Subscription Pricing
purchase transaction price = €5 / € 1000 trans. vol.Stock purchase limit price = € 3 per transactionResponse time violation price = € 2 per 0,01% deviationThroughput violation price = € 1 per 1% deviation
Utility Provider Pricing
Base Price = € 10 per monthStorage Price=2GB average per dayNetwork bandwith price= € 3 per MB/hInternet connectivity price = € 10 per GB vol. per monthInternet connectivity exceeded price = € 1 per 10 MB vol.Data throughput violation price = € 1 per 0,8% deviation
Policies(data sovereignty, contract law, norms, …)
cloud
cloud
cloud
Intra-Cloud
Governance, Risk & Regulatory Compliance
RBSLA
48
Summary
› water management is a complex system with interrelated processes surrounding the water cycle and the water nexus
› new ICT-supported water management approaches require processing of a huge amount of data with different levels of quality, accessibility and availability to achieve (SLA-based) performance goals and objectives
› often the data acquisition needs to be acquired, transmitted and accessed in real time and processed at the edge for real-time decisions and reactions as well as post-processed in the cloud, e.g. for calibration and validation of models.
49
Thank you!
50
DATA4WATERProject website: http://data4water.eu
Networking and Knowledge E-Environmenthttp://data4water.pub.ro
Data4Water: Network of Excellence and Partnership in Smart Data for Water Management.
Join us on LinkedIn -https://www.linkedin.com/groups/13502078