Embed Size (px)
Citation preview

The Art and Science of Data Wrangling
Kristen M. Altenburger and Sam PeposeFacebook Core Data Science & Portal AI
Georgia Tech CS 4803/7643 Deep LearningFebruary 11, 2020

“The performance of machine learning methods is heavily dependent on the choice of data representation (or
features) on which they are applied” (Bengio et al., 2013)

The Pitfalls of Data Wrangling
3(Aboumatar et al., 2019) (Camerer et al., 2018)

The Data Wrangling Process
population
4

The Data Wrangling Process
population
5
sample

The Data Wrangling Process
population sample
train
test
6
cross-validation

The Data Wrangling Process
population sample
train
test
Learn Model
7
cross-validation

The Data Wrangling Process
population sample
train
test
Learn Model
Evaluate Model
8
cross-validation
The Data Wrangling Process
population sample
train
test
Learn Model
Evaluate Model
9
cross-validation
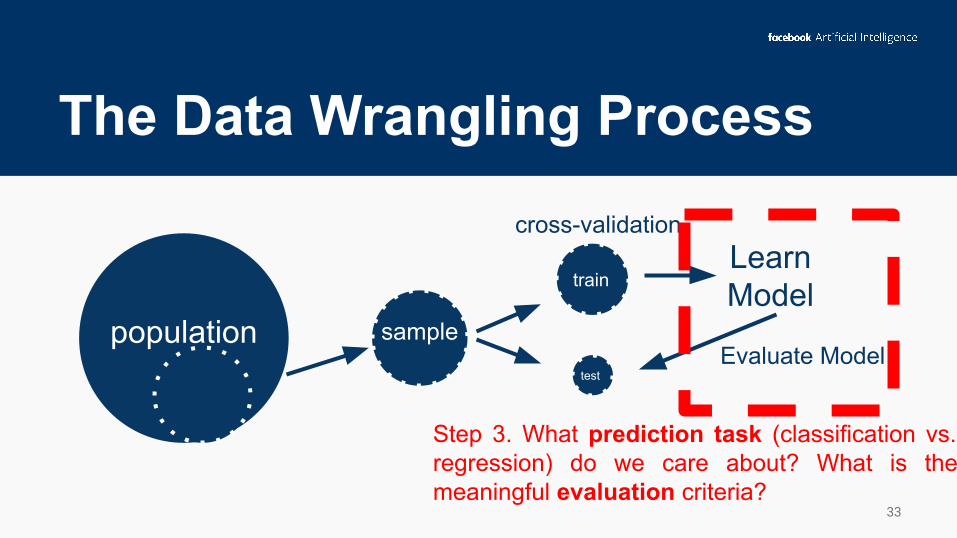
Step 1. What is the population of interest? What sample is predictive performance evaluated on, and is the sample representative of the population?

We Illustrate the Data Wrangling Process with an Example
10
“Yelp might clean up the restaurant industry”
https://www.theatlantic.com/magazine/archive/2013/07/youll-never-throw-up-in-this-town-again/309383/

Previous Claims: Yelp is Predictive of Unhygienic Restaurants
11
The Population: Yelp data and inspection records merged to predict restaurants with “severe violations”, over 2006-2013 in Seattle
Previous Results: Demonstrated usefulness of mappings between Yelp review text and hygiene inspections
(Kang et al. 2013)
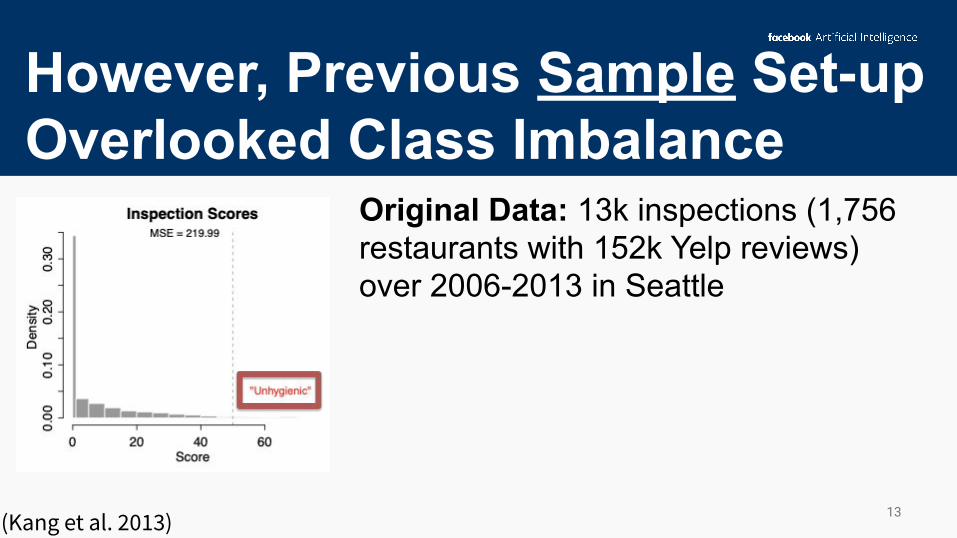
However, Previous Sample Set-up Overlooked Class Imbalance
12
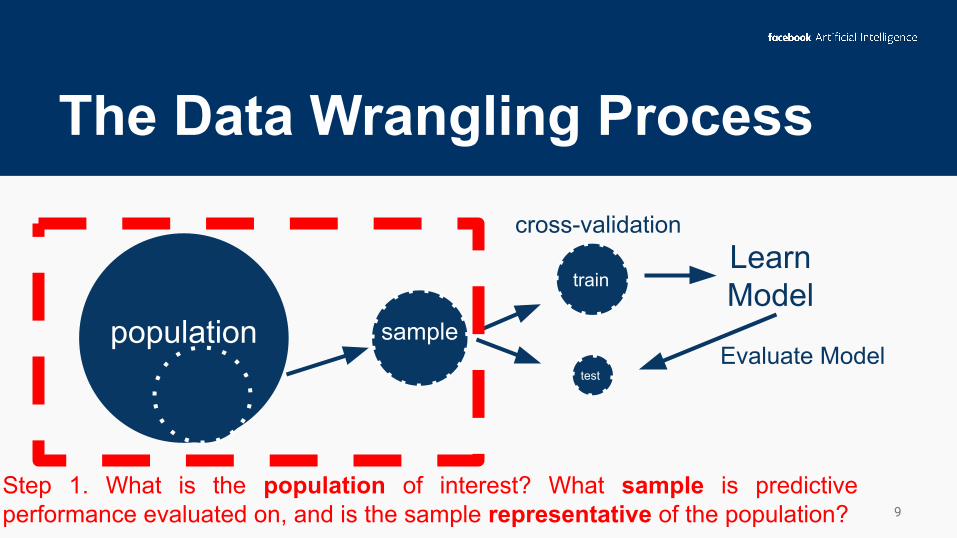
Original Data: 13k inspections (1,756 restaurants with 152k Yelp reviews) over 2006-2013 in Seattle
(Kang et al. 2013)
However, Previous Sample Set-up Overlooked Class Imbalance
13
Original Data: 13k inspections (1,756 restaurants with 152k Yelp reviews) over 2006-2013 in Seattle
(Kang et al. 2013)

However, Previous Sample Set-up Overlooked Class Imbalance
14
Original Data: 13k inspections (1,756 restaurants with 152k Yelp reviews) over 2006-2013 in Seattle
Sampled Data: 612 observations (306 hygienic observations and 306 unhygienic observations)
(Kang et al. 2013)

A Step-by-Step Wrangling Example
15
Hygienic observations were non-randomly sampled, resulting in an unexpectedly high number of duplicate restaurants in the hygienic sample.
(Kang et al. 2013)

A Step-by-Step Wrangling Example
16
Hygienic observations were non-randomly sampled, resulting in an unexpectedly high number of duplicate restaurants in the hygienic sample.
(Kang et al. 2013)

Data Sample Representativeness
17https://www.foodsafetymagazine.com/magazine-archive1/december-2019january-2020/arfivicial-intelligence-and-food-safety-hype-vs-reality/

A Step-by-Step Wrangling Example
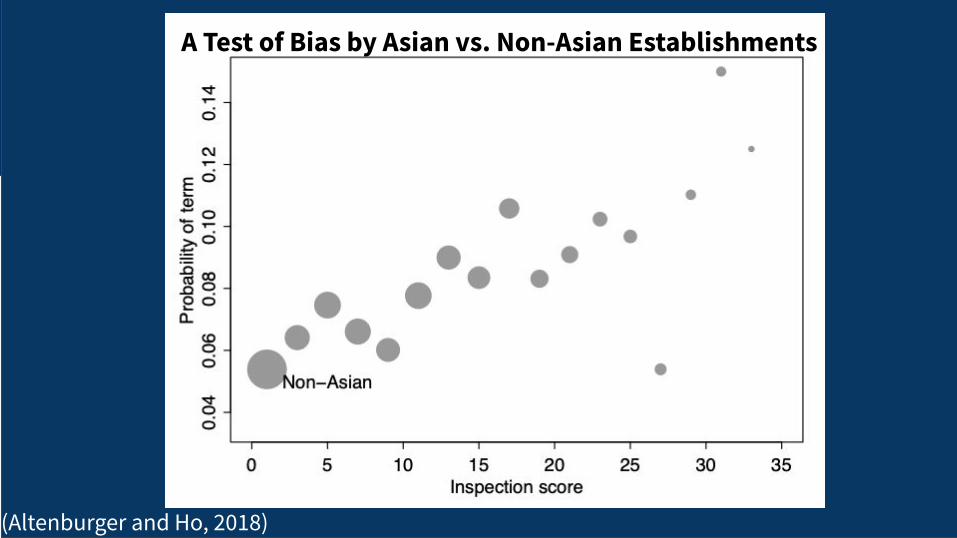
18(Altenburger and Ho, 2018)
A Test of Bias by Asian vs. Non-Asian Establishments
A Step-by-Step Wrangling Example
19(Altenburger and Ho, 2018)
A Test of Bias by Asian vs. Non-Asian Establishments

A Step-by-Step Wrangling Example
20(Altenburger and Ho, 2018)
A Test of Bias by Asian vs. Non-Asian Establishments

Data Wrangling Best Practices
21
1. Clearly define your population and sample2. Understand the representativeness of your sample

The Data Wrangling Process
population sample
train
test
Learn Model
Evaluate Model
22
cross-validation
Step 1. What is the population of interest? What sample is predictive performance evaluated on, and is the sample representative of the population?

The Data Wrangling Process
population sample
train
test
Learn Model
Evaluate Model
23
cross-validation
Step 2. How do we cross-validate to evaluate our model? How do we avoid overfitting and data mining?
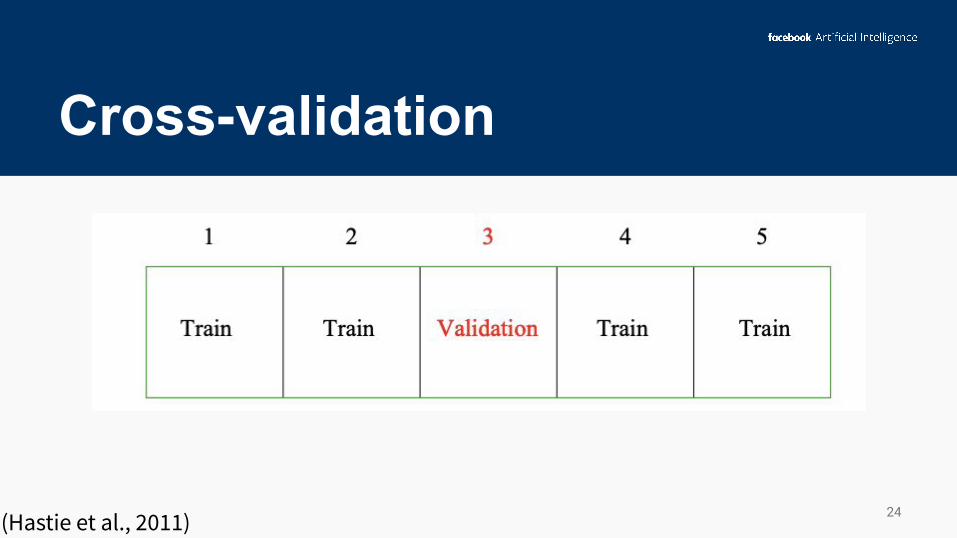
Cross-validation
24(Hastie et al., 2011)

Cross-validation Example
25(Hastie et al., 2011)
“1. Screen the predictors: find a subset of “good” predictors that show fairly strong (univariate) correlation with the class labels
2. Using just this subset of predictors, build a multivariate classifier.
3. Use cross-validation to estimate the unknown tuning parameters and to estimate the prediction error of the final model.”
Cross-validation Example
26(Hastie et al., 2011)

Class Imbalance and Cross-Validation
27

Class Imbalance and Cross-Validation
28

Cross-Validation Best Practices
29
● Random search vs. Grid Search for Hyperparameters (Bergstra and Bengio, 2012)
● Confirm hyperparameter range is sufficient such as plotting OOB error rate
● Temporal cross-validation considerations● Check for overfitting

Data Wrangling Best Practices
30
1. Clearly define your population and sample2. Understand the representativeness of your sample

Data Wrangling Best Practices
31
1. Clearly define your population and sample2. Understand the representativeness of your sample3. Cross-validation can go wrong in many ways; understand the
relevant problem and prediction task that will be done in practice
The Data Wrangling Process
population sample
train
test
Learn Model
Evaluate Model
32
cross-validation
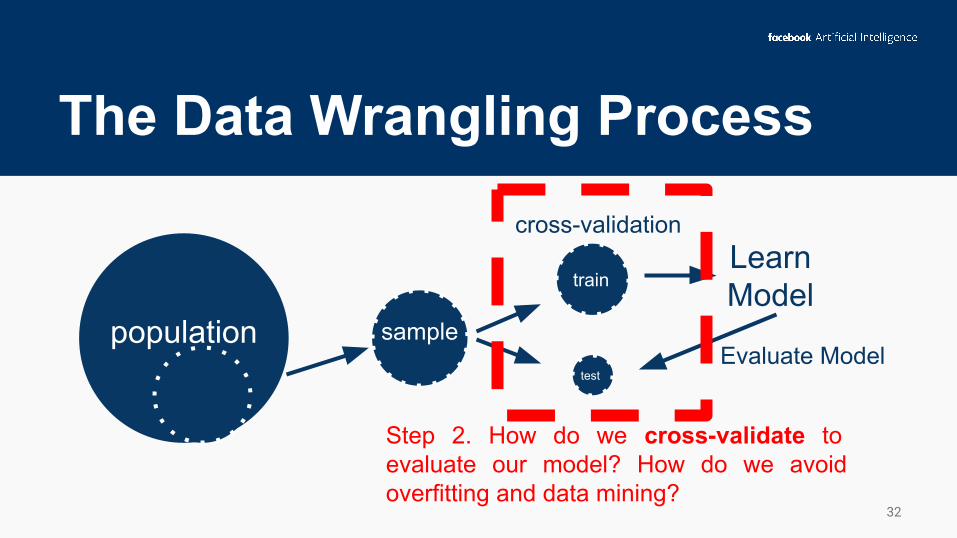
Step 2. How do we cross-validate to evaluate our model? How do we avoid overfitting and data mining?
The Data Wrangling Process
population sample
train
test
Learn Model
Evaluate Model
33
cross-validation
Step 3. What prediction task (classification vs. regression) do we care about? What is the meaningful evaluation criteria?

Our Re-Analysis: Classification vs. Regression
34(Altenburger and Ho, 2019)

35(Altenburger and Ho, 2019)
Our Re-Analysis: Classification vs. Regression

36(Altenburger and Ho, 2019)
Our Re-Analysis: Classification vs. Regression
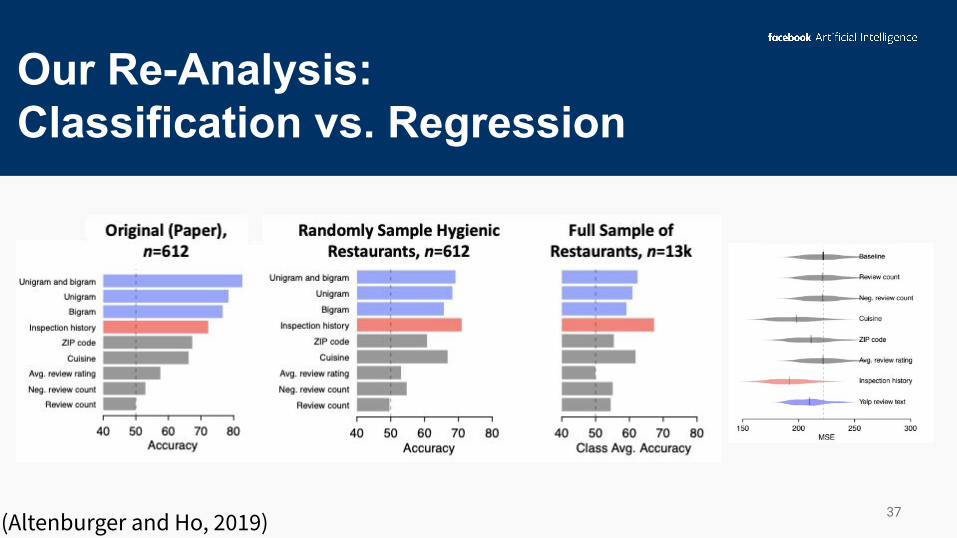
37(Altenburger and Ho, 2019)
Our Re-Analysis: Classification vs. Regression
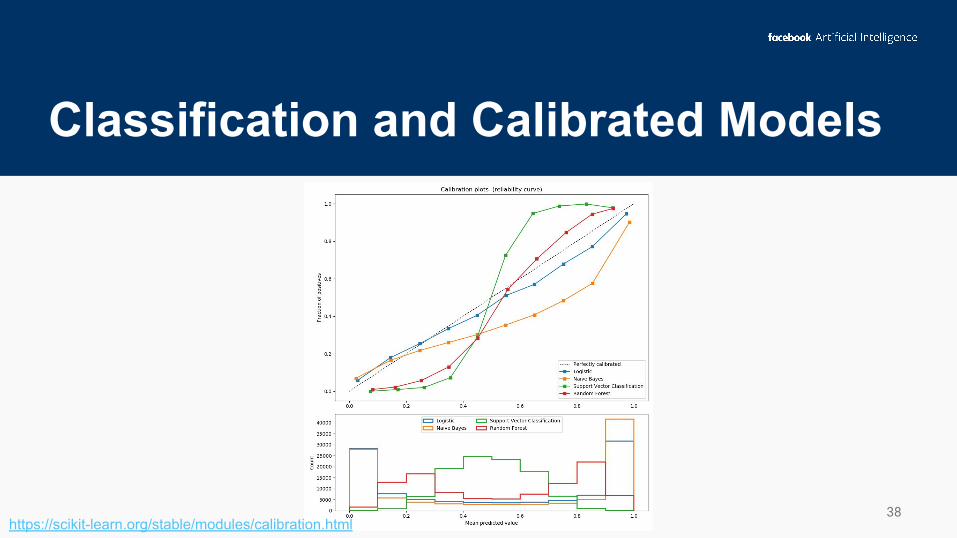
Classification and Calibrated Models
38https://scikit-learn.org/stable/modules/calibration.html

Model Evaluation Statistics: Accuracy, AUC, Recall, Precision,...
39
Classification RegressionActual
Pred
icte
d
+ -
-
+ TP FP
FN TN
● Mean-squared error● Visually analyze errors● Partial Dependence Plots

What are we comparing against? The importance of Baselines
● Random guessing?● Current Model in Production?● Useful to compare predictive performance with
current and proposed model.
40
Data Wrangling Best Practices
41
1. Clearly define your population and sample2. Understand the representativeness of your sample3. Cross-validation can go wrong in many ways; understand the
relevant problem and prediction task that will be done in practice
Data Wrangling Best Practices
42
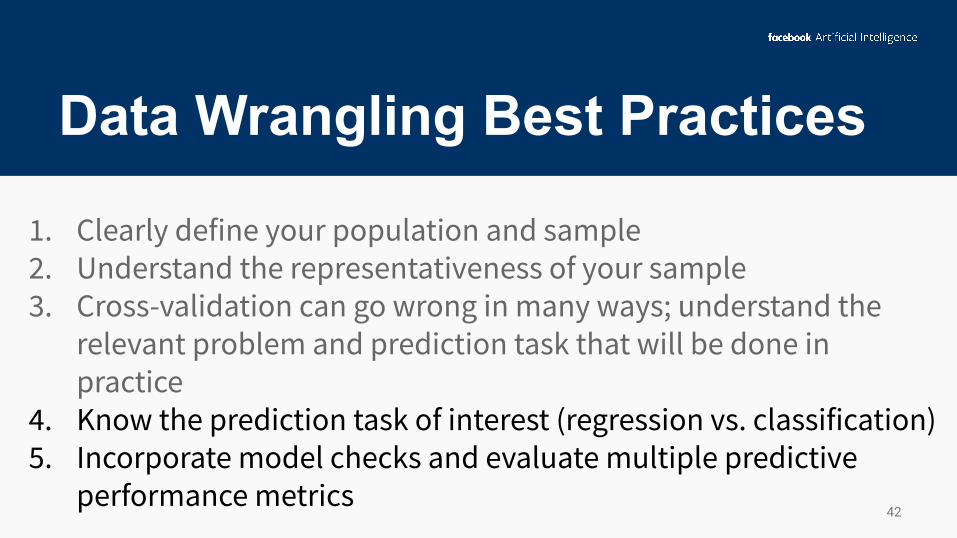
1. Clearly define your population and sample2. Understand the representativeness of your sample3. Cross-validation can go wrong in many ways; understand the
relevant problem and prediction task that will be done in practice
4. Know the prediction task of interest (regression vs. classification)5. Incorporate model checks and evaluate multiple predictive
performance metrics

The Data Wrangling Process
population sample
train
test
Learn Model
Evaluate Model
43
cross-validation
Step 3. What prediction task (classification vs. regression) do we care about? What is the meaningful evaluation criteria?

The Data Wrangling Process
population sample
train
test
Learn Model
Evaluate Model
44
cross-validation
Step 4. How do we create a reproducible pipeline?
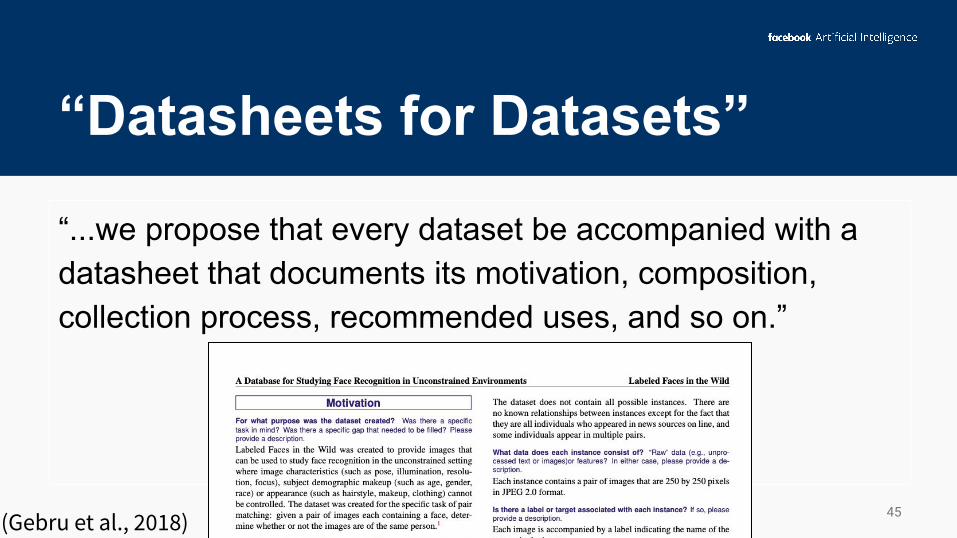
“Datasheets for Datasets”
“...we propose that every dataset be accompanied with a datasheet that documents its motivation, composition, collection process, recommended uses, and so on.”
45(Gebru et al., 2018)

A Step-by-Step Wrangling Example
46
Data Cleaning for Deep Learning(...and when you should use Deep Learning
instead of Machine Learning)

47https://blogs.sas.com/content/subconsciousmusings/files/2017/04/machine-learning-cheet-sheet.png

Data Preparation
48
1Cle
an
Scrub a dub dub
2Tra
nsform
Get your d
ata in th
e right fo
rmat
3Pre-p
rocess
Algorithm-sp
ecific d
ata preparation

Missing Data Mechanisms
49
● Missing Completely at Random: likelihood of any data observation to be missing is random
● Missing at Random: likelihood of any data observation to be missing depends on observed data features
● Missing Not at Random: likelihood of any data observation to be missing depends on unobserved outcome
(Little and Rubin, 2019)

Clean: Missing Data
50
Person Age Job
Jay 42 Waiter
Susan 65
Paco 30 Computer Scientist
Max Student

Missing Data: Removal
51
- Easy, but lose information
Person Age Job
Jay 42 Waiter
Susan 65
Paco 30 Computer Scientist
Max Student

Missing Data: Imputation
52
- Numerical Data: mean, mode, most frequent, zero, constant- Categorical Data: hot-deck imputation, k-Nearest Neighbors, deep-learned
embeddings
Person Age Job
Jay 42 Waiter
Susan 65 Waiter (hot-deck)
Paco 30 Computer Scientist
Max 45.6 (mean), 42 (mode) Student

Transform
- Image:- Color conversion
- Text:- Index: (Apple, Orange, Pear) -> (0, 1, 2)- Bag of Words and TF-IDF- Embedding
53

Pre-Process
54Image from http://cs231n.github.io/neural-networks-2/

Case Study: Depth Estimation
55Image from Wikipedia: https://upload.wikimedia.org/wikipedia/commons/6/67/Xbox-360-Kinect-Standalone.png
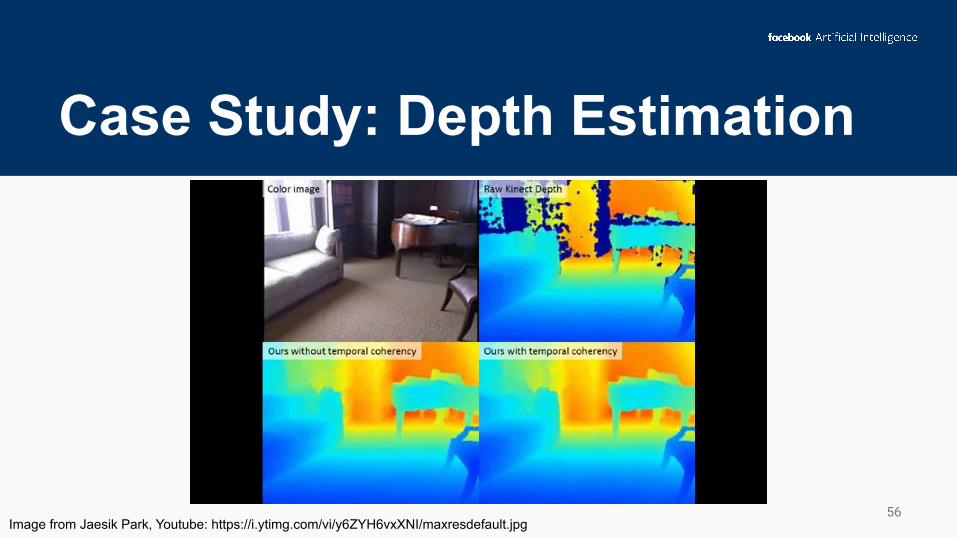
Case Study: Depth Estimation
56Image from Jaesik Park, Youtube: https://i.ytimg.com/vi/y6ZYH6vxXNI/maxresdefault.jpg
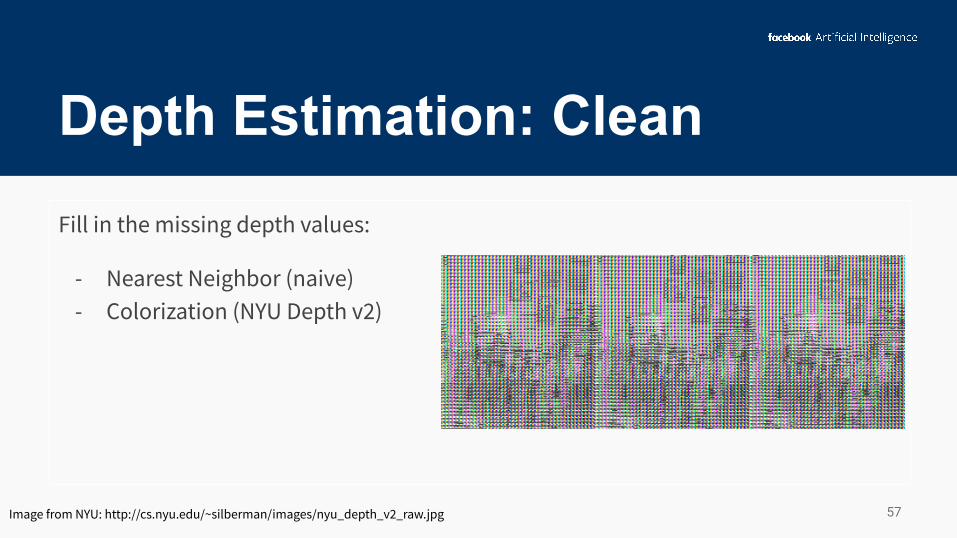
Depth Estimation: Clean
57
Fill in the missing depth values:
- Nearest Neighbor (naive)- Colorization (NYU Depth v2)
Image from NYU: http://cs.nyu.edu/~silberman/images/nyu_depth_v2_raw.jpg

Depth Estimation: Clean
58
No more holes!
Image from NYU: http://cs.nyu.edu/~silberman/images/nyu_depth_v2_raw.jpg

Depth Estimation: Transform
59Learning Rich Features from RGB-D Images for Object Detection and Segmentation. Gupta et al.
1-channel depth map → 3-channels:
- Horizontal disparity- Height above ground- Angle with gravity

Depth Estimation: Transform
60https://d3i71xaburhd42.cloudfront.net/8a9c4f1b58258afa2016b0eca0b3bfd2dc2ba3d8/1-Figure1-1.png

Depth Estimation: Preprocessing
61Learning Depth from Monocular Videos using Direct Methods, Wang et al. 2017
Inverse depth helps:
- Improve numerical stability
- Gaussian error distribution

Testing for bias on Portal
62

Large Literature on Bias in Machine Learning
63
● Anti-classification: “protected attributes--like race, gender, and their proxies--are not explicitly used”
● Classification parity: “common measures of predictive performances...are equal across groups defined by protected attributes”
● Calibration: “conditional on risk estimates, outcomes are independent of protected attributes”
(Corbett-Davies and Goel, 2018)

Testing for bias on Portal
64

Testing for bias on Portal
65
- Skin-tone- Lighting- People location XYZ- Many more...
Image from https://i.ytimg.com/vi/KYNDzlcQMWA/maxresdefault.jpg

ReferencesAboumatar, Hanan, and Robert A. Wise. "Notice of Retraction. Aboumatar et al. Effect of a Program Combining Transitional Care and Long-term Self-management Support on Outcomes of Hospitalized Patients With Chronic Obstructive Pulmonary Disease: A Randomized Clinical Trial. JAMA. 2018; 320 (22): 2335-2343." JAMA 322.14 (2019): 1417-1418.
Camerer, Colin F., et al. "Evaluating the replicability of social science experiments in Nature and Science between 2010 and 2015." Nature Human Behaviour 2.9 (2018): 637-644.
Corbett-Davies, Sam, and Sharad Goel. "The measure and mismeasure of fairness: A critical review of fair machine learning." arXiv preprint arXiv:1808.00023 (2018).
Altenburger, Kristen M., and Daniel E. Ho. "When Algorithms Import Private Bias into Public Enforcement: The Promise and Limitations of Statistical De-biasing Solutions." Journal of Institutional and Theoretical Economics (2018).
Altenburger, Kristen M., and Daniel E. Ho. "Is Yelp Actually Cleaning Up the Restaurant Industry? A Re-Analysis on the Relative Usefulness of Consumer Reviews." The World Wide Web Conference. 2019.
66
References (cont’d.)Bengio, Yoshua, Aaron Courville, and Pascal Vincent. "Representation learning: A review and new perspectives." IEEE Transactions on Pattern Analysis and Machine Intelligence 35.8 (2013): 1798-1828.
Bergstra, James, and Yoshua Bengio. "Random search for hyper-parameter optimization." Journal of machine learning research 13.Feb (2012): 281-305.
Gebru, Timnit, et al. "Datasheets for datasets." arXiv preprint arXiv:1803.09010 (2018).
Friedman, Jerome, Trevor Hastie, and Robert Tibshirani. The Elements of Statistical Learning. Vol. 1. No. 10. New York: Springer Series in Statistics, 2001.
Kang, Jun Seok, et al. "Where not to eat? Improving public policy by predicting hygiene inspections using online reviews." Proceedings of the 2013 Conference on Empirical Methods in Natural Language Processing. 2013.
Little, Roderick JA, and Donald B. Rubin. Statistical analysis with missing data. Vol. 793. John Wiley & Sons, 2019.
67


![Wrangling the [Biblio] Module](https://img.pdfslide.us/doc/110x75/568162e7550346895dd36959/wrangling-the-biblio-module.jpg)