Embed Size (px)
Citation preview

Data Warehousing and OLAP(Under construction)
Introduction to Data Mining with Case StudiesAuthor: G. K. Gupta
Prentice Hall India, 2006.

December 2008 ©GKGupta 2
Data Warehousing and OLAP
• What is a data warehouse?
• A multi-dimensional data model
• Data warehouse architecture
• Data warehouse implementation

December 2008 ©GKGupta 3
What is a Data Warehouse?
Data warehousing is a process, not a product, for assembling and managing data from various sources for the purpose of gaining a single detailed view of part or all of a business. The single view is the data warehouse (DW) which provides the enterprise’s information environment that is separate from OLTP. DW is important since information is a powerful asset for every enterprise.

December 2008 ©GKGupta 4
What is a Data Warehouse?
The information in a DW must be complete, timely, accurate and understandable for decision making. This requires data to be cleaned, filtered, and transformed.
On-line Analytical Processing (OLAP) is a technique used for providing management decision support using historical and summarized
data that is consolidated in the data warehouse.

December 2008 ©GKGupta 5
What is a Data Warehouse?
Questions that we will deal with:• Where does the data in the DW come from?
• How does it get into the DW?
• What data is in the DW?
• How is the DW data structured?

December 2008 ©GKGupta 6
Data Warehousing
A DW integrates information from several sources into a global schema and is stored separately from the operational data. It does not represent a snapshot of the operational database.
Moving data from various sources to a DW is a very difficult process involving data cleansing and data integration. Sometime called ETL (Extract, Transform and Load).
Most database systems are error-prone. A DW should have as few errors as possible.

December 2008 ©GKGupta 7
Data Warehouse
Most OLTP database systems continue to grow but a data warehouse grows at a slower rate. However, the volume of data in the DW can be very high.
User updates to a data warehouse are usually forbidden, updates must come from the underlying databases to maintain consistency.

December 2008 ©GKGupta 8
Data Warehousing
To speed up OLAP queries, a warehouse contains summarized and consolidated information representing materialized aggregate views of the enterprise data from a number of databases.
DW and OLAP are complementary. A warehouse stores data while OLAP derives strategic information from it.
DW may be used to provide an enterprise memory which operational data does not provide.
Question: Why does an OLTP system not provide enterprise memory?

December 2008 ©GKGupta 9
Data Warehousing
Warehouse usually contains information over time helping analysis of trends.
A DW is repackaging information to support business decision making. The aim in DW may be to generate new revenue by selling the repackaged information.
Question: How can one sell repackaged information?

December 2008 ©GKGupta 10
A definition
According to W. H. Inmon: A data warehouse is a subject-oriented, integrated, time-variant, and non-volatile collection of data in support of management’s decision making process.
Important to note subject-oriented, integrated, and time-variant properties of a data warehouse.

December 2008 ©GKGupta 11
Subject-oriented
• A DW is organized around major subjects, such as student, degree, country.
• Focusing on the modeling and analysis of data for decision makers, not on daily operations.
• A DW provides a simple and concise view around particular subject issues by excluding data that are not useful in the decision support process.
Question: Think of a OLTP database system. What are the major subjects?

December 2008 ©GKGupta 12
Integrated
• A DW may be constructed by integrating information from multiple data sources e.g. multiple OLTP databases.
• Data cleaning and data integration techniques are applied to ensure consistency in naming conventions, encoding structures, attribute measures, etc. among different data sources.
December 2008 ©GKGupta 13
Time Variant• A DW usually has long time horizon, significantly
longer than that of operational systems.– Operational database: current value data.– DW data: provide information from a historical
perspective (e.g. past 5-10 years)• Every key structure in the DW contains an element
of time, explicitly or implicitly• Operational data may or may not contain time
element.

December 2008 ©GKGupta 14
Non-volatile
• A physically separate store of data transformed from the operational environment.
• No update of data • Does not require transaction processing,
recovery, and concurrency control mechanisms• Requires only two operations in data accessing:
initial loading of data and access of data.
December 2008 ©GKGupta 15
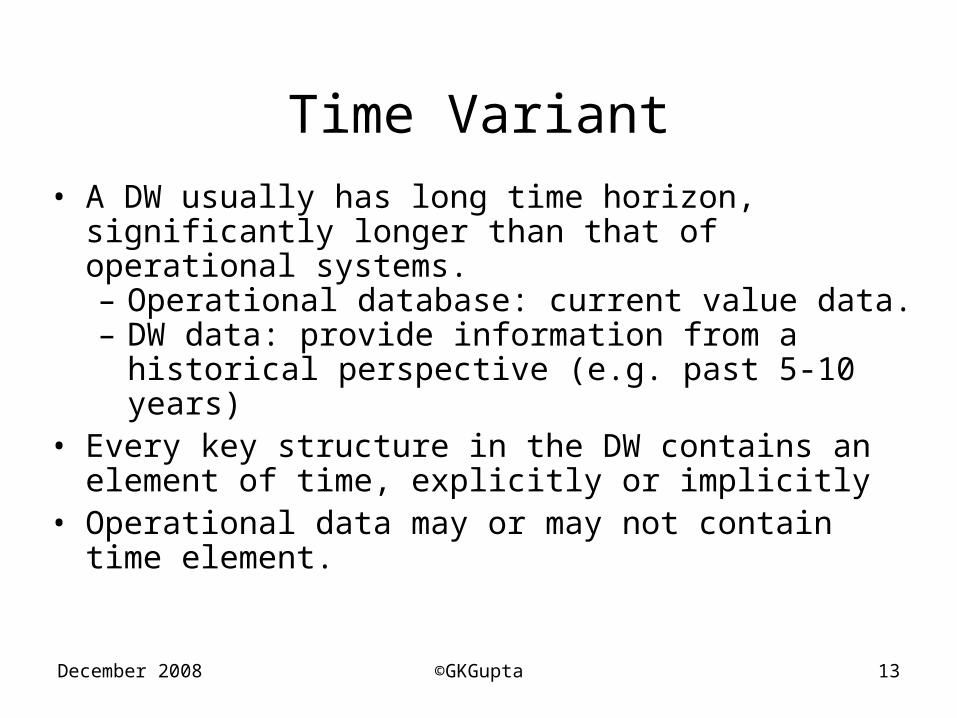
Why Separate Data Warehouse?
• High performance for both systems– DBMS— tuned for OLTP– Warehouse—tuned for OLAP.
• Different functions and different data:– missing data: Decision support requires
historical data which operational DBs do not typically maintain
– data consolidation: DS requires consolidation (aggregation, summarization) of data from heterogeneous sources
– data quality: different sources typically use inconsistent data representations, codes and formats

December 2008 ©GKGupta 16
Data Warehouse Process
• Define the architecture, do capacity planning, select hardware and software
• Design the warehouse schema and the views• Design the physical data structures• Design data extraction, cleaning,
transformation, load and refresh software• Populate the repository with data and software• Design and implement end-user application
(Refer to Chaudhuri and Dayal)

December 2008 ©GKGupta 17
Data Cubes
• A data warehouse is based on a multidimensional data model which views data in the form of a data cube
• A data cube allows data to be modeled and viewed in multiple dimensions– Dimension tables, such as item (item_name,
brand, type), or time(day, week, month, quarter, year)
– Fact table contains measures (such as dollars_sold) and keys to each of the related dimension tables

December 2008 ©GKGupta 18
Conceptual Modeling
• Modeling data warehouses: dimensions & measures– Star schema: A fact table in the middle
connected to a set of dimension tables – Snowflake schema: A refinement of
star schema where some dimensional hierarchy is normalized into a set of smaller dimension tables, forming a shape similar to snowflake

December 2008 ©GKGupta 19
Defining a Star Schema in DMQL
define cube sales_star [time, item, branch, location]:
dollars_sold = sum(sales_in_dollars), avg_sales = avg(sales_in_dollars), units_sold = count(*)
define dimension time as (time_key, day, day_of_week, month, quarter, year)
define dimension item as (item_key, item_name, brand, type, supplier_type)
define dimension branch as (branch_key, branch_name, branch_type)
define dimension location as (location_key, street, city, province_or_state, country)

December 2008 ©GKGupta 20
Measures: Three Categories
• distributive: if the result derived by applying the function to n aggregate values is the same as that derived by applying the function on all the data without partitioning.
e.g., count(), sum(), min(), max().• algebraic: if it can be computed by an algebraic
function with M arguments (where M is a bounded integer), each of which is obtained by applying a distributive aggregate function.

December 2008 ©GKGupta 21
Measures: Three Categories
• holistic: if there is no constant bound on the storage size needed to describe a subaggregate.
e.g., median(), mode(), rank().

December 2008 ©GKGupta 22
Data Warehouse Design
The E-R Model approach which consists of entities and relationships is not suitable for designing a schema for a warehouse.
What is the nature of data in data warehouse? Essentially data warehouses are based on multidimensional data model which views data as a data cube.

December 2008 ©GKGupta 23
An Example
Consider the following database:
Student(sid, name1, dob, country, degree,
startsem, address1, telephone, address2, email,
scholarship, ..)
Enrolment(sid, subject-id, mark, tutegroup,
tutor,..)
Subject(sub-id, name, school-id, whenstarted,
lecturer,..)
School(name, id, ..)
Not all of this data is needed for decision
making. Let us extract some data from this
database.
December 2008 ©GKGupta 24
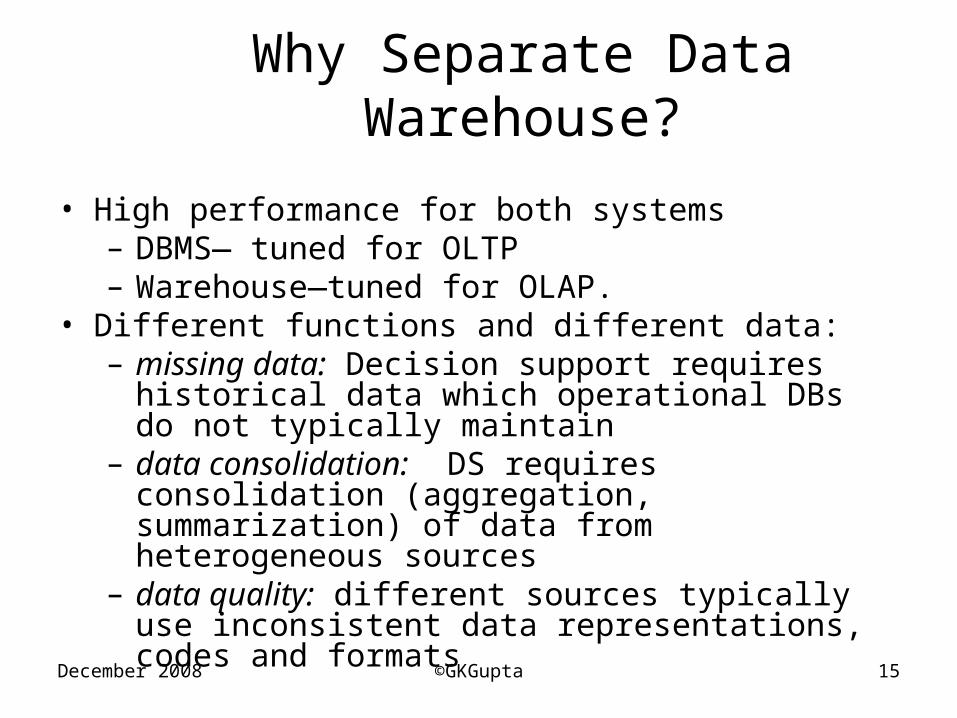
Data Cube
yob, country, degree, startsem, nsubjects,
scholarship1965, Thailand, MIT, 991, 5, 25%1970, Canada, BIT, 992, 4, 01967, Australia, LLB, 993, 3, 30%1966, Australia, LLB, 983, 4, 40%1972, Australia, Bcom, 973, 5, 10%1972, India, BIT/Bcom, 991, 5, 10%1982, Sweden, MSc(IT), 991, 3, 10%
Is this information useful for decision making? Not really!
December 2008 ©GKGupta 25
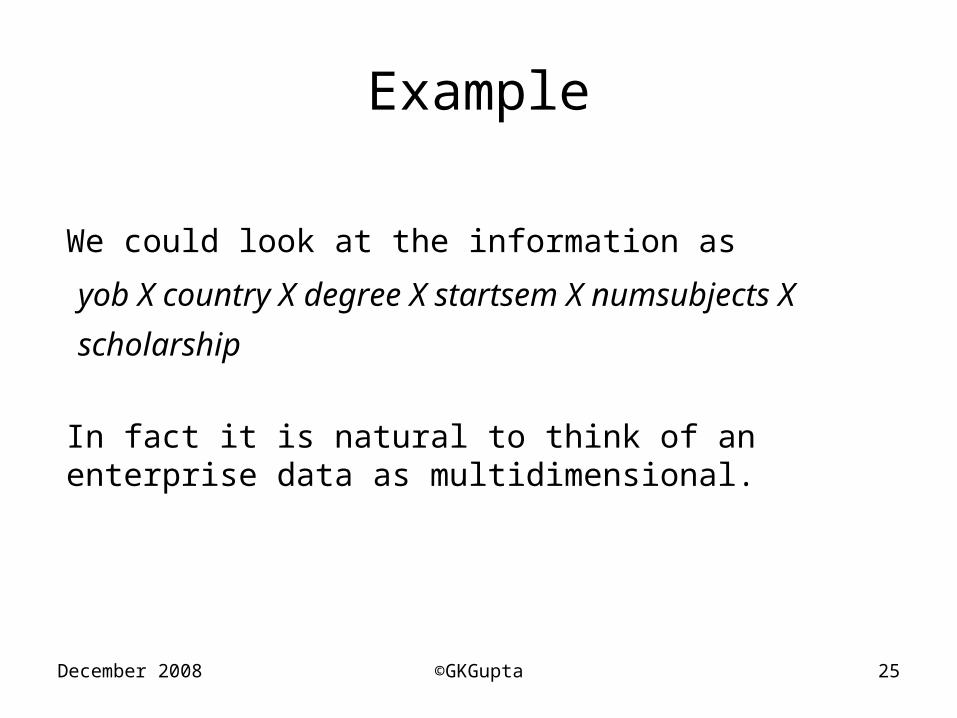
Example
We could look at the information as
yob X country X degree X startsem X
numsubjects X scholarship
In fact it is natural to think of an enterprise data as multidimensional.

December 2008 ©GKGupta 26
Example
The university management may be interested in retrieving information like:
• How many students are doing BIT? How many students from Thailand? How many students started in 1998? (queries involving only one variable)
• How many students doing BIT are from Thailand? How many MIT students started in 981? How many students from Thailand started in 993? (queries involving two variables)

December 2008 ©GKGupta 27
Example
•How many students doing MIT from Thailand started in 981? (query involving three variables)
Special type of database systems, called data cube systems, are often used for answering such queries.

December 2008 ©GKGupta 28
Data Cube
The example queries discussed earlier may be represented by a three-dimensional data cube with each edge representing one of the variables viz. startsem, country, and degree.
A point inside the cube is an intersection of the coordinates defined by the edges of the cube. The coordinates of the point define the meaning of the data at that point.

December 2008 ©GKGupta 29
Data Cube
Let us look at a simple two-dimensional situation:
country X degree
For decision making this may be useful information. If we had a 2-dimensional matrix then we could find out the number of students for any country (x) and any degree (y).

December 2008 ©GKGupta 30
Data Cube
But in the two-dimensional situation, we don’t just want to find out the number of students for any country (x) and any degree (y). We may have many other queries e.g.
1. How many students are doing MIT?
2. How many students from Thailand?
3. How many Asian students doing Law degrees?
Thus there is kind of hierarchy that we wish to use, for example, the world, the continents, the regions, the countries etc. In degrees, we may want a hierarchy of university, Schools, UG and PG, individual degrees.

December 2008 ©GKGupta 31
Data Cube
Consider a slightly more complex situation in which we have three dimensions:
country X degree X startsem
for any country (x), any degree (y) and any start semester (z).
We may now look at this information as a 3-dimensional cube as shown on the following slide.

December 2008 ©GKGupta 32
Data Cube(based on a slide from book by J. Han and M. Kamber)
• Number of students as a function of country, degree and semester
cou
ntr
yde
gree
semester
Dimensions: country, degree, semHierarchical summarization paths
continent school Year
region ug/pg
country degree semester

December 2008 ©GKGupta 33
A Sample Data Cube(based on a slide from book by J. Han and M. Kamber)
Total LLB enrolmentsFrom U.S.A.semester
degr
ee
Cou
ntr
y
Sum
sum LLB
MITBCom
991 992 993 001
U.S.A
Norway
Australia
sum

December 2008 ©GKGupta 34
Data Cube
Each edge of the cube is called a dimension. A user normally has a number of different dimensions from which the given data may be analyzed. A user therefore has a multidimensional conceptual view of the data which is represented by the cube.
The points inside a cube provide aggregations. For example, a point may provide the number of students from Malaysia admitted to BCom in year 1998.

December 2008 ©GKGupta 35
Multidimensional View
A particular user will have one multidimensional view of the database while another user in the same enterprise may have another view. Therefore many different multidimensional views of the same database are possible and the same data may be
consolidated in many different ways.
December 2008 ©GKGupta 36
Multidimensional data model
The cube is not always three-dimensional since often an enterprise would have many more, perhaps eight or even ten, dimensions of interest. Each dimension may be associated with a table that describes the dimension. For example, a dimension table for country would contain the country names and could contain other information e.g. category. Other dimensions like time do not naturally have such table of information.

December 2008 ©GKGupta 37
Data Cube
A number of operations may be applied to data cubes. The common ones are:
- roll-up (increasing the level of abstraction)- drill-down (increasing detail)- slice and dice (selection and projection)- pivot (re-orienting the view)

December 2008 ©GKGupta 38
Data Cube Operations
• Roll-up (less detail) - when we wish further abstraction (i.e. less detail). This operation performs further aggregation on the data, for example, from single degree programs to Schools, single countries to Continents or from three dimensions to two dimensions.
• Drill-down (increasing detail) - reverse of roll up, when we wish to partition more finely or want to focus on some particular values of certain dimensions. Drill-down adds more detail to the data, it may involve adding another dimension.

December 2008 ©GKGupta 39
Data Cube Operations
• Slice and dice (selection and projection) - the slice operation performs a selection on one dimension of the cube (e.g. degree = “MIT”). The dice operation performs a selection on two or more dimensions (e.g. degree = “BIT” and country = “Australia” or “India”)
• Pivot (re-orienting the view) - an alternate presentation of the data e.g. rotating the axes in a 3-D cube.

December 2008 ©GKGupta 40
Benefits of Multidimensional Analysis
• Small high-level database with pre-computed aggregates is created for efficient high-level queries
• Multiple-level views• Selection by slicing and dicing
However multidimensional analysis does not provide data mining.

December 2008 ©GKGupta 41
OLAP Server Architectures
Relational OLAP (ROLAP) – Use relational or extended-relational DBMS to
store and manage warehouse data and OLAP middle ware to support missing pieces
– Include optimization of DBMS backend, implementation of aggregation navigation logic, and additional tools and services
– greater scalability

December 2008 ©GKGupta 42
OLAP Server Architectures
• Multidimensional OLAP (MOLAP) – Array-based multidimensional storage engine
(sparse matrix techniques)– fast indexing to pre-computed summarized data
• Hybrid OLAP (HOLAP)– User flexibility, e.g., low level: relational, high-
level: array• Specialized SQL servers

December 2008 ©GKGupta 43
Data Warehouse Design
One approach is the star schema to represent the multidimensional data model. The schema in this model consists of a large single fact table containing the bulk of the data, with no redundancy and a set of smaller tables called dimension table, one for each dimension.
Other models have been used. These include snowflakes model and fact constellations model.

December 2008 ©GKGupta 44
Example of Star Schema (based on a slide from book by J. Han and M. Kamber)
time_keydayday_of_the_weekmonthquarteryear
time
location_keystreetcityprovince_or_streetcountry
location
Sales Fact Table
time_key
item_key
branch_key
location_key
units_sold
dollars_sold
avg_sales
Measures
item_keyitem_namebrandtypesupplier_type
item
branch_keybranch_namebranch_type
branch

December 2008 ©GKGupta 45
ETL
• Extraction - data relevant to the tasks are selected and retrieved from a variety of sources.
• Transformation - data is consolidated by performing summary or aggregations
• Cleansing - since data comes from a number of sources, errors and anomalies are common. There is a need to remove anomalies, remove errors, handling missing and irrelevant data. Some tools are available for doing this.
December 2008 ©GKGupta 46
Data Cleaning
Data Cleaning overcomes problems like the following:
• Inconsistent field lengths of same items• Inconsistent values for same items• Inconsistent interpretation of same terms• Missing entries• Violation of integrity constraints
Data cleaning can be a very demanding task
December 2008 ©GKGupta 47
Data Warehouse Process
• Integration - combining data from many perhaps heterogeneous sources. This is a non-trivial task since different sources will use different formats, field lengths, codes, descriptions, for the same data items.
• Loading - before loading additional processing may be needed e.g. checking integrity constraints, building derived tables, indices, access paths

December 2008 ©GKGupta 48
Data Warehouse Process
• Refresh - warehouse data needs to be periodically updated as the operational data changes. There are several different ways of updating a data warehouse: • The data warehouse could be periodically
reconstructed from the base sources (perhaps overnight, once a week)
• The data warehouse could be updated periodically, for example each week or even each month.
The updates need to be logically correct since the warehouse data is derived data.

December 2008 ©GKGupta 49
Why Separate Data Warehouse?
• High performance for both systems– DBMS— tuned for OLTP– Warehouse—tuned for OLAP
• Different functions and different data:– missing data: Decision support requires
historical data which operational DBs do not typically maintain
– data consolidation: Decision support requires consolidation (aggregation, summarization) of data from many sources
– data quality: different sources typically use inconsistent data representations, codes and formats which have to be reconciled

December 2008 ©GKGupta 50
OLAP
Codd defines On-line Analytical Processing or OLAP as the dynamic enterprise analysis required to create, manipulate, animate, and synthesize information from exegetical, contemplative, and formulaic data analysis models.
OLAP generally involves highly complex queries involving large amounts of data that use one or more aggregates. OLAP deals only with historical data accurate at a given point in time.

December 2008 ©GKGupta 51
OLAP Characteristics
We discuss the following OLAP characteristics listed by Codd:
• Dynamic data analysis - involving historical data of multiple dimensions manipulated in many different ways with the aim of studying changes occurring in the enterprise
• Common enterprise data - OLAP uses the enterprise data but in a very different way to discover why some particular situations occurred
• Synergistic implementation - data synthesis, analysis, and consolidation

December 2008 ©GKGupta 52
OLAP Characteristics
• Four enterprise data model• Categorical - comparison of historical values• Exegetical - discovering reasons for what
categorical model found• Contemplative - “what if ” analysis of the data• Formulaic - how to reach a desired goal

December 2008 ©GKGupta 53
Codd’s OLAP Evaluation Rules
Codd in his 1993 paper lists the following 12 rules for evaluating OLAP products:
• Multidimensional conceptual view - to make a variety of manipulations (e.g. slice and dice) relatively easy
• Transparency - user should know what data is being used and where from
• Accessibility - able to use data in enterprise database as well as legacy systems

December 2008 ©GKGupta 54
Codd’s OLAP Rules
• Consistent reporting performance - consistent reporting performance as the number of dimensions grows
• Client-server architecture - OLAP often uses mainframe data but users want access from desktop
• Generic dimensionality - different dimensions should not be treated differently
• Dynamic sparse matrix handling - always a lot of missing data, OLAP should be able to adjust to that
• Multi-user support - obviously required
December 2008 ©GKGupta 55
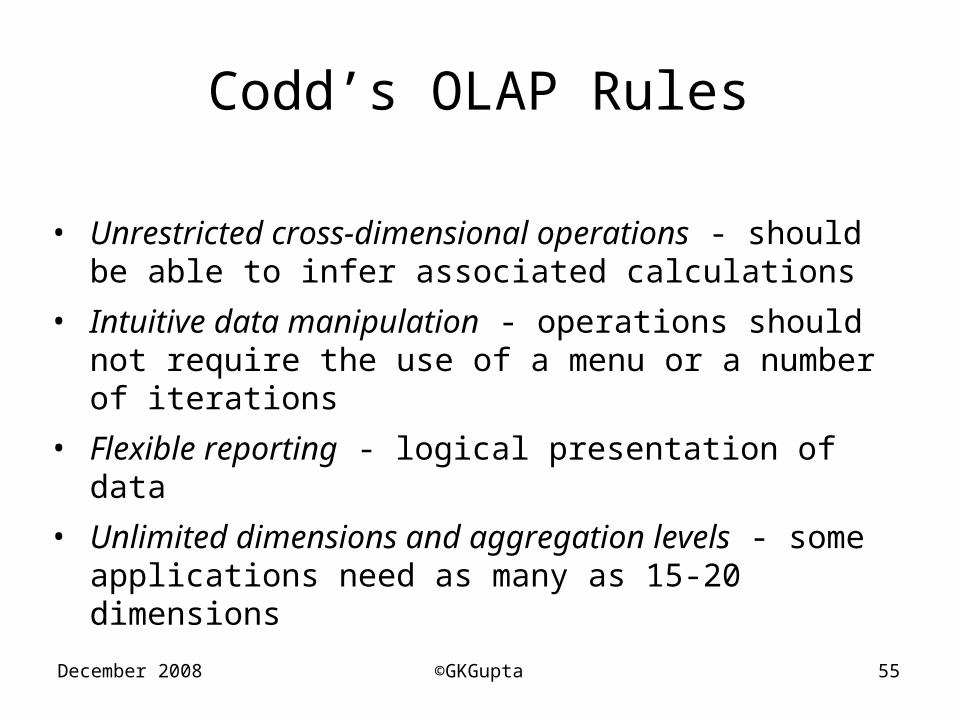
Codd’s OLAP Rules
• Unrestricted cross-dimensional operations - should be able to infer associated calculations
• Intuitive data manipulation - operations should not require the use of a menu or a number of iterations
• Flexible reporting - logical presentation of data
• Unlimited dimensions and aggregation levels - some applications need as many as 15-20 dimensions

December 2008 ©GKGupta 56
Summary
• Data warehouse
– A subject-oriented, integrated, time-variant, and nonvolatile collection of data in support of management’s decision-making process
• A multi-dimensional model of a data warehouse– Star schema, snowflake schema, fact
constellations
– A data cube consists of dimensions & measures
• OLAP operations: drilling, rolling, slicing, dicing and pivoting

December 2008 ©GKGupta 57
Summary
• OLAP servers: ROLAP, MOLAP, HOLAP• Efficient computation of data cubes
– Partial vs. full vs. no materialization