Embed Size (px)
Citation preview
D
DATA WAREHOUSE
INTRODUCTION
For a fewdecades, the role played by database technology incompanies and enterprises has only been that of storingoperational data, that is data generated by daily, routineoperations carried out within business processes (such asselling, purchasing, and billing). On the other hand,managers need to access quickly and reliably the strategicinformation that supports decision making. Such informa-tion is extractedmainly from the vast amount of operationaldata stored in corporate databases, through a complexselection and summarization process.
Very quickly, the exponential growth in data volumesmade computers the only suitable support for thedecisionalprocess run by managers. Thus, starting from the late1980s, the role of databases began to change, which ledto the rise of decision support systems that were meant asthe suite of tools and techniques capable of extractingrelevant information from a set of electronically recordeddata. Among decision support systems, data warehousingsystems are probably those that captured the mostattention from both the industrial and the academic world.
A typical decision-making scenario is that of a largeenterprise, with several branches, whose managers wishtoquantifyandevaluate the contributiongiven fromeachofthem to the global commercial return of the enterprise.Because elemental commercial data are stored in the enter-prise database, the traditional approach taken by themanager consists in asking the database administratorsto write an ad hoc query that can aggregate properly theavailabledata to produce the result.Unfortunately,writingsuch a query is commonly very difficult, because different,heterogeneous data sources will be involved. In addition,the querywill probably take a very long time to be executed,because itwill involve a huge volume of data, and itwill runtogether with the application queries that are part of theoperational workload of the enterprise. Eventually, themanager will get on his desk a report in the form of a eithersummary table, a diagram, or a spreadsheet, on which hewill base his decision.
This approach leads to a useless waste of time andresources, and often it produces poor results. By the way,mixing theseadhoc, analytical querieswith the operationalones required by the daily routine causes the system to slowdown, which makes all users unhappy. Thus, the core ideaof data warehousing is to separate analytical queries,which are commonly called OLAP (On-Line AnalyticalProcessing) queries, from the operational ones, calledOLTP (On-Line Transactional Processing) queries, bybuilding a new information repository that integrates theelemental data coming from different sources, organizesthem into an appropriate structure, andmakes them avail-able for analyses and evaluations aimed at planning anddecision making.
Among the areas where data warehousing technologiesare employed successfully, we mention but a few: trade,manufacturing, financial services, telecommunications,and health care. On the other hand, the applications ofdata warehousing are not restricted to enterprises: Theyalso range from epidemiology to demography, from naturalsciences to didactics. The common trait for all these fields isthe need for tools that enable the user to obtain summaryinformation easily and quickly out of a vast amount of data,to use it for studying a phenomenon and discovering sig-nificant trends and correlations—in short, for acquiringuseful knowledge for decision support.
BASIC DEFINITIONS
A data warehousing system can be defined as a collection ofmethods, techniques, and tools that support the so-calledknowledge worker (one who works primarily with informa-tion or develops and uses knowledge in the workplace: forinstance, a corporatemanager or a data analyst) in decisionmaking by transforming data into information. The mainfeatures of data warehousing can be summarized as fol-lows:
� Easy access to nonskilled computer users.
� Data integration based on a model of the enterprise.
� Flexible querying capabilities to take advantage of theinformation assets.
� Synthesis, to enable targeted and effective analysis.
� Multidimensional representation to give the user anintuitive and handy view of information.
� Correctness, completeness, and freshness of informa-tion.
At the core of this process, the data warehouse is arepository that responds to the above requirements.According to the classic definition by Bill Inmon (seeFurther Reading), a data warehouse is a collection ofdata that exhibits the following characteristics:
1. Subject-oriented,whichmeans that all the data itemsrelated to the same business object are connected.
2. Time-variant, which means that the history of busi-ness is tracked and recorded to enable temporalreports.
3. Nonvolatile, which means that data are read-onlyand never updated or deleted.
4. Integrated, which means that data from differententerprise applications are collected and made con-sistent.
Although operational data commonly span a limitedtime interval, because most business transactions onlyinvolve recent data, the data warehouse must support
1
analyses that cover some years. Thus, the data warehouseis refreshed periodically starting from operational data.According to a common metaphor, we can imagine thatphotographs of operational data are periodically taken; thesequence of photos is then stored in the data warehouse,wherea sort ofmovie is generated that depicts thehistory ofbusiness up to the current time.
Because in principle data are never deleted, andrefreshes are made when the system is offline, a datawarehouse can be considered basically as a read-only data-base. This feature, together with the importance given toachieving good querying performances, has two main con-sequences. First, the database management systems(DBMSs) used to manage the data warehouse do notneed sophisticated techniques for supporting transactions.Second, thedesign techniquesused for datawarehousesarecompletely different from those adopted for operationaldatabases.
As mentioned, another relevant difference betweenoperational databases and data warehouses is related tothe types of queries supported. OLTP queries on opera-tional databases typically read and write a relatively smallnumber of records from some tables related by simplerelationships (e.g., search for customers’ data to insertnew orders). Conversely, OLAP queries on data ware-houses commonly read a huge number of records to com-pute a few pices of summary information. Mostimportantly, although the OLTP workload is ‘‘frozen’’within applications and only occasionally ad hoc queriesare formulated, the OLAP workload is intrinsically inter-active and dynamic.
ARCHITECTURES
To preserve the separation between transactional andanalytical processing, most data warehousing architec-tures are based on at least two data levels: the data sourcesand the data warehouse.
Data sources are heterogeneous; they may be part ofthe corporate information system (operational databases,legacy systems, spreadsheets, flat files, etc.). or evenreside outside the company (Web databases, streams,etc.). These data are extracted, cleaned, completed, vali-dated, integrated into a single schema, and loaded into thedata warehouse by the so-called ETL (Extraction, Trans-formation, and Loading) tools.
The data warehouse is the centralized repository for theintegrated information. Here, different from the sources,data are stored in multidimensional form, and their struc-ture is optimized to guarantee good performance for OLAPqueries. In practice, most often, the data warehouse isreplaced physically by a set of data marts that includethe portion of information that is relevant to a specificarea of business, division of the enterprise, and categoryof users. Note the presence of a metadata repository thatcontains the ‘‘data about data,’’ for example, a description ofthe logical organization of datawithin the sources, the datawarehouse, and the data marts.
Finally, the information in the data warehouse isaccessed by users by means of different types of tools:
reporting tools, OLAP tools, data-mining tools, and what-if analysis tools.
Somearchitectures include anadditional level called thereconciled level or operational data-store. It materializesthe operational data obtained by extracting and cleaningsource data: Thus, it contains integrated, consistent, cor-rect, detailed, and current data. These reconciled data arethenused to feed the datawarehouse directly. Although thereconciled level introduces a significant redundancy, it alsobears some notable benefits. In fact, it defines a referencedatamodel for the whole company, and at the same time, itintroduces a clear separation between the issues related todata extraction, cleaning and integration and those relatedto data warehouse loading. Remarkably, in some cases, thereconciled level is also used to better accomplish someoperational tasks (such as producing daily reports thatcannot be prepared satisfactorily using the corporate appli-cations).
In the practice, these ingredients are blended differentlyto give origin to the five basic architectures commonlyrecognized in the literature:
� Independent data marts architecture
� Bus architecture
� Hub-and-spoke architecture
� Centralized data warehouse architecture
� Federated architecture
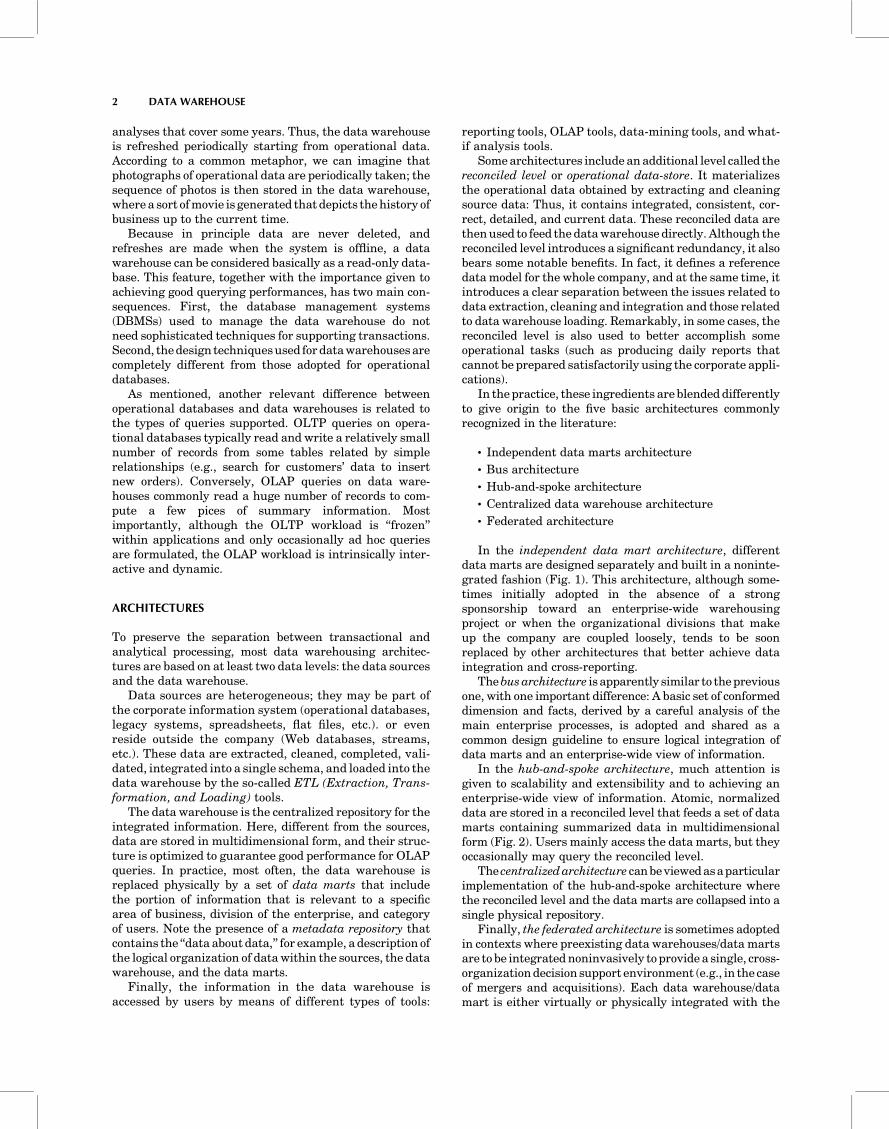
In the independent data mart architecture, differentdata marts are designed separately and built in a noninte-grated fashion (Fig. 1). This architecture, although some-times initially adopted in the absence of a strongsponsorship toward an enterprise-wide warehousingproject or when the organizational divisions that makeup the company are coupled loosely, tends to be soonreplaced by other architectures that better achieve dataintegration and cross-reporting.
Thebusarchitecture is apparently similar to thepreviousone, with one important difference: A basic set of conformeddimension and facts, derived by a careful analysis of themain enterprise processes, is adopted and shared as acommon design guideline to ensure logical integration ofdata marts and an enterprise-wide view of information.
In the hub-and-spoke architecture, much attention isgiven to scalability and extensibility and to achieving anenterprise-wide view of information. Atomic, normalizeddata are stored in a reconciled level that feeds a set of datamarts containing summarized data in multidimensionalform (Fig. 2). Users mainly access the data marts, but theyoccasionally may query the reconciled level.
The centralizedarchitecture canbeviewedasaparticularimplementation of the hub-and-spoke architecture wherethe reconciled level and the data marts are collapsed into asingle physical repository.
Finally, the federated architecture is sometimes adoptedin contexts where preexisting data warehouses/data martsare to be integratednoninvasively to provide a single, cross-organizationdecision support environment (e.g., in the caseof mergers and acquisitions). Each data warehouse/datamart is either virtually or physically integrated with the
2 DATA WAREHOUSE
others by leaning on a variety of advanced techniques suchas distributed querying, ontologies, and metadata inter-operability.
ACCESSING THE DATA WAREHOUSE
This section discusses how users can exploit informationstored in the data warehouse for decision making. In thefollowing subsection, after introducing the particularfeatures of the multidimensional model, we will surveythe two main approaches for analyzing information:reporting and OLAP.
The Multidimensional Model
The reasons why the multidimensional model is adopteduniversally as the paradigm for representing data in datawarehouses are its simplicity, its suitability for businessanalyses, and its intuitiveness for nonskilled computerusers, which are also caused by the widespread use ofspreadsheets as tools for individual productivity. Unfortu-nately, although some attempts have been made in theliterature to formalize the multidimensional model (e.g.,Ref. 1), none of them has emerged as a standard so far.
The multidimensional model originates from the obser-vation that the decisional process is ruled by the facts of thebusiness world, such as sales, shipments, bank transac-tions, and purchases. The occurrences of a fact correspondto events that occur dynamically: For example, every sale orshipment made is an event. For each fact, it is important toknow the values of a set of measures that quantitativelydescribe the events: the revenue of a sale, the quantityshipped, the amount of a bank transaction, and the dis-count on a purchase.
The events that happen in the enterprise world areobviously too many to be analyzed one by one. Thus, tomake them easily selectable and groupable, we imagine
arranging themwithin ann-dimensional spacewhose axes,called dimensions of analysis, define different perspectivesfor their identification. Dimensions commonly are discrete,alphanumeric attributes that determine the minimumgranularity for analyzing facts. For instance, the sales ina chain of stores can be represented within a three-dimen-sional spacewhose dimensions are the products, the stores,and the dates.
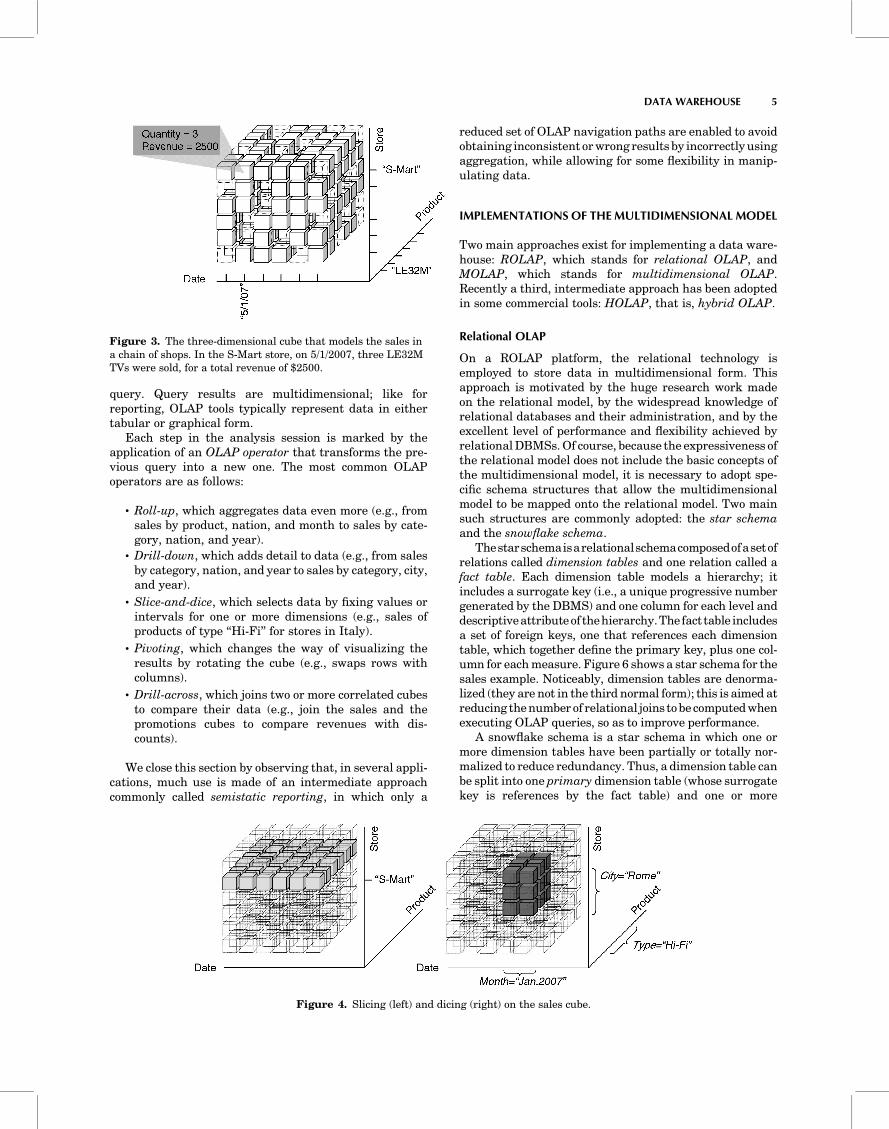
The concepts of dimension gave birth to the well-knowncube metaphor for representing multidimensional data.According to this metaphor, events correspond to cells ofa cube whose edges represents the dimensions of analysis.A cell of the cube is determined uniquely by assigning avalue to every dimension, and it contains a value for eachmeasure. Figure 3 shows an intuitive graphical represen-tation of a cube centered on the sale fact. The dimensionsareproduct, store, anddate. An event corresponds to theselling of a givenproduct in agiven store onagivenday, andit is described by two measures: the quantity sold and therevenue. The figure emphasizes that the cube is sparse, i.e.,that several events did not happen at all: Obviously, not allproducts are sold every day in every store.
Normally, each dimension is structured into a hierarchyof dimension levels (sometimes called roll-up hierarchy)that group its values in different ways. For instance, pro-ducts may be grouped according to their type and theirbrand, and types may be grouped additionally into cate-gories. Stores are grouped into cities, which in turn aregrouped into regions and nations. Dates are grouped intomonths and years. On top of each hierarchy, a final levelexists that groups together all possible values of ahierarchy(all products, all stores, andall dates).Eachdimension levelmay be described even more by one or more descriptiveattributes (e.g., a product may be described by its name, itscolor, and its weight).
A brief mention to some alternative terminology usedeither in the literature or in the commercial tools is useful.
Figure 1. Independent data marts and busarchitectures (without and with conformeddimensions and facts).
DATA WAREHOUSE 3

Althoughwith the term dimensionwe refer to the attributethat determines the minimum fact granularity, sometimesthe whole hierarchies are named as dimensions. Measuresare sometimes called variables, metrics, categories, proper-ties, or indicators. Finally, dimension levels are sometimescalled parameters or attributes.
We now observe that the cube cells and the data theycontain, although summarizing the elemental data storedwithin operational sources, are still very difficult to analyzebecause of their huge number: Two basic techniques areused, possibly together, to reduce the quantity of data andthus obtain useful information: restriction and aggrega-tion. For both, hierarchies play a fundamental role becausethey determine how events may be aggregated andselected.
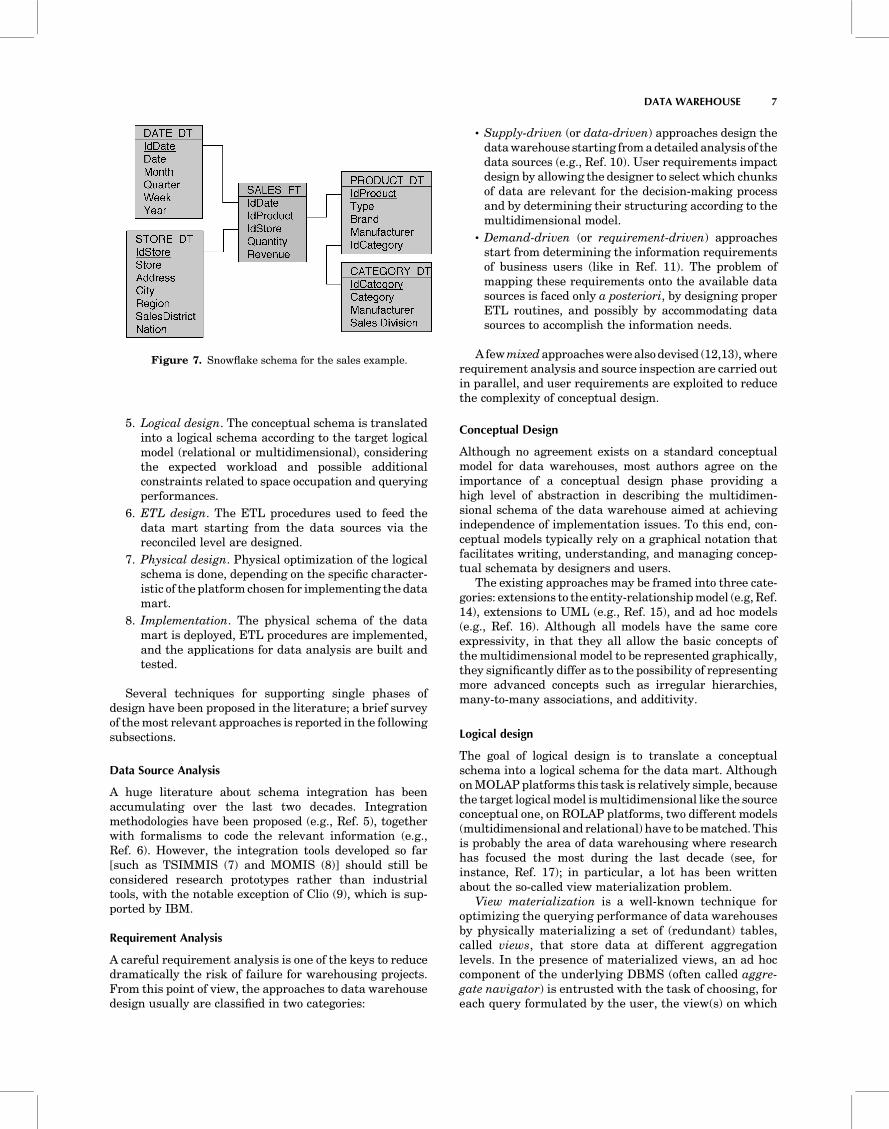
Restricting data means cutting out a portion of the cubeto limit the scope of analysis. The simplest form of restric-tion is slicing, where the cube dimensionality is reduced byfocusing onone single value for one ormoredimensions. Forinstance, as depicted in Fig. 4, by deciding that only sales ofstore ‘‘S-Mart’’ are of interest, the decision maker actuallycuts a slice of the cube obtaining a two-dimensional sub-cube. Dicing is a generalization of slicing in which a sub-cube is determined by posing Boolean conditions onhierarchy levels. For instance, the user may be interestedin sales of products of type ‘‘Hi-Fi’’ for the stores in Romeduring the days of January 2007 (see Fig. 4).
Although restriction is used widely, aggregation playsthemost relevant role in analyzingmultidimensional data.In fact, most often users are not interested in analyzingevents at the maximum level of detail. For instance, it maybe interesting to analyze sale events not on a daily basis but
bymonth. In the cubemetaphor, this processmeans group-ing, for each product and each store, all cells correspondingto the days of the same month into one macro-cell. In theaggregated cube obtained, each macro-cell represents asynthesis of the data stored in the cells it aggregates: inour example, the total number of items sold in each monthand the total monthly revenue, which are calculated bysumming the values of Quantity and Revenue through thecorresponding cells. Eventually, by aggregating along thetime hierarchy, an aggregated cube is obtained in whicheach macro-cell represents the total sales over the wholetime period for each product and store. Aggregation canalso be operated along two or more hierarchies. Forinstance, as shown in Fig. 5, sales can be aggregated bymonth, product type, and city.
Noticeably, not every measure can be aggregated con-sistently along all dimensions using the sum operator. Insome cases, other operators (such as average or minimum)can be used instead, whereas in other cases, aggregation isnot possible at all. For details on the two related problems ofadditivity and summarizability, the reader is referred toRef. 2.
Reporting
Reporting is oriented to users who need to access periodi-cally information structured in a fixed way. For instance, ahospital must send monthly reports of the costs of patientstays to a regional office. These reports always have thesame form, so the designer can write the query that gen-erates the report and ‘‘freeze’’ it within an application sothat it can be executed at the users’ needs.
A report is associated with a query and a presentation.The query typically entails selecting and aggregatingmultidimensional data stored in one or more facts. Thepresentation can be in tabular or graphical form (a dia-gram, a histogram, a cake, etc.). Most reporting tools alsoallow for automatically distributing periodic reports tointerested users by e-mail on a subscription basis or forposting reports in the corporate intranet server for down-loading.
OLAP
OLAP, which is probably the best known technique forquerying data warehouses, enables users to explore inter-actively and analyze information based on themultidimen-sional model. Although the users of reporting toolsessentially play a passive role, OLAP users can defineactively a complex analysis session where each step takenfollows from the results obtained at previous steps. Theimpromptu character of OLAP sessions, the deep knowl-edge of data required, the complexity of the possiblequeries, and the orientation toward users not skilled incomputer sciencemaximize the importance of the employedtool, whose interface necessarily has to exhibit excellentfeatures of flexibility and friendliness.
An OLAP session consists in a ‘‘navigation path’’ thatreflects the course of analysis of one or more facts fromdifferent points of view and at different detail levels. Such apath is realized into a sequence of queries, with eachdifferentially expressed with reference to the previous
Figure 2. Hub-and-spoke architecture; ODS stands for opera-tional data store.
4 DATA WAREHOUSE
query. Query results are multidimensional; like forreporting, OLAP tools typically represent data in eithertabular or graphical form.
Each step in the analysis session is marked by theapplication of an OLAP operator that transforms the pre-vious query into a new one. The most common OLAPoperators are as follows:
� Roll-up, which aggregates data even more (e.g., fromsales by product, nation, and month to sales by cate-gory, nation, and year).
� Drill-down, which adds detail to data (e.g., from salesby category, nation, and year to sales by category, city,and year).
� Slice-and-dice, which selects data by fixing values orintervals for one or more dimensions (e.g., sales ofproducts of type ‘‘Hi-Fi’’ for stores in Italy).
� Pivoting, which changes the way of visualizing theresults by rotating the cube (e.g., swaps rows withcolumns).
� Drill-across, which joins two or more correlated cubesto compare their data (e.g., join the sales and thepromotions cubes to compare revenues with dis-counts).
We close this section by observing that, in several appli-cations, much use is made of an intermediate approachcommonly called semistatic reporting, in which only a
reduced set of OLAP navigation paths are enabled to avoidobtaining inconsistent orwrong results by incorrectlyusingaggregation, while allowing for some flexibility in manip-ulating data.
IMPLEMENTATIONS OF THE MULTIDIMENSIONAL MODEL
Two main approaches exist for implementing a data ware-house: ROLAP, which stands for relational OLAP, andMOLAP, which stands for multidimensional OLAP.Recently a third, intermediate approach has been adoptedin some commercial tools: HOLAP, that is, hybrid OLAP.
Relational OLAP
On a ROLAP platform, the relational technology isemployed to store data in multidimensional form. Thisapproach is motivated by the huge research work madeon the relational model, by the widespread knowledge ofrelational databases and their administration, and by theexcellent level of performance and flexibility achieved byrelationalDBMSs.Of course, because the expressiveness ofthe relational model does not include the basic concepts ofthe multidimensional model, it is necessary to adopt spe-cific schema structures that allow the multidimensionalmodel to be mapped onto the relational model. Two mainsuch structures are commonly adopted: the star schemaand the snowflake schema.
Thestarschemaisarelationalschemacomposedofasetofrelations called dimension tables and one relation called afact table. Each dimension table models a hierarchy; itincludes a surrogate key (i.e., a unique progressive numbergenerated by the DBMS) and one column for each level anddescriptiveattributeof thehierarchy.The fact table includesa set of foreign keys, one that references each dimensiontable, which together define the primary key, plus one col-umn for eachmeasure. Figure 6 shows a star schema for thesales example. Noticeably, dimension tables are denorma-lized (they are not in the third normal form); this is aimed atreducing thenumberof relational joins tobe computedwhenexecuting OLAP queries, so as to improve performance.
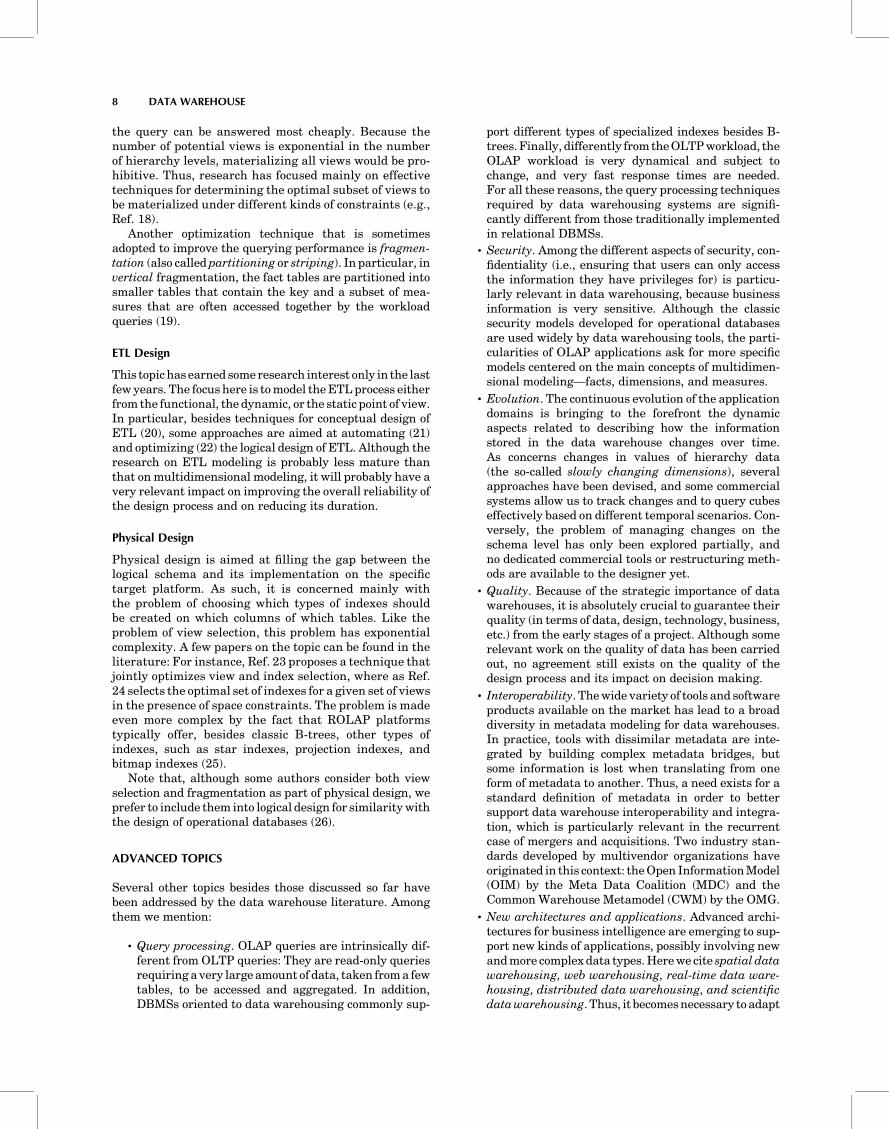
A snowflake schema is a star schema in which one ormore dimension tables have been partially or totally nor-malized to reduce redundancy. Thus, a dimension table canbe split into one primary dimension table (whose surrogatekey is references by the fact table) and one or more
Figure 3. The three-dimensional cube that models the sales ina chain of shops. In the S-Mart store, on 5/1/2007, three LE32MTVs were sold, for a total revenue of $2500.
Figure 4. Slicing (left) and dicing (right) on the sales cube.
DATA WAREHOUSE 5

secondarydimension tables (each including a surrogate keyand referencing thekey of another dimension table). Figure7 shows an example for the sale schema, in which theproduct dimension has been normalized partially.
Multidimensional OLAP
Differently from ROLAP, a MOLAP system is based on anative logical model that directly supports multidimen-sional data and operations. Data are stored physicallyinto multidimensional arrays, and positional techniquesare used to access them.
The great advantage of MOLAP platforms is that OLAPqueries can be executed with optimal performances, with-out resorting to complex and costly join operations. On theotherhand, they fall shortwhendealingwith large volumesof data, mainly because of the problem of sparseness: Infact, when a large percentage of the cube cells are empty, alot of memory space is wasted uselessly unless ad hoccompression techniques are adopted.
Hybrid OLAP
HOLAP can be viewed as an intermediate approachbetween ROLAP and MOLAP, because it tries to puttogether their advantages into a single platform. Two basicstrategies are pursued in commercial tools to achieve thisgoal. In the first strategy, detailed data are stored in arelational database, where as a set of useful preaggregatesare stored on proprietary multidimensional structures. Inthe second strategy, cubes are partitioned into dense andsparse subcubes, with the former being stored in multi-dimensional form, and the latter in relational form.
DESIGN TECHNIQUES
Despite the basic role played by a well-structured metho-dological framework in ensuring that the data warehousedesigned fully meets the user expectations, a very fewcomprehensive design methods have been devised so far(e.g.,Refs.3and4).Noneof themhasemergedasastandard,but all agree on one point: A bottom-up approach is prefer-able toa top-downapproach, because it significantly reducesthe risk of project failure. Although in a top-down approachthe data warehouse is planned and designed initially in itsentirety, in a bottom-up approach, it is built incrementallyby designing and prototyping one data mart at a time,starting from the one that plays themost strategic businessrole. In general terms, the macro-phases for designing adata warehouse can be stated as follows:
� Planning, based ona feasibility study that assesses theproject goals, estimates the system borders and size,evaluates costs and benefits, and analyzes risks andusers’ expectations.
� Infrastructure design, aimed at comparing the differ-ent architectural solutions, at surveying the availabletechnologies and tools, and at preparing a draft designof the whole system.
� Data mart development, which iteratively designs,develops, tests and deploys each data mart and therelated applications.
As concerns the design of each data mart, the methodol-ogy proposed in Ref. 3 encompasses eight closely related,but not necessarily strictly sequential, phases:
1. Data source analysis. The source schemata areanalyzed and integrated to produce a reconciledschema describing the available operational data.
2. Requirement analysis. Business users are inter-viewed to understand and collect their goals andneeds, so as to generate requirement glossaries anda preliminary specification of the core workload.
3. Conceptual design. Starting from the user require-ments and from the reconciled schema, a conceptualschema that describes the datamart in an implemen-tation-independent manner is derived.
4. Schema validation. The preliminary workload is bet-ter specified and tested against the conceptualschema to validate it.
Figure 5. Aggregation on the sales cube.
Figure 6. Star schema for the sales example (primary keys areunderlined).
6 DATA WAREHOUSE
5. Logical design. The conceptual schema is translatedinto a logical schema according to the target logicalmodel (relational or multidimensional), consideringthe expected workload and possible additionalconstraints related to space occupation and queryingperformances.
6. ETL design. The ETL procedures used to feed thedata mart starting from the data sources via thereconciled level are designed.
7. Physical design. Physical optimization of the logicalschema is done, depending on the specific character-istic of the platform chosen for implementing the datamart.
8. Implementation. The physical schema of the datamart is deployed, ETL procedures are implemented,and the applications for data analysis are built andtested.
Several techniques for supporting single phases ofdesign have been proposed in the literature; a brief surveyof themost relevant approaches is reported in the followingsubsections.
Data Source Analysis
A huge literature about schema integration has beenaccumulating over the last two decades. Integrationmethodologies have been proposed (e.g., Ref. 5), togetherwith formalisms to code the relevant information (e.g.,Ref. 6). However, the integration tools developed so far[such as TSIMMIS (7) and MOMIS (8)] should still beconsidered research prototypes rather than industrialtools, with the notable exception of Clio (9), which is sup-ported by IBM.
Requirement Analysis
A careful requirement analysis is one of the keys to reducedramatically the risk of failure for warehousing projects.From this point of view, the approaches to data warehousedesign usually are classified in two categories:
� Supply-driven (or data-driven) approaches design thedatawarehouse starting fromadetailed analysis of thedata sources (e.g., Ref. 10). User requirements impactdesign by allowing the designer to select which chunksof data are relevant for the decision-making processand by determining their structuring according to themultidimensional model.
� Demand-driven (or requirement-driven) approachesstart from determining the information requirementsof business users (like in Ref. 11). The problem ofmapping these requirements onto the available datasources is faced only a posteriori, by designing properETL routines, and possibly by accommodating datasources to accomplish the information needs.
A fewmixedapproacheswerealsodevised (12,13),whererequirement analysis and source inspection are carried outin parallel, and user requirements are exploited to reducethe complexity of conceptual design.
Conceptual Design
Although no agreement exists on a standard conceptualmodel for data warehouses, most authors agree on theimportance of a conceptual design phase providing ahigh level of abstraction in describing the multidimen-sional schema of the data warehouse aimed at achievingindependence of implementation issues. To this end, con-ceptual models typically rely on a graphical notation thatfacilitates writing, understanding, and managing concep-tual schemata by designers and users.
The existing approaches may be framed into three cate-gories: extensions to the entity-relationshipmodel (e.g, Ref.14), extensions to UML (e.g., Ref. 15), and ad hoc models(e.g., Ref. 16). Although all models have the same coreexpressivity, in that they all allow the basic concepts ofthe multidimensional model to be represented graphically,they significantly differ as to the possibility of representingmore advanced concepts such as irregular hierarchies,many-to-many associations, and additivity.
Logical design
The goal of logical design is to translate a conceptualschema into a logical schema for the data mart. AlthoughonMOLAPplatforms this task is relatively simple, becausethe target logicalmodel ismultidimensional like the sourceconceptual one, on ROLAP platforms, two different models(multidimensional and relational) have to bematched. Thisis probably the area of data warehousing where researchhas focused the most during the last decade (see, forinstance, Ref. 17); in particular, a lot has been writtenabout the so-called view materialization problem.
View materialization is a well-known technique foroptimizing the querying performance of data warehousesby physically materializing a set of (redundant) tables,called views, that store data at different aggregationlevels. In the presence of materialized views, an ad hoccomponent of the underlying DBMS (often called aggre-gate navigator) is entrusted with the task of choosing, foreach query formulated by the user, the view(s) on which
Figure 7. Snowflake schema for the sales example.
DATA WAREHOUSE 7
the query can be answered most cheaply. Because thenumber of potential views is exponential in the numberof hierarchy levels, materializing all views would be pro-hibitive. Thus, research has focused mainly on effectivetechniques for determining the optimal subset of views tobe materialized under different kinds of constraints (e.g.,Ref. 18).
Another optimization technique that is sometimesadopted to improve the querying performance is fragmen-tation (also called partitioning or striping). In particular, invertical fragmentation, the fact tables are partitioned intosmaller tables that contain the key and a subset of mea-sures that are often accessed together by the workloadqueries (19).
ETL Design
This topic has earned some research interest only in the lastfew years. The focus here is tomodel theETLprocess eitherfrom the functional, the dynamic, or the static point of view.In particular, besides techniques for conceptual design ofETL (20), some approaches are aimed at automating (21)and optimizing (22) the logical design of ETL. Although theresearch on ETL modeling is probably less mature thanthat onmultidimensional modeling, it will probably have avery relevant impact on improving the overall reliability ofthe design process and on reducing its duration.
Physical Design
Physical design is aimed at filling the gap between thelogical schema and its implementation on the specifictarget platform. As such, it is concerned mainly withthe problem of choosing which types of indexes shouldbe created on which columns of which tables. Like theproblem of view selection, this problem has exponentialcomplexity. A few papers on the topic can be found in theliterature: For instance, Ref. 23 proposes a technique thatjointly optimizes view and index selection, where as Ref.24 selects the optimal set of indexes for a given set of viewsin the presence of space constraints. The problem is madeeven more complex by the fact that ROLAP platformstypically offer, besides classic B-trees, other types ofindexes, such as star indexes, projection indexes, andbitmap indexes (25).
Note that, although some authors consider both viewselection and fragmentation as part of physical design, weprefer to include them into logical design for similaritywiththe design of operational databases (26).
ADVANCED TOPICS
Several other topics besides those discussed so far havebeen addressed by the data warehouse literature. Amongthem we mention:
� Query processing. OLAP queries are intrinsically dif-ferent from OLTP queries: They are read-only queriesrequiring avery large amount of data, taken froma fewtables, to be accessed and aggregated. In addition,DBMSs oriented to data warehousing commonly sup-
port different types of specialized indexes besides B-trees.Finally, differently fromtheOLTPworkload, theOLAP workload is very dynamical and subject tochange, and very fast response times are needed.For all these reasons, the query processing techniquesrequired by data warehousing systems are signifi-cantly different from those traditionally implementedin relational DBMSs.
� Security. Among the different aspects of security, con-fidentiality (i.e., ensuring that users can only accessthe information they have privileges for) is particu-larly relevant in data warehousing, because businessinformation is very sensitive. Although the classicsecurity models developed for operational databasesare used widely by data warehousing tools, the parti-cularities of OLAP applications ask for more specificmodels centered on the main concepts of multidimen-sional modeling—facts, dimensions, and measures.
� Evolution. The continuous evolution of the applicationdomains is bringing to the forefront the dynamicaspects related to describing how the informationstored in the data warehouse changes over time.As concerns changes in values of hierarchy data(the so-called slowly changing dimensions), severalapproaches have been devised, and some commercialsystems allow us to track changes and to query cubeseffectively based on different temporal scenarios. Con-versely, the problem of managing changes on theschema level has only been explored partially, andno dedicated commercial tools or restructuring meth-ods are available to the designer yet.
� Quality. Because of the strategic importance of datawarehouses, it is absolutely crucial to guarantee theirquality (in terms of data, design, technology, business,etc.) from the early stages of a project. Although somerelevant work on the quality of data has been carriedout, no agreement still exists on the quality of thedesign process and its impact on decision making.
� Interoperability. Thewide variety of tools and softwareproducts available on the market has lead to a broaddiversity in metadata modeling for data warehouses.In practice, tools with dissimilar metadata are inte-grated by building complex metadata bridges, butsome information is lost when translating from oneform of metadata to another. Thus, a need exists for astandard definition of metadata in order to bettersupport data warehouse interoperability and integra-tion, which is particularly relevant in the recurrentcase of mergers and acquisitions. Two industry stan-dards developed by multivendor organizations haveoriginated in this context: theOpen InformationModel(OIM) by the Meta Data Coalition (MDC) and theCommon Warehouse Metamodel (CWM) by the OMG.
� New architectures and applications. Advanced archi-tectures for business intelligence are emerging to sup-port new kinds of applications, possibly involving newandmore complex data types.Herewe cite spatial datawarehousing, web warehousing, real-time data ware-housing, distributed data warehousing, and scientificdatawarehousing. Thus, it becomesnecessary toadapt
8 DATA WAREHOUSE
and specialize the existing design and optimizationtechniques to cope with these new applications.
See Ref. 26 for an up-to-date survey of open researchthemes.
BIBLIOGRAPHY
1. H. Lenz and A. Shoshani, Summarizability in OLAP andstatistical data bases, Proc. Int. Conf. on Scientific and Statis-tical DatabaseManagement,Olympia,WA, 1997, pp. 132–143.
2. R. Agrawal, A. Gupta, and S. Sarawagi,Modelingmultidimen-sional databases, IBM Research Report, IBM AlmadenResearch Center, 1995.
3. M.Golfarelli andS.Rizzi,Amethodological framework for datawarehouse design, Proc. Int. Workshop on Data Warehousingand OLAP, Washington DC; 1998; pp. 3–9.
4. S. Lujan-Mora and J. Trujillo, A comprehensive method fordata warehouse design, Proc. Int. Workshop on Design andManagement of Data Warehouses, Berlin;Germany; 2003;
pp. 1.1–1.14.
5. D. Calvanese, G. De Giacomo, M. Lenzerini, D. Nardi, and R.Rosati, A principled approach to data integration and reconci-liation indatawarehousing,Proc. Int.WorkshoponDesignandManagement of Data Warehouses, Heidelberg;Germany; 1999;
pp. 16.1–16.11.
6. D. Calvanese, G. De Giacomo, M. Lenzerini, D. Nardi, and R.Rosati, Description logic framework for information integra-tion,Proc. Int.Conf. onPrinciples ofKnowledgeRepresentationand Reasoning, Trento; Italy; 1998; pp. 2–13.
7. S. Chawathe, H. Garcia-Molina, J. Hammer, K. Ireland, Y.Papakonstantinou, J. Ullman, and J. Widom, The TSIMMISproject: integration of heterogeneous information sources,Proc.Meetingof the Inf.ProcessingSoc. ofJapan,Tokyo,Japan,1994, pp. 7–18.
8. D. Beneventano, S. Bergamaschi, S. Castano, A. Corni, R.Guidetti, G. Malvezzi, M. Melchiori, and M. Vincini, Informa-tion integration: the MOMIS project demonstration, Proc. Int.Conf. onVery Large DataBases,Cairo;Egypt; 2000; pp. 611–614.
9. L.M.Haas,M.A.Hernandez,H.Ho, L. Popa, andM.Roth, Cliogrows up: from research prototype to industrial tool, Proc.SIGMOD Conf., Baltimore; MD; 2005; pp. 805–810.
10. M. Golfarelli, D. Maio, and S. Rizzi, The dimensional factmodel: a conceptual model for data warehouses, Int. J. Coope.Informat. Sys., 7(2-3): 215–247, 1998.
11. N. Prakash and A. Gosain, Requirements driven data ware-house development, CAiSE Short Paper Proc., Klagenfurt/Velden, Austria, 2003, pp. 13–16.
12. A. Bonifati, F. Cattaneo, S. Ceri, A. Fuggetta, and S. Para-boschi, Designing data marts for data warehouses,ACM Trans: Softw: Engineer. Methodol., 10(4): 452–483, 2001.
13. P. Giorgini, S. Rizzi, and M. Garzetti, Goal-oriented require-ment analysis for data warehouse design, Proc. Int. Workshopon Data Warehousing and OLAP, Bremen, Germany, 2005,pp. 47–56.
14. C.Sapia,M.Blaschka,G.Hofling, andB.Dinter,Extending theE/Rmodel for themultidimensional paradigm,Proc. Int.Work-shop on Design and Management of Data Warehouses, Singa-pore, 1998, pp. 105–116.
15. S. Lujan-Mora, J. Trujillo, and I. Song, A UML profile formultidimensional modeling in data warehouses, Data Know.Engineer., 59(3): 725–769, 2006.
16. S. Rizzi, Conceptual modeling solutions for the data ware-house, in R. Wrembel and C. Koncilia (eds.), Data Warehousesand OLAP: Concepts, Architectures and Solutions, IRM Press:2006, pp. 1–26.
17. J. Lechtenborger and G. Vossen, Multidimensional normalforms for data warehouse design, Informat. Sys., 28(5):415–434, 2003.
18. D. Theodoratos and M. Bouzeghoub, A general framework forthe view selection problem for data warehouse design andevolution, Proc. Int. Workshop on Data Warehousing andOLAP, Washington DC, 2000, pp. 1–8.
19. M. Golfarelli, V. Maniezzo, and S. Rizzi, Materialization offragmentedviews inmultidimensional databases,DataKnowl.Engineer., 49(3): 325–351, 2004.
20. P. Vassiliadis, A. Simitsis, and S. Skiadopoulos, Conceptualmodeling for ETL processes, Proc. Int. Workshop on DataWarehousing and OLAP, McLean, 2002, pp. 14–21.
21. A. Simitsis, Mapping conceptual to logical models for ETLprocesses, Proc. Int. Workshop on Data Warehousing andOLAP, Bremen, Germany, 2005, pp. 67–76.
22. A. Simitsis, P. Vassiliadis, and T. K. Sellis, Optimizing ETLprocesses in data warehouses, Proc. Int. Conf. on Data Engi-neering, Tokyo, Japan, 2005, pp. 564–575.
23. H. Gupta, V. Harinarayan, A. Rajaraman, and J. Ullman,Index selection forOLAP,Proc. Int.Conf. onDataEngineering,Birmingham, UK, 1997, pp. 208–219.
24. M.Golfarelli, S.Rizzi, andE.Saltarelli, Index selection for datawarehousing, Proc. Int. Workshop on Design andManagementof Data Warehouses, Toronto, Canada, 2002, pp. 33–42.
25. P. O’Neil and D. Quass, Improved query performance withvariant indexes, Proc. SIGMOD Conf., Tucson, AZ, 1997,pp. 38–49.
26. S. Rizzi, A. Abell, J. Lechtenborger, and J. Trujillo, Research indata warehouse modeling and design: Dead or alive? Proc. Int.Workshop on Data Warehousing and OLAP, Arlington, VA,2006, pp. 3–10.
FURTHER READING
B. Devlin,DataWarehouse: From Architecture to Implementation,Reading, MA: Addison-Wesley Longman, 1997.
W. H. Inmon, Building the Data Warehouse, 4th ed. New York:John Wiley & Sons, 2005.
M. Jarke, M. Lenzerini, Y. Vassiliou, and P. Vassiliadis, Funda-mentals of Data Warehouse, New York: Springer, 2000.
R. Kimball, L. Reeves, M. Ross, and W. Thornthwaite, The DataWarehouse Lifecycle Toolkit, New York: John Wiley & Sons, 1998.
R. Mattison, Data Warehousing, New York: McGraw-Hill, 1996.
STEFANO RIZZI
University of BolognaBologna, Italy
DATA WAREHOUSE 9


![Towards Systematic Privacy and Operability (PRIOP) Studies · Hazard and Operability Studies The international standard IEC 61882 [2] de nes what a Hazard and Operability (HAZOP)](https://img.pdfslide.us/doc/110x75/5e9fb7d8f9d766473e1e43a5/towards-systematic-privacy-and-operability-priop-studies-hazard-and-operability.jpg)