Embed Size (px)
Citation preview

Data User Guide
Release 7.0

LSIC Data User Guide, Release 7—March 2016 ii
The Footprints in Time team acknowledges all the traditional custodians
of the land and pays respect to their Elders past and present.
The Footprints in Time study was initiated and is funded by
the Australian Government and is conducted by
the Department of Social Services (DSS).
This document must be attributed as the Department of Social Services (2016):
Footprints in Time: The Longitudinal Study of Indigenous Children – Data User
Guide, Release 7.0.

LSIC Data User Guide, Release 7—March 2016 iii
Contents
Abbreviations ..................................................................................................... 5
Acknowledgements ............................................................................................ 6
Introduction ....................................................................................................... 1
What is Footprints in Time? ................................................................................ 2 Objective of the Study ........................................................................................... 2 Who is involved? ................................................................................................... 3 Funding ................................................................................................................ 3 Ethics ................................................................................................................... 3 Survey methodology .............................................................................................. 4 Footprints in Time sample selection ......................................................................... 5 Footprints in Time study sites ................................................................................. 5 Study development and testing ............................................................................... 8 Study informants ................................................................................................... 8
Data collection .................................................................................................. 10 Consent process ...................................................................................................10 Fieldwork periods .................................................................................................10 Fieldwork response ...............................................................................................11
New entrants .................................................................................................11 Interview length ...................................................................................................12
Questionnaire content overview ....................................................................... 13
Using the datasets ............................................................................................ 19 Locating variables .................................................................................................19 Variable naming convention ...................................................................................19 Identifiers ............................................................................................................20 Cohort ................................................................................................................20 Geographic variables .............................................................................................20 Randomised cluster ..............................................................................................21 Household form ....................................................................................................21
Family composition variables ..........................................................................21 P2/Dads Survey ..................................................................................................23
Derived variables ............................................................................................24 Direct assessments of child development .................................................................24
Who Am I? ....................................................................................................25 Renfrew Word Finding Vocabulary Test ..............................................................25 PAT-R – Progressive Achievement Tests in Reading .............................................25 PAT Maths – Progressive Achievement Test in Mathematics..................................27 Matrix reasoning .............................................................................................27 Child height and weight ...................................................................................28
Scales .................................................................................................................29 Temperament ................................................................................................29 Brief Infant-Toddler Social and Emotional Assessment (BITSEA) ...........................30 Strengths and Difficulties Questionnaire (SDQ)...................................................30 Parent Empowerment and Efficacy Measure (PEEM) ............................................31
Qualitative data ....................................................................................................32 Language module .................................................................................................33 Other–specify responses........................................................................................35 Missing data coding ..............................................................................................35

LSIC Data User Guide, Release 7—March 2016 iv
Merging datasets ..................................................................................................36 Confidentialisation ................................................................................................36 Data access .........................................................................................................36
Data linkage – the Australian Early Development Census (AEDC) .................... 37 About the AEDC ...................................................................................................37 National implementation ........................................................................................38 Confidentialisation ................................................................................................38 List of AEDC variables ...........................................................................................40
Data linkage – the National Assessment Program – Literacy and Numeracy
(NAPLAN) ......................................................................................................... 42 Obtaining consent .................................................................................................42 Linkage and matching process ...............................................................................44 LSIC NAPLAN data file ...........................................................................................45 NAPLAN proficiency bands and national minimum standards ......................................47
Getting more information ................................................................................. 48
References ....................................................................................................... 49
Appendix A ....................................................................................................... 51 Data dictionary.....................................................................................................51
Appendix B ....................................................................................................... 52 Qualitative (free text) questions and variables .........................................................52
Appendix C ....................................................................................................... 58 Examples of merging in Stata ................................................................................58
LSIC Data User Guide, Release 7—March 2016 v
ABBREVIATIONS
ABS Australian Bureau of Statistics
AEDC Australian Early Development Census
ARIA Accessibility/Remoteness Index of Australia
BMI Body Mass Index
CAPI Computer Assisted Personal Interview
DSS Department of Social Services
ERP Estimated Resident Population
ESL English as a Second Language
HILDA Household, Income and Labour Dynamics in Australia Survey
HREC Human Research Ethics Committee
ICC Indigenous Coordination Centre
LBOTE Language Background Other Than English
LORI Level of Relative Isolation
LSAC Longitudinal Study of Australian Children
LSAG Longitudinal Studies Advisory Group
LSIC Longitudinal Study of Indigenous Children (also known as Footprints in Time)
NAPLAN National Assessment Program – Literacy and Numeracy
NATSISS National Aboriginal and Torres Strait Islander Social Survey
NATSIHS National Aboriginal and Torres Strait Islander Health Survey
P1 Parent 1
P2 Parent 2
PAT-R Progressive Achievement Tests in Reading
PAT-Maths Progressive Achievement Tests in Mathematics
PLE Parent Living Elsewhere
RAO Research Administration Officer (interviewer)
SC Study Child
SDQ Strengths and Difficulties Questionnaire
TC Teacher/Carer
WHO World Health Organization
WISC-IV Wechsler Intelligence Scale for Children (4th edition)
LSIC Data User Guide, Release 7—March 2016 vi
ACKNOWLEDGEMENTS
Footprints in Time—the Longitudinal Study of Indigenous Children (LSIC) was initiated
and is funded by the Australian Government Department of Social Services (DSS).
The Study would never have been possible without the support and trust of the
Aboriginal and Torres Strait Islander families who open their doors to the researchers and
generously give their time to talk openly about their lives. Our gratitude goes to them,
and to the leaders and Elders of their communities who are active guardians of their
people’s wellbeing.
The Study brings together people committed to making a positive difference in the lives
of Aboriginal and Torres Strait Islander children.
LSIC Data User Guide, Release 7—March 2016 1
INTRODUCTION
The purpose of this document is to provide a comprehensive reference for data users of
Footprints in Time, the Longitudinal Study of Indigenous Children (LSIC).
This document provides information data users need to know to use the LSIC datasets—
such as the background to the Study, sample selection, Study sites, research design,
Study development and testing, consent processes, questionnaire design and piloting, file
structures, variable naming conventions and missing data coding.
Other useful documentation for data users includes the marked-up questionnaires and
Data Dictionary.
The Data User Guide and Data Dictionary are available on the Study website,
<http://www.dss.gov.au/lsic>
We welcome any feedback you have about this Data User Guide. If there is something
that you expected to find in this manual and did not, or if you had difficulty
understanding any section, please let us know by emailing <[email protected]>.
LSIC Data User Guide, Release 7—March 2016 2
WHAT IS FOOTPRINTS IN TIME?
Footprints in Time is the name given to the Longitudinal Study of Indigenous Children
(LSIC). Footprints in Time aims to improve the understanding of, and policy response to
the diverse circumstances faced by Aboriginal and Torres Strait Islander children, their
families and communities. The Study provides a data resource that can be drawn on by
government, researchers, service providers, parents and communities.
The Study collects important information about the lives of Aboriginal and Torres Strait
Islander children, covering areas including:
children—physical and mental health, social and cognitive development, family and
community relationships, and significant events;
children’s families—health, work, lifestyle, and family and community
connectedness;
children’s communities—facilities, services, and social and community issues;
services—child care, education, health and other services used by the child’s family.
Objective of the Study
The main objective of the Study is to provide high quality data that can be used to
provide better insight into how a child’s early years affects their development. It is hoped
that this information can be drawn upon to help close the gap in life circumstances
between Indigenous and non-Indigenous Australians.
Footprints in Time has four key research questions, formulated under the guidance of the
Steering Committee, which were designed to achieve this objective. These are:
What do Aboriginal and Torres Strait Islander children need to have the best start
in life to grow up strong?
What helps Aboriginal and Torres Strait Islander children stay on track or become
healthier, more positive and strong?
How are Aboriginal and Torres Strait Islander children raised?
What is the importance of family, extended family and community in the early
years of life and when growing up?
Also of interest is the role that service use and support plays in the lives of Aboriginal
and Torres Strait Islander children:
How can services and other types of support make a difference to the lives of
Aboriginal and Torres Strait Islander children?
LSIC Data User Guide, Release 7—March 2016 3
Who is involved?
Footprints in Time is funded by the Australian Government and managed by DSS.
The LSIC Steering Committee has been chaired by Professor Mick Dodson since 2003.
The Steering Committee oversees the design, development and implementation of the
Study. Its members are drawn from academic and community sectors, covering a wide
range of disciplines such as health and education. Subcommittees of the Steering
Committee are formed to deal with particular issues as required.
Strategic guidance and leadership on content, operation and analysis of Footprints in
Time is also provided by the Longitudinal Studies Advisory Group (LSAG). The primary
objective of the LSAG is to provide advice to the Longitudinal Study for Australian
Children (LSAC), Footprints in Time (LSIC) and the Household, Income and Labour
Dynamics in Australia (HILDA) Survey and thereby assist in maximising their strategic
importance to the Australian Government.
Footprints in Time interviews are conducted primarily by DSS employed Aboriginal and
Torres Strait Islander Research Administration Officers (RAOs).
Roy Morgan Research was contracted for Waves 1 to 4 of the Study to produce the data
collection instruments according to DSS design, assist in the management of pilot and
live fieldwork, capture and compile survey data and report on fieldwork procedures, as
well as response and non-response patterns. Colmar Brunton was contracted to deliver
this component of the survey in Wave 5 to 10.
DSS’s LSIC section manages the project from the National Office.
Funding
The 2003–04 Federal Budget provided the initial resources for the Footprints in Time
study. The first phase, from September 2003 to June 2004, involved extensive
consultation with Indigenous peoples and communities about the Study. The design and
development of the Study commenced in December 2005, with pilot testing continuing
through 2006 and 2007.
LSIC received funding in the 2007-08 budget for Waves 1–4 of the Study. The Study is
now classified as an ongoing measure and will continue as long as the sample retention
enables the Study to remain viable.
Ethics
Ethical clearance for the Study has been obtained from the Australian Government
Department of Health Departmental Ethics Committee which has been chosen as the
primary Human Research Ethics Committee (HREC) for the Study.
In addition state/territory and/or regional ethics clearance and support was obtained for
Footprints in Time sites through state and territory HRECs or their equivalents (in
accordance with the National Health and Medical Research Council, 2003 and Australian
Institute of Aboriginal and Torres Strait Islander Studies guidelines). State and territory
departments of education and Catholic dioceses are also consulted to gain permission
and support for preschool and school teachers to complete questionnaires about the
children involved in the Study. State and territory departments managing out-of-home
care were also consulted.
LSIC Data User Guide, Release 7—March 2016 4
Survey methodology
Footprints in Time employs an accelerated cross-sequential design, involving two cohorts
of Indigenous children aged from 6 months to 2 years (Baby cohort, or B cohort) and
from 3 years 6 months to 5 years (Child cohort, or K cohort) in Wave 1. The design
allows the data covering the first nine or ten years of Aboriginal and Torres Strait
Islander children’s lives to be collected in six years.
Aboriginal and Torres Strait Islander children born between December 2003 and
November 2004 (K cohort) or between December 2006 and November 2007 (B cohort)
are the sample units in the Study. The majority of families in the Study were recruited
using addresses provided by Centrelink and Medicare Australia. Other informal means of
contact such as word of mouth, local knowledge and study promotion were also used to
supplement the number of children in the Study. In practice, the K cohort consists of
children born in 2003, 2004 and 2005 and the B cohort consists of children born in 2006,
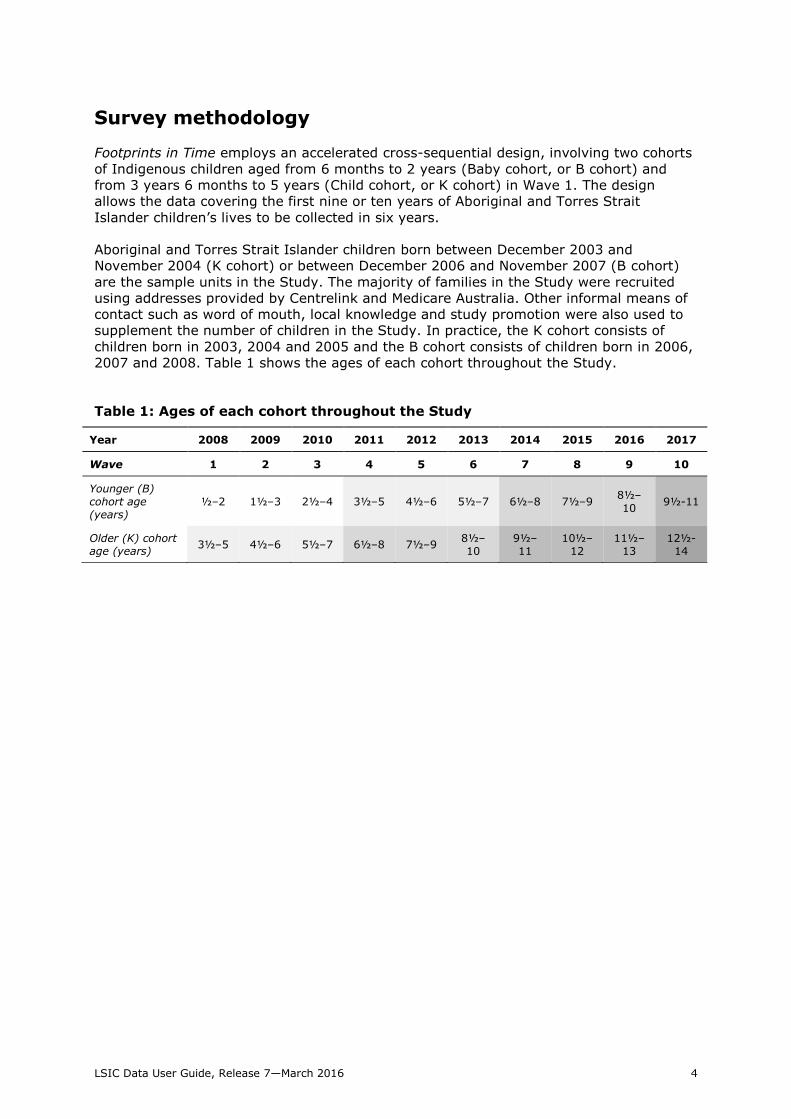
2007 and 2008. Table 1 shows the ages of each cohort throughout the Study.
Table 1: Ages of each cohort throughout the Study
Year 2008 2009 2010 2011 2012 2013 2014 2015 2016 2017
Wave 1 2 3 4 5 6 7 8 9 10
Younger (B) cohort age (years)
½–2 1½–3 2½–4 3½–5 4½–6 5½–7 6½–8 7½–9 8½–
10 9½-11
Older (K) cohort age (years)
3½–5 4½–6 5½–7 6½–8 7½–9 8½–10
9½–11
10½–12
11½–13
12½-14
LSIC Data User Guide, Release 7—March 2016 5
Footprints in Time sample selection
Footprints in Time uses a non-random purposive sampling design from which eligible
families were approached and voluntary consent obtained. The study focuses on eleven
sites chosen, in part, to cover the range of socioeconomic and community environments
where Aboriginal and Torres Strait Islander children live. Agreement and approval to
participate in the Study was sought from communities and Elders in these sites before
research within the communities began.
The Footprints in Time sites were chosen to:
ensure approximately equal representation of urban, regional and remote areas, thus
enabling some geographical comparison,
represent the concentration of Aboriginal and Torres Strait Islander people around
Australia,
contain a substantial Aboriginal and Torres Strait Islander population in the core and
surrounding areas,
include locations engaged in the pilot of the Study where existing relationships could
be built upon,
be located near an Indigenous Coordination Centre (ICC), if possible, where Research
Administration Officers (RAOs) could be based.
Footprints in Time was designed to sample approximately 150 children in each site,
providing a sample of up to 1,650 children. This number represents 5-10 per cent of
Aboriginal and Torres Strait Islander children of the appropriate ages. Due to difficulties in
sample recruitment related to small resident populations and geographic spread, for some
sites it was not possible to find sufficient numbers of children to meet the Study’s targets.
In other sites the number of eligible children was in excess of the required sample.
The same families who were interviewed in Wave 1 were approached again for interviews
in subsequent waves. However, a proportion of families could not be interviewed again
because they could not be located, had moved substantial distances, refused interviews, or
could not be interviewed for other reasons. However, the reduction in the number of study
children was partially offset in Wave 2 by the recruitment of 88 additional children from
the eleven sites in the sample. These children were from families who had either missed
out on or refused to participate in Wave 1 but were available and willing to participate in
Wave 2 and potentially for subsequent waves.
Footprints in Time study sites
The LSIC sample is not nationally representative; however it sufficiently reflects the
distribution of Aboriginal and Torres Strait Islander children aged between 0 and 5 years
(at the Study’s commencement in 2008) in the states and territories and among urban,
regional and remote areas. Following are the selected study sites:
New South Wales (NSW)
Western Sydney (from Campbelltown to Riverstone)
NSW South Coast (from Kiama to Eden)
Dubbo (including Gilgandra, Wellington and Narromine)
LSIC Data User Guide, Release 7—March 2016 6
Victoria (Vic)
Greater Shepparton (including Wangaratta, Seymour, Bendigo, Cobram and Barmah
and areas in between)
Queensland (Qld)
South East Queensland (including Brisbane, Ipswich, Logan, Inala, Gold Coast and
Bundaberg)
Mount Isa and remote Western Queensland (including Mornington Island,
Doomadgee, Normanton and Cloncurry)
Torres Strait Islands and Northern Peninsula Area (NPA)
Western Australia (WA)
Kimberley region (including Derby, Fitzroy Crossing, Broome and Ardiyooloon [One
Arm Point])
South Australia (SA)
Adelaide (including Port Augusta)
Northern Territory (NT)
Alice Springs (and some surrounding communities)
NT Top End (including Darwin, Katherine, Minyerri and Galiwin’ku)
Apart from site names, Footprints in Time reports use the Level of Relative Isolation (LORI)
to describe geographical characteristics of families in the Study. Site names are not
released with the data for reasons of confidentiality but LORI is included in the datasets.
Box 1: Level of Relative Isolation
Footprints in Time uses a classification system of remoteness known as the Level of
Relative Isolation (LORI). Previously used in the Western Australian Aboriginal Child Health
Survey (Zubrick et al. 2004), LORI is based on an extension of the 18-point ARIA
(Accessibility/Remoteness Index of Australia) called ARIA++. Five categories of isolation
have been defined, ranging from None (such as the Brisbane metropolitan area) to Low
(for example, Shepparton), Moderate (for example, Derby), High (for example, Bamaga)
and Extreme (for example, some Torres Strait islands).
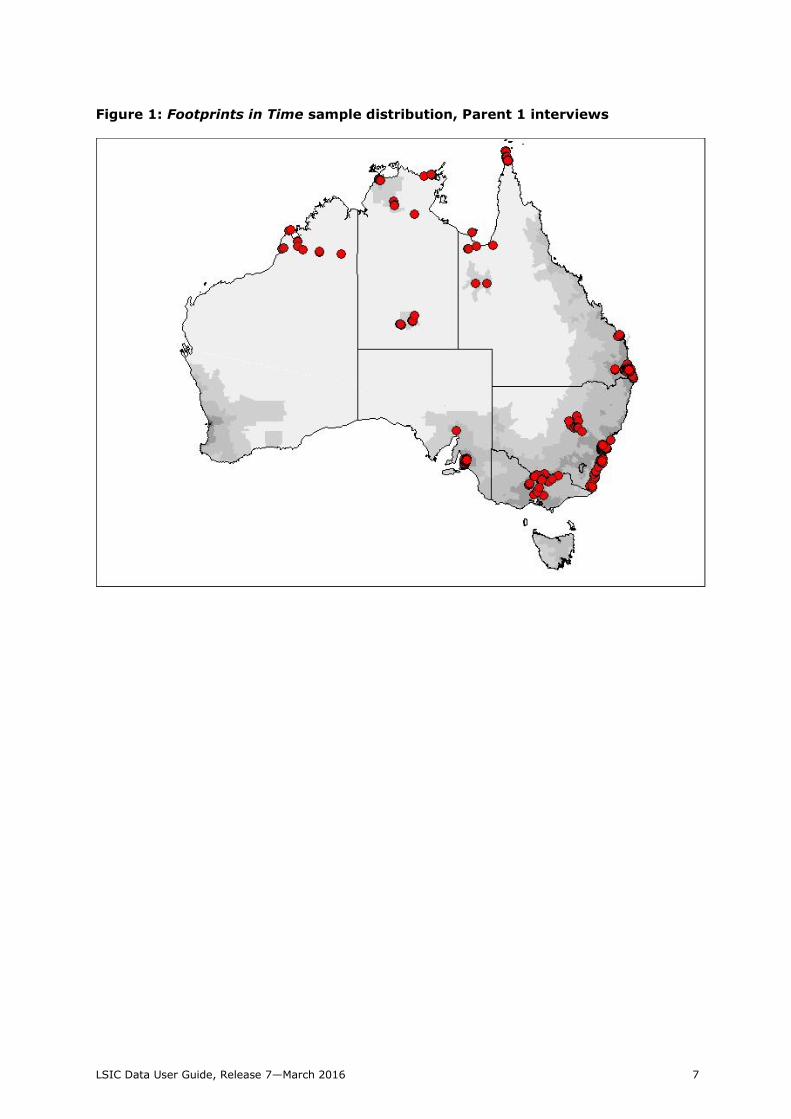
Figure 1 shows the geographic spread of study children in Wave 1.
LSIC Data User Guide, Release 7—March 2016 7
Figure 1: Footprints in Time sample distribution, Parent 1 interviews
LSIC Data User Guide, Release 7—March 2016 8
Study development and testing
The design of the Study and the content was developed based on extensive consultations
with urban, regional and remote Indigenous communities, organisations and service
providers across Australia. The overriding goal of consultations was to ensure the design of
the research reflected the interests of Aboriginal and Torres Strait Islander peoples,
communities and service providers and that the data would genuinely benefit the children
and their families.
Piloting of study interviews and community engagement strategies was conducted from
September 2004 to December 2005 in the Torres Strait and Northern Peninsula Area (NPA)
and in the ACT/Queanbeyan region.
Content rationales were developed based on these consultations, as well as other research
such as the Western Australian Aboriginal Child Health Survey (for example, Zubrick et al.
2003) and the National Aboriginal and Torres Strait Islander Social and Health Surveys
(NATSISS and NATSIHS). These rationales were workshopped in November 2005 with
members of the Steering Committee and other stakeholders and then used to develop
draft questionnaires and Computer Assisted Personal Interview (CAPI) instruments.
Piloting of the design, sampling strategy and Wave 1 survey content was undertaken in
partnership with the ABS. The ABS tested the questionnaire and field procedures in the
first pilot sites in 2006. A number of content areas were adapted to be more culturally
appropriate and/or better understood by respondents before testing the questionnaires and
field procedures again in 2007.
Initially six full-time Indigenous RAOs were employed and trained to manage the
community engagement activities for the pilot research, including consent processes, data
collection and dissemination of information in pilot communities.
Study informants
The Study collects or has collected data from multiple informants as below:
Parent 1 (P1)—was defined in Wave 1 as the primary caregiver who knew the
Study Child best. In most cases this was the child’s biological mother but in some
cases it was the child’s father or another guardian. In subsequent waves RAOs
interviewed the same Parent 1 if they were available and caring for the child and if
not, the person who knew the Study Child best at time of interview was interviewed
as P1.
RAOs undertake an extensive interview with the primary carer of every Study Child,
containing questions about the Study Child, P1 and the household. It is a face-to-face
interview (all waves).
Parent 2 (P2)/Dad—is Parent 1’s partner or another adult with a parent or carer
relationship to the Study Child. In most cases this is the biological father, but step-
fathers are also common. Although the surveys were designed to be answered by
Grandmas or Aunties or other family who had a caring role, there were few
respondents who were not fathers. Sometimes Parent 2 is a parent not living with the
Study Child, most commonly the biological father after separating from the biological
mother (Waves 1 and 2).

LSIC Data User Guide, Release 7—March 2016 9
RAOs undertook a face-to-face interview or a telephone interview (depending on
preferences of Parent 2) after receiving Parents 1’s consent and if Parent 2 was
willing to participate and able to be contacted (Waves 1 and 2).
With the focus on Parent 1 and the Study Child, response rates for Parent 2 were
quite low in Waves 1 and 2 and so Wave 3 data were not collected from Parent 2.
Wave 4 interviews were redesigned to focus only on Dads (either fathers or men
performing a father–like role in a Study Child’s life). This is because the majority of
respondents in Waves 1 and 2 were Dads. Dads in some cases were also the primary
caregiver (P1). In these situations, the choice to complete the entire survey or an
abridged version, with overlapping questions from the P1 survey removed, was
offered to the Dad.
Study Child—Study Children themselves complete the vocabulary assessments,
practical exercises (such as “Who am I?”) and answer interview questions (as
appropriate to their age). In addition, their height and weight is measured (in most
cases by the interviewer). Study Child data include both face-to-face interview
questions and direct assessments.
Teachers/child care workers—some teachers/carers completed questionnaires
that included their observations of the Study children (all waves). In early waves,
these records were relatively few in number. Teacher/Carer data collected from
Waves 1 to 3 were included in Release 3.1, and Wave 4 data was included in
Release 4.1.
Teacher/Carer questionnaires are typically completed on paper, and the data entered
by DSS staff. Alternatively, teachers/carers are able to complete questionnaires
online or with a RAO. Missing data in the paper copies are coded as refusals when the
data is entered.
LSIC Data User Guide, Release 7—March 2016 10
DATA COLLECTION
Consent process
The process for obtaining informed consent from the Study Child’s parents or carers and
their family, teachers and carers is an integral part of the Study.
Prior to being interviewed for the first time, parents were provided with an introductory
letter and a DVD describing the Study and the consent process. At the interview RAOs went
through each consent form with the participant/s and explained what permission was being
sought. This enabled parents to make informed consent about their participation in the
Study. A plain language statement was also available for parents who preferred to read
about the Study. Parents gave consent on behalf of the Study Child.
As well as seeking permission to take part in the Study participants were separately asked
for consent to:
be voice recorded for the interview
allow the other parent or another carer to be contacted
allow the child’s teacher or child care worker to be contacted
allow the Study Child to be photographed
At the conclusion of the consent process, participants were given a summary sheet that
recorded what they had agreed to. This sheet included contact details for the ethics
committee and DSS. Participants were informed that they could change their consent and
are able to withdraw from the Study at any time.
With Release 2.0, the records of six study children and their families were removed from the
Wave 1 datasets because of irregularities in their administrative records. With Release 3.1,
one of the six study children removed from Release 2.0 was placed back into the datasets,
however another Study Child was removed from the datasets upon the request of their
primary carer.
Fieldwork periods
The Wave 7 pilot was conducted in August and September 2013 and the main round of
interviews were conducted between 22 February 2014 and 17 December 2014. Although it
is the aim of the Study to interview participants at 12 month intervals, this is not always
possible because of the availability of respondents and the logistics of interviewers’ travel
arrangements and scheduling. Nonetheless, the average time between Waves 6 and 7
interviews was 11 months. Table 2 shows the fieldwork periods for Waves 1 to 7.

LSIC Data User Guide, Release 7—March 2016 11
Table 2: Fieldwork periods
Wave Pilot Main
1 2006-2007 and Jan 2008 21 April 2008 to 23 Feb 2009
2 Nov 2008 3 March to 17 Dec 2009
3 Oct 2009 3 March to 23 Dec 2010
4 Oct 2010 7 March to 18 Dec 2011
5 Oct 2011 17 March to 19 Dec 2012
6 Sep 2012 25 February to 14 Dec 2013
7 Aug-Sept 2013 22 February to 17 Dec 2014
Fieldwork response
Out of the 1,239 families who participated in Wave 6, Footprints in Time interviewers
successfully interviewed 1,074 families in Wave 7, achieving an overall response rate of
86.7 per cent between the two waves. Table 3 shows fieldwork responses for Waves 1
to 7.
Table 3: Fieldwork response from Wave 1 to Wave 6
Wave Previous wave
respondents
interviewed
Additional
interviews
Total
interviews
% of retention
from previous
wave
1 n/a n/a 1,671 n/a
2 1,435 88* 1,523 85.9
3 1,312 92** 1,404 86.1
4 1,150 133** 1,283 81.9
5 1,097 161** 1,258 85.5
6 1,068 171** 1,239 84.9
7 1,074 179** 1,253 86.7
* New entrants in Wave 2
** Interviewed in the current wave, but not the wave prior
n/a not applicable
Notes: New entrants were admitted into study in Wave 2, but not in subsequent waves.
Table excludes children removed from datasets for administrative reasons.
New entrants
In order to maintain the viability of the sample in remote regions and meet the requests of
a small number of families who expressed a strong wish to be part of the Study, Footprints
in Time added 88 new entrant families to the Study in Wave 2. With the addition of 88 new
entrant families, the total number of responses achieved in Wave 2 was 1,523. Seventy-
three of the 88 new entrant P1s answered questions specifically directed to new entrants
and a further six of those new entrants later answered those questions in Wave 3
(however these responses were merged back into the Wave 2 data file). The other nine
LSIC Data User Guide, Release 7—March 2016 12
Wave 2 new entrants have missing data for new entrant questions, however they did
respond to the P1 questions that were asked of continuing participants.
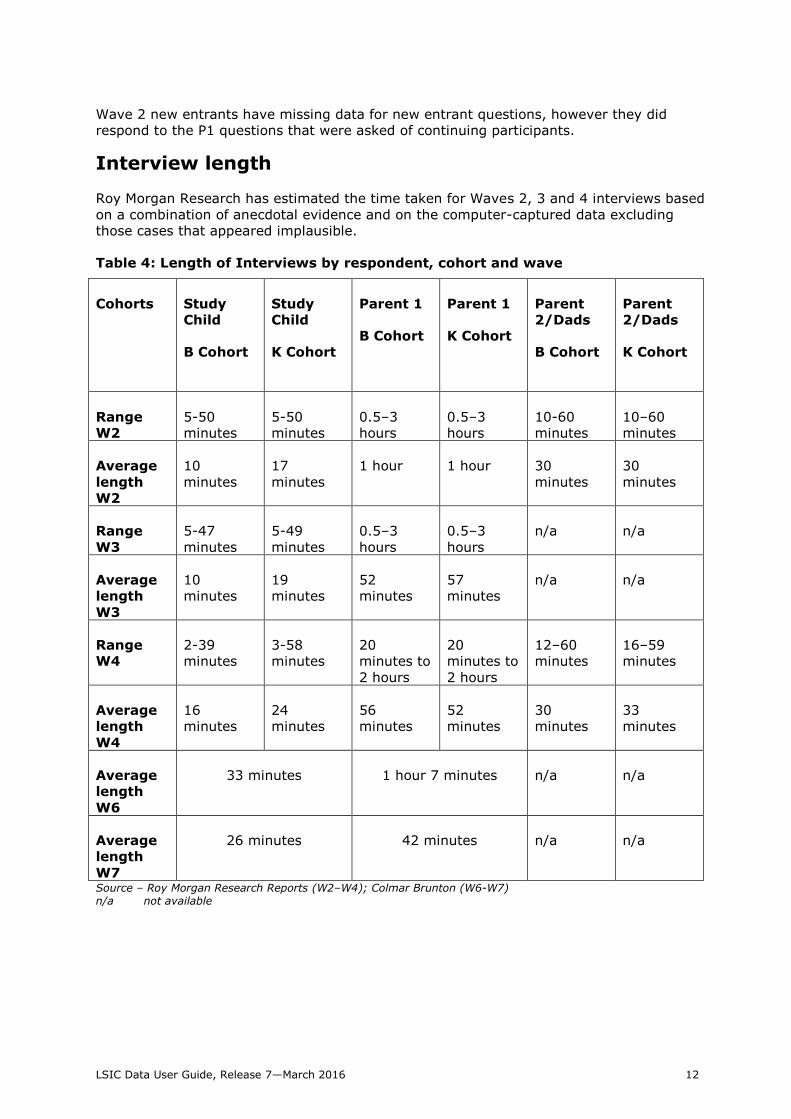
Interview length
Roy Morgan Research has estimated the time taken for Waves 2, 3 and 4 interviews based
on a combination of anecdotal evidence and on the computer-captured data excluding
those cases that appeared implausible.
Table 4: Length of Interviews by respondent, cohort and wave
Cohorts Study
Child
B Cohort
Study
Child
K Cohort
Parent 1
B Cohort
Parent 1
K Cohort
Parent
2/Dads
B Cohort
Parent
2/Dads
K Cohort
Range
W2
5-50
minutes
5-50
minutes
0.5–3
hours
0.5–3
hours
10-60
minutes
10–60
minutes
Average
length
W2
10
minutes
17
minutes
1 hour 1 hour 30
minutes
30
minutes
Range
W3
5-47
minutes
5-49
minutes
0.5–3
hours
0.5–3
hours
n/a n/a
Average
length
W3
10
minutes
19
minutes
52
minutes
57
minutes
n/a n/a
Range
W4
2-39
minutes
3-58
minutes
20
minutes to
2 hours
20
minutes to
2 hours
12–60
minutes
16–59
minutes
Average
length
W4
16
minutes
24
minutes
56
minutes
52
minutes
30
minutes
33
minutes
Average
length
W6
33 minutes 1 hour 7 minutes n/a n/a
Average
length
W7
26 minutes 42 minutes n/a n/a
Source – Roy Morgan Research Reports (W2–W4); Colmar Brunton (W6-W7) n/a not available
LSIC Data User Guide, Release 7—March 2016 13
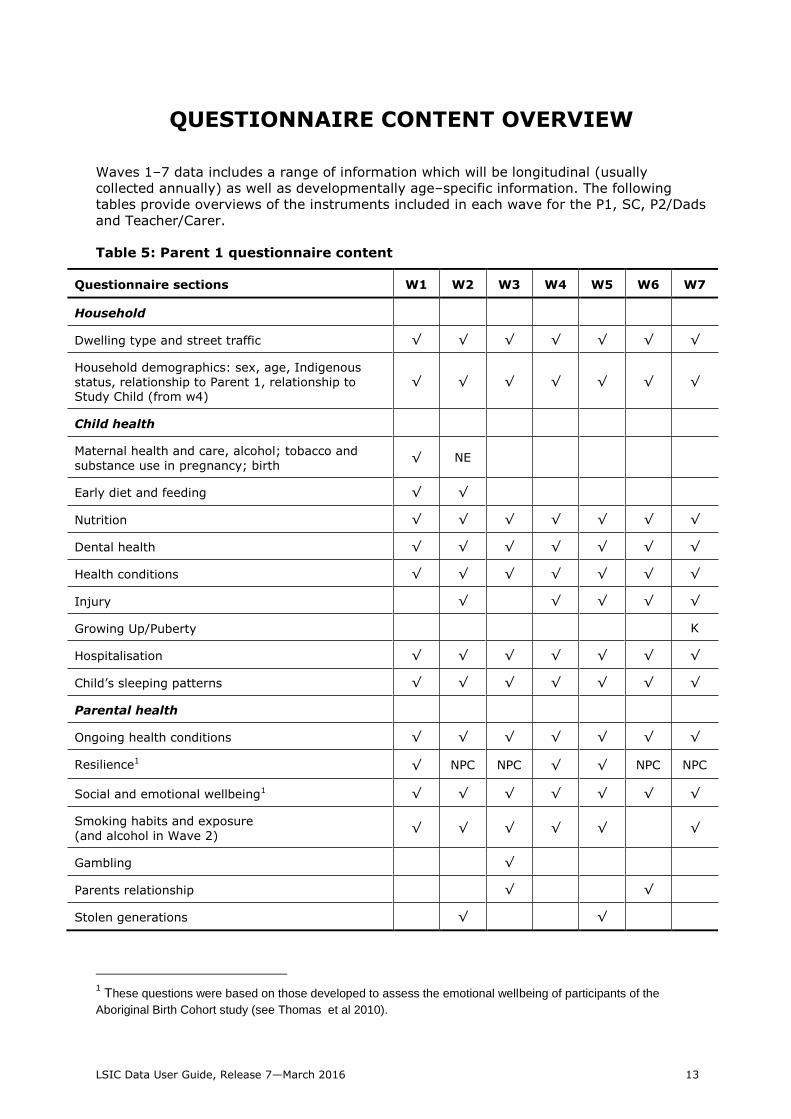
QUESTIONNAIRE CONTENT OVERVIEW
Waves 1–7 data includes a range of information which will be longitudinal (usually
collected annually) as well as developmentally age–specific information. The following
tables provide overviews of the instruments included in each wave for the P1, SC, P2/Dads
and Teacher/Carer.
Table 5: Parent 1 questionnaire content
Questionnaire sections W1 W2 W3 W4 W5 W6 W7
Household
Dwelling type and street traffic √ √ √ √ √ √ √
Household demographics: sex, age, Indigenous
status, relationship to Parent 1, relationship to Study Child (from w4)
√ √ √ √ √ √ √
Child health
Maternal health and care, alcohol; tobacco and
substance use in pregnancy; birth √ NE
Early diet and feeding √ √
Nutrition √ √ √ √ √ √ √
Dental health √ √ √ √ √ √ √
Health conditions √ √ √ √ √ √ √
Injury √ √ √ √ √
Growing Up/Puberty K
Hospitalisation √ √ √ √ √ √ √
Child’s sleeping patterns √ √ √ √ √ √ √
Parental health
Ongoing health conditions √ √ √ √ √ √ √
Resilience1 √ NPC NPC √ √ NPC NPC
Social and emotional wellbeing1 √ √ √ √ √ √ √
Smoking habits and exposure
(and alcohol in Wave 2) √ √ √ √ √ √
Gambling √
Parents relationship √ √
Stolen generations √ √
1 These questions were based on those developed to assess the emotional wellbeing of participants of the
Aboriginal Birth Cohort study (see Thomas et al 2010).

LSIC Data User Guide, Release 7—March 2016 14
Questionnaire sections W1 W2 W3 W4 W5 W6 W7
Parent living elsewhere √ √ √ √ √ √
Child and family functioning
Child social, emotional development K B
Strengths and Difficulties © Robert Goodman √ K √
Physical ability √ √ √ √ √ B
Child temperament K B K
Brief Infant Toddler Social and Emotional
Assessment B
Parent concerns about language and development √ √ √ B √ B
Parental warmth, monitoring, consistency K B K B √ √
Parenting empowerment and efficacy √ √
Peers and friends K K
Major life events √ √ √ √ √ √ √
Socio-demographics
Participant language, culture and religion √ NPC NPC NPC NPC NPC NPC
Child languages, cultural practices √ NE B √
Parental education √ NPC NPC √ √
Work √ √ √ √ √ √ √
Partner’s work, education √ √ √ √ √
Financial stress and income √ √ √ √ √ √ √
Child support and maintenance √ √ √
Housing and mobility √ √ √ √ √ √ √
Perceived community safety √ √
Child care and early education √ √ √ B B B √
School K K K √ √ √
High school intentions K
Bullying √
After school activities √
Activities √ √ √ √ √ √ √
Interviewer questions √ √ √ √ √ √
Note: √ – asked of both cohorts, B – asked only of the younger B cohort, K – asked only of the older (K) cohort, NE –asked only of new entrants, NPC –asked only of new primary carers.

LSIC Data User Guide, Release 7—March 2016 15
Table 6: Study Child questionnaire content and direct measures
Questionnaire sections W1 W2 W3 W4 W5 W6 W7
Vocabulary – expressive K K K B B B
Vocabulary checklist for babies B B B
Who Am I? K K K B B B
Favourite things K B √ √
School K K K √ K
Height and weight √ √ √ √ √ √ √
Drawing task K B
MATRIX reasoning (from WISC-IV) K K √
Progressive Achievement Tests in
Reading (PAT-R) K K K B
Progressive Achievement Tests in
Mathematics (PAT-Maths) K K
Child social and emotional wellbeing K √
Family and friends K √
Note: √ – asked of both cohorts, B – asked only of the younger (B) cohort, K – asked only of the older (K) cohort.
LSIC Data User Guide, Release 7—March 2016 16
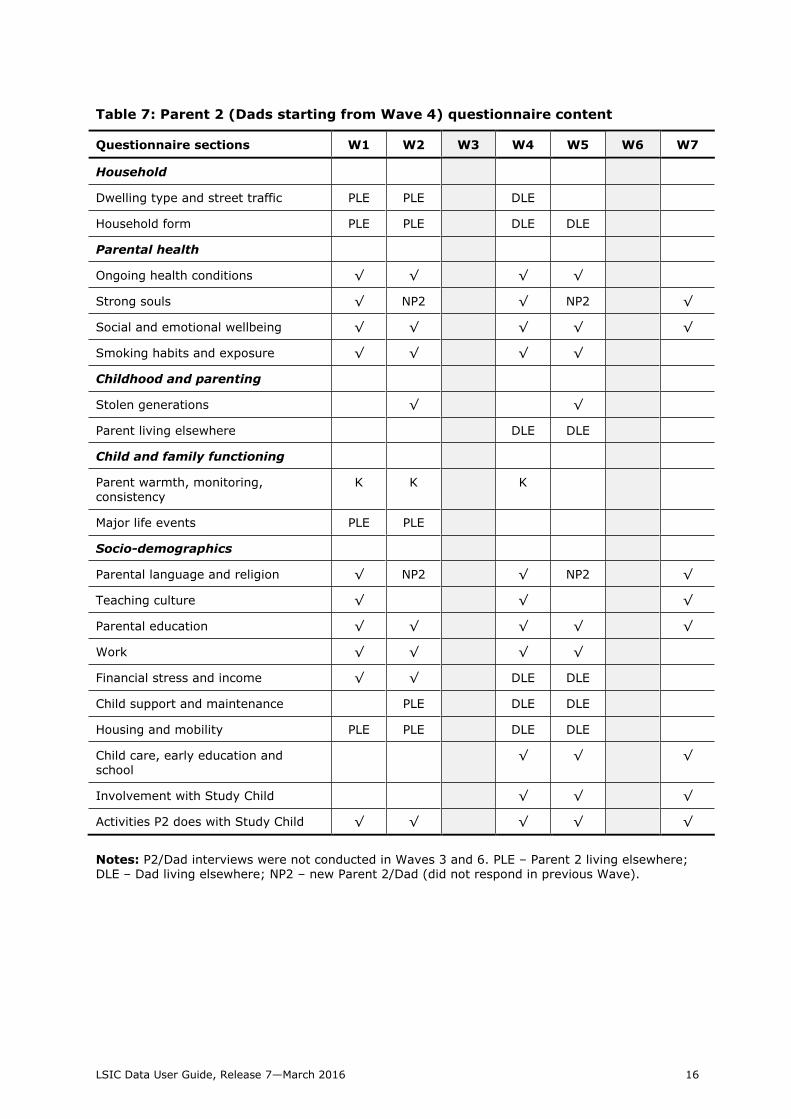
Table 7: Parent 2 (Dads starting from Wave 4) questionnaire content
Questionnaire sections W1 W2 W3 W4 W5 W6 W7
Household
Dwelling type and street traffic PLE PLE DLE
Household form PLE PLE DLE DLE
Parental health
Ongoing health conditions √ √ √ √
Strong souls √ NP2 √ NP2 √
Social and emotional wellbeing √ √ √ √ √
Smoking habits and exposure √ √ √ √
Childhood and parenting
Stolen generations √ √
Parent living elsewhere DLE DLE
Child and family functioning
Parent warmth, monitoring,
consistency
K K K
Major life events PLE PLE
Socio-demographics
Parental language and religion √ NP2 √ NP2 √
Teaching culture √ √ √
Parental education √ √ √ √ √
Work √ √ √ √
Financial stress and income √ √ DLE DLE
Child support and maintenance PLE DLE DLE
Housing and mobility PLE PLE DLE DLE
Child care, early education and school
√ √ √
Involvement with Study Child √ √ √
Activities P2 does with Study Child √ √ √ √ √
Notes: P2/Dad interviews were not conducted in Waves 3 and 6. PLE – Parent 2 living elsewhere; DLE – Dad living elsewhere; NP2 – new Parent 2/Dad (did not respond in previous Wave).
LSIC Data User Guide, Release 7—March 2016 17
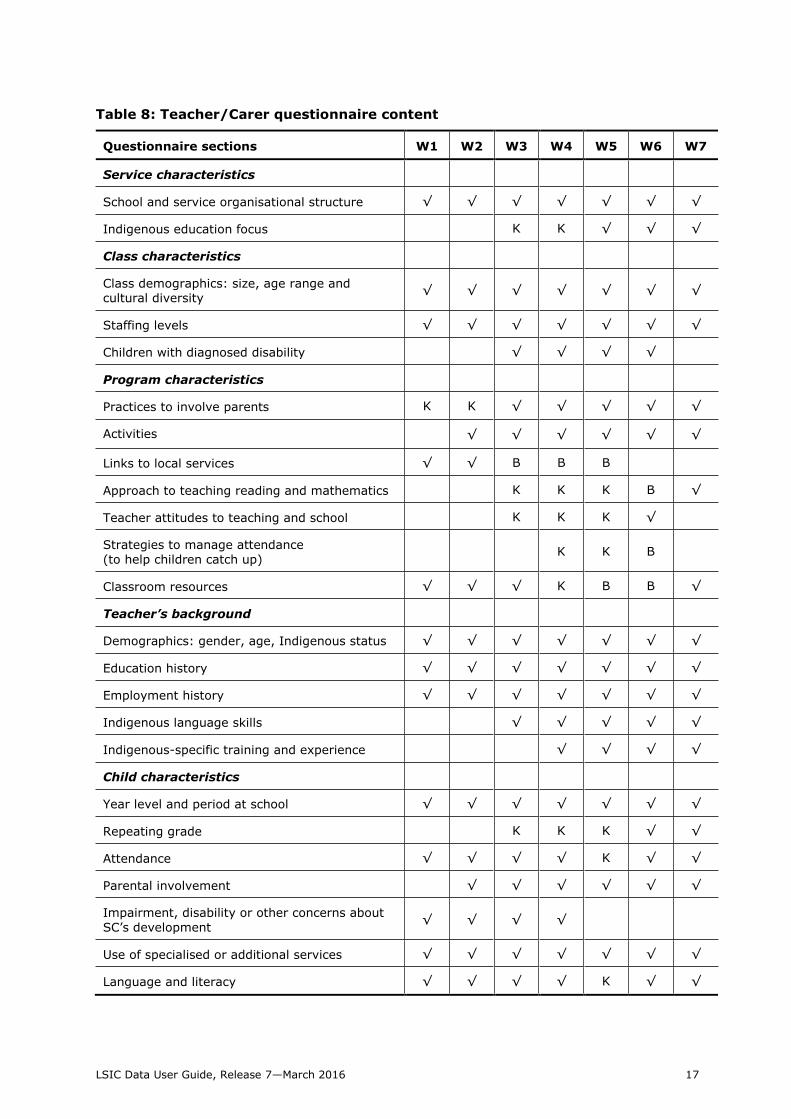
Table 8: Teacher/Carer questionnaire content
Questionnaire sections W1 W2 W3 W4 W5 W6 W7
Service characteristics
School and service organisational structure √ √ √ √ √ √ √
Indigenous education focus K K √ √ √
Class characteristics
Class demographics: size, age range and
cultural diversity √ √ √ √ √ √ √
Staffing levels √ √ √ √ √ √ √
Children with diagnosed disability √ √ √ √
Program characteristics
Practices to involve parents K K √ √ √ √ √
Activities √ √ √ √ √ √ √
Links to local services √ √ B B B
Approach to teaching reading and mathematics K K K B √
Teacher attitudes to teaching and school K K K √
Strategies to manage attendance
(to help children catch up) K K B
Classroom resources √ √ √ K B B √
Teacher’s background
Demographics: gender, age, Indigenous status √ √ √ √ √ √ √
Education history √ √ √ √ √ √ √
Employment history √ √ √ √ √ √ √
Indigenous language skills √ √ √ √ √
Indigenous-specific training and experience √ √ √ √
Child characteristics
Year level and period at school √ √ √ √ √ √ √
Repeating grade K K K √ √
Attendance √ √ √ √ K √ √
Parental involvement √ √ √ √ √ √
Impairment, disability or other concerns about
SC’s development √ √ √ √
Use of specialised or additional services √ √ √ √ √ √ √
Language and literacy √ √ √ √ K √ √

LSIC Data User Guide, Release 7—March 2016 18
Questionnaire sections W1 W2 W3 W4 W5 W6 W7
Child characteristics (continued)
Mathematics and numeracy √ √ √ √ K √ √
Social, emotional and physical development K K √ √ √
Strengths and Difficulties
© Robert Goodman K √ √ √ √
Teacher prediction for SC’s education K √ √
Teacher/SC relationship √ √ √ √ √
Comments and observations √ √ √ √ √ √ √
Note: √ – asked of both cohorts, B – asked only of the younger (B) cohort, K – asked only of the older (K) cohort.

LSIC Data User Guide, Release 7—March 2016 19
USING THE DATASETS
Table 9 shows the number of records in each file in Release 7.
Table 9: Number of records for each file
Note: Numbers in the datasets may vary from previous releases either because of administrative irregularities
or if participants have requested that their data be removed from the Study. n/a not applicable
Locating variables
To locate variables of interest, look through the marked-up questionnaires and/or the Data
Dictionary. The marked-up questionnaires provide the full wording and sequencing of all
questions, and the variable names and answer categories for all variables. The Data
Dictionary is an Excel workbook providing details of all variables in the LSIC datasets.
There is one worksheet which contains all survey instruments: P1, P2/Dads, SC and TC.
The worksheet contains the variables for all released waves of data. The Data Dictionary
can be searched using filters to find variables of interest.
A description of each of the columns in the Data Dictionary can be found at Appendix A.
Variable naming convention
The variable naming convention was developed so that variables have predictable names
across waves and informants, and so that thematically linked variables have similar names
wherever possible. LSIC variables are a maximum of eight characters in length. The
variable name is comprised of four parts and provides information on the content of the
variable.
First character—wave identifier: a=Wave 1, b=Wave 2, c=Wave 3 and d=Wave 4.
Second character—subject/informant: a=Parent 1, b=Parent 2/Dads, c=Study Child,
and d=Teacher/Carer.
Third and fourth character—topic name, such as HF for household form, SS for
Strong Souls, etc.
Dataset Wave 1 Wave 2 Wave 3 Wave 4 Wave 5 Wave 6 Wave 7
Parent 1 1,671 1,523 1,404 1,283 1,258 1,239 1,253
Parent 2/Dads 257 269 n/a 213 180 n/a 222
Study Child 1,469 1,472 1,394 1,269 1,244 1,241 1,244
Teacher/Carer 44 163 326 442 473 541 549
LSIC Data User Guide, Release 7—March 2016 20
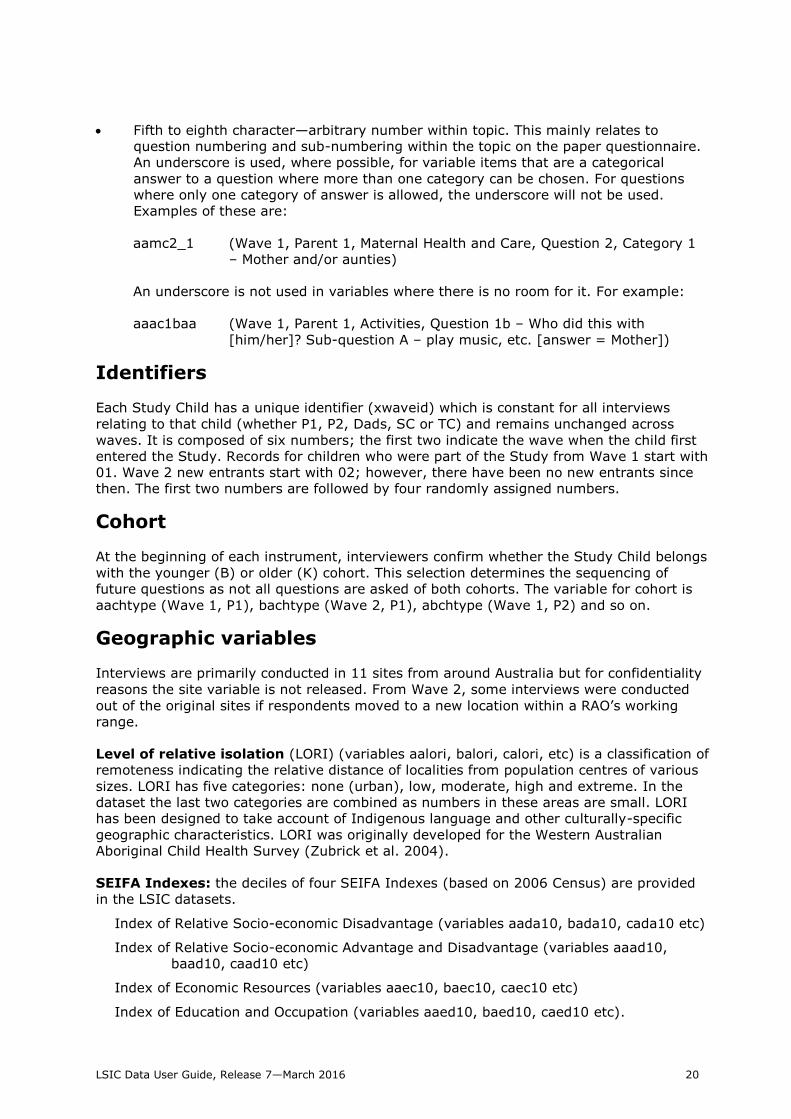
Fifth to eighth character—arbitrary number within topic. This mainly relates to
question numbering and sub-numbering within the topic on the paper questionnaire.
An underscore is used, where possible, for variable items that are a categorical
answer to a question where more than one category can be chosen. For questions
where only one category of answer is allowed, the underscore will not be used.
Examples of these are:
aamc2_1 (Wave 1, Parent 1, Maternal Health and Care, Question 2, Category 1
– Mother and/or aunties)
An underscore is not used in variables where there is no room for it. For example:
aaac1baa (Wave 1, Parent 1, Activities, Question 1b – Who did this with
[him/her]? Sub-question A – play music, etc. [answer = Mother])
Identifiers
Each Study Child has a unique identifier (xwaveid) which is constant for all interviews
relating to that child (whether P1, P2, Dads, SC or TC) and remains unchanged across
waves. It is composed of six numbers; the first two indicate the wave when the child first
entered the Study. Records for children who were part of the Study from Wave 1 start with
01. Wave 2 new entrants start with 02; however, there have been no new entrants since
then. The first two numbers are followed by four randomly assigned numbers.
Cohort
At the beginning of each instrument, interviewers confirm whether the Study Child belongs
with the younger (B) or older (K) cohort. This selection determines the sequencing of
future questions as not all questions are asked of both cohorts. The variable for cohort is
aachtype (Wave 1, P1), bachtype (Wave 2, P1), abchtype (Wave 1, P2) and so on.
Geographic variables
Interviews are primarily conducted in 11 sites from around Australia but for confidentiality
reasons the site variable is not released. From Wave 2, some interviews were conducted
out of the original sites if respondents moved to a new location within a RAO’s working
range.
Level of relative isolation (LORI) (variables aalori, balori, calori, etc) is a classification of
remoteness indicating the relative distance of localities from population centres of various
sizes. LORI has five categories: none (urban), low, moderate, high and extreme. In the
dataset the last two categories are combined as numbers in these areas are small. LORI
has been designed to take account of Indigenous language and other culturally-specific
geographic characteristics. LORI was originally developed for the Western Australian
Aboriginal Child Health Survey (Zubrick et al. 2004).
SEIFA Indexes: the deciles of four SEIFA Indexes (based on 2006 Census) are provided
in the LSIC datasets.
Index of Relative Socio-economic Disadvantage (variables aada10, bada10, cada10 etc)
Index of Relative Socio-economic Advantage and Disadvantage (variables aaad10,
baad10, caad10 etc)
Index of Economic Resources (variables aaec10, baec10, caec10 etc)
Index of Education and Occupation (variables aaed10, baed10, caed10 etc).

LSIC Data User Guide, Release 7—March 2016 21
Index of Relative Indigenous Socioeconomic Outcomes (IRISEO) is a measure of
community level socioeconomic advantage based on a principal components analysis of
nine variables from the 2006 Census—three related to employment, three related to
education, two related to housing and one related to income. Unlike the similar and better
known Socioeconomic Indexes for Areas (SEIFA), this measure is calculated specifically for
Indigenous Australians (Biddle 2011). The LSIC datasets contain IRISEO deciles (variables
aair10, bair10, cair10, etc).
Randomised cluster
Since LSIC respondents are geographically clustered around 11 study sites, statistical
models used to analyse the data may produce biased results which could lead to erroneous
research conclusions. To overcome this, starting from Release 5.0, LSIC datasets include a
cluster variable which identifies respondents living in close geographical proximity. The
cluster variable is a number between 1 and 542, with each number corresponding to an
ABS Indigenous Area.
The cluster numbers have been randomly assigned to an Indigenous Area so that actual
location is not revealed. The cluster variable is aarclus, barclus, carclus etc. For
information about the effect of sample clustering see Implications of the Study design for
analysis and results by Dr Belinda Hewitt at <www.dss.gov.au/LSIC>.
Household form
The household form in the P1 instrument collects basic demographic information (age, sex,
Indigenous status, relationship to P1 and relationship to SC2) of all members of the
household. Prior to Release 1.2 the information for P1, P2 and Study Child were entered
into the first three places and other household members could be enumerated in any
order. This meant that a particular individual could be member 4 in Wave 1 and member 6
in Wave 2. As researchers are not given access to the names of household members, it
would be impossible to analyse movements of individuals in and out of households.
To overcome this problem, the household data was reorganised from Release 1.2 so that
each individual has a permanent household member number/position. All data is missing if
the member is not present in that wave. The Study Child is always member 1. The P1 in
Wave 1 is always member 2, even when they are no longer the P1. The P2 in Wave 1 is
member 3 (if there was a P2 in the household). Other household members take positions 4
onwards. If a new member joins the household they are given the next free position.
Separate variables identify the member numbers of P1 and P2 (if present) in each wave.
The household form collects date of birth rather than age for the Study Child (as well as P1
and P2). As child development occurs rapidly over the early years, a variable for the Study
Child’s age in months at the time of interview (#ascagem) has been derived to enable
relevant analysis. Note that the Study Child’s age in months is also available on the Study
Child file (#cscagem). From wave 5, #cscagem is calculated based on the date of the
Study Child interview, which in some cases differs significantly from the P1 interview date.
Family composition variables
A number of derived variables are included in the P1 dataset to describe the household
composition and summarise information about presence of the Study Child’s extended
family. These variables are derived for all previous waves where the data required for such
derivation are available.
2 Starting from Wave 4.

LSIC Data User Guide, Release 7—March 2016 22
In all waves, P1 was asked about their relationship to every other person in the
household. In addition, starting from wave 4, P1 is asked how every person in the
household is related to the Study Child. To make the best use of the available information,
two sets of household variables were derived, some that are available in all waves and
others starting from wave 4.
Variables available in all waves
#ahhtype: this variable describes Study Child’s household based on four aspects:
whether P1 is a parent (including step, adoptive or foster) of the Study Child or an
otherwise related or unrelated carer
whether P1 indicated they had a partner in the household (otherwise classified as
lone parent/carer)
whether there are other children aged 15 years or younger in the household
whether there are other adults aged 16 years or older in the household (these may
include Study Child’s older siblings).
The resulting 16 categories are presented below.
#ahhtype Study Child lives with…*
1 Parent & partner
2 Parent & partner, other adults
3 Parent & partner, children <16
4 Parent & partner, children <16, other adults
5 Lone parent
6 Lone parent, other adults
7 Lone parent, children <16
8 Lone parent, children <16, other adults
9 Carer & partner
10 Carer & partner, other adults
11 Carer & partner, children <16
12 Carer & partner, children <16, other adults
13 Lone carer
14 Lone carer, other adults
15 Lone carer, children <16
16 Lone carer, children <16, other adults
Note: *’Parent’ including step, adoptive or foster parents.
#ahhp1ms: Parent 1 is partnered. This is a binary variable which takes the value of 1 if
P1 indicated they had a partner in the household, and 0 otherwise. The definition of
partner includes husband or wife, fiancé/fiancée, de-facto, and boyfriend or girlfriend, as
well as same sex partners. This variable may provide conflicting information to #ahf13
“P1 is partnered (as marked by RAO)” which was asked starting from wave 3 to collect
more accurate information in cases where P1 did not wish to list live-in partner as part of
the household.
Variables available from Wave 4 onwards
#ahh_* variables: Presence in household of SC’s [relative/nonrelative]. These are binary
variables which take the value of 1 if a relative/person is present in the Study Child’s
household and 0 otherwise. For details, please see Table 10.
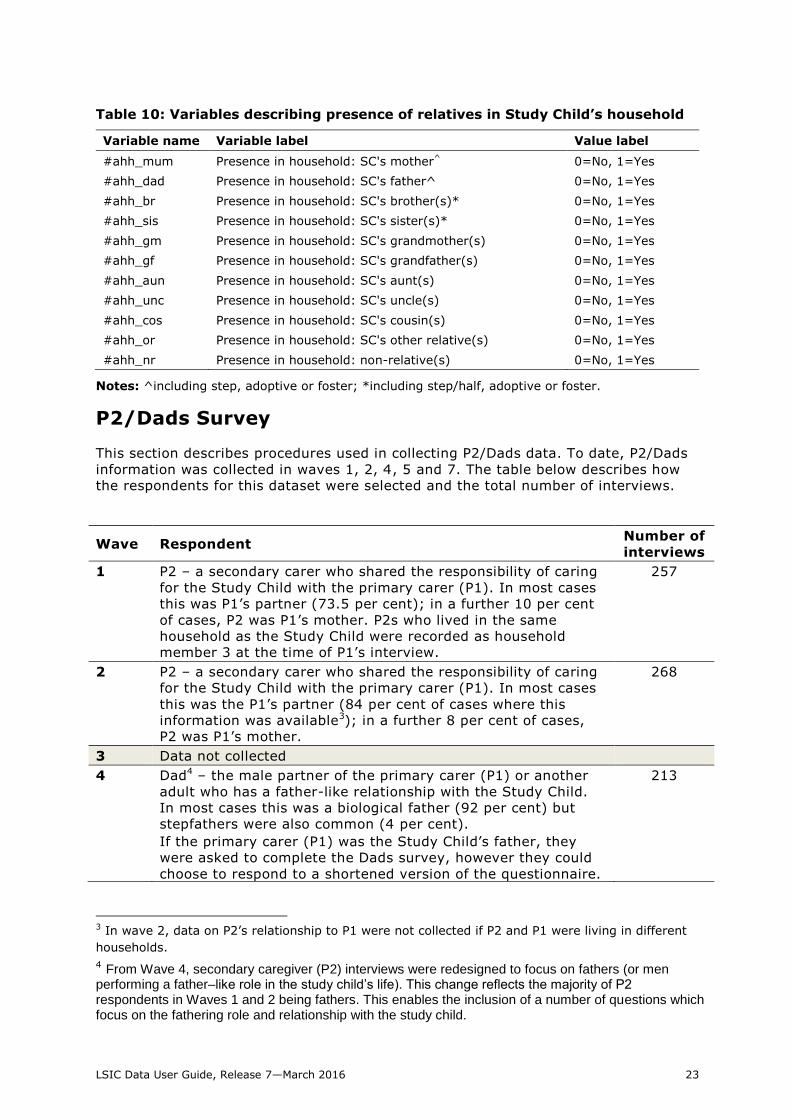
LSIC Data User Guide, Release 7—March 2016 23
Table 10: Variables describing presence of relatives in Study Child’s household
Variable name Variable label Value label
#ahh_mum Presence in household: SC's mother^ 0=No, 1=Yes
#ahh_dad Presence in household: SC's father^ 0=No, 1=Yes
#ahh_br Presence in household: SC's brother(s)* 0=No, 1=Yes
#ahh_sis Presence in household: SC's sister(s)* 0=No, 1=Yes
#ahh_gm Presence in household: SC's grandmother(s) 0=No, 1=Yes
#ahh_gf Presence in household: SC's grandfather(s) 0=No, 1=Yes
#ahh_aun Presence in household: SC's aunt(s) 0=No, 1=Yes
#ahh_unc Presence in household: SC's uncle(s) 0=No, 1=Yes
#ahh_cos Presence in household: SC's cousin(s) 0=No, 1=Yes
#ahh_or Presence in household: SC's other relative(s) 0=No, 1=Yes
#ahh_nr Presence in household: non-relative(s) 0=No, 1=Yes
Notes: ^including step, adoptive or foster; *including step/half, adoptive or foster.
P2/Dads Survey
This section describes procedures used in collecting P2/Dads data. To date, P2/Dads
information was collected in waves 1, 2, 4, 5 and 7. The table below describes how
the respondents for this dataset were selected and the total number of interviews.
Wave Respondent Number of
interviews
1 P2 – a secondary carer who shared the responsibility of caring
for the Study Child with the primary carer (P1). In most cases
this was P1’s partner (73.5 per cent); in a further 10 per cent
of cases, P2 was P1’s mother. P2s who lived in the same
household as the Study Child were recorded as household
member 3 at the time of P1’s interview.
257
2 P2 – a secondary carer who shared the responsibility of caring
for the Study Child with the primary carer (P1). In most cases
this was the P1’s partner (84 per cent of cases where this
information was available3); in a further 8 per cent of cases,
P2 was P1’s mother.
268
3 Data not collected
4 Dad4 – the male partner of the primary carer (P1) or another
adult who has a father-like relationship with the Study Child.
In most cases this was a biological father (92 per cent) but
stepfathers were also common (4 per cent).
If the primary carer (P1) was the Study Child’s father, they
were asked to complete the Dads survey, however they could
choose to respond to a shortened version of the questionnaire.
213
3 In wave 2, data on P2’s relationship to P1 were not collected if P2 and P1 were living in different
households.
4 From Wave 4, secondary caregiver (P2) interviews were redesigned to focus on fathers (or men performing a father–like role in the study child’s life). This change reflects the majority of P2 respondents in Waves 1 and 2 being fathers. This enables the inclusion of a number of questions which focus on the fathering role and relationship with the study child.

LSIC Data User Guide, Release 7—March 2016 24
Wave Respondent Number of
interviews
In these cases, their relationship to P1 is described as ‘self’
and the skipped questions coded as ‘Not asked’.
5 Dad – the primary carer’s male partner or another adult who
has a father-like relationship with the Study Child. In most
cases this was a biological father (92 per cent) but stepfathers
were also common (4 per cent).
In wave 5, there were no cases where Dad was also the Study
Child’s P1.
180
6 Data not collected
7 Dad – the primary carer’s male partner or another adult who
has a father-like relationship with the Study Child. In most
cases this was a biological father (86 per cent) but stepfathers
were also common (10 per cent).
In wave 7, there were no cases where Dad was also the Study
Child’s P1.
180
Derived variables
As the names of respondents are not released to data users, in order to allow
researchers to track respondents to the P2/Dads surveys across waves, two derived
variables are provided.
#bhhp2mn: P2/Dad’s member number in Study Child’s household. This variab le is
derived for all waves in which P2/Dads data has been collected by cross-checking
P2/Dad’s name, age and relationship to the Study Child5 with records of people living
in the Study Child’s household at the time of P1 interview. As the variable refers to
the time of P1’s interview, it may differ from variable #bp1p2sh collected at the time
of P2/Dad interview “P2/Dad lives in the same household as P1”.
#bresp: Cross-wave participation of P2/Dad [categorical variable]. This variable
provides information on whether the person responding to the P2/Dads survey in the
current wave participated in all waves and in what capacity:
0 the respondent did not participate in a wave
1 the respondent participated as a P1 (even if they also did a Dads interview)
2 the respondent participated as a P2/Dad.
Example: ebresp of 01022 indicates that the respondent did not participate in wave 1
in any capacity, responded as P1 in wave 2, did not participate in wave 3, and
completed Dads interview in waves 4 and 5.
Please note that the third digit of bresp can only be 0 or 1 (if Dad participated in wave
3 as a P1) since there was no P2/Dad survey in wave 3.
Direct assessments of child development
Direct measures include the Who Am I? developmental assessment and the Renfrew Word
Finding Vocabulary Test, which were undertaken by the B cohort in Waves 4 to 6 and the K
cohort in Waves 1 to 3. These verbal and non–verbal measures assess processes that
underlie the learning of early literacy and numeracy skills. The measures start at a point
5 From wave 4 onwards.

LSIC Data User Guide, Release 7—March 2016 25
where the vast majority of children experience some success. Although the measures are
designed to progressively get more difficult, they are stopped when the child is unable to
complete the more difficult items. Both of these direct assessments can provide
information about the extent to which a child is ready for the early years classroom tasks
that are associated with subsequent literacy and numeracy development at school.
Direct measures also include child height and weight, collected for both cohorts across all
waves.
Who Am I?
Who am I? (de Lemos & Doig 1999) is a developmental assessment that requires the child
to write their name, copy shapes, write letters, numbers and words in a small booklet, with
simple instructions and encouragement from the interviewer. Who am I? is not language
dependent and is suitable for children with limited English. The assessment takes about
10 minutes to complete and is suitable for preschool children and children in the first two
years of school.
Renfrew Word Finding Vocabulary Test
The Renfrew Word Finding Vocabulary Test (Renfrew 1998) assesses children’s expressive
vocabulary – compared, for instance, with the Peabody Picture Vocabulary Test (Dunn &
Dunn 2007), which is a test of receptive vocabulary. The Renfrew Word Finding Vocabulary
Test assesses a child’s ability to accurately describe images as portrayed in the 50 pictures
contained in the assessment. Children can respond in languages other than English.
The test was chosen for LSIC, in consultation with Dr Nola Purdie of the Australian Council
for Educational Research (ACER). It has been normed in the UK and in New Zealand
(Renfrew 1998). The Renfrew pictures are simple and clear and often represent things
from everyday life such as a cup, a kangaroo and a pineapple. All LSIC children, regardless
of age, start with the first picture and are presented with one picture at a time until the
child has provided no correct response to six in a row. The next six pictures are then
spread out and if the child can name at least one of the next six, they are presented with
the next six. No further cards are presented once the child can no longer provide at least
one correct answer for the six cards on display.
A child’s vocabulary is a good predictor of later reading abilities (Biemiller, 2007) and this
ability to communicate one’s ideas clearly and to understand the communication of others
are vital pre-requisite skills for learning in the classroom.
PAT-R – Progressive Achievement Tests in Reading
The LSIC K cohort was assessed with the Renfrew cards in Waves 1, 2 and 3. By Wave 3,
many of the students were being shown all of the Renfrew cards. LSIC Steering
Committee members requested a new measure that would develop with the children—that
is, have progressively more difficult, age-appropriate items. LSIC sought advice from
Dr Nola Purdie and others at the Australian Council for Educational Research (ACER) about
measures for assessing LSIC children’s educational development. ACER advised that the
Progressive Achievement Tests in Reading (PAT-R) Fourth Edition (ACER, 2008) would
indicate how well each child was learning to read English and would be an indicator of a
child’s general achievement.
ACER developed the PAT-R Fourth Edition tests to measure student achievement in
reading comprehension, vocabulary and spelling for use in Australian schools. Members of
the LSIC Steering Committee raised concerns that: the tests would be given to children
who might feel shamed if they could not answer all the items; the tests were not culturally
LSIC Data User Guide, Release 7—March 2016 26
relevant or fun; and the tests would not be administered at school but afterwards when
the children would be tired and not do as well.
Accordingly, the PAT-R Comprehension tests were adapted with permission and in
consultation with ACER. The adaptations made to the PAT-R Comprehension tests over
Waves 4, 5 and 6 include:
Reducing the number of stimulus texts and the number of items in the PAT-R
Comprehension tests (to varying extent depending on the year/level). This
increased the standard error around each measure, but was considered
unavoidable given the many other demands on students’ time.
Asking questions in order of difficulty, rather than in the original order.
Sequencing the students out of the assessment after a prescribed number of
incorrect responses.
Programming the questions onto the interviewers’ touch screen computers so the
children could answer themselves on screen, which they find more engaging than
the pencil and paper versions.
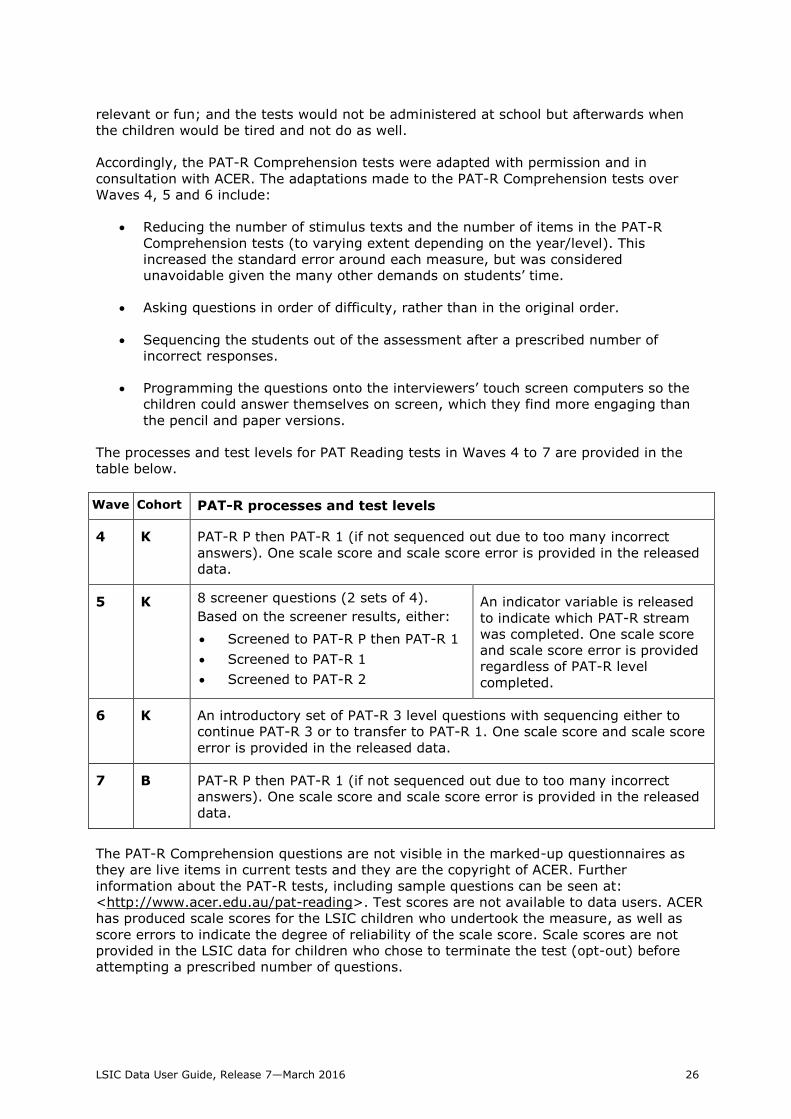
The processes and test levels for PAT Reading tests in Waves 4 to 7 are provided in the
table below.
Wave Cohort PAT-R processes and test levels
4 K PAT-R P then PAT-R 1 (if not sequenced out due to too many incorrect
answers). One scale score and scale score error is provided in the released
data.
5 K 8 screener questions (2 sets of 4).
Based on the screener results, either:
Screened to PAT-R P then PAT-R 1
Screened to PAT-R 1
Screened to PAT-R 2
An indicator variable is released
to indicate which PAT-R stream
was completed. One scale score
and scale score error is provided
regardless of PAT-R level
completed.
6 K An introductory set of PAT-R 3 level questions with sequencing either to
continue PAT-R 3 or to transfer to PAT-R 1. One scale score and scale score
error is provided in the released data.
7 B PAT-R P then PAT-R 1 (if not sequenced out due to too many incorrect
answers). One scale score and scale score error is provided in the released
data.
The PAT-R Comprehension questions are not visible in the marked-up questionnaires as
they are live items in current tests and they are the copyright of ACER. Further
information about the PAT-R tests, including sample questions can be seen at:
<http://www.acer.edu.au/pat-reading>. Test scores are not available to data users. ACER
has produced scale scores for the LSIC children who undertook the measure, as well as
score errors to indicate the degree of reliability of the scale score. Scale scores are not
provided in the LSIC data for children who chose to terminate the test (opt-out) before
attempting a prescribed number of questions.

LSIC Data User Guide, Release 7—March 2016 27
The scale scores are comparable across waves so that it is possible for data users to
assess progress over time, as well as compare students within LSIC waves. LSIC PAT-R
scores should not be compared with ACER published PAT-R scores or norms, due to
differences in the administration of assessments.
PAT Maths – Progressive Achievement Test in Mathematics
PAT Maths (© ACER) is a test of mathematics achievement (for detailed information,
including sample questions, please refer to <http://www.acer.edu.au/patmaths>). PAT
Maths assesses number, algebra, measurement, geometry, statistics and probability in
multiple-choice format. The assessments also address the mathematical processes of
understanding, fluency, problem solving and reasoning. The skills assessed by each
question are mapped against the Australian National Curriculum for Mathematics (ACER
2014).
LSIC started to administer PAT Maths in wave 6 (for the K cohort). In wave 6 the K cohort
were aged 8 and 9 years and most were in grades 3 and 4 at school. With the assistance
of ACER, 16 questions were selected covering a range of skills appropriate to these years
and programmed so that the easiest questions came first. Children were sequenced out
after a prescribed number of incorrect responses. In addition, a (hidden) timer was set up
for 16 minutes and, if reached, the test was concluded after the children finished the
question they were on.
Similar to the PAT-R measure, PAT Maths questions are not visible in the marked-up
questionnaires. Test scores are likewise not available to data users. ACER has produced
scale scores (Fourth Edition scale) for the LSIC children who undertook the measure, as
well as score errors to indicate the degree of reliability of the scale score. Scale scores are
not provided in the LSIC data for children who chose to terminate the test (opt-out) before
attempting a prescribed number of questions.
The scale scores will be comparable across waves so that it will be possible for data users
to assess progress over time, as well as compare students within LSIC waves. LSIC PAT
Maths scores should not be compared with ACER published PAT Maths scores or norms,
due to differences in the administration of assessments.
The processes and test levels for PAT Maths tests in Waves 6 to 7 are provided in the table
below.
Wave Cohort PAT-R processes and test levels
6 K A set of PAT-Maths level 3 questions with hidden timer set to 16 minutes.
Once 16 minutes reached, child finishes question currently completing and
is then sequenced to next section. One scale score and scale score error is
provided in the released data.
7 K A set of PAT-Maths level 4 questions with hidden timer set to 16 minutes.
Once 16 minutes reached, child finishes question currently completing and
is then sequenced to next section. One scale score and scale score error is
provided in the released data.
Matrix reasoning
In Waves 4 and 5, children in the K cohort undertook the Matrix Reasoning test (Wechsler
2003) from the Wechsler Intelligence Scale for Children, 4th edition (WISC-IV)6. In Wave 7
6 The ‘Wechsler Intelligence Scale for Children – Fourth Edition’ is copyrighted by Harcourt

LSIC Data User Guide, Release 7—March 2016 28
both the B and K cohort undertook the Matrix Reasoning test. It was chosen for LSIC
because it is a non‒verbal measure of abstract reasoning ability, so not language
dependent and had been used successfully in LSAC (AIFS 2011).
The children are shown an incomplete set of pictures or designs on the touchscreen laptop
and then choose the picture that completes the set from five different options. Children are
sequenced out if they provide an incorrect answer for four in a row, or four out of five in a
row. The instrument has 35 items of increasing complexity. LSIC children all start with
three practice questions.
The data file includes only scaled scores. The scale is scored based on the number of
correct items and the scores are then standardised based on age norms given in the WISC-
IV manual. Scores can range between 1 and 19.
Child height and weight
Child height and weight data have been collected at every wave, however these data were
not released prior to Release 3.1 because of concerns about their quality. Difficulties in
measuring babies or small children, and interviewer inexperience and/or equipment
problems, meant that data quality was worst in Wave 1 but improved in subsequent waves
as the children grew older and interviewer training, equipment and experience developed.
Despite the improvement over time, a significant data cleaning effort was required before
releasing the height and weight data to users. Birth weight data were of better quality and
were released prior to Release 3.1, but still benefited from further data cleaning.
For Releases 3.1, 4 and 5.0, Australian National University postgraduate student Katherine
Thurber generously donated her time to improve height and weight data quality through a
cleaning process as described below. This procedure has been used by DSS from wave 6
onwards.
The World Health Organization (WHO) Anthro and WHO Anthro Plus programs
(available from <http://www.who.int/childgrowth/software/en> and
<http://www.who.int/growthref/tools/en>) were used to translate weight and height
measurements to weight–for–age, height–for–age, and Body Mass Index (BMI)–for–
age z-scores7, based on the WHO Child Growth Standards. These Standards are based
on the results of the WHO Multicentre Growth Reference Study, which included 8,440
healthy infants from eight countries (Brazil, Ghana, India, Norway, Oman and the
United States) (WHO 2006).
Children were classified as underweight, healthy weight, overweight, or obese
according to WHO and International Obesity Taskforce cut-off points for BMI–for–age
z-scores. For all children, a BMI–for–age z-score below -2 represents Grade 2
Thinness (Cole et al. 2007). For children between the ages of 5 and 19 years, a BMI–
for–age z-score between -2 and +1 indicates a healthy weight, a z-score between +1
and +2 indicates overweight, and a z-score exceeding +2 indicates obesity (de Onis &
Lobstein 2010). The cut-off points for children zero to five years of age are more
conservative: a BMI–for–age z-score between -2 and +1 indicates a healthy weight, a
z-score between +1 and +2 indicates a risk of overweight, a z-score between +2 and
+3 indicates overweight, and a z-score exceeding +3 indicates obesity (de Onis &
Lobstein 2010).
Assessment, Inc., 2004. 7 Weight-for-age z-score is calculated for children aged 0-120 completed months, while
length/height-for-age and BMI-for-age z-scores are calculated for 0-228 completed months.

LSIC Data User Guide, Release 7—March 2016 29
Weights and heights were re-coded to “implausible value” if they fell outside the range
of values deemed plausible by the WHO (WHO 2012). Weights and weight-for-age z-
scores were recoded to implausible if the weight–for–age z-score or BMI–for–age z-
score fell outside ± 5. Heights and height–for–age z-scores were re-coded to
implausible if the height–for–age z-score fell outside ± 6 or the BMI–for–age z-score
fell outside ± 5. BMI values and BMI–for–age z-scores were re-coded to implausible if
the BMI–for–age z-score fell outside ± 5 or either weight–for–age or height–for–age
z-scores were outside of their respective plausible ranges. Measurements representing
implausible variation within children over time were also excluded. Decreases in
height between waves were considered physiologically impossible, and criteria were
used to identify the values to re-code to “implausible value.” Decreases in weight
between waves are physiologically possible, especially in the case of illness or trauma,
so a more conservative cleaning process was applied to the weight data. Decreases in
weight between waves that were associated with a decrease in weight–for–age z-
score greater than three were eligible for exclusion, based on a predetermined set of
criteria. Starting from Release 6, extreme increases and decreases of BMI in
consecutive waves (associated with a BMI z-score change equal to or greater than 4)
were also flagged for exclusion based on the same set of criteria.
For birth weight data, a nationally representative reference of Australian birth weights
from 1998 to 2007 (Dobbins et al. 2012) was used to calculate z-scores. Birth weights
in the Footprints in Time sample were compared to the median birth weight of infants
of the same gestational age and gender. Birth weights were recoded to “implausible
value” if their birth weight for gestational age z-score was greater than +3 or less than
-3 after undergoing a data cleaning process. Infants were classified as small–for–
gestational age if their birth weight was in the lowest decile of birth weights for infants
of the same gender and gestational age, equivalent to a z-score less than -1.28.
Infants were classified as large–for–gestational age if their birth weight was in the
highest decile of birth weights for infants of the same gender and gestational age,
equivalent to a z-score greater than +1.28. Infants with a z-score between -1.28 and
+1.28 were classified as appropriate-for-gestational age.
Scales
The questionnaires include sets of questions (scales) which have been designed to
measure a specific trait or attribute of the respondent or Study Child, such as child
temperament, social and emotional development, child strengths and difficulties, parenting
style, social and emotional wellbeing of the parent and degree of social support. In some
cases, the questions have been asked exactly as designed and used in other studies. In
other cases questions have been adapted to the Indigenous context or shortened to meet
time constraints. A number of scores or sub-scores have been derived in LSIC using
established methods.
Temperament
The Short Temperament Scale for Children is a set of questions developed to measure
aspects of a child’s personality (Sanson et al. 1987). An abridged form of 13 questions was
asked of primary carers of the K cohort LSIC children in Wave 2 and of B cohort children in
Wave 5. LSIC uses 12 of the questions. Three facets of temperament are assessed by the
questions:
approach/sociability—how comfortable children are with new people and situations;
persistence—the ability to remain focussed on an activity or task; and
reactivity—the intensity/volatility with which a child reacts to certain events. Sub-
scales are derived for each aspect of temperament–these are the average of four
scores after reverse coding some variables as described in Table 11.
LSIC Data User Guide, Release 7—March 2016 30
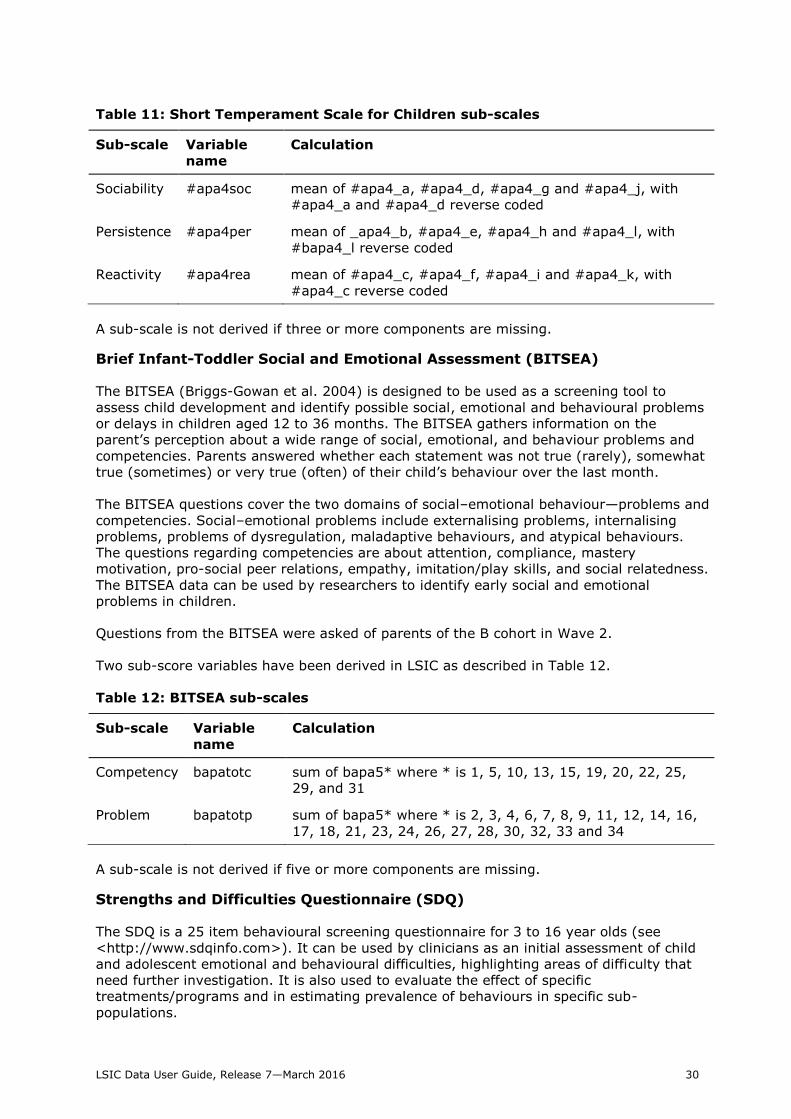
Table 11: Short Temperament Scale for Children sub-scales
Sub-scale Variable
name
Calculation
Sociability #apa4soc mean of #apa4_a, #apa4_d, #apa4_g and #apa4_j, with
#apa4_a and #apa4_d reverse coded
Persistence #apa4per mean of _apa4_b, #apa4_e, #apa4_h and #apa4_l, with
#bapa4_l reverse coded
Reactivity #apa4rea mean of #apa4_c, #apa4_f, #apa4_i and #apa4_k, with
#apa4_c reverse coded
A sub-scale is not derived if three or more components are missing.
Brief Infant-Toddler Social and Emotional Assessment (BITSEA)
The BITSEA (Briggs-Gowan et al. 2004) is designed to be used as a screening tool to
assess child development and identify possible social, emotional and behavioural problems
or delays in children aged 12 to 36 months. The BITSEA gathers information on the
parent’s perception about a wide range of social, emotional, and behaviour problems and
competencies. Parents answered whether each statement was not true (rarely), somewhat
true (sometimes) or very true (often) of their child’s behaviour over the last month.
The BITSEA questions cover the two domains of social–emotional behaviour—problems and
competencies. Social–emotional problems include externalising problems, internalising
problems, problems of dysregulation, maladaptive behaviours, and atypical behaviours.
The questions regarding competencies are about attention, compliance, mastery
motivation, pro-social peer relations, empathy, imitation/play skills, and social relatedness.
The BITSEA data can be used by researchers to identify early social and emotional
problems in children.
Questions from the BITSEA were asked of parents of the B cohort in Wave 2.
Two sub-score variables have been derived in LSIC as described in Table 12.
Table 12: BITSEA sub-scales
Sub-scale Variable
name
Calculation
Competency bapatotc sum of bapa5* where * is 1, 5, 10, 13, 15, 19, 20, 22, 25,
29, and 31
Problem bapatotp sum of bapa5* where * is 2, 3, 4, 6, 7, 8, 9, 11, 12, 14, 16,
17, 18, 21, 23, 24, 26, 27, 28, 30, 32, 33 and 34
A sub-scale is not derived if five or more components are missing.
Strengths and Difficulties Questionnaire (SDQ)
The SDQ is a 25 item behavioural screening questionnaire for 3 to 16 year olds (see
<http://www.sdqinfo.com>). It can be used by clinicians as an initial assessment of child
and adolescent emotional and behavioural difficulties, highlighting areas of difficulty that
need further investigation. It is also used to evaluate the effect of specific
treatments/programs and in estimating prevalence of behaviours in specific sub-
populations.
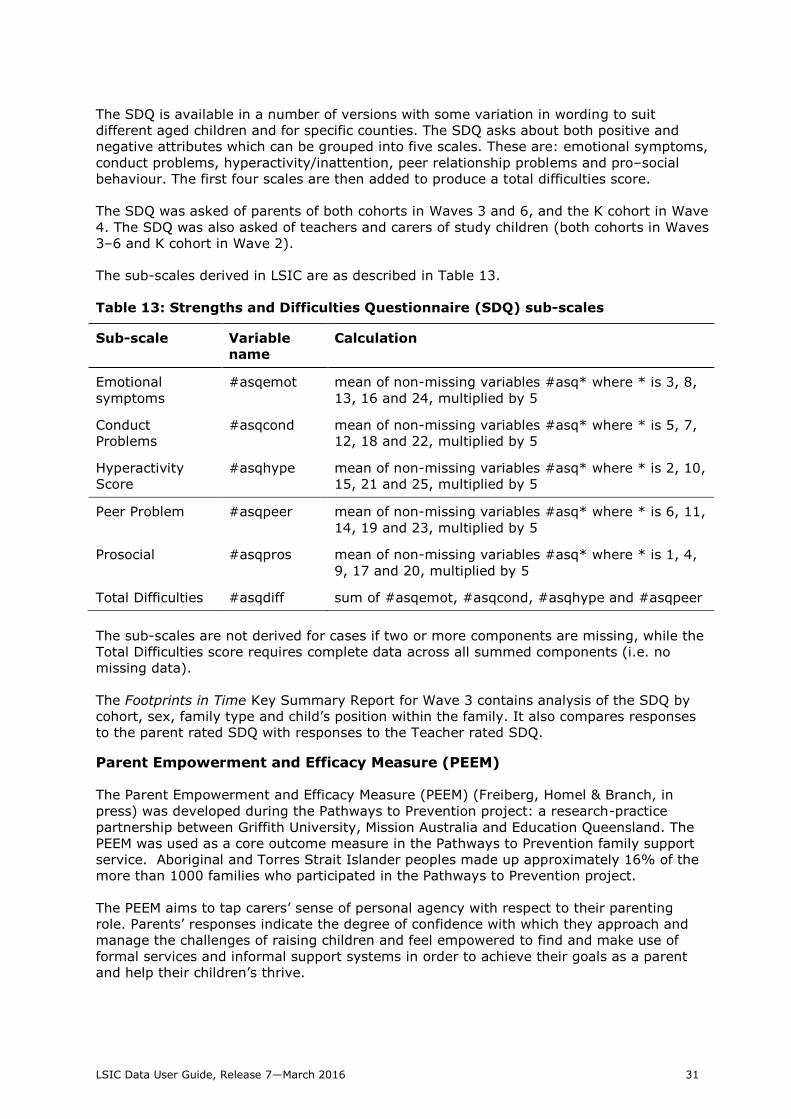
LSIC Data User Guide, Release 7—March 2016 31
The SDQ is available in a number of versions with some variation in wording to suit
different aged children and for specific counties. The SDQ asks about both positive and
negative attributes which can be grouped into five scales. These are: emotional symptoms,
conduct problems, hyperactivity/inattention, peer relationship problems and pro–social
behaviour. The first four scales are then added to produce a total difficulties score.
The SDQ was asked of parents of both cohorts in Waves 3 and 6, and the K cohort in Wave
4. The SDQ was also asked of teachers and carers of study children (both cohorts in Waves
3–6 and K cohort in Wave 2).
The sub-scales derived in LSIC are as described in Table 13.
Table 13: Strengths and Difficulties Questionnaire (SDQ) sub-scales
Sub-scale Variable
name
Calculation
Emotional
symptoms
#asqemot mean of non-missing variables #asq* where * is 3, 8,
13, 16 and 24, multiplied by 5
Conduct
Problems
#asqcond mean of non-missing variables #asq* where * is 5, 7,
12, 18 and 22, multiplied by 5
Hyperactivity
Score
#asqhype mean of non-missing variables #asq* where * is 2, 10,
15, 21 and 25, multiplied by 5
Peer Problem #asqpeer mean of non-missing variables #asq* where * is 6, 11,
14, 19 and 23, multiplied by 5
Prosocial #asqpros mean of non-missing variables #asq* where * is 1, 4,
9, 17 and 20, multiplied by 5
Total Difficulties #asqdiff sum of #asqemot, #asqcond, #asqhype and #asqpeer
The sub-scales are not derived for cases if two or more components are missing, while the
Total Difficulties score requires complete data across all summed components (i.e. no
missing data).
The Footprints in Time Key Summary Report for Wave 3 contains analysis of the SDQ by
cohort, sex, family type and child’s position within the family. It also compares responses
to the parent rated SDQ with responses to the Teacher rated SDQ.
Parent Empowerment and Efficacy Measure (PEEM)
The Parent Empowerment and Efficacy Measure (PEEM) (Freiberg, Homel & Branch, in
press) was developed during the Pathways to Prevention project: a research-practice
partnership between Griffith University, Mission Australia and Education Queensland. The
PEEM was used as a core outcome measure in the Pathways to Prevention family support
service. Aboriginal and Torres Strait Islander peoples made up approximately 16% of the
more than 1000 families who participated in the Pathways to Prevention project.
The PEEM aims to tap carers’ sense of personal agency with respect to their parenting
role. Parents’ responses indicate the degree of confidence with which they approach and
manage the challenges of raising children and feel empowered to find and make use of
formal services and informal support systems in order to achieve their goals as a parent
and help their children’s thrive.

LSIC Data User Guide, Release 7—March 2016 32
In its full form the PEEM consists of 20 items that tap parent empowerment as a general
construct, but the measure also provides an indication of efficacy along two distinct
dimensions. These two subscales (Efficacy to Parent and Efficacy to Connect) tap
(i) confidence to make parenting decisions and carry out parenting responsibilities, and
(ii) confidence to access parenting support and resources when needed, and to participate
as part of mutually supportive networks to meet one’s own and one’s children’s needs.
The LSIC Wave 5 and Wave 7 data collections included a subset of 14 of the 20 PEEM
items. These 14 items included 10 of the 11 items from the Efficacy to Parent subscale and
four of the nine items from the Efficacy to Connect subscale. The sub-scales derived in
LSIC are as described in Table 14.
Table 14: Parent Empowerment and Efficacy Measure (PEEM) sub-scales
Sub-scale Variable
name
Calculation
Efficacy to
parent
#apspar sum of non-missing variables #aps3_* where * is c, e, g,
h, i, j, k, l, m, n
Efficacy to
connect
#apscon sum of non-missing variables #aps3_* where * is a, b, d, f
A sub-scale is not derived if one or more components are missing.
Qualitative data
A range of qualitative data items are collected as part of Footprints in Time in the form of
free text responses to a number of open–ended questions in the survey. Free text entry
responses to open-ended questions are included in the data releases, however, references
to places, individuals, employers, clans, family names and languages are suppressed.
References to rare circumstances that may have been of sufficient noteworthiness to be
known by the wider community are also suppressed. The risk of identification is expected
to be low given the confidentialised status of these data, however data users need to be
mindful at all times of their responsibility to not risk identification of respondents. For the
purposes of keeping data files to a manageable size, free text entries in the data releases
are truncated to a maximum character length, with any remaining characters discarded.
The full responses can be viewed in Excel worksheets which can be requested from the
LSIC Data Team <[email protected]>. A list of these free text variables is provided at
Appendix B.
Data users are permitted to directly quote free text responses on the basis that such usage
poses no risk of the respondent being rendered identifiable. Quotes can be accompanied by
relevant unit record data such as age or occupation if these details are required for
meaningful interpretation but the unit record data used should be the minimum required
for the data user’s purpose and should manifestly carry no risk of identifying the
respondent. For example, it is acceptable to report that ‘One mother who has a Bachelor
degree commented “I want him to go to university and have a good career”’ but it is not
acceptable to report that ‘One mother, who works as a Professor of Indigenous Studies at
a university, commented “I want him to go to university and have a good career”.
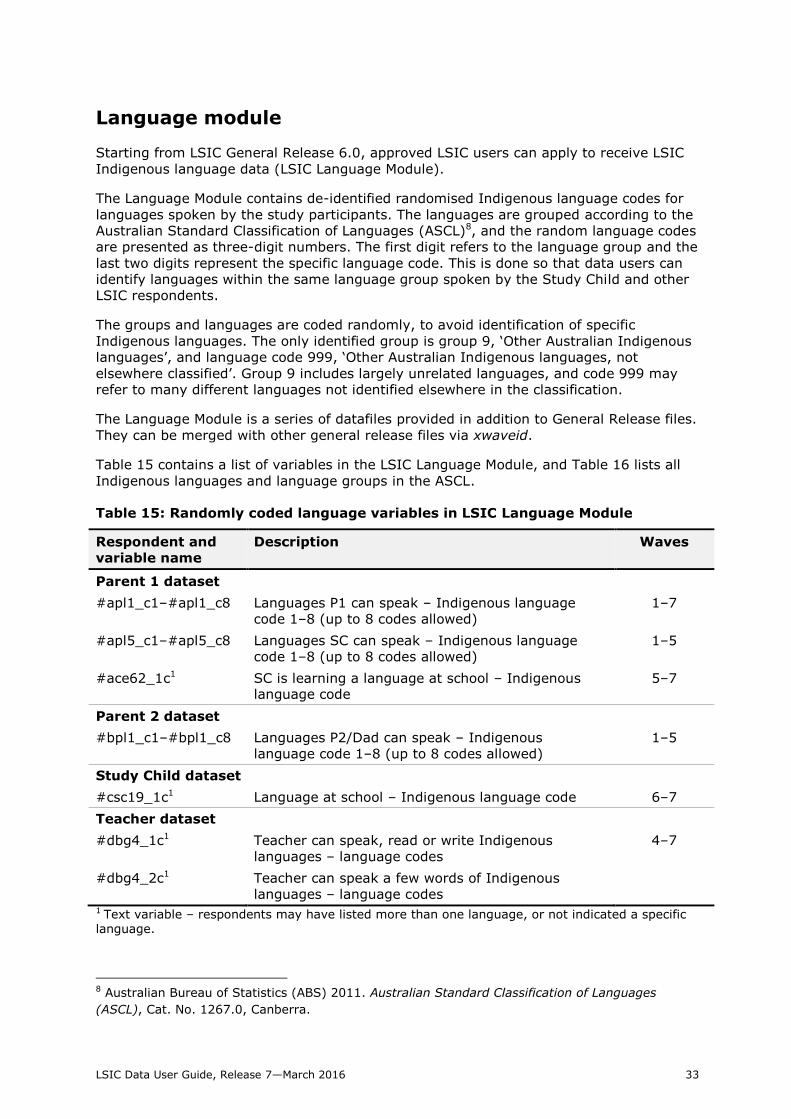
LSIC Data User Guide, Release 7—March 2016 33
Language module
Starting from LSIC General Release 6.0, approved LSIC users can apply to receive LSIC
Indigenous language data (LSIC Language Module).
The Language Module contains de-identified randomised Indigenous language codes for
languages spoken by the study participants. The languages are grouped according to the
Australian Standard Classification of Languages (ASCL)8, and the random language codes
are presented as three-digit numbers. The first digit refers to the language group and the
last two digits represent the specific language code. This is done so that data users can
identify languages within the same language group spoken by the Study Child and other
LSIC respondents.
The groups and languages are coded randomly, to avoid identification of specific
Indigenous languages. The only identified group is group 9, ‘Other Australian Indigenous
languages’, and language code 999, ‘Other Australian Indigenous languages, not
elsewhere classified’. Group 9 includes largely unrelated languages, and code 999 may
refer to many different languages not identified elsewhere in the classification.
The Language Module is a series of datafiles provided in addition to General Release files.
They can be merged with other general release files via xwaveid.
Table 15 contains a list of variables in the LSIC Language Module, and Table 16 lists all
Indigenous languages and language groups in the ASCL.
Table 15: Randomly coded language variables in LSIC Language Module
Respondent and
variable name
Description Waves
Parent 1 dataset
#apl1_c1–#apl1_c8 Languages P1 can speak – Indigenous language
code 1–8 (up to 8 codes allowed)
1–7
#apl5_c1–#apl5_c8 Languages SC can speak – Indigenous language
code 1–8 (up to 8 codes allowed)
1–5
#ace62_1c1 SC is learning a language at school – Indigenous language code
5–7
Parent 2 dataset
#bpl1_c1–#bpl1_c8 Languages P2/Dad can speak – Indigenous
language code 1–8 (up to 8 codes allowed)
1–5
Study Child dataset
#csc19_1c1 Language at school – Indigenous language code 6–7
Teacher dataset
#dbg4_1c1 Teacher can speak, read or write Indigenous
languages – language codes
4–7
#dbg4_2c1 Teacher can speak a few words of Indigenous
languages – language codes
1 Text variable – respondents may have listed more than one language, or not indicated a specific language.
8 Australian Bureau of Statistics (ABS) 2011. Australian Standard Classification of Languages
(ASCL), Cat. No. 1267.0, Canberra.
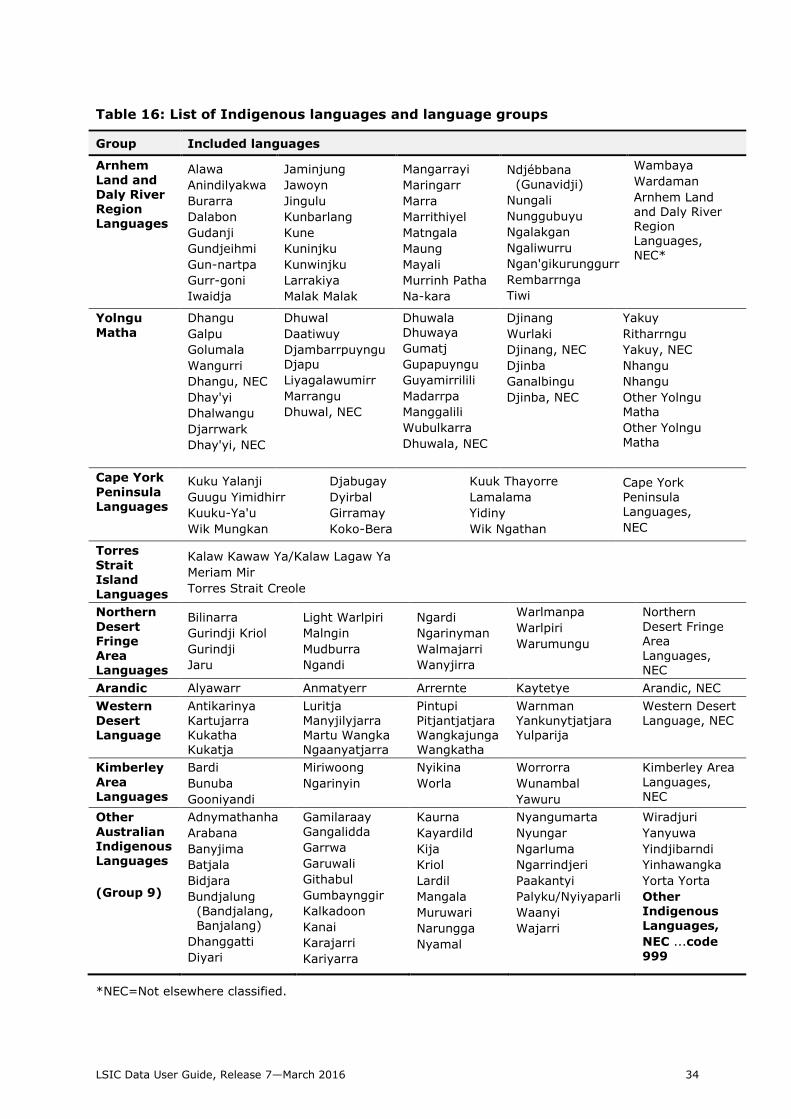
LSIC Data User Guide, Release 7—March 2016 34
Table 16: List of Indigenous languages and language groups
Group Included languages
Arnhem
Land and Daly River Region Languages
Alawa
Anindilyakwa
Burarra
Dalabon
Gudanji
Gundjeihmi
Gun-nartpa
Gurr-goni
Iwaidja
Jaminjung
Jawoyn
Jingulu
Kunbarlang
Kune
Kuninjku
Kunwinjku
Larrakiya
Malak Malak
Mangarrayi
Maringarr
Marra
Marrithiyel
Matngala
Maung
Mayali
Murrinh Patha
Na-kara
Ndjébbana
(Gunavidji)
Nungali
Nunggubuyu
Ngalakgan
Ngaliwurru
Ngan'gikurunggurr
Rembarrnga
Tiwi
Wambaya
Wardaman
Arnhem Land and Daly River Region Languages, NEC*
Yolngu
Matha
Dhangu
Galpu
Golumala
Wangurri
Dhangu, NEC
Dhay'yi
Dhalwangu
Djarrwark
Dhay'yi, NEC
Dhuwal
Daatiwuy
Djambarrpuyngu
Djapu
Liyagalawumirr
Marrangu
Dhuwal, NEC
Dhuwala
Dhuwaya
Gumatj
Gupapuyngu
Guyamirrilili
Madarrpa
Manggalili
Wubulkarra
Dhuwala, NEC
Djinang
Wurlaki
Djinang, NEC
Djinba
Ganalbingu
Djinba, NEC
Yakuy
Ritharrngu
Yakuy, NEC
Nhangu
Nhangu
Other Yolngu Matha
Other Yolngu
Matha
Cape York
Peninsula
Languages
Kuku Yalanji
Guugu Yimidhirr
Kuuku-Ya'u
Wik Mungkan
Djabugay
Dyirbal
Girramay
Koko-Bera
Kuuk Thayorre
Lamalama
Yidiny
Wik Ngathan
Cape York
Peninsula Languages,
NEC
Torres
Strait Island Languages
Kalaw Kawaw Ya/Kalaw Lagaw Ya
Meriam Mir
Torres Strait Creole
Northern
Desert Fringe Area Languages
Bilinarra
Gurindji Kriol
Gurindji
Jaru
Light Warlpiri
Malngin
Mudburra
Ngandi
Ngardi
Ngarinyman
Walmajarri
Wanyjirra
Warlmanpa
Warlpiri
Warumungu
Northern
Desert Fringe Area Languages, NEC
Arandic Alyawarr Anmatyerr Arrernte Kaytetye Arandic, NEC
Western
Desert Language
Antikarinya
Kartujarra Kukatha Kukatja
Luritja
Manyjilyjarra Martu Wangka Ngaanyatjarra
Pintupi
Pitjantjatjara Wangkajunga Wangkatha
Warnman
Yankunytjatjara Yulparija
Western Desert
Language, NEC
Kimberley
Area Languages
Bardi
Bunuba
Gooniyandi
Miriwoong
Ngarinyin
Nyikina
Worla
Worrorra
Wunambal
Yawuru
Kimberley Area
Languages, NEC
Other
Australian Indigenous Languages
(Group 9)
Adnymathanha
Arabana
Banyjima
Batjala
Bidjara
Bundjalung (Bandjalang, Banjalang)
Dhanggatti
Diyari
Gamilaraay
Gangalidda
Garrwa
Garuwali
Githabul
Gumbaynggir
Kalkadoon
Kanai
Karajarri
Kariyarra
Kaurna
Kayardild
Kija
Kriol
Lardil
Mangala
Muruwari
Narungga
Nyamal
Nyangumarta
Nyungar
Ngarluma
Ngarrindjeri
Paakantyi
Palyku/Nyiyaparli
Waanyi
Wajarri
Wiradjuri
Yanyuwa
Yindjibarndi
Yinhawangka
Yorta Yorta
Other Indigenous Languages,
NEC ...code 999
*NEC=Not elsewhere classified.
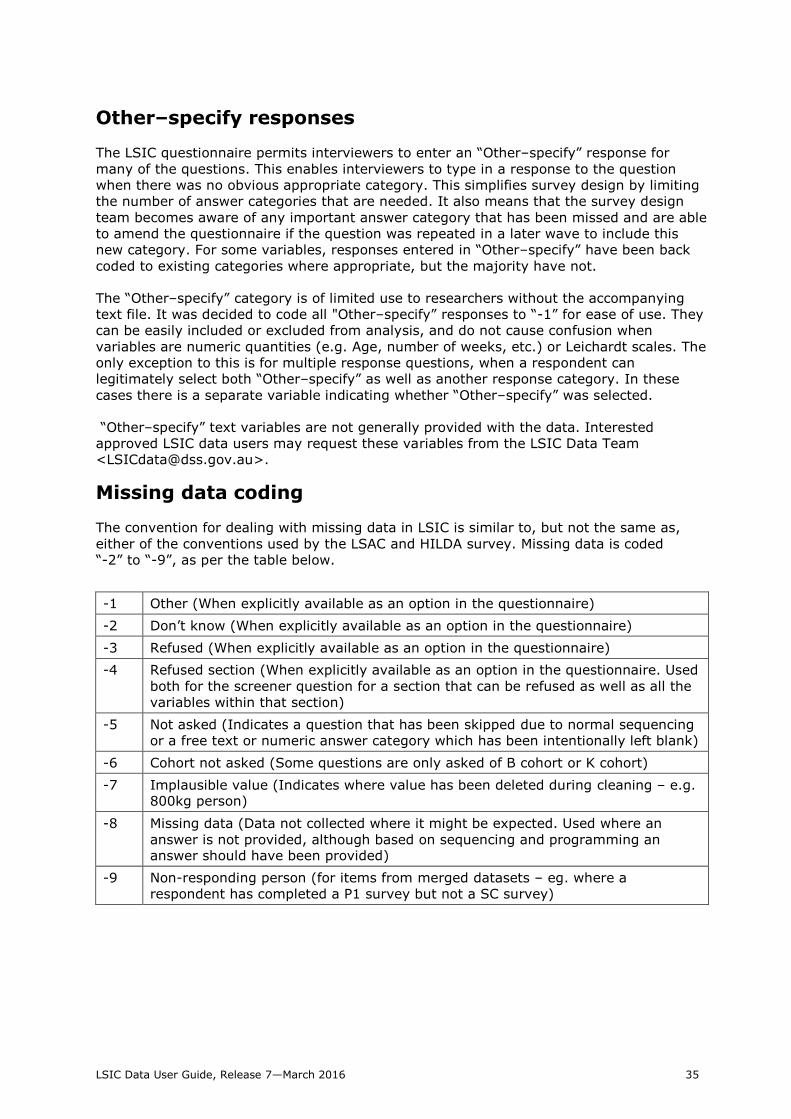
LSIC Data User Guide, Release 7—March 2016 35
Other–specify responses
The LSIC questionnaire permits interviewers to enter an “Other–specify” response for
many of the questions. This enables interviewers to type in a response to the question
when there was no obvious appropriate category. This simplifies survey design by limiting
the number of answer categories that are needed. It also means that the survey design
team becomes aware of any important answer category that has been missed and are able
to amend the questionnaire if the question was repeated in a later wave to include this
new category. For some variables, responses entered in “Other–specify” have been back
coded to existing categories where appropriate, but the majority have not.
The “Other–specify” category is of limited use to researchers without the accompanying
text file. It was decided to code all "Other–specify” responses to “-1” for ease of use. They
can be easily included or excluded from analysis, and do not cause confusion when
variables are numeric quantities (e.g. Age, number of weeks, etc.) or Leichardt scales. The
only exception to this is for multiple response questions, when a respondent can
legitimately select both “Other–specify” as well as another response category. In these
cases there is a separate variable indicating whether “Other–specify” was selected.
“Other–specify” text variables are not generally provided with the data. Interested
approved LSIC data users may request these variables from the LSIC Data Team
Missing data coding
The convention for dealing with missing data in LSIC is similar to, but not the same as,
either of the conventions used by the LSAC and HILDA survey. Missing data is coded
“-2” to “-9”, as per the table below.
-1 Other (When explicitly available as an option in the questionnaire)
-2 Don’t know (When explicitly available as an option in the questionnaire)
-3 Refused (When explicitly available as an option in the questionnaire)
-4 Refused section (When explicitly available as an option in the questionnaire. Used
both for the screener question for a section that can be refused as well as all the
variables within that section)
-5 Not asked (Indicates a question that has been skipped due to normal sequencing
or a free text or numeric answer category which has been intentionally left blank)
-6 Cohort not asked (Some questions are only asked of B cohort or K cohort)
-7 Implausible value (Indicates where value has been deleted during cleaning – e.g. 800kg person)
-8 Missing data (Data not collected where it might be expected. Used where an
answer is not provided, although based on sequencing and programming an answer should have been provided)
-9 Non-responding person (for items from merged datasets – eg. where a
respondent has completed a P1 survey but not a SC survey)
LSIC Data User Guide, Release 7—March 2016 36
Merging datasets
Datasets can be merged across waves or within the wave (e.g. P1 and P2 for Wave 1) by
one–to–one matching on the unique identifier (xwaveid). The code to do this will be
specific to the analysis package used. Two examples of merging in Stata are provided at
Appendix C. If researchers experience difficulty merging datasets, they should contact the
LSIC Data Team at <[email protected]>.
Confidentialisation
A number of variables have been removed from the data as these could easily compromise
the identity of the respondent. These include:
Names of household members
Date of birth of Parent 1, Parent 2/Dad and Study Child
Site: Although we release site/community related information in the form of
pamphlets and in publications, unit record data about site or state is not released.
However, some variables containing geographic information (such as LORI and
randomised cluster variable) are included with the dataset
Respondent ID: This is the identifier that is known to the participants and contains
site information, which is different to the anonymous “xwaveid”.
The General Release dataset has been further confidentialised in a range of ways:
Age – the age a person turns in year of interview is top-coded for all persons aged
over 65. All P1s aged over 65 were given the average age of this group. All P2s aged
over 65 were given the average age of their group. All other people over the age of
65 were given the average age of the non-P1/P2s over 65.
Language – respondents could choose from 179 Indigenous language names or
specify a foreign language or sign language. As some of the Indigenous languages
are only spoken in specific geographical areas, the data has been grouped into five
language categories.
All references to places, individuals, employers, clans, family names and languages
and rare occupations and circumstances have been suppressed in the free text
responses.
Data access
There are strict security and confidentiality protocols surrounding use of the data.
Prospective users are required to complete a dataset application and read and sign a deed
of licence. These can be found on the LSIC webpage <http://www.dss.gov.au/lsic>.
All enquiries regarding the Study or the data should be sent to <[email protected]>.
Requests for information regarding applying for the data or licensing arrangements should
be sent to <[email protected]>.
The process for accessing LSIC datasets is very similar to the process for access to LSAC
and HILDA surveys. However, applicants and licensed users will be asked to openly
acknowledge their standpoint in their application and in the reporting of data outputs in
reports or publications.
Those who are interested in applying for the Footprints in Time (LSIC) data should read
Fact Sheet 6: Longitudinal Study of Indigenous Children Data Protocols (link found at <http://www.dss.gov.au/lsic>) before completing their application.
LSIC Data User Guide, Release 7—March 2016 37
DATA LINKAGE – THE AUSTRALIAN EARLY
DEVELOPMENT CENSUS (AEDC)
The Australian Early Development Census9 (AEDC) is a nation-wide assessment of
development of young children. Between 1 May and 31 July 2009, teachers completed the
AEDC checklist for children in their first year of full time school. The AEDC measured five
areas of early childhood development: physical health and wellbeing, social competence,
emotional maturity, language and cognitive skills (school-based), and communication skills
and general knowledge.
The recent AEDC data collection took place from May to August 2012. Results and further
information is available from the website: <http://www.aedc.gov.au>
Two types of data linkage with AEDC scores are available or are being developed for LSIC:
1. Aggregated AEDC data for LSIC children is in the Parent 1 Wave 2 Release 3.1
dataset. This dataset is based on the suburb that the child lived in at their Wave 2
LSIC interview. The aggregated dataset includes the average AEDC scores across
the five areas of early childhood development by suburb, the proportion of
‘developmentally vulnerable’ children in that suburb, as well as some demographic
information. This data relates to children (Indigenous and non-Indigenous) living in
the suburb in their first year of school whose teachers completed the AEDC
checklist. This may or may not include the Study Child.
2. We also sought permission from parents of K cohort children to link specifically to
their child’s AEDC data. Where parental permission was obtained and an AEDC was
completed by a teacher, LSIC will link that child’s AEDC data to LSIC data, in a
separate data set and will be available for the data users in a later release.
Additional requirements for access to such data may be required.
About the AEDC
The following information about the AEDC was provided to FaHCSIA with the aggregated
(community level) 2009 AEDC data. For further information visit the AEDC website
<http://www.aedc.gov.au/>.
The Australian Early Development Census (AEDC), based on the Canadian Early
Development Instrument, is a population measure of young children’s development. Like a
census, it involves collecting information to help create a snapshot of early childhood
development in communities across Australia.
Teachers complete a checklist for children in their first year of full-time school. The
checklist measures five key areas, or domains, of child development:
• physical health and wellbeing
• social competence
• emotional maturity
• language and cognitive skills (school-based)
• communication skills and general knowledge.
9 Formerly known as the Australian Early Development Index (AEDI).
LSIC Data User Guide, Release 7—March 2016 38
These are important areas of child development and also good predictors of adult health,
education and social outcomes.
As a population measure, the AEDC places the focus on all children in the community; it
examines early childhood development across the whole community. Moving the focus of
effort from the individual child to all children in the community can make a bigger
difference in supporting efforts to create optimal early childhood development.
While the AEDC is completed by teachers, results are reported for the communities where
children live, not where they go to school. The initial AEDC results allow communities to
see how local children are doing relative to, or compared to other children in their
community, and across Australia.
National implementation
In 2009, the AEDC was completed nationwide for the first time. Between 1 May and 31
July, information was collected on 261,147 children (97.5 per cent of the estimated
national five-year-old population). This involved 15,522 teachers from 7,422 Government,
Catholic and Independent schools around Australia.
A follow-up data collection occurred in some small areas in 2010. AEDC results are now
available for 96 per cent of Australian communities.
Following the success of the first national implementation of the AEDC, the Australian
Government has made a commitment to collect this important data every three years. The
AEDC commitment represents a total investment of $51.2 million over five years (or $28
million per collection cycle). The ongoing AEDC funding will ensure that governments and
communities continue to have the information they need to make a difference in the lives
of young children and their families.
Confidentialisation
‘Rule of Three’
For all data except AEDC developmental variables, the lowest number that can be
published is four. For example, data showing that there are two Indigenous children in an
area should not be published but replaced with ≤3.
If this rule is breached, AEDC data cannot be released without some action to ensure
identification is unlikely. In this extract, cells have been replaced with <= 3 and <= nn%
where the actual cell value is less than or equal to three. Conversely, where the number of
children not included in a cell (i.e. the remainder) is less than or equal to three, the cells
have been replaced with >= nn and >= nn%.
Disclosure of information about all members of a group when developmentally
vulnerable
Cells replaced with >= 90.0% indicate that confidentialisation took place, due to at least
90% of the children in that domain scoring in the developmentally vulnerable category.
Insufficient number of children for a Domain
Cells replaced with < 15 and N/A indicate that confidentialisation took place, due to less
than 15 children being available for domain calculations.

LSIC Data User Guide, Release 7—March 2016 39
Risks associated with the release of this extract
Overall, the risk assessment for releasing this extract is moderate, due to significant data
at a Local Community level being made public for the first time:
The demographic cells for Aboriginal and Torres Strait Islanders, Special Needs,
English as Second Language (ESL), and Language Background Other Than English
(LBOTE) have not previously been made public at a Local Community level.
The sub-domain vulnerable cells have only been made public for the physical health
and wellbeing domain. This is the first time the sub-domain vulnerability results
have been released for the social competence, emotional maturity and language
and cognitive skills (school-based) domains.
The following should be noted:
The formulae for sub-domain vulnerable and domain vulnerable are distinct. It is
possible for a child to be vulnerable on a number of sub-domains, yet not be
developmentally vulnerable at the domain level. The actual details of these
formulae are confidential by licence with the Canadian Early Development
Instrument.
Estimated Resident Population (ERP) Guideline:
To determine this calculation the numerator is the number of children from the
local community surveyed for the AEDC and the denominator is the Australian
Bureau of Statistics ERP (Estimated Resident Population 2009) of 5-year-olds.
Where the AEDC Local Community does not match its ABS estimate, it is
recommended to be used with the following considerations:
o 60-79% ERP – view with caution.
o < 60% of ERP – this sample may not accurately represent the population of
children.
o [% ERP figures should be viewed as indicative only. The reason that some
percentages are over 100 is mostly due to unavoidable boundary
differences. Also AEDC was administered to 4 and 6 year olds if they were in
their first year of school, but ABS figures are only for 5 year olds.]
Data notes for this extract
The Average Age is displayed for the Community level, not the Local Community
level. This corresponds to data published in the AEDC Community Profiles.
There are 51 [LSIC Wave 2 respondents] without associated AEDC data. This was
due to their Local Community being:
o Not public (that is, it has failed the public results test of >= 15 children, >=
2 teachers and >= 80% children in domain denominator)
o Not surveyed (there were no resident children in that location who
participated in the AEDC)
o Unknown (the two records have no match in the AEDC geography).
Rules guiding usage of AEDC data
For the full documentation relevant to the use of AEDC data, please refer to the AEDC
website: < http://www.aedc.gov.au/researchers>
In keeping with the AEDC National Implementation Data Protocol the release of tabulated
data, through reports, publications, presentations etc must be provided to the AEDC
Strategic Policy Committee at least one month prior to its intended release date for
approval.
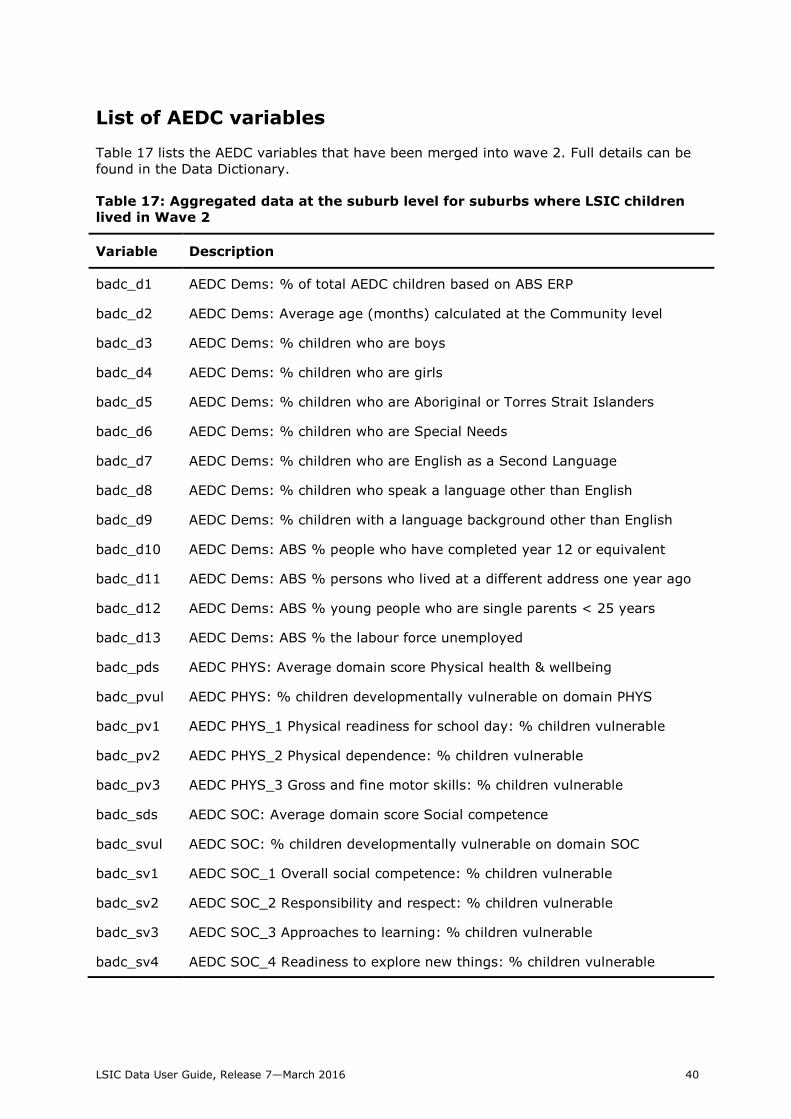
LSIC Data User Guide, Release 7—March 2016 40
List of AEDC variables
Table 17 lists the AEDC variables that have been merged into wave 2. Full details can be
found in the Data Dictionary.
Table 17: Aggregated data at the suburb level for suburbs where LSIC children
lived in Wave 2
Variable Description
badc_d1 AEDC Dems: % of total AEDC children based on ABS ERP
badc_d2 AEDC Dems: Average age (months) calculated at the Community level
badc_d3 AEDC Dems: % children who are boys
badc_d4 AEDC Dems: % children who are girls
badc_d5 AEDC Dems: % children who are Aboriginal or Torres Strait Islanders
badc_d6 AEDC Dems: % children who are Special Needs
badc_d7 AEDC Dems: % children who are English as a Second Language
badc_d8 AEDC Dems: % children who speak a language other than English
badc_d9 AEDC Dems: % children with a language background other than English
badc_d10 AEDC Dems: ABS % people who have completed year 12 or equivalent
badc_d11 AEDC Dems: ABS % persons who lived at a different address one year ago
badc_d12 AEDC Dems: ABS % young people who are single parents < 25 years
badc_d13 AEDC Dems: ABS % the labour force unemployed
badc_pds AEDC PHYS: Average domain score Physical health & wellbeing
badc_pvul AEDC PHYS: % children developmentally vulnerable on domain PHYS
badc_pv1 AEDC PHYS_1 Physical readiness for school day: % children vulnerable
badc_pv2 AEDC PHYS_2 Physical dependence: % children vulnerable
badc_pv3 AEDC PHYS_3 Gross and fine motor skills: % children vulnerable
badc_sds AEDC SOC: Average domain score Social competence
badc_svul AEDC SOC: % children developmentally vulnerable on domain SOC
badc_sv1 AEDC SOC_1 Overall social competence: % children vulnerable
badc_sv2 AEDC SOC_2 Responsibility and respect: % children vulnerable
badc_sv3 AEDC SOC_3 Approaches to learning: % children vulnerable
badc_sv4 AEDC SOC_4 Readiness to explore new things: % children vulnerable

LSIC Data User Guide, Release 7—March 2016 41
Table 17: Aggregated data at the suburb level for suburbs where LSIC children
lived in Wave 2 (continued)
Variable Description
badc_eds AEDC EMOT: Average domain score Emotional maturity
badc_evul AEDC EMOT: % children developmentally vulnerable on domain EMOT
badc_ev1 AEDC EMOT_1 Pro-social and helping behaviour: % children vulnerable
badc_ev2 AEDC EMOT_2 Anxious and fearful behaviour: % children vulnerable
badc_ev3 AEDC EMOT_3 Aggressive behaviour: % children vulnerable
badc_ev4 AEDC EMOT_4 Hyperactivity and inattention: % children vulnerable
badc_lds AEDC LANGCOG: Average domain score Language & cognitive skills
badc_lvul AEDC LANGCOG: % children developmentally vulnerable on domain
LANGCOG
badc_lv1 AEDC LANGCOG_1 Basic literacy: % children vulnerable
badc_lv2 AEDC LANGCOG_2 Interest in literacy/numeracy: % children vulnerable
badc_lv3 AEDC LANGCOG_3 Advanced literacy: % children vulnerable
badc_lv4 AEDC LANGCOG_4 Basic numeracy: % children vulnerable
badc_cds AEDC COMGEN: Average domain score Communication skills & gen.
knowledge
badc_cvul AEDC COMGEN: % children developmentally vulnerable on domain COMGEN
badc_vul1 AEDC: % children developmentally vulnerable on one or more domain/s
badc_vul2 AEDC: % children developmentally vulnerable on two or more domains
LSIC Data User Guide, Release 7—March 2016 42
DATA LINKAGE – THE NATIONAL ASSESSMENT
PROGRAM – LITERACY AND NUMERACY (NAPLAN)
The National Assessment Program – Literacy and Numeracy (NAPLAN) is an Australia-wide
annual assessment for all students in Years 3, 5, 7 and 9 in reading, writing, language
conventions (spelling, grammar and punctuation) and numeracy. NAPLAN has been
conducted since 2008; the test days are the same for all states and territories.
LSIC includes a number of instruments that directly assess children’s reading and
numeracy10. Data about the child’s academic achievement are also collected from the
teacher. However, both of these types of assessments have some limitations. Direct
assessments are completed in the child’s home during the interview and are therefore
different from the usual mode of delivery of these tests, which (particularly PAT) would
usually be carried out in a classroom setting. This results in a vast array of different
environments in which children are answering the questions and increases the number of
possible distractions that may affect children resulting in a less accurate measure of
children’s academic achievement. The teacher’s assessments are less valid because they
are subjective reports of the child’s capability rather than objective measures. They are
also less reliable than if they were completed by a single teacher due to differences in
reporting across a large number of teachers.
The benefit of linking the NAPLAN results to the LSIC data is that NAPLAN provides a
nationally comparable objective measure of how students are performing in literacy and
numeracy.
The NAPLAN results are reported on five scales: one for each of the domains of reading,
writing, and numeracy, and two for language conventions domain (one scale for spelling,
and one for grammar and punctuation). Each scale spans the range of ability from Year 3
to Year 9 and any given score represents the same level of achievement over time. For
example, a score of 600 in reading will have the same meaning in 2012 as in 2010. The
use of a common scale that spans Years 3, 5, 7 and 9 allows both the comparison of each
student’s achievement with other students, and the analysis of each student’s progress
across time. More information about NAPLAN, including national and technical reports, can
be found on the National Assessment Program (NAP) web-site at www.nap.edu.au.
This section of the Data User Guide describes the process of matching and linking NAPLAN
data to the LSIC database and the resulting structure of NAPLAN data for LSIC data users.
Obtaining consent
Starting from the Wave 4 data collection, parents of the children in the older (K) cohort
were asked to fill in a consent form to link their study child’s NAPLAN data. Parents of the
younger (B) cohort were first asked for consent to link to NAPLAN data in the Wave 4 data
collection, and then yearly beginning from the Wave 7 (2014) data collection. The NAPLAN
linkage consent is collected every year because it is asked on the same form as the
consent to contact the study child’s school for completion of the teacher questionnaire.
The parents can grant or withdraw their consent to contact study child’s school and/or to
link with the child’s NAPLAN data independently of each other.
Since collection of consent forms is attempted every year, the consent to link may vary
from one year to another. Therefore, the following protocol was adopted for data linkage:
10 These include Who am I? tests (short and long versions), Renfrew word-finding vocabulary test,
PAT-Reading and PAT-Maths. Further information about these measures can be found in dedicated sections of this Data User Guide.
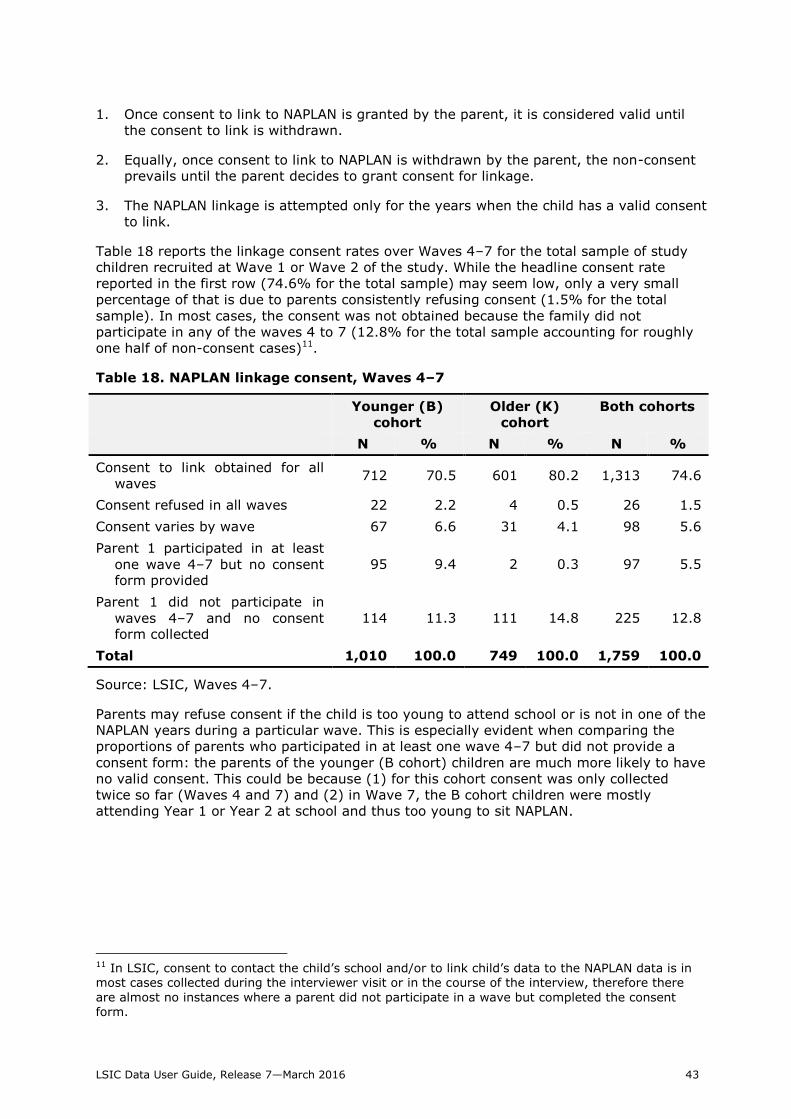
LSIC Data User Guide, Release 7—March 2016 43
1. Once consent to link to NAPLAN is granted by the parent, it is considered valid until
the consent to link is withdrawn.
2. Equally, once consent to link to NAPLAN is withdrawn by the parent, the non-consent
prevails until the parent decides to grant consent for linkage.
3. The NAPLAN linkage is attempted only for the years when the child has a valid consent
to link.
Table 18 reports the linkage consent rates over Waves 4–7 for the total sample of study
children recruited at Wave 1 or Wave 2 of the study. While the headline consent rate
reported in the first row (74.6% for the total sample) may seem low, only a very small
percentage of that is due to parents consistently refusing consent (1.5% for the total
sample). In most cases, the consent was not obtained because the family did not
participate in any of the waves 4 to 7 (12.8% for the total sample accounting for roughly
one half of non-consent cases)11.
Table 18. NAPLAN linkage consent, Waves 4–7
Younger (B)
cohort
Older (K)
cohort
Both cohorts
N % N % N %
Consent to link obtained for all
waves 712 70.5 601 80.2 1,313 74.6
Consent refused in all waves 22 2.2 4 0.5 26 1.5
Consent varies by wave 67 6.6 31 4.1 98 5.6
Parent 1 participated in at least
one wave 4–7 but no consent form provided
95 9.4 2 0.3 97 5.5
Parent 1 did not participate in
waves 4–7 and no consent form collected
114 11.3 111 14.8 225 12.8
Total 1,010 100.0 749 100.0 1,759 100.0
Source: LSIC, Waves 4–7.
Parents may refuse consent if the child is too young to attend school or is not in one of the
NAPLAN years during a particular wave. This is especially evident when comparing the
proportions of parents who participated in at least one wave 4–7 but did not provide a
consent form: the parents of the younger (B cohort) children are much more likely to have
no valid consent. This could be because (1) for this cohort consent was only collected
twice so far (Waves 4 and 7) and (2) in Wave 7, the B cohort children were mostly
attending Year 1 or Year 2 at school and thus too young to sit NAPLAN.
11 In LSIC, consent to contact the child’s school and/or to link child’s data to the NAPLAN data is in most cases collected during the interviewer visit or in the course of the interview, therefore there
are almost no instances where a parent did not participate in a wave but completed the consent form.
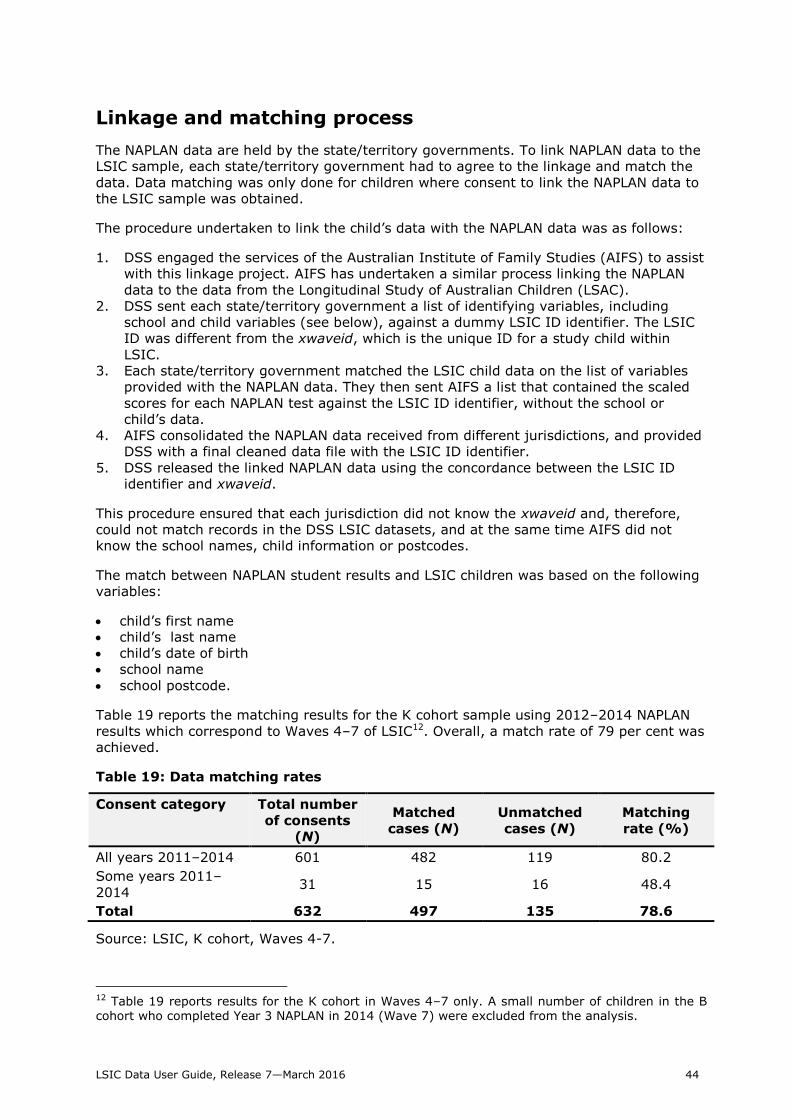
LSIC Data User Guide, Release 7—March 2016 44
Linkage and matching process
The NAPLAN data are held by the state/territory governments. To link NAPLAN data to the
LSIC sample, each state/territory government had to agree to the linkage and match the
data. Data matching was only done for children where consent to link the NAPLAN data to
the LSIC sample was obtained.
The procedure undertaken to link the child’s data with the NAPLAN data was as follows:
1. DSS engaged the services of the Australian Institute of Family Studies (AIFS) to assist
with this linkage project. AIFS has undertaken a similar process linking the NAPLAN
data to the data from the Longitudinal Study of Australian Children (LSAC).
2. DSS sent each state/territory government a list of identifying variables, including
school and child variables (see below), against a dummy LSIC ID identifier. The LSIC
ID was different from the xwaveid, which is the unique ID for a study child within
LSIC.
3. Each state/territory government matched the LSIC child data on the list of variables
provided with the NAPLAN data. They then sent AIFS a list that contained the scaled
scores for each NAPLAN test against the LSIC ID identifier, without the school or
child’s data.
4. AIFS consolidated the NAPLAN data received from different jurisdictions, and provided
DSS with a final cleaned data file with the LSIC ID identifier.
5. DSS released the linked NAPLAN data using the concordance between the LSIC ID
identifier and xwaveid.
This procedure ensured that each jurisdiction did not know the xwaveid and, therefore,
could not match records in the DSS LSIC datasets, and at the same time AIFS did not
know the school names, child information or postcodes.
The match between NAPLAN student results and LSIC children was based on the following
variables:
child’s first name
child’s last name
child’s date of birth
school name
school postcode.
Table 19 reports the matching results for the K cohort sample using 2012–2014 NAPLAN
results which correspond to Waves 4–7 of LSIC12. Overall, a match rate of 79 per cent was
achieved.
Table 19: Data matching rates
Consent category Total number
of consents
(N)
Matched
cases (N)
Unmatched
cases (N)
Matching
rate (%)
All years 2011–2014 601 482 119 80.2
Some years 2011–
2014 31 15 16 48.4
Total 632 497 135 78.6
Source: LSIC, K cohort, Waves 4-7.
12 Table 19 reports results for the K cohort in Waves 4–7 only. A small number of children in the B cohort who completed Year 3 NAPLAN in 2014 (Wave 7) were excluded from the analysis.
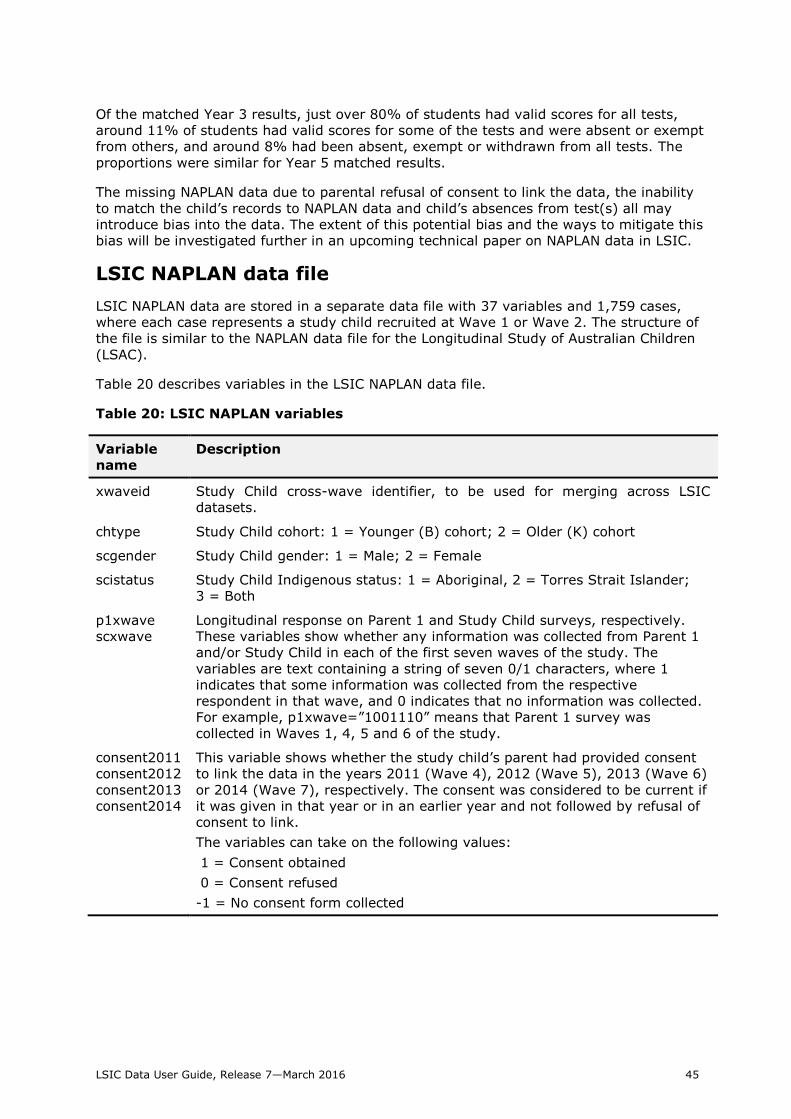
LSIC Data User Guide, Release 7—March 2016 45
Of the matched Year 3 results, just over 80% of students had valid scores for all tests,
around 11% of students had valid scores for some of the tests and were absent or exempt
from others, and around 8% had been absent, exempt or withdrawn from all tests. The
proportions were similar for Year 5 matched results.
The missing NAPLAN data due to parental refusal of consent to link the data, the inability
to match the child’s records to NAPLAN data and child’s absences from test(s) all may
introduce bias into the data. The extent of this potential bias and the ways to mitigate this
bias will be investigated further in an upcoming technical paper on NAPLAN data in LSIC.
LSIC NAPLAN data file
LSIC NAPLAN data are stored in a separate data file with 37 variables and 1,759 cases,
where each case represents a study child recruited at Wave 1 or Wave 2. The structure of
the file is similar to the NAPLAN data file for the Longitudinal Study of Australian Children
(LSAC).
Table 20 describes variables in the LSIC NAPLAN data file.
Table 20: LSIC NAPLAN variables
Variable
name
Description
xwaveid Study Child cross-wave identifier, to be used for merging across LSIC
datasets.
chtype Study Child cohort: 1 = Younger (B) cohort; 2 = Older (K) cohort
scgender Study Child gender: 1 = Male; 2 = Female
scistatus Study Child Indigenous status: 1 = Aboriginal, 2 = Torres Strait Islander;
3 = Both
p1xwave
scxwave
Longitudinal response on Parent 1 and Study Child surveys, respectively.
These variables show whether any information was collected from Parent 1
and/or Study Child in each of the first seven waves of the study. The
variables are text containing a string of seven 0/1 characters, where 1
indicates that some information was collected from the respective
respondent in that wave, and 0 indicates that no information was collected.
For example, p1xwave=”1001110” means that Parent 1 survey was
collected in Waves 1, 4, 5 and 6 of the study.
consent2011
consent2012
consent2013
consent2014
This variable shows whether the study child’s parent had provided consent
to link the data in the years 2011 (Wave 4), 2012 (Wave 5), 2013 (Wave 6)
or 2014 (Wave 7), respectively. The consent was considered to be current if
it was given in that year or in an earlier year and not followed by refusal of
consent to link.
The variables can take on the following values:
1 = Consent obtained
0 = Consent refused
-1 = No consent form collected

LSIC Data User Guide, Release 7—March 2016 46
Variable
name
Description
y#status
(ie y3status,
y5status &
y7status)
This variable records, for each test level, the linkage and test results status
for each Study Child. The variable has 4 categories:
1 = Child completed all tests
2 = Child completed some of the tests and was absent or exempt from
others
3 = Child was absent, withdrawn or exempt from all tests
4 = Child’s record not matched. This category applies to cases where the
parent refused consent to link the data, as well as the cases where the
parent provided consent to link the data but the state/territory
authorities were unable to match the child’s data in their records, or if
the child was too young to sit the test and no linkage was attempted.
y#year Calendar year when the child undertook the test. Missing if the respective
y#status category is 4.
y#age Age of Study Child (full months) at the date of the test. Missing if the
respective y#status category is 4.
y#read
y#write
y#spel
y#gram
y#num
These variables refer to Reading, Writing, Spelling, Grammar and
Punctuation, and Numeracy scaled scores, respectively. Scores are reported
up to one decimal point and range from 0 to 1,000.
The variables can take the following negative values:
-2 = Student absent from test. Students can be absent from one test but
complete other test(s), for instance due to illness.
-3 = Student withdrawn from test. From the NAP* web-site: “While
participation by all students is expected, students may be withdrawn
from the testing program by their parent/carer. This is a matter for
consideration by individual parents/carers. Withdrawals are intended to
address issues such as religious beliefs and philosophical objections to
testing.”
-4 = Student exempt from test. From the NAP* web-site: “Students can be
exempted from one or more NAPLAN tests if they have significant or
complex disability, or if they are from a non-English-speaking
background and arrived in Australia less than one year before the tests.
However, exemption is not automatic and parents may choose for their
child to participate.”
The variables have missing values if the respective y#status category is 4.
Note: * The National Assessment Program (NAP) web-site (2013), Information:
Frequently Asked Questions: NAPLAN – participation,
http://www.nap.edu.au/information/faqs/naplan--participation.html, accessed January
2016.

LSIC Data User Guide, Release 7—March 2016 47
NAPLAN proficiency bands and national minimum
standards
In NAPLAN reporting, student achievement is also categorised against ten proficiency
bands and national minimum standards. This sub-section provides a brief description of
proficiency bands applicable to each NAPLAN year and the cut-off scores for each band.
The information in this sub-section is drawn from NAPLAN 2014 Technical Report (ACARA
2015).
Figure 2: NAPLAN bands, scaled scores and proficiency levels
Band Scaled
scores Year 3 Year 5 Year 7 Year 9
10 687 ≤ 1000
9 635 ≤ 686
8 583 ≤ 634
7 531 ≤ 582
6 479 ≤ 530
5 427 ≤ 478
4 375 ≤ 426
3 323 ≤ 374
2 271 ≤ 322
1 0 ≤ 270
Source: Australian Curriculum, Assessment and Reporting Authority 2015, National
Assessment Program – Literacy and Numeracy 2014: Technical Report, ACARA, Sydney.
The ten proficiency bands on the NAPLAN reporting scales and the respective scaled scores
are presented in Figure 2. For instance, NAPLAN scores of 270 or lower fall into Band 1,
while scores between 271 and 322 belong to Band 2.
The yellow band for each year level in Figure 2 identifies the national minimum standard
for that year level. Band 2 is the national minimum standard for Year 3, Band 4 for Year 5,
Band 5 for Year 7 and Band 6 for Year 9. Students are deemed to have performed above
national minimum standard if their scores fall in the green bands at their respective year
level and below national minimum standard if their scores fall in the orange band.
LSIC Data User Guide, Release 7—March 2016 48
GETTING MORE INFORMATION
More information on Footprints in Time and its progress can be found on the LSIC website:
<http://www.dss.gov.au/lsic>
Further enquiries can be directed to the LSIC Data Team by emailing
<[email protected]> or by calling toll free 1800 106 235.

LSIC Data User Guide, Release 7—March 2016 49
REFERENCES
Australian Council for Educational Research (ACER) 2008, Progressive Achievement Tests
in Reading (PAT-R) 4th Ed. ACER Press.
Australian Council for Educational Research (ACER) 2014, ACER Progressive Achievement
Tests (PAT): 2013 National Update, Australia.
Australian Institute of Family Studies 2011, Longitudinal Study of Australian Children Data
User Guide – August 2011, Melbourne.
Biemiller, A 2007, The influence of vocabulary on reading acquisition. In Encyclopedia of
Language and Literacy Development, published on website by the Canadian Language and
Literacy Center:
<http://literacyencyclopedia.ca/index.php?fa=items.show&topicId=19#comments>
Biddle, N 2011, Ranking regions: revisiting an index of relative Indigenous socio-economic
outcomes, Centre for Aboriginal Economic Policy Research Working Paper 50, Australian
National University, available at:
<http://caepr.anu.edu.au/Publications/WP/2009WP50.php>.
Briggs-Gowan, MJ, Carter, AS, Irwin, JR, Watchtel, K & Cicchetti, DV 2004, ‘The Brief
Infant-Toddler Social and Emotional Assessment: screening for social-emotional problems
and delays in competence’, Journal of Pediatric Psychology, vol. 29, no. 2, pp. 143-155.
Cole, TJ, Flegal, KM, Nicholls, D, Jackson, AA 2007, ‘Body mass index cut offs to define
thinness in children and adolescents: international survey’, British Medical Journal, vol.
335, issue 7880, p. 194.
de Lemos, M & Doig, B 1999, Who Am I? Developmental Assessment Manual, ACER,
Melbourne.
de Onis, M, Lobstein, T 2010, ‘Defining obesity risk status in the general childhood
population: Which cut-offs should we use?’, International Journal of Pediatric Obesity, vol.
5, no. 2, pp. 458-60.
Dobbins, TA, Sullivan, EA, Roberts, CL, Simpson, JM 2012, Australian national birthweight
percentiles by sex and gestational age, 1998-2007’, Medical Journal of Australia, vol. 197,
no. 2, p. 291.
Dunn, LM & Dunn, DM 2007, Peabody Picture Vocabulary Test, Fourth Edition, Pearson,
Minneapolis.
Freiberg, K., Homel, R., & Branch, S. (in press). ‘The Parent Empowerment and Efficacy
Measure (PEEM): A tool for strengthening the accountability and effectiveness of family
support services’, Australian Social Work.
Renfrew, C 1998, The Renfrew Language Scale: Word Finding Vocabulary test,
Speechmark, Milton Keynes.
Sanson, A, Prior, MR, Garino E, Oberklaid, F & Sewell, J, 1997, ‘The structure of infant
temperament: factor analysis of the revised infant temperament questionnaire’,
InfantBehaviour and Development; vol. 10, 97–104.
Thomas, A, Cairney, S, Gunthorpe, W, Paradies, Y, Sayers, S 2010, 'Strong Souls:
development and validation of a culturally appropriate tool for assessment of social and

LSIC Data User Guide, Release 7—March 2016 50
emotional wellbeing in Indigenous youth', Australian and New Zealand Journal of
Psychiatry, 2010; 44:40-48.
Wechsler, D 2003, Wechsler Intelligence Scale for Children-Fourth Edition. Administration
and scoring manual. San Antonio, TX: Harcourt Assessment, Inc.
World Health Organization 2006, WHO Child Growth Standards: Methods and
development: Length/height-for-age, weight-for-age, weight-for-length, weight-for-height
and body mass index-for-age, Geneva.
World Health Organization 2012, The standard analysis and reporting for the WHO Global
Database differs as follows depending on whether the NCHS/WHO reference or the WHO
standards are used, [06/03/2012], available from:
<http://www.who.int/nutgrowthdb/software/Differences_NCHS_WHO.pdf>.
Zubrick, SR, Lawrence, DM, Silburn, SR, Blair, E, Milroy, H, Wilkes T, Eades S, Antoine H,
Read A, Ishiguchi P& Doyle S, 2004,The Western Australian Aboriginal Child Health Study:
The Health of Aboriginal Children and Young People, Telethon Institute for Child Health
Research, Perth.

APPENDIX A
Data dictionary
Headings Description
Survey
Respondent
Indicates whether the respondent is Parent 1, Parent 2 or Dad, Study
Child, or a Teacher or Carer.
Variable name Indicates the variable name in the dataset (without the first letter
which pertains to wave).
Variable Label Indicates the variable label as used in the dataset.
Question
wording
Gives the question wording used in the questionnaire.
Derived
variables
Indicates variables derived from information collected through the
survey instruments.
Values Indicates the answer categories available in the questionnaire together
with the numeric value used in the dataset.
Storage type Indicates whether a variable is numeric or string (text).
Population (see
also 'Cohort')
Indicates whether sequencing affects the population of whom each
question was asked, e.g. if question is only asked of birth mothers.
Wave & cohort Indicate which questions were asked of each cohort in each the year.
Section initials Indicates the two initials which designate which section of the
questionnaire the question comes from, also appears in the variable
name, e.g. HH or SS.
Questionnaire
Section
Indicates the name of the section in which the question appears in the
questionnaire, e.g. Household Form or Strong Souls.
Topic The topic is either the root question for multiple responses, or the scale
(for example, Renfrew), or is otherwise identical to (or derived from)
the variable name.
Theme Shows some thematic links between questions in different parts of the
questionnaire.
Notes for data
users
Provides extra information that might be useful in interpreting the data,
e.g. Variations in question wording for different cohorts or information
on how some variables were derived.
Position1,
Position2 … etc
Indicates the position within the dataset of the variable in the relevant
wave. Variables are broadly ordered as they appear in the
questionnaires.
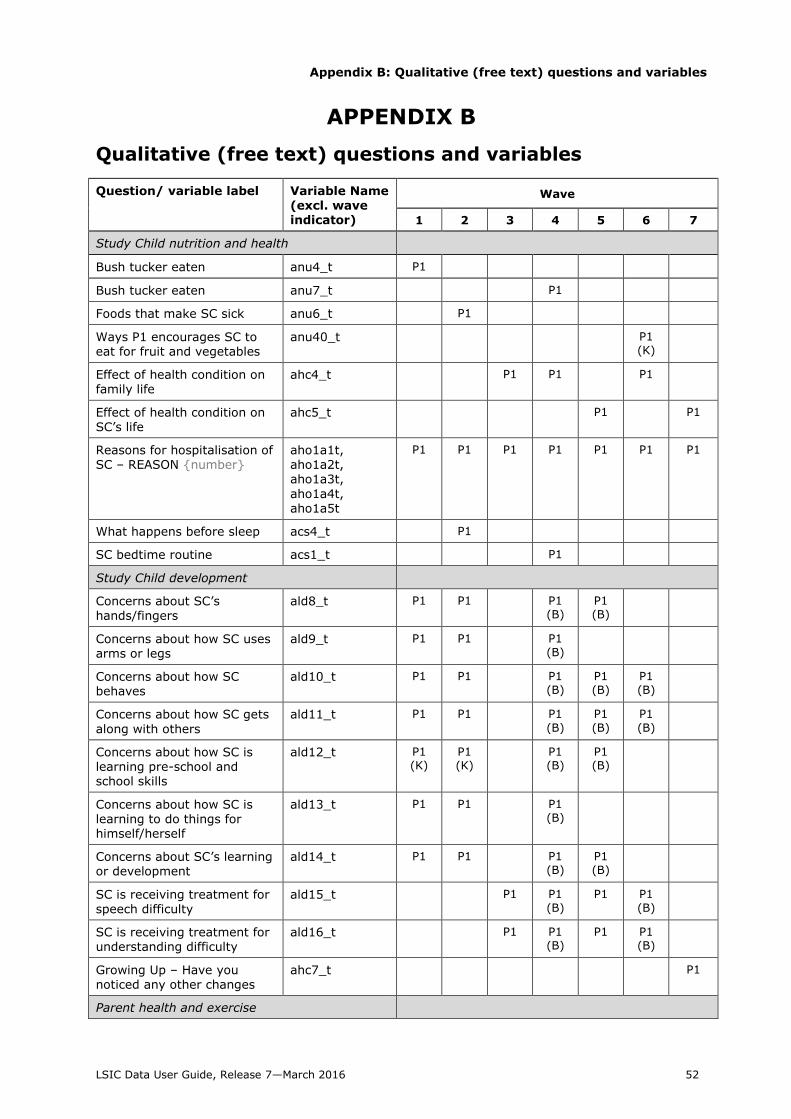
Appendix B: Qualitative (free text) questions and variables
LSIC Data User Guide, Release 7—March 2016 52
APPENDIX B
Qualitative (free text) questions and variables
Question/ variable label Variable Name (excl. wave indicator)
Wave
1 2 3 4 5 6 7
Study Child nutrition and health
Bush tucker eaten anu4_t P1
Bush tucker eaten anu7_t P1
Foods that make SC sick anu6_t P1
Ways P1 encourages SC to eat for fruit and vegetables
anu40_t P1 (K)
Effect of health condition on family life
ahc4_t P1 P1 P1
Effect of health condition on SC’s life
ahc5_t P1 P1
Reasons for hospitalisation of SC – REASON {number}
aho1a1t, aho1a2t, aho1a3t,
aho1a4t,
aho1a5t
P1 P1 P1 P1 P1 P1 P1
What happens before sleep acs4_t P1
SC bedtime routine acs1_t P1
Study Child development
Concerns about SC’s hands/fingers
ald8_t P1 P1 P1 (B)
P1 (B)
Concerns about how SC uses arms or legs
ald9_t P1 P1 P1 (B)
Concerns about how SC behaves
ald10_t P1 P1 P1 (B)
P1 (B)
P1 (B)
Concerns about how SC gets
along with others
ald11_t P1 P1 P1
(B)
P1
(B)
P1
(B)
Concerns about how SC is learning pre-school and school skills
ald12_t P1 (K)
P1 (K)
P1 (B)
P1 (B)
Concerns about how SC is learning to do things for himself/herself
ald13_t P1 P1 P1 (B)
Concerns about SC’s learning or development
ald14_t P1 P1 P1 (B)
P1 (B)
SC is receiving treatment for
speech difficulty
ald15_t P1 P1 (B)
P1 P1 (B)
SC is receiving treatment for understanding difficulty
ald16_t P1 P1 (B)
P1 P1 (B)
Growing Up – Have you noticed any other changes
ahc7_t P1
Parent health and exercise
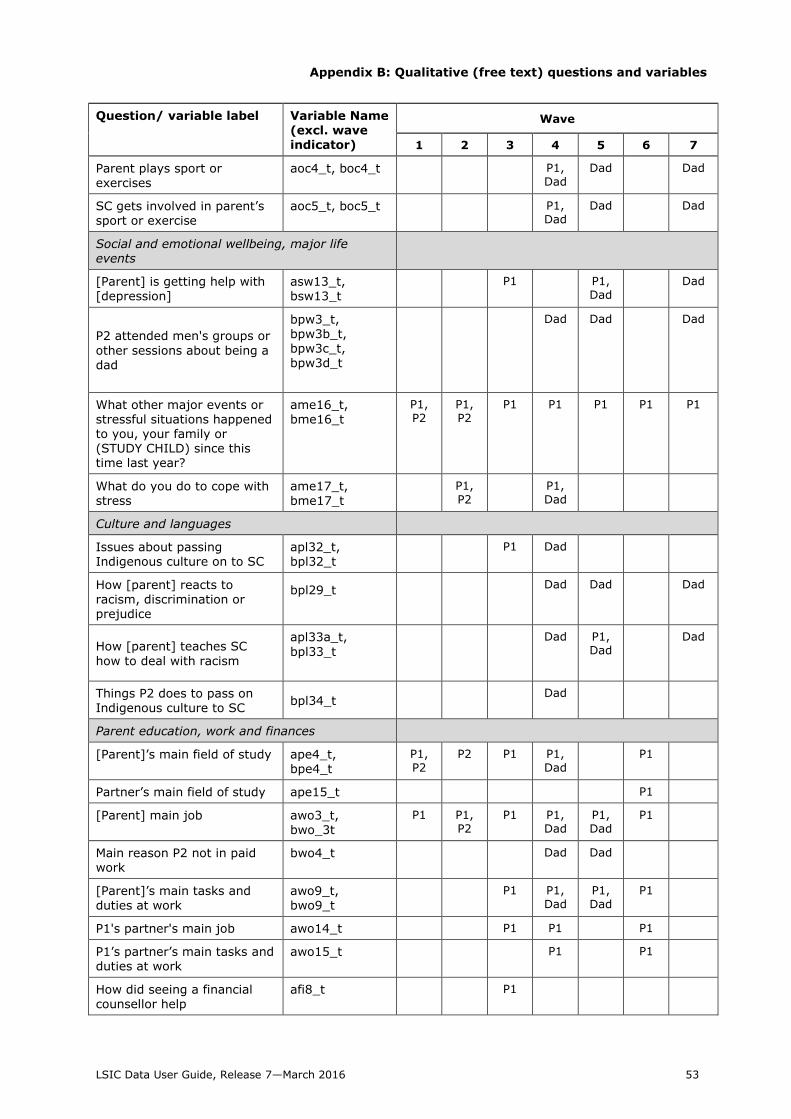
Appendix B: Qualitative (free text) questions and variables
LSIC Data User Guide, Release 7—March 2016 53
Question/ variable label Variable Name (excl. wave indicator)
Wave
1 2 3 4 5 6 7
Parent plays sport or exercises
aoc4_t, boc4_t P1, Dad
Dad Dad
SC gets involved in parent’s sport or exercise
aoc5_t, boc5_t P1, Dad
Dad Dad
Social and emotional wellbeing, major life events
[Parent] is getting help with
[depression]
asw13_t,
bsw13_t
P1 P1, Dad
Dad
P2 attended men's groups or
other sessions about being a dad
bpw3_t, bpw3b_t, bpw3c_t, bpw3d_t
Dad Dad Dad
What other major events or stressful situations happened to you, your family or (STUDY CHILD) since this time last year?
ame16_t, bme16_t
P1, P2
P1, P2
P1 P1 P1 P1 P1
What do you do to cope with
stress
ame17_t,
bme17_t
P1, P2
P1, Dad
Culture and languages
Issues about passing Indigenous culture on to SC
apl32_t, bpl32_t
P1 Dad
How [parent] reacts to racism, discrimination or prejudice
bpl29_t
Dad Dad Dad
How [parent] teaches SC
how to deal with racism
apl33a_t,
bpl33_t
Dad P1, Dad
Dad
Things P2 does to pass on
Indigenous culture to SC bpl34_t
Dad
Parent education, work and finances
[Parent]’s main field of study ape4_t, bpe4_t
P1, P2
P2 P1 P1, Dad
P1
Partner’s main field of study ape15_t P1
[Parent] main job awo3_t, bwo_3t
P1 P1, P2
P1 P1, Dad
P1, Dad
P1
Main reason P2 not in paid work
bwo4_t Dad Dad
[Parent]’s main tasks and
duties at work
awo9_t,
bwo9_t
P1 P1, Dad
P1, Dad
P1
P1's partner's main job awo14_t P1 P1 P1
P1’s partner’s main tasks and duties at work
awo15_t P1 P1
How did seeing a financial counsellor help
afi8_t P1

Appendix B: Qualitative (free text) questions and variables
LSIC Data User Guide, Release 7—March 2016 54
Question/ variable label Variable Name (excl. wave indicator)
Wave
1 2 3 4 5 6 7
Income management has caused changes to community – positive changes
afi11_1t, bfi111t
P1 P1, Dad
P1, Dad
P1 P1
Income management has caused changes to community – negative changes
afi11_2t, bfi112t
P1 P1, Dad
P1, Dad
P1 P1
Housing and community
Home needs major repairs ahm7_t, bhm7_t
P1, P2
P1
Reason community is unsafe ahm13_t, bhm13_t
P1, P2
P1, P2
P1 P1, Dad
P1 P1
Comments about community ahm14_t, bhm14_t
P1, P2
P1
P1 knows where to get help fixing house
ahm17_t P1
Parent has transport problems
ahm26_t, bhm26_t
P1, Dad
Community strengths asa21_t P1
Study Child education and child care
SC attend playgroup or baby group
ace1_t P1 P1 (B)
P1 (B)
P1 (B)
Describe racist bullying experienced by SC
ace23_t P1 P1 P1 P1 P1
Describe bullying experienced by SC
ace51_t P1 P1 P1 P1
What was school like for Aboriginal people
ace66_t,
bce66_t
P1
Dad
Is it different for SC now? ace67_t,
bce67_t
P1
Dad
How do you decide when SC should stay home from school
ace80_t P1
Are you happy with how SC’s school teaches about Aboriginal and Torres Strait Islander Culture
ace83_t P1
How else does SC’s school
help Aboriginal and Torres
Strait Islander children
ace84_t P1
Are there other ways you support SC’s school learning
bce85_t Dad
Why this high school ahs2_t P1
Study Child activities
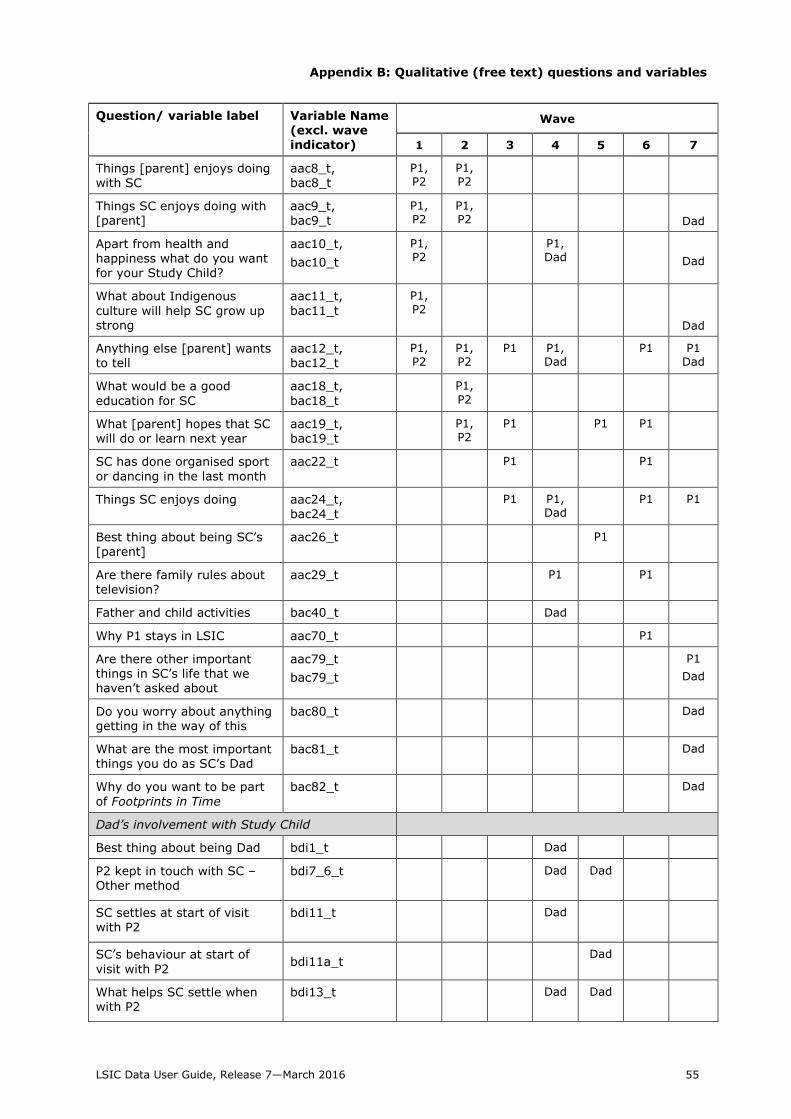
Appendix B: Qualitative (free text) questions and variables
LSIC Data User Guide, Release 7—March 2016 55
Question/ variable label Variable Name (excl. wave indicator)
Wave
1 2 3 4 5 6 7
Things [parent] enjoys doing with SC
aac8_t, bac8_t
P1, P2
P1, P2
Things SC enjoys doing with [parent]
aac9_t, bac9_t
P1, P2
P1, P2
Dad
Apart from health and happiness what do you want for your Study Child?
aac10_t,
bac10_t
P1, P2
P1, Dad
Dad
What about Indigenous
culture will help SC grow up strong
aac11_t,
bac11_t
P1, P2
Dad
Anything else [parent] wants to tell
aac12_t, bac12_t
P1, P2
P1, P2
P1 P1, Dad
P1 P1 Dad
What would be a good
education for SC
aac18_t,
bac18_t
P1,
P2
What [parent] hopes that SC will do or learn next year
aac19_t, bac19_t
P1, P2
P1 P1 P1
SC has done organised sport
or dancing in the last month
aac22_t P1 P1
Things SC enjoys doing aac24_t, bac24_t
P1 P1, Dad
P1 P1
Best thing about being SC’s [parent]
aac26_t P1
Are there family rules about television?
aac29_t P1 P1
Father and child activities bac40_t Dad
Why P1 stays in LSIC aac70_t P1
Are there other important things in SC’s life that we haven’t asked about
aac79_t
bac79_t
P1
Dad
Do you worry about anything getting in the way of this
bac80_t Dad
What are the most important things you do as SC’s Dad
bac81_t Dad
Why do you want to be part
of Footprints in Time
bac82_t Dad
Dad’s involvement with Study Child
Best thing about being Dad bdi1_t Dad
P2 kept in touch with SC – Other method
bdi7_6_t
Dad Dad
SC settles at start of visit with P2
bdi11_t
Dad
SC’s behaviour at start of
visit with P2 bdi11a_t
Dad
What helps SC settle when with P2
bdi13_t
Dad Dad

Appendix B: Qualitative (free text) questions and variables
LSIC Data User Guide, Release 7—March 2016 56
Question/ variable label Variable Name (excl. wave indicator)
Wave
1 2 3 4 5 6 7
P2 supports SC with money or other kinds of support
bfi12_t
(ebfi12_3t in W5)
Dad Dad
Study Child direct responses
Renfrew vocabulary – Alternative words provided in English
crf1_1t-crf1_50t
SC (K)
SC (K)
SC (K)
SC (B)
SC (B)
SC (B)
Who am I – Year level at
school
cwi3 SC (K)
SC (K)
SC has a favourite animal cfv3_t SC (B)
Things SC likes to do at preschool/school
cfv5_t SC (K)
SC (B)
SC's favourite thing to do at preschool/school
csc13_t SC (K)
SC (K)
SC SC
(B)
What SC wants to be when grown up
csc14_t SC (K)
SC (K)
SC (K)
SC (B)
SC (B)
SC’s favourite thing to do not
at school
csc16_t SC
(K)
Reason why PAT-R was not completed
cpr1_t SC
(B)
Reason why PAT-R (reading game) was not completed
cpr2_t SC (K)
SC (K)
SC (K)
Reason why PAT-Maths was not completed
cpmc1_t SC (K)
What makes you happy cse6_t SC (K)
What makes you scared cse7_t SC (K)
What makes you sad cse8_t SC (K)
What makes you mad cse9_t SC (K)
What makes you proud cse10_t SC (K)
Teacher or Carer responses
What is working well for SC dww1_t TC
What is working well for Indigenous children
dww2_t TC
Working well for Indigenous children learning and development
dww3_4 TC TC
Not working well for Indigenous children learning and development
dww4_t TC TC
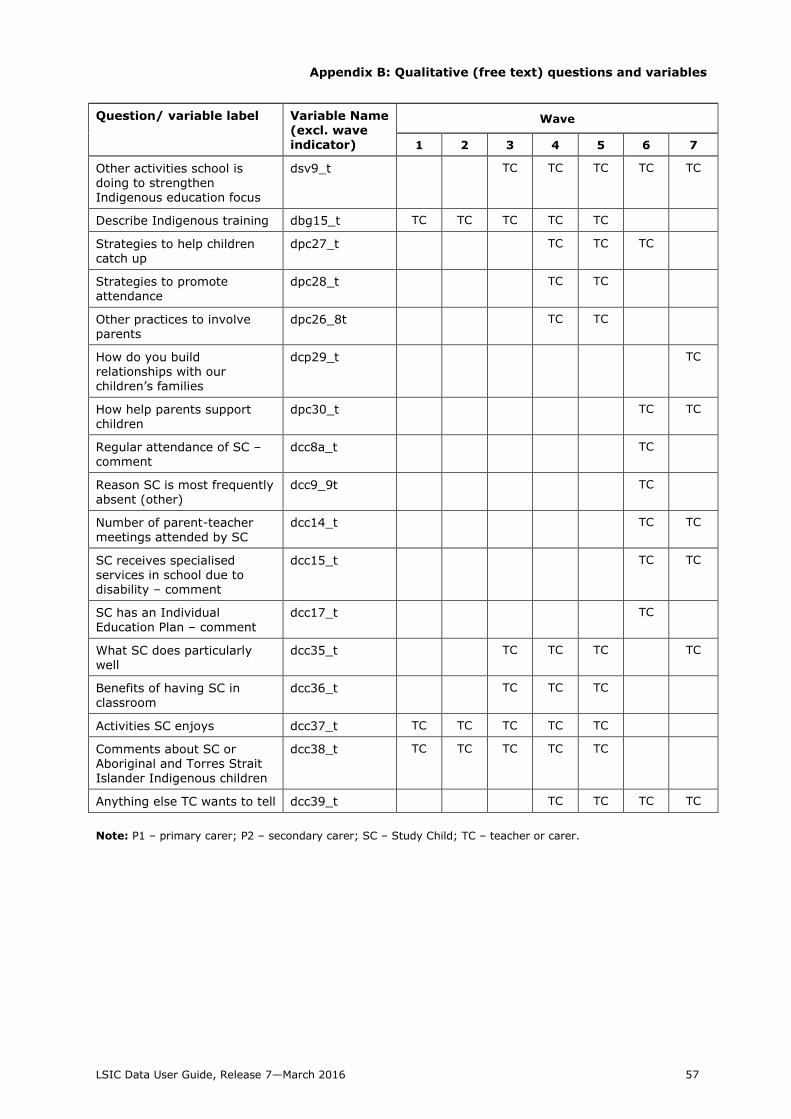
Appendix B: Qualitative (free text) questions and variables
LSIC Data User Guide, Release 7—March 2016 57
Question/ variable label Variable Name (excl. wave indicator)
Wave
1 2 3 4 5 6 7
Other activities school is doing to strengthen Indigenous education focus
dsv9_t TC TC TC TC TC
Describe Indigenous training dbg15_t TC TC TC TC TC
Strategies to help children catch up
dpc27_t TC TC TC
Strategies to promote
attendance
dpc28_t TC TC
Other practices to involve parents
dpc26_8t TC TC
How do you build relationships with our children’s families
dcp29_t TC
How help parents support children
dpc30_t TC TC
Regular attendance of SC –comment
dcc8a_t TC
Reason SC is most frequently
absent (other)
dcc9_9t TC
Number of parent-teacher meetings attended by SC
dcc14_t TC TC
SC receives specialised services in school due to disability – comment
dcc15_t TC TC
SC has an Individual Education Plan – comment
dcc17_t TC
What SC does particularly well
dcc35_t TC TC TC TC
Benefits of having SC in
classroom
dcc36_t TC TC TC
Activities SC enjoys dcc37_t TC TC TC TC TC
Comments about SC or Aboriginal and Torres Strait Islander Indigenous children
dcc38_t TC TC TC TC TC
Anything else TC wants to tell dcc39_t TC TC TC TC
Note: P1 – primary carer; P2 – secondary carer; SC – Study Child; TC – teacher or carer.

APPENDIX C
Examples of merging in Stata
*Stata example of merging P1 wave 1 and P1 wave 2 data
version 11 /*merge syntax is slightly different for earlier versions of
stata*/
use "FOLDER_NAME_HERE\lsicp1w1_70c.dta", clear
merge 1:1 xwaveid using "FOLDER_NAME_HERE\lsicp1w2_70c.dta"
*Stata example of merging P1 wave 2 and P2 wave 2 data
version 11 /*merge syntax is slightly different for earlier versions of
stata*/
use "FOLDER_NAME_HERE\lsicp1w2_70c.dta", clear
merge 1:1 xwaveid using "FOLDER_NAME_HERE\lsicp2w2_70c.dta”