Embed Size (px)
Citation preview

Technical Fact Sheet SJ2017-FS2
Data Summary: Rodman Reservoir Drawdown

Data Summary: Rodman Reservoir Drawdown
Executive Summary
Data Summary: Rodman Reservoir Drawdown
This technical fact sheet documents the hydrologic data collected by the St. Johns River Water
Management District for the 2015–2016 drawdown of Rodman Reservoir. Rodman Reservoir is
drawn down every three to four years for resource management purposes by the Florida
Department of Environmental Protection and the data that are collected provide a better
understanding of the relationship between surface and groundwater levels.
The most recent drawdown event was monitored for hydrologic effects, which included local
declines of up to six feet for both the surficial and Upper Floridan aquifers and negligible
regional effects for each of these aquifer systems. Water levels were measured for groundwater
monitoring wells associated with both the surficial and Upper Floridan aquifers and for wells
adjacent to and a few miles away from the reservoir.
Hydrographs for wells located adjacent to Rodman Reservoir indicate declines in
surficial aquifer water levels of up to six feet and Upper Floridan aquifer declines of three
to six feet during the drawdown event. These effects indicate a hydraulic connection
between the surficial and Upper Floridan aquifers and a connection between groundwater
levels and the stage of the Rodman Reservoir.
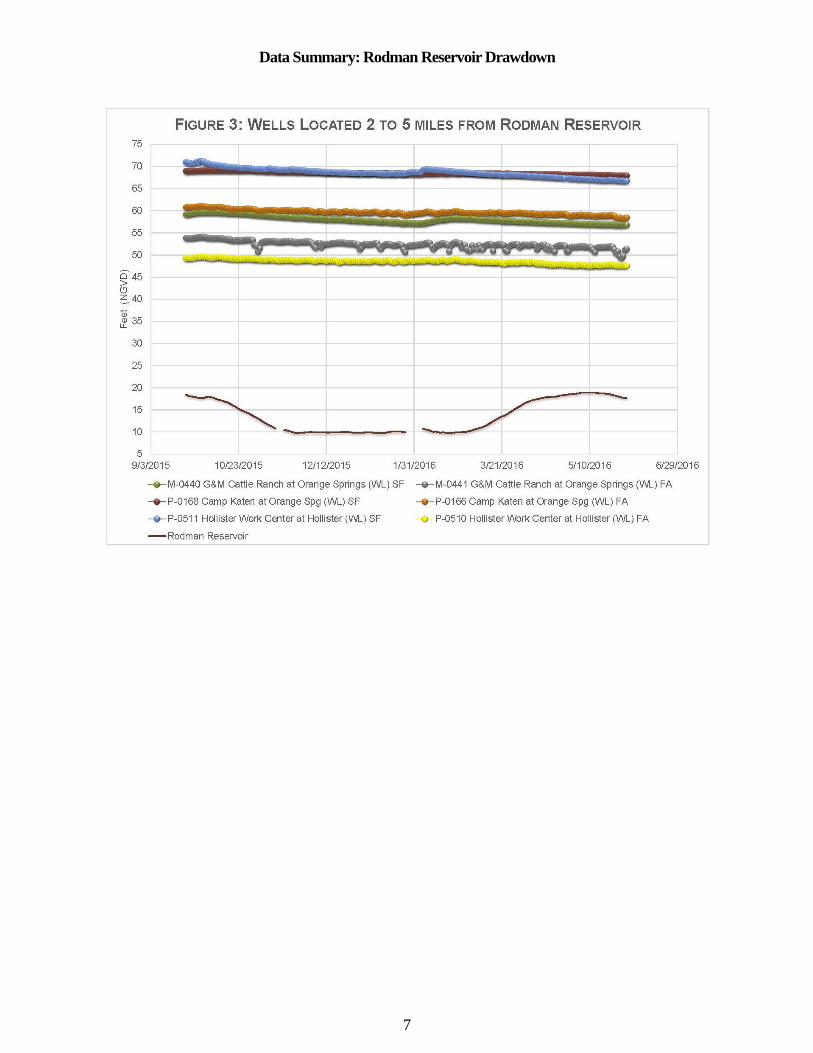
Hydrographs for well clusters located approximately two to five miles from the reservoir
indicate no response in groundwater levels to reservoir drawdown.
Several springs located under or adjacent to the reservoir were measured for discharge, with
measurements indicating that spring discharge during the drawdown is larger than during the
“full reservoir” condition. Spring discharge is directly related to the hydraulic relationship
between the water level of the Upper Floridan aquifer and that of the receiving surface water
body.
Spring discharge was measured for Sims, Tobacco Patch, Wells Landing, Fish Hook 1
and 2, Catfish, and Marion Blue Spring during the event.
Measured discharge ranged between 0.6 cfs (cubic feet per second) for Sims Spring and
6.1 cfs for Marion Blue Spring.

Data Summary: Rodman Reservoir Drawdown
3
Technical Fact Sheet SJ2017-FS2
Data Summary: Rodman Reservoir Drawdown
Introduction. This technical fact sheet documents the hydrologic data collected by the St. Johns
River Water Management District prior to and during the 2015–2016 drawdown of Rodman
Reservoir. The reservoir is located in southern Putnam and northern Marion counties in north-
central Florida (Figure 1). It was established in 1968 by constructing an earthen dam across the
Ocklawaha River. Currently, a four-gate spillway (Kirkpatrick Dam) controls water levels in the
reservoir. Drawdowns are conducted by the Florida Department of Environmental Protection
every three to four years, primarily to control invasive aquatic vegetation; the drawdown
procedure entails reducing the reservoir level for a period of six months. The most recent
drawdown occurred between October 2015 and April 2016.
Several observation wells are available to illustrate groundwater levels in the underlying surficial
and Upper Floridan aquifers (Figure 1). In addition, eight additional wells were either
constructed or adopted for monitoring for the 2015–2016 drawdown (see Figure 1, “New
Wells”).
Several subterranean springs exist along the perimeter of the Ocklawaha River (Figure 1), and
discharge values at these springs are affected by changes in reservoir levels. These springs are
submerged during full reservoir periods, but are accessible during drawdown events.

Data Summary: Rodman Reservoir Drawdown
4

Data Summary: Rodman Reservoir Drawdown
5
Water Levels. Groundwater monitoring wells in the area surrounding Rodman Reservoir are
categorized as either cluster well sites (i.e., with both an Upper Floridan and surficial aquifer
well) or as individual Upper Floridan aquifer (UFA) wells (Table 1). Water levels for four well
clusters that are adjacent to Rodman Reservoir (Figure 2) indicate surficial aquifer effects of up
to six feet during the drawdown (M-0798) and Upper Floridan effects of three to six feet (M-
0794). Water level changes at other nearby surficial aquifer (P-0319 and P-0318) and Upper
Floridan aquifer wells (P-0132 and P-0316) are between one and three feet. The basis for the
lower relative changes at these wells is most likely the proximity of the wells to the main channel
of the reservoir (Figure 1). These changes indicate a hydraulic relationship between the
responses for the surficial and Upper Floridan aquifers. They also indicate a connection between
groundwater levels and the stage of Rodman Reservoir. Well clusters that are located up to
several miles from the reservoir (Figure 3) suggest little to no relationship between the reservoir
drawdown and respective groundwater levels. These hydrographs do indicate a gradual decline
in water level that is attributable to relatively lower rainfall that occurs during the dry season.
Groundwater level measurements for UFA wells (Figure 4) indicate a relationship for wells that
are in close proximity to the reservoir (M-0793 and M-0794), but little to no connection for wells
that are several miles from the reservoir.

Data Summary: Rodman Reservoir Drawdown
6
Data Summary: Rodman Reservoir Drawdown
7

Data Summary: Rodman Reservoir Drawdown
8
Spring Discharge. The magnitude of spring discharge is a function of the difference between the
hydraulic pressure of the spring source (i.e., the Upper Floridan aquifer), and the spring pool
level (i.e., the receiving surface water body). The springs near Rodman Reservoir are measured
infrequently due to the difficulty of measuring discharge from a submerged spring. For the
2015–2016 drawdown, measurements were conducted for Sims, Tobacco Patch, Wells Landing,
Fish Hook 1 and 2, Catfish, and Marion Blue springs during the event (Figure 1). Measurements
were conducted by either a district consultant (i.e., Karst Environmental Services) or district staff

Data Summary: Rodman Reservoir Drawdown
9
(Table 2). For Marion Blue Spring, discharge was measured by divers directly at the spring vent,
utilizing a gridded measurement system that covers the entire spring vent.
Sims Spring had the lowest measured flow, 0.6 cubic feet per second (cfs), while Marion Blue
Spring had the largest flow, 6.1 cfs (note: discharge is rounded to the nearest 0.1 cfs). For
comparison, previous measurements at these springs and others are include in Appendix 1.
Summary. Rodman Reservoir is periodically drawn down for resource management purposes.
The drawdown event takes about six months and occurs every three to four years. The most
recent event was monitored for hydrologic effects. The effects associated with the drawdown
event include localized impacts of two to six feet and a wider effect of one to two feet of decline
in the surficial and Upper Floridan aquifers. Several springs that exist near the reservoir are
exposed during the event and were measured for discharge. Measured discharge data generally
indicates that spring discharge during a drawdown event is greater than that during the “full
reservoir” condition.

Data Summary: Rodman Reservoir Drawdown
10

Data Summary: Rodman Reservoir Drawdown
11