Embed Size (px)
Citation preview
DATA SNAPSHOT THURSTON THRIVES EDUCATION ACTION TEAM
Thurston County Public Health & Social Services Department
February 2014
Education Action Team Data Snapshot Page 1 Thurston Thrives Community Assessment 2014
TABLE OF CONTENTS
Introduction 2
Educational Attainment 3-7 High School Graduation Dropping Out Not in School or Working
Meeting Standard
Map Gallery 8-20 On-Time High School Graduation Adults with High School Education or Less Dropping Out of High School Going to College
4th Grade Meeting Standard 7th Grade Meeting Standard Public School Students Private School Students Homeschooled Students Homeless Students Special Education/Section 504 Students Free and Reduced Meal Program Students
Citations 21
Education Action Team Data Snapshot Page 2 Thurston Thrives Community Assessment 2014
INTRODUCTION Thurston Thrives is a community initiative focusing on how healthy people are today and the factors that influence how healthy the community will be in the future. These factors are: health behavior, the physical and built environment, health services, and local social and economic conditions. Together, these factors directly impact how long local residents live and the quality of life they experience during their lifetime. Thurston Thrives was established by the Thurston County Board of Health and is overseen with assistance of the Thurston Thrives Advisory Council. Topics that research has shown significantly influence community health are reviewed with the help of action teams. Each action team is led by a community member with in-depth knowledge of the topic area. The action teams are empowered to develop a common agenda on how best to address their topic area locally and are asked to report their recommendations to the Board of Health and Thurston Thrives Advisory Council.
EDUCATION AND HEALTH In 2013, the Thurston Thrives Education Action Team was formed to review the topic of education and its connection to health. Mike Hickman, Assistant Superintendent at Educational Service District 113 serves as the Education Action Team lead.
SNAPSHOT The purpose of this report is to provide support to those examining the connections between education and health.
Data in this report provides a current snapshot of community health issues associated with educational attainment. A selected set of measures related to the topic are presented.
Other local community data reports and plans with additional information about this topic may be available and are not integrated into the snapshot.
QUESTIONS If you have questions about:
The Thurston Thrives initiative contact Chris Hawkins, Coordinator, 360-867-2513, [email protected]
The Snapshot Report contact Mary Ann O’Garro, Epidemiologist, 360-867-2525, [email protected]
Education Action Team Data Snapshot Page 3 Thurston Thrives Community Assessment 2014
EDUCATIONAL ATTAINMENT Education is a powerful predictor of health and well-being across the life span.
Education Action Team Data Snapshot Page 4 Thurston Thrives Community Assessment 2014
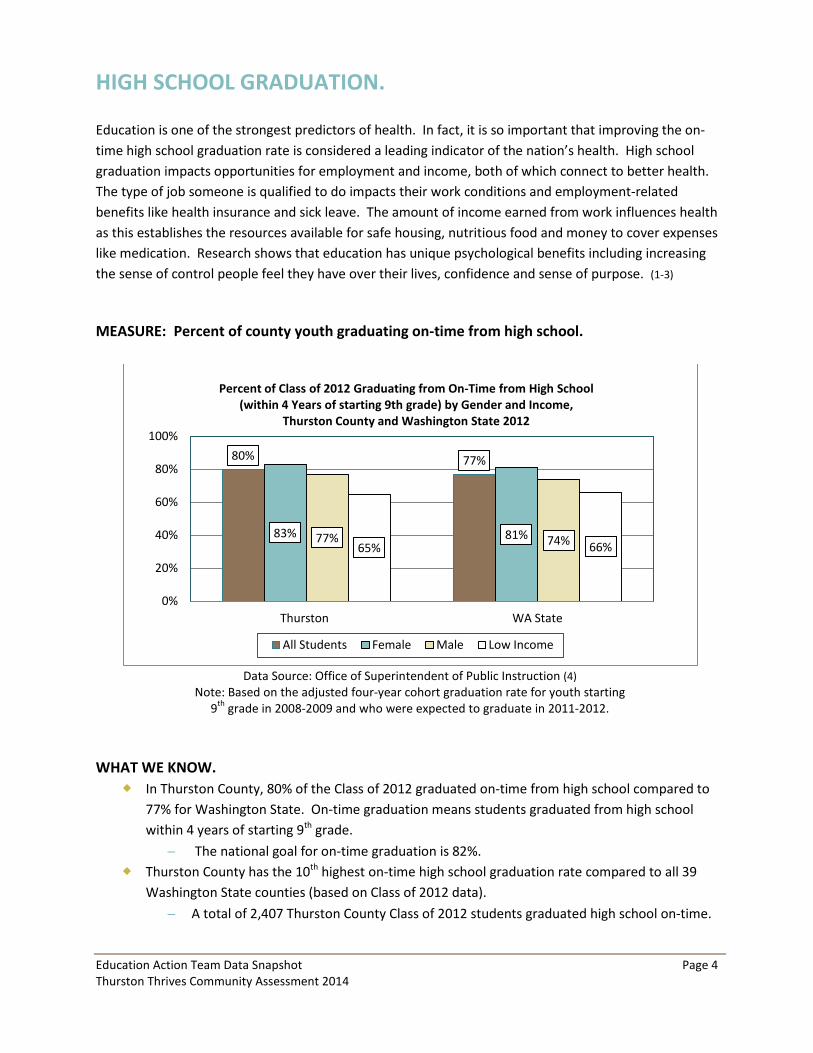
HIGH SCHOOL GRADUATION. Education is one of the strongest predictors of health. In fact, it is so important that improving the on-time high school graduation rate is considered a leading indicator of the nation’s health. High school graduation impacts opportunities for employment and income, both of which connect to better health. The type of job someone is qualified to do impacts their work conditions and employment-related benefits like health insurance and sick leave. The amount of income earned from work influences health as this establishes the resources available for safe housing, nutritious food and money to cover expenses like medication. Research shows that education has unique psychological benefits including increasing the sense of control people feel they have over their lives, confidence and sense of purpose. (1-3) MEASURE: Percent of county youth graduating on-time from high school.
Data Source: Office of Superintendent of Public Instruction (4)
Note: Based on the adjusted four-year cohort graduation rate for youth starting 9th grade in 2008-2009 and who were expected to graduate in 2011-2012.
WHAT WE KNOW. In Thurston County, 80% of the Class of 2012 graduated on-time from high school compared to
77% for Washington State. On-time graduation means students graduated from high school within 4 years of starting 9th grade.
− The national goal for on-time graduation is 82%. Thurston County has the 10th highest on-time high school graduation rate compared to all 39
Washington State counties (based on Class of 2012 data).
− A total of 2,407 Thurston County Class of 2012 students graduated high school on-time.
80% 77%
83% 81% 77% 74% 65% 66%
0%
20%
40%
60%
80%
100%
Thurston WA State
Percent of Class of 2012 Graduating from On-Time from High School (within 4 Years of starting 9th grade) by Gender and Income,
Thurston County and Washington State 2012
All Students Female Male Low Income
Education Action Team Data Snapshot Page 5 Thurston Thrives Community Assessment 2014
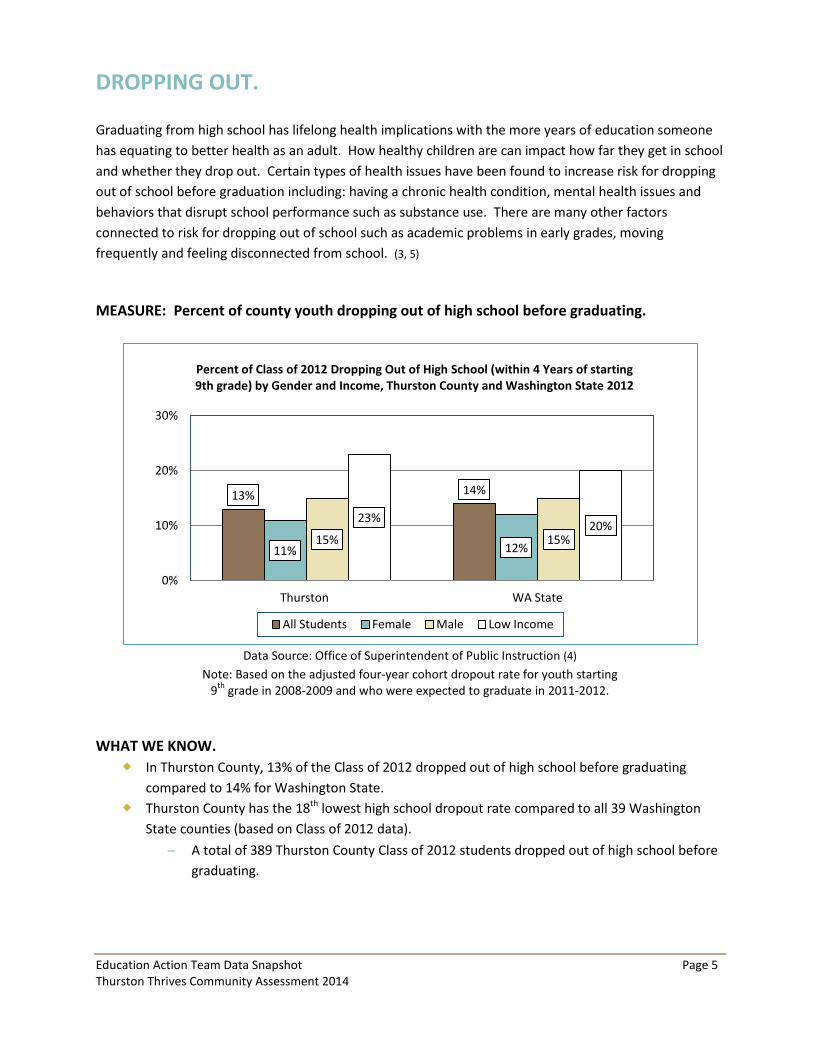
DROPPING OUT. Graduating from high school has lifelong health implications with the more years of education someone has equating to better health as an adult. How healthy children are can impact how far they get in school and whether they drop out. Certain types of health issues have been found to increase risk for dropping out of school before graduation including: having a chronic health condition, mental health issues and behaviors that disrupt school performance such as substance use. There are many other factors connected to risk for dropping out of school such as academic problems in early grades, moving frequently and feeling disconnected from school. (3, 5) MEASURE: Percent of county youth dropping out of high school before graduating.
Data Source: Office of Superintendent of Public Instruction (4)
Note: Based on the adjusted four-year cohort dropout rate for youth starting 9th grade in 2008-2009 and who were expected to graduate in 2011-2012.
WHAT WE KNOW. In Thurston County, 13% of the Class of 2012 dropped out of high school before graduating
compared to 14% for Washington State. Thurston County has the 18th lowest high school dropout rate compared to all 39 Washington
State counties (based on Class of 2012 data).
− A total of 389 Thurston County Class of 2012 students dropped out of high school before graduating.
13% 14%
11% 12% 15% 15%
23% 20%
0%
10%
20%
30%
Thurston WA State
Percent of Class of 2012 Dropping Out of High School (within 4 Years of starting 9th grade) by Gender and Income, Thurston County and Washington State 2012
All Students Female Male Low Income
Education Action Team Data Snapshot Page 6 Thurston Thrives Community Assessment 2014
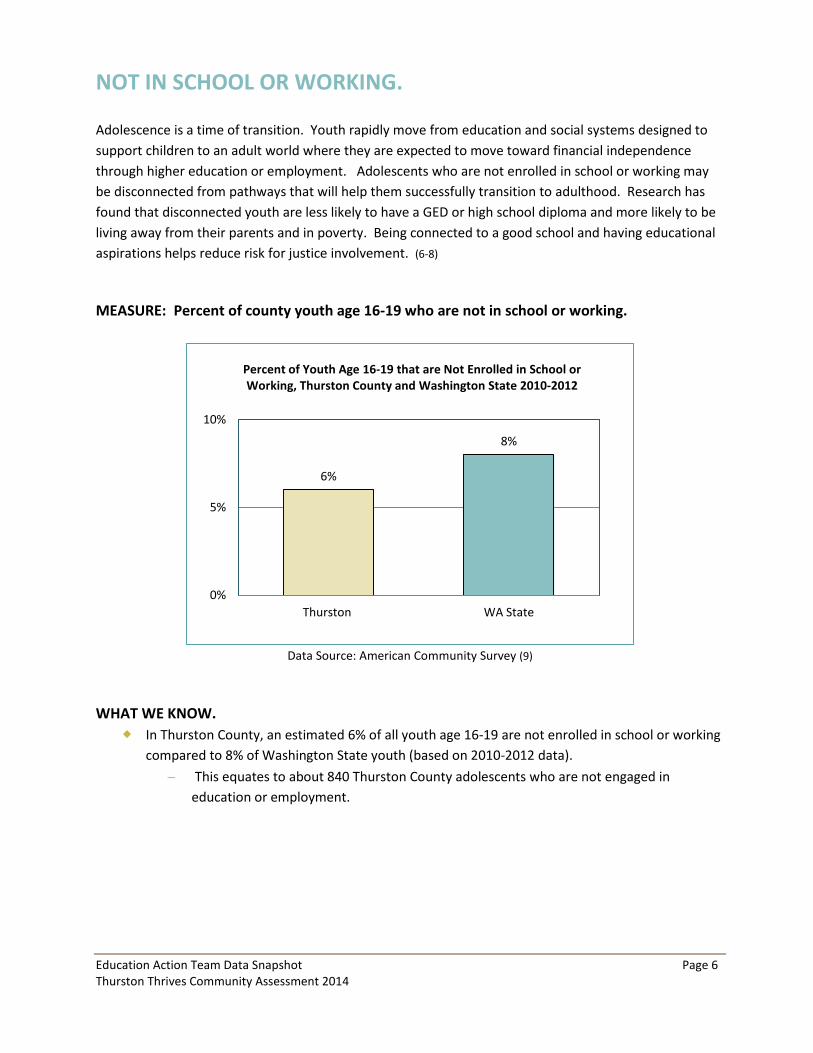
NOT IN SCHOOL OR WORKING. Adolescence is a time of transition. Youth rapidly move from education and social systems designed to support children to an adult world where they are expected to move toward financial independence through higher education or employment. Adolescents who are not enrolled in school or working may be disconnected from pathways that will help them successfully transition to adulthood. Research has found that disconnected youth are less likely to have a GED or high school diploma and more likely to be living away from their parents and in poverty. Being connected to a good school and having educational aspirations helps reduce risk for justice involvement. (6-8) MEASURE: Percent of county youth age 16-19 who are not in school or working.
Data Source: American Community Survey (9)
WHAT WE KNOW. In Thurston County, an estimated 6% of all youth age 16-19 are not enrolled in school or working
compared to 8% of Washington State youth (based on 2010-2012 data).
− This equates to about 840 Thurston County adolescents who are not engaged in education or employment.
6%
8%
0%
5%
10%
Thurston WA State
Percent of Youth Age 16-19 that are Not Enrolled in School or Working, Thurston County and Washington State 2010-2012
Education Action Team Data Snapshot Page 7 Thurston Thrives Community Assessment 2014
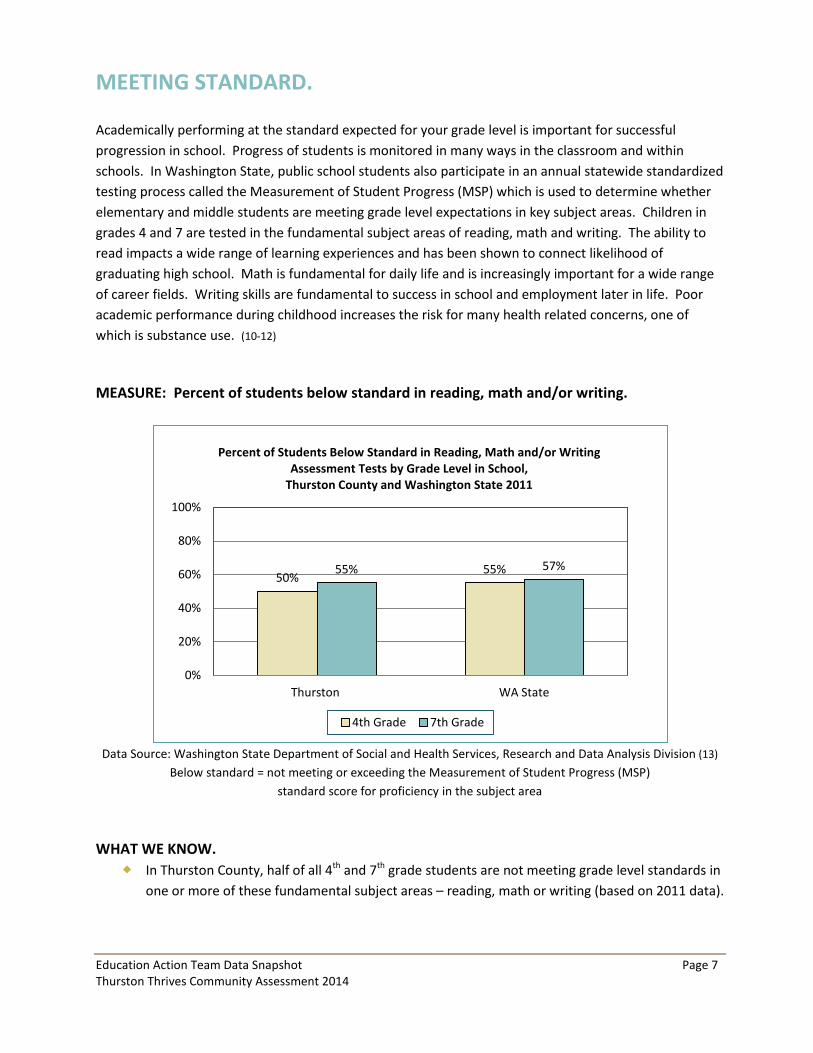
MEETING STANDARD. Academically performing at the standard expected for your grade level is important for successful progression in school. Progress of students is monitored in many ways in the classroom and within schools. In Washington State, public school students also participate in an annual statewide standardized testing process called the Measurement of Student Progress (MSP) which is used to determine whether elementary and middle students are meeting grade level expectations in key subject areas. Children in grades 4 and 7 are tested in the fundamental subject areas of reading, math and writing. The ability to read impacts a wide range of learning experiences and has been shown to connect likelihood of graduating high school. Math is fundamental for daily life and is increasingly important for a wide range of career fields. Writing skills are fundamental to success in school and employment later in life. Poor academic performance during childhood increases the risk for many health related concerns, one of which is substance use. (10-12) MEASURE: Percent of students below standard in reading, math and/or writing.
Data Source: Washington State Department of Social and Health Services, Research and Data Analysis Division (13)
Below standard = not meeting or exceeding the Measurement of Student Progress (MSP) standard score for proficiency in the subject area
WHAT WE KNOW. In Thurston County, half of all 4th and 7th grade students are not meeting grade level standards in
one or more of these fundamental subject areas – reading, math or writing (based on 2011 data).
50% 55% 55% 57%
0%
20%
40%
60%
80%
100%
Thurston WA State
Percent of Students Below Standard in Reading, Math and/or Writing Assessment Tests by Grade Level in School,
Thurston County and Washington State 2011
4th Grade 7th Grade
Education Action Team Data Snapshot Page 8 Thurston Thrives Community Assessment 2014
MAP GALLERY Health in detail.
Education Action Team Data Snapshot Page 9 Thurston Thrives Community Assessment 2014
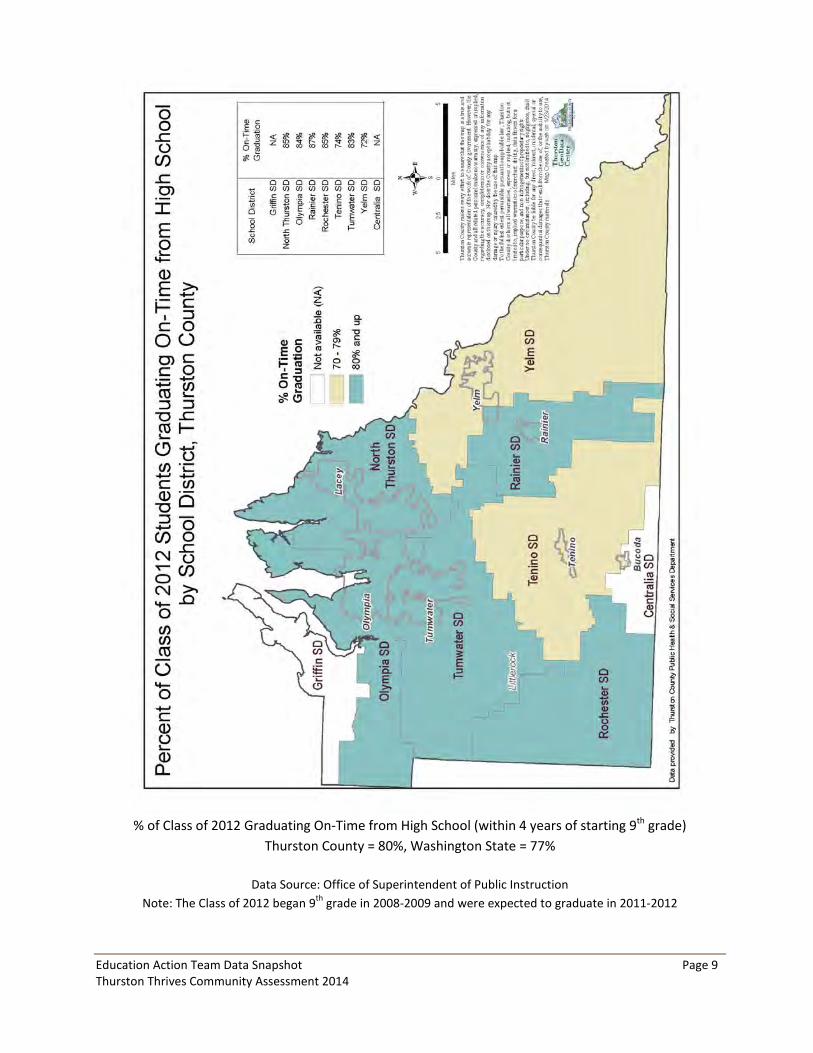
% of Class of 2012 Graduating On-Time from High School (within 4 years of starting 9th grade)
Thurston County = 80%, Washington State = 77%
Data Source: Office of Superintendent of Public Instruction
Note: The Class of 2012 began 9th grade in 2008-2009 and were expected to graduate in 2011-2012
Education Action Team Data Snapshot Page 10 Thurston Thrives Community Assessment 2014
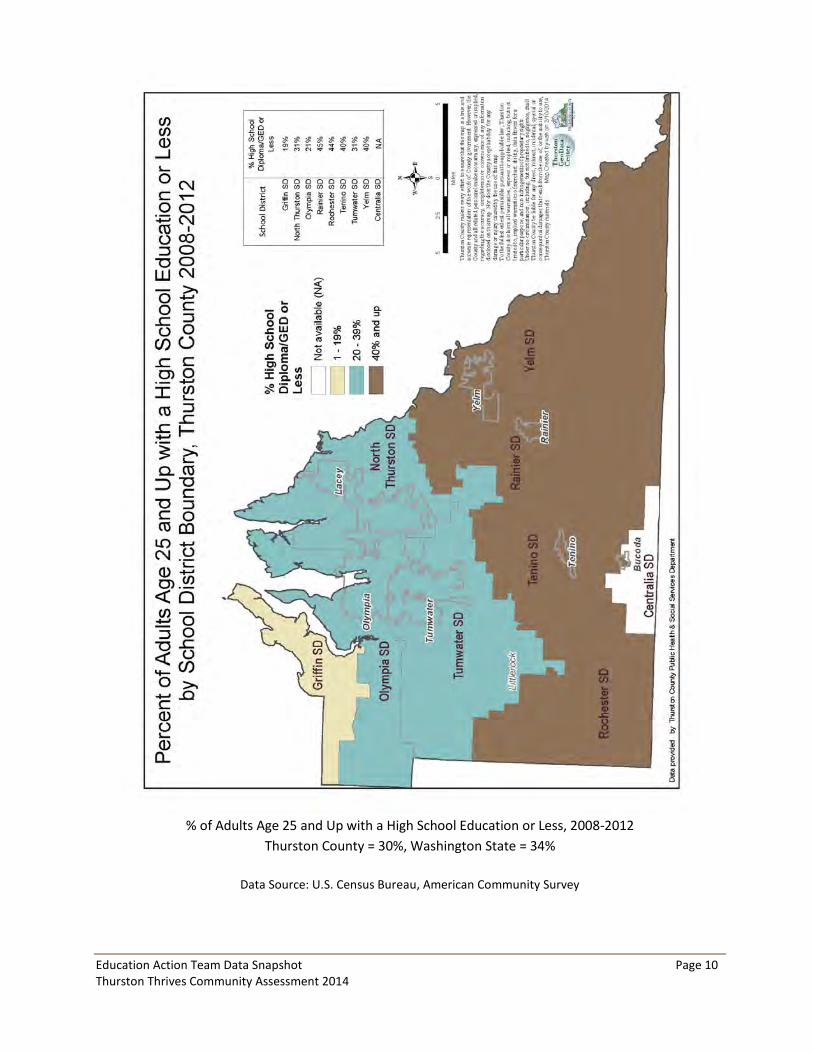
% of Adults Age 25 and Up with a High School Education or Less, 2008-2012
Thurston County = 30%, Washington State = 34%
Data Source: U.S. Census Bureau, American Community Survey
Education Action Team Data Snapshot Page 11 Thurston Thrives Community Assessment 2014
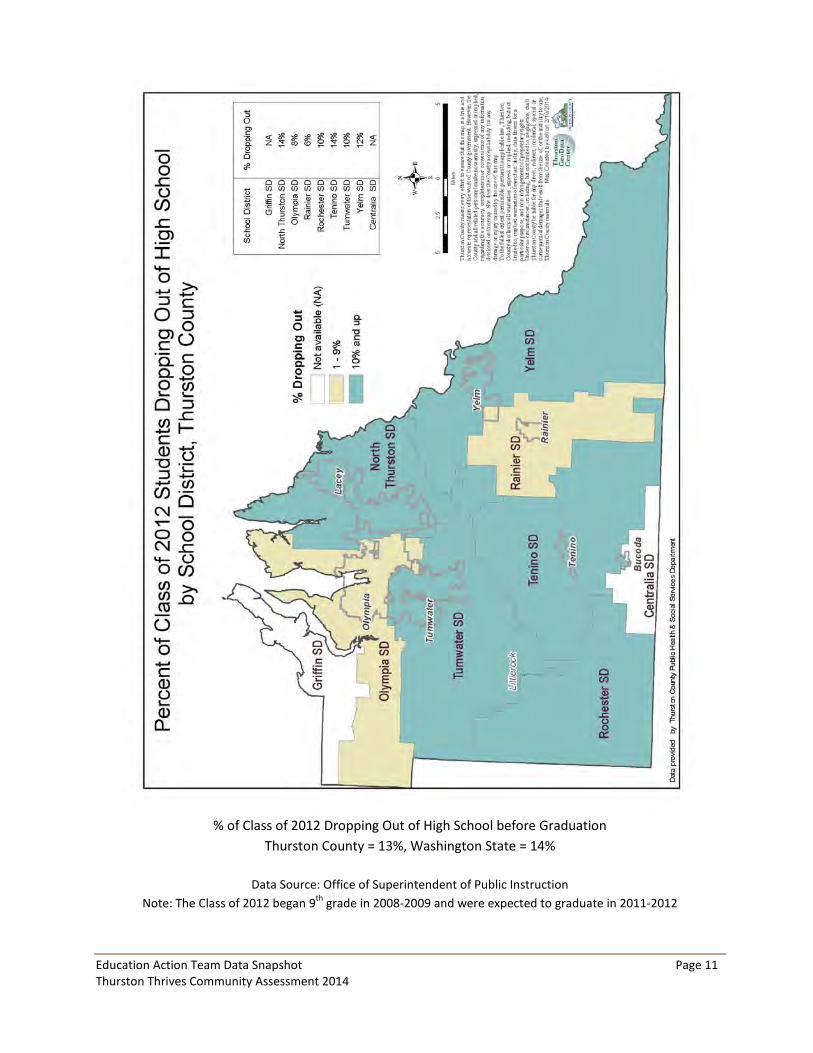
% of Class of 2012 Dropping Out of High School before Graduation
Thurston County = 13%, Washington State = 14%
Data Source: Office of Superintendent of Public Instruction
Note: The Class of 2012 began 9th grade in 2008-2009 and were expected to graduate in 2011-2012
Education Action Team Data Snapshot Page 12 Thurston Thrives Community Assessment 2014
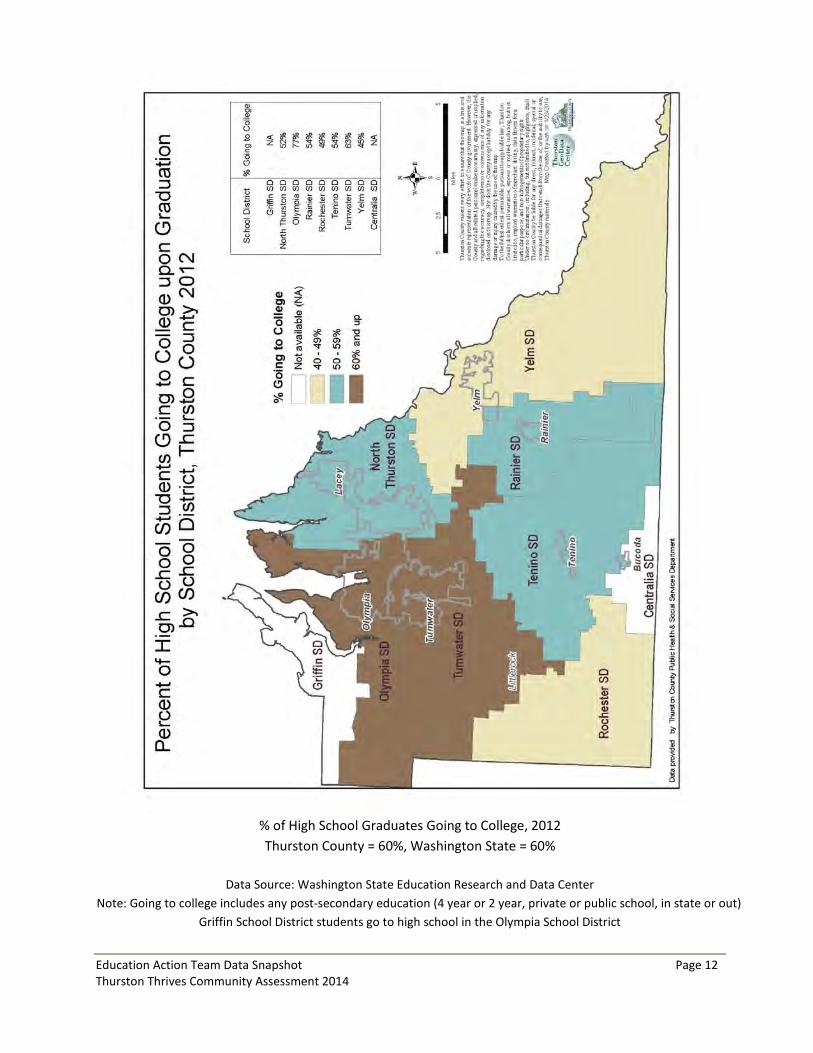
% of High School Graduates Going to College, 2012 Thurston County = 60%, Washington State = 60%
Data Source: Washington State Education Research and Data Center
Note: Going to college includes any post-secondary education (4 year or 2 year, private or public school, in state or out) Griffin School District students go to high school in the Olympia School District
Education Action Team Data Snapshot Page 13 Thurston Thrives Community Assessment 2014
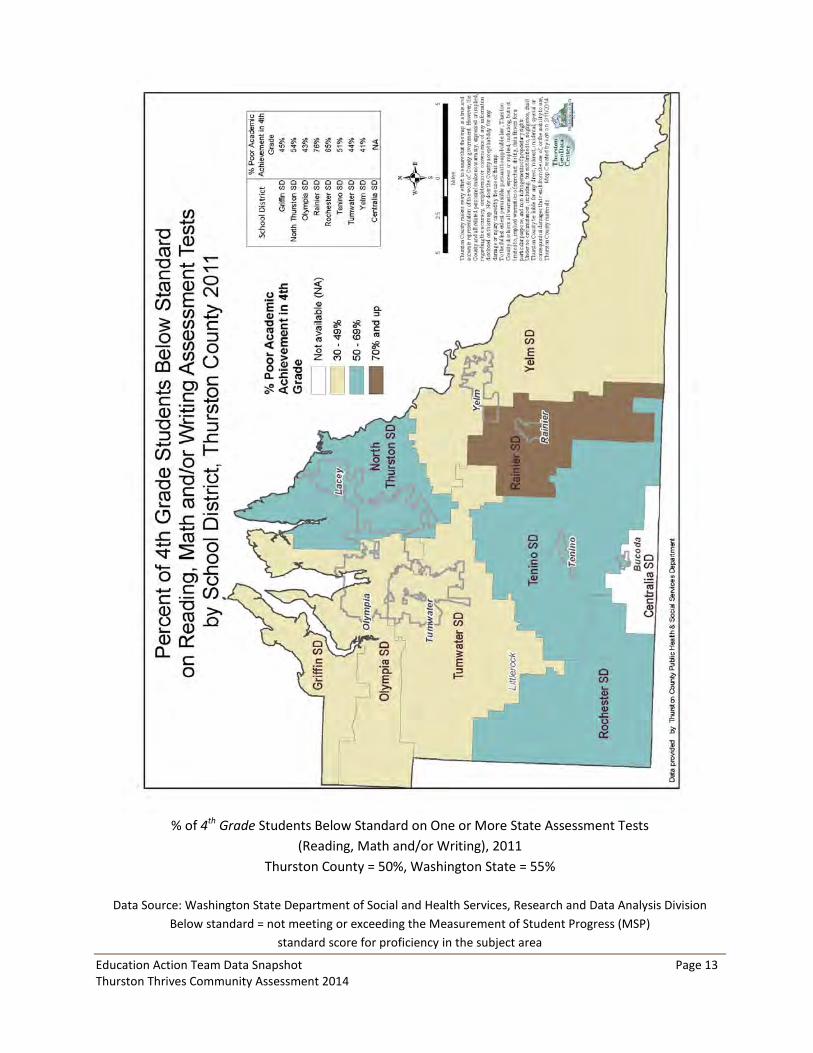
% of 4th Grade Students Below Standard on One or More State Assessment Tests
(Reading, Math and/or Writing), 2011 Thurston County = 50%, Washington State = 55%
Data Source: Washington State Department of Social and Health Services, Research and Data Analysis Division
Below standard = not meeting or exceeding the Measurement of Student Progress (MSP) standard score for proficiency in the subject area
Education Action Team Data Snapshot Page 14 Thurston Thrives Community Assessment 2014
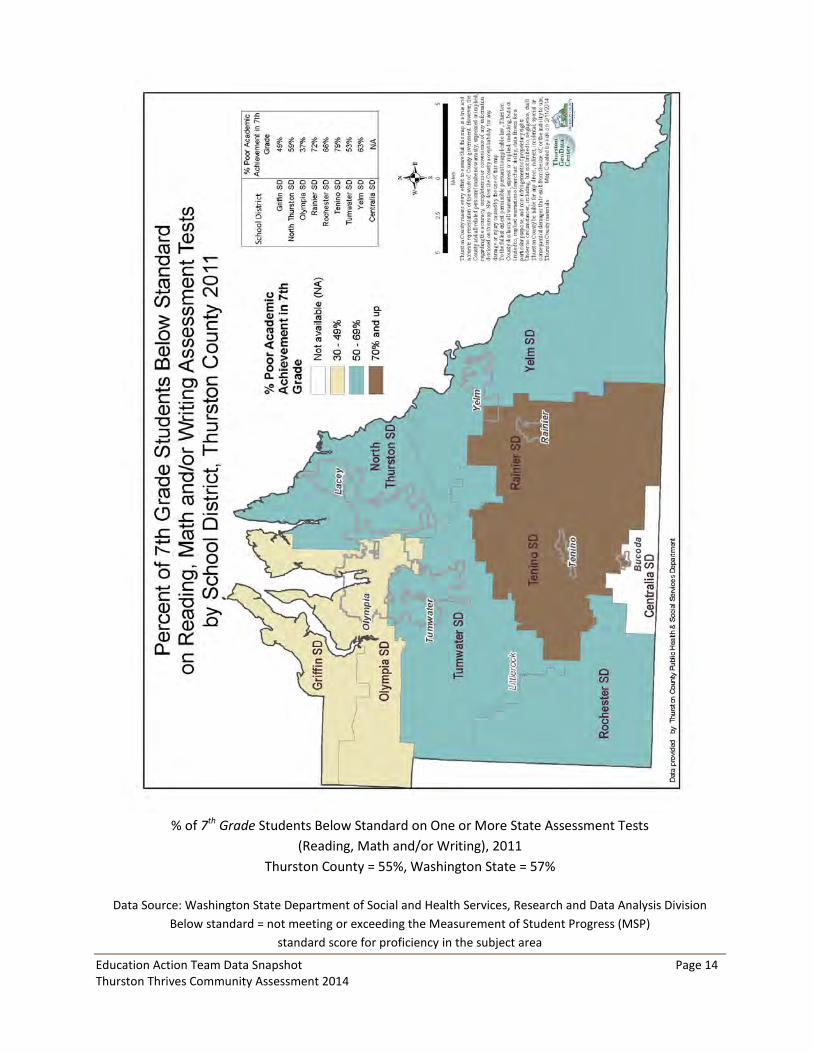
% of 7th Grade Students Below Standard on One or More State Assessment Tests
(Reading, Math and/or Writing), 2011 Thurston County = 55%, Washington State = 57%
Data Source: Washington State Department of Social and Health Services, Research and Data Analysis Division
Below standard = not meeting or exceeding the Measurement of Student Progress (MSP) standard score for proficiency in the subject area
Education Action Team Data Snapshot Page 15 Thurston Thrives Community Assessment 2014
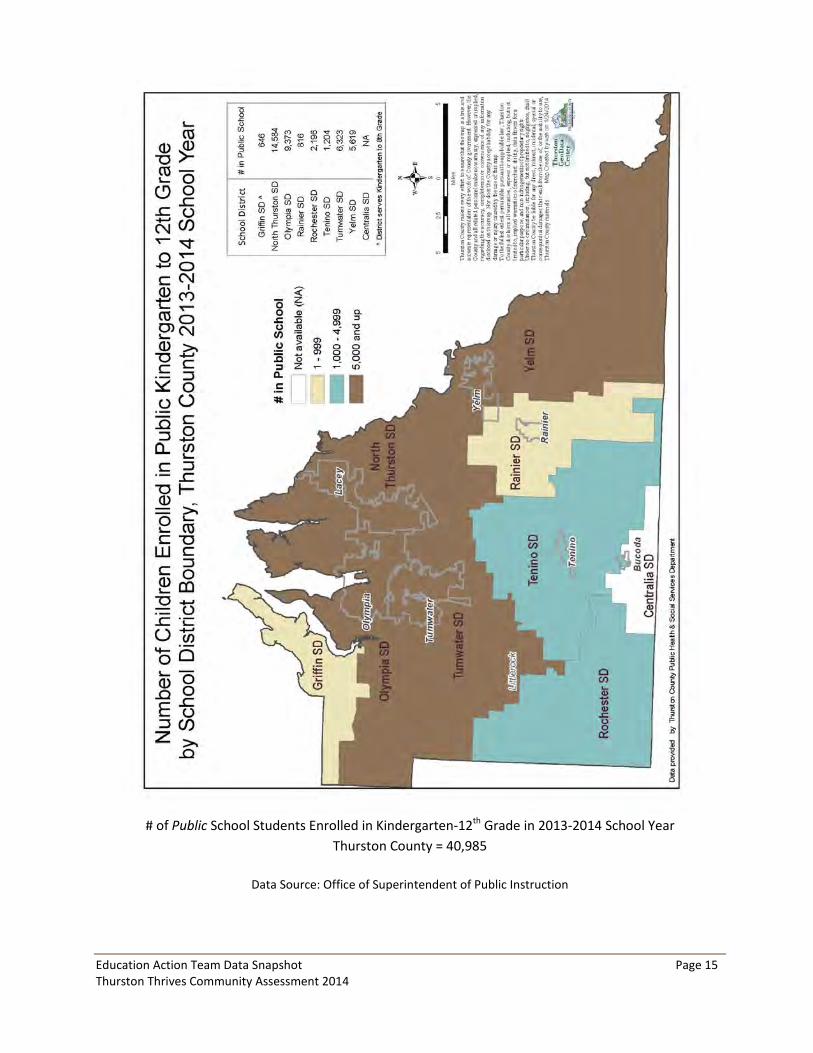
# of Public School Students Enrolled in Kindergarten-12th Grade in 2013-2014 School Year
Thurston County = 40,985
Data Source: Office of Superintendent of Public Instruction
Education Action Team Data Snapshot Page 16 Thurston Thrives Community Assessment 2014
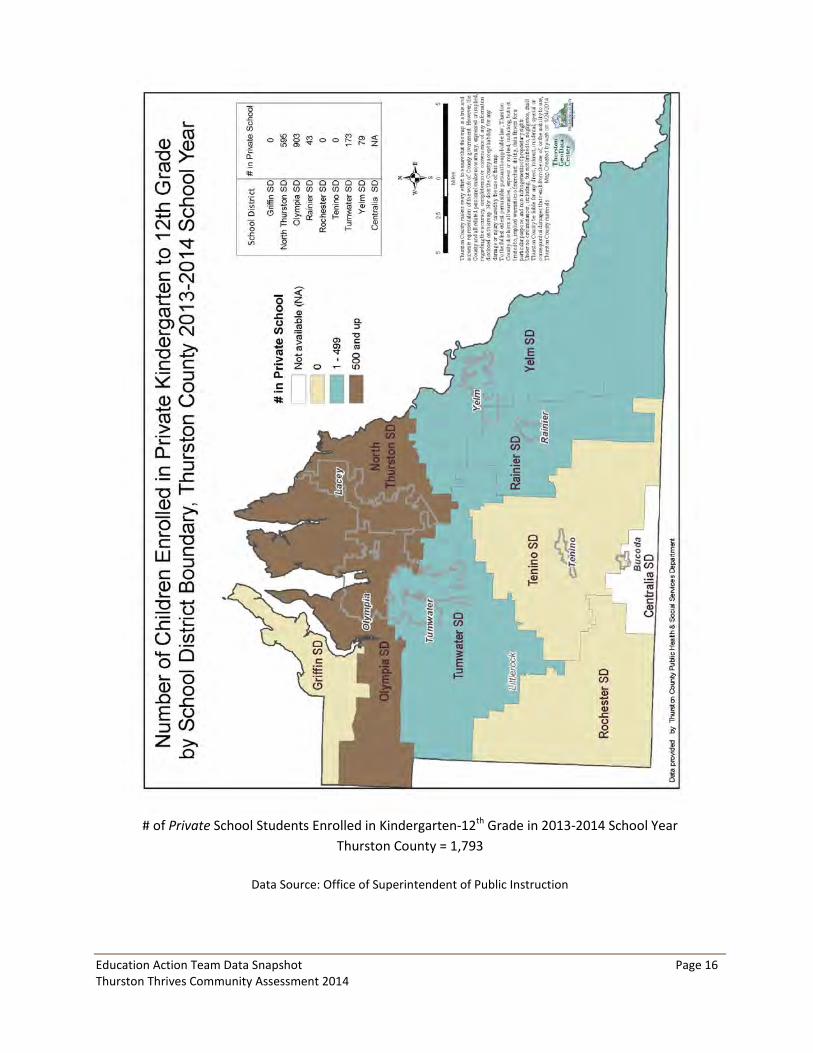
# of Private School Students Enrolled in Kindergarten-12th Grade in 2013-2014 School Year
Thurston County = 1,793
Data Source: Office of Superintendent of Public Instruction
Education Action Team Data Snapshot Page 17 Thurston Thrives Community Assessment 2014
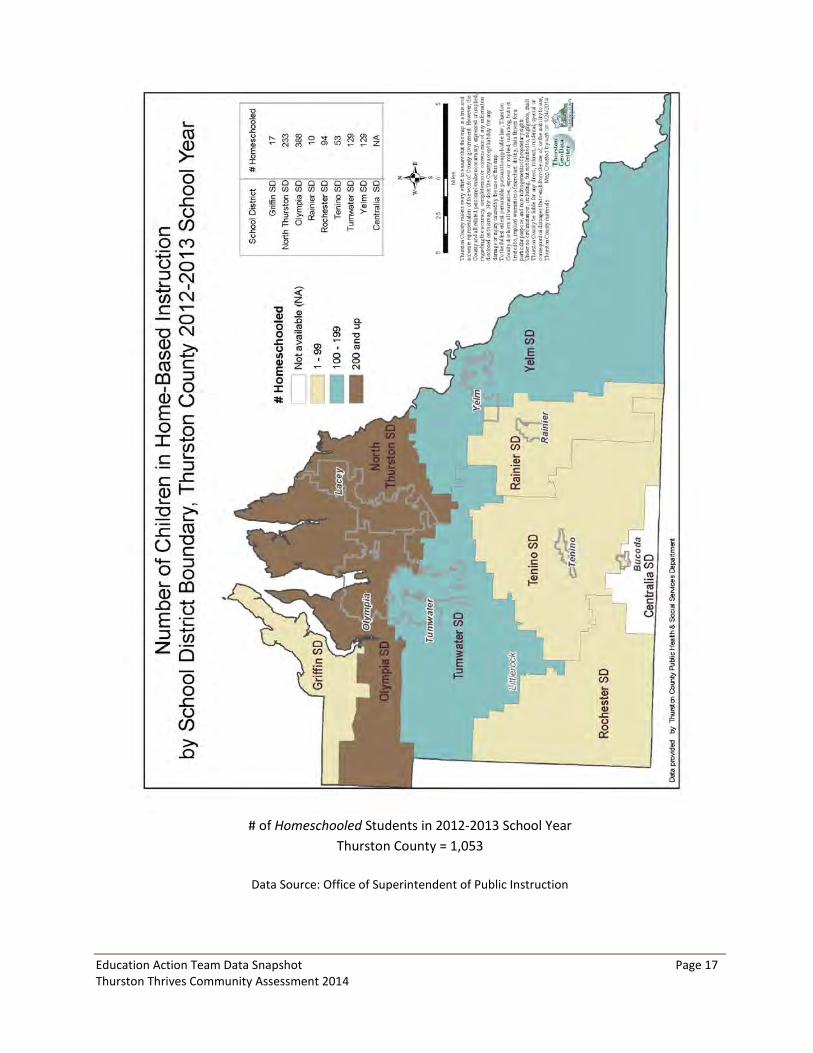
# of Homeschooled Students in 2012-2013 School Year
Thurston County = 1,053
Data Source: Office of Superintendent of Public Instruction
Education Action Team Data Snapshot Page 18 Thurston Thrives Community Assessment 2014
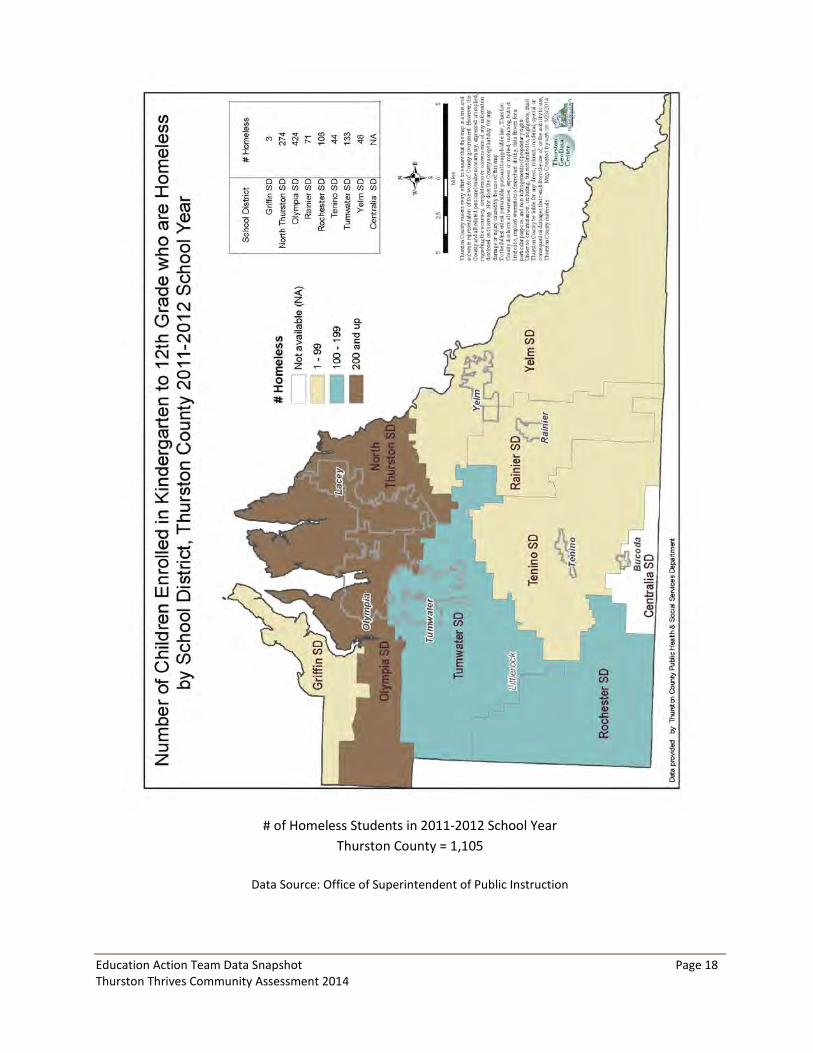
# of Homeless Students in 2011-2012 School Year
Thurston County = 1,105
Data Source: Office of Superintendent of Public Instruction
Education Action Team Data Snapshot Page 19 Thurston Thrives Community Assessment 2014
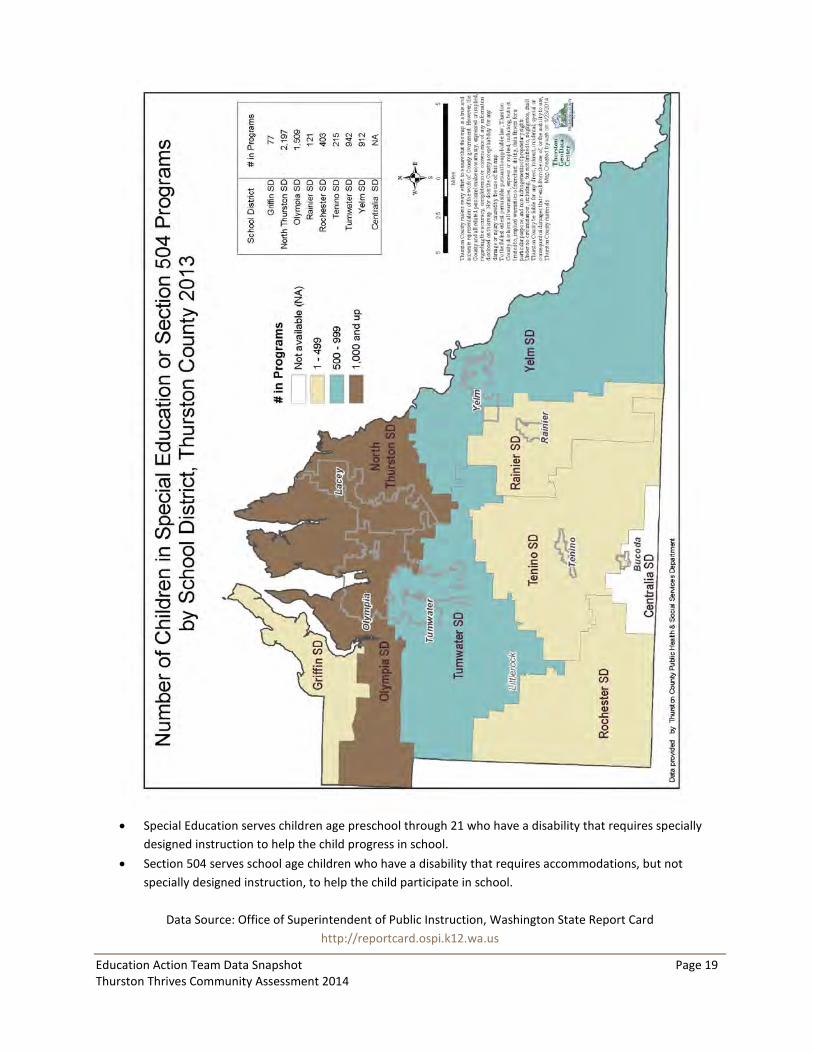
• Special Education serves children age preschool through 21 who have a disability that requires specially
designed instruction to help the child progress in school.
• Section 504 serves school age children who have a disability that requires accommodations, but not specially designed instruction, to help the child participate in school.
Data Source: Office of Superintendent of Public Instruction, Washington State Report Card
http://reportcard.ospi.k12.wa.us
Education Action Team Data Snapshot Page 20 Thurston Thrives Community Assessment 2014
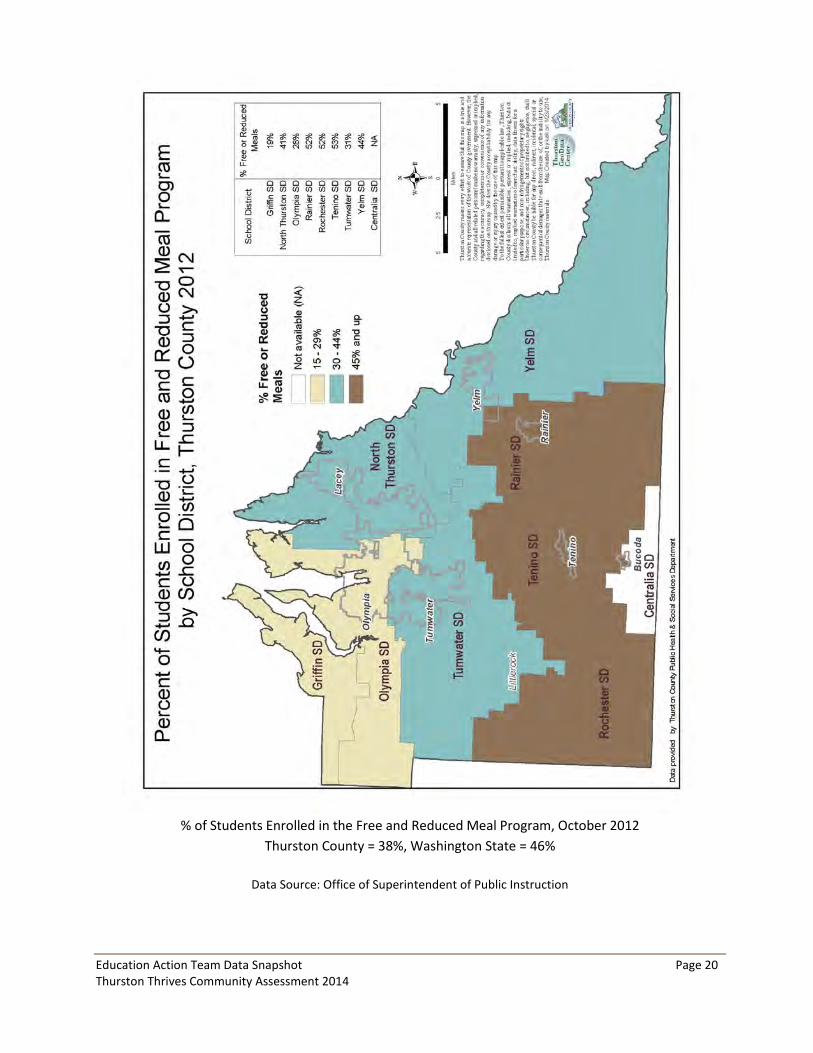
% of Students Enrolled in the Free and Reduced Meal Program, October 2012
Thurston County = 38%, Washington State = 46%
Data Source: Office of Superintendent of Public Instruction
Education Action Team Data Snapshot Page 21 Thurston Thrives Community Assessment 2014
CITATIONS.
(1) Healthy People 2020 Leading Health Indicators: Social Determinants. 2013. United States Department of Health & Human Services. http://healthypeople.gov/2020/LHI/socialDeterminants.aspx
(2) Issue Brief: Education Matters for Health. 2009. Robert Wood Johnson Foundation Commission to Build a Healthier America. www.commissiononhealth.org/Publications.aspx
(3) Reframing School Dropout as a Public Health Issue. 2007. Preventing Chronic Disease. Centers for Disease Control and Prevention. www.cdc.gov/pcd/issues/2007/oct/07_0063.htm
(4) Graduation and Dropout Statistics Annual Report 2011-12. 2013. Office of Superintendent of Public Instruction. www.k12.wa.us/DataAdmin/default.aspx
(5) Health in Childhood and Adolescence and High School Dropout. 2010. University of California Santa Barbara, California Dropout Research Project. www.cdrp.ucsb.edu/pubs_reports.htm
(6) Vulnerable Populations and the Transition to Adulthood. 2010. The Future of Children: Transition to Adulthood. Princeton University. www.futureofchildren.org/futureofchildren/publications/journals/
(7) Youth Neither Enrolled in School or Working. 2013. Child Trends. www.childtrends.org/?indicators=youth-neither-enrolled-in-school-nor-working
(8) Juvenile Justice and Delinquency Prevention: Risk and Protective Factors. 2012. Interagency Working Group on Youth Programs. www.findyouthinfo.gov/youth-topics/juvenile-justice/risk-and-protective-factors
(9) American Community Survey. 2010-2012 Three Years Combined. United States Census Bureau. http://factfinder2.census.gov/
(10) Testing Students in Washington State. 2014. Office of Superintendent of Public Instruction. www.k12.wa.us/assessment/StateTesting/default.aspx
(11) Reading Proficiency. 2014. Child Trends. www.childtrends.org/?indicators=reading-proficiency (12) Mathematics Proficiency. 2013. Child Trends. www.childtrends.org/?indicators=mathematics-proficiency (13) Risk and Protection Profile for Substance Abuse Prevention in Thurston County. 2013. Washington State
Department of Social and Health Services, Research and Data Analysis Division. www.dshs.wa.gov/rda/research/risk.shtm
Education Action Team Data Snapshot Page 22 Thurston Thrives Community Assessment 2014
Thurston County Public Health & Social Services Department 412 Lilly Road NE, Olympia, WA 98506
Phone: 360-867-2500, Fax: 360-867-2601 TDD: 1-800-658-6384
Website: www.co.thurston.wa.us/health Twitter: @ThurstonHealth