Embed Size (px)
Citation preview
REPORT
2015hMAY2016
DATA SERIES
Health leading performance indicators – 2015 data
Disclaimer
Whilst every effort has been made to ensure the accuracy of the information contained in this publication, neither IOGP nor any of its members past present or future warrants its accuracy or will, regardless of its or their negligence, assume liability for any foreseeable or unforeseeable use made thereof, which liability is hereby excluded. Consequently, such use is at the recipient’s own risk on the basis that any use by the recipient constitutes agreement to the terms of this disclaimer. The recipient is obliged to inform any subsequent recipient of such terms.
This publication is made available for information purposes and solely for the private use of the user. IOGP will not directly or indirectly endorse, approve or accredit the content of any course, event or otherwise where this publication will be reproduced.
Copyright notice
The contents of these pages are © International Association of Oil & Gas Producers. Permission is given to reproduce this report in whole or in part provided (i) that the copyright of IOGP and (ii) the sources are acknowledged. All other rights are reserved. Any other use requires the prior written permission of IOGP.
These Terms and Conditions shall be governed by and construed in accordance with the laws of England and Wales. Disputes arising here from shall be exclusively subject to the jurisdiction of the courts of England and Wales.
AcknowledgementsIOGP acknowledges the participation of the companies that have submitted health performance indicators. This report was produced by the IOGP-IPIECA Health Committee.
Photography used with permission courtesy of ©psphotograph/iStockphoto (Back cover)
DATA SERIES
Health leading performance indicators – 2015 data
Revision history
VERSION DATE AMENDMENTS
1.0 May 2016 First release
REPORT
2015hMAY2016

4Health leading performance indicators – 2015 data
The health leading performance indicatorsIn 2007, the joint Health Committee of the International Association of Oil & Gas Producers (IOGP) and IPIECA, the global oil and gas industry association for environmental and social issues, published IOGP Report 393, Health Performance Indicators. A guide for the oil and gas industry.
Content from that report was used to develop two tools that can be used• to assess health leading performance indicators within individual companies,
and• to compare performance between different parts of a company and between
participating companies.
Both tools were used in 2015 to gauge health performance between participating IOGP and IPIECA member companies. All IOGP and IPIECA member companies were invited to participate in the 2015 data reporting exercise. The results are published in this report (Report 2015h).
The scope of the health performance indicators reporting differs from that used for the safety, process safety and environmental performance reporting in that data are included for both upstream and downstream activities.
There are no major changes to this report compared with Report 2014h, Health Performance Indicators – 2014 data.
Data seriesThis report is published as part of the IOGP data series. IOGP produces annual reports of safety, process safety and environmental performance indicators. These are available from the IOGP website at http://www.IOGP.org/publications.
Preface

5
Contents
Preface 4
Contributing IOGP and IPIECA member companies 6
Scope 7
Introduction 8
Percentage tool results 9
Gap analysis tool results 14
Gap analysis tool – each element in detail 21Gap analysis tool: Element 1 – Health risk assessment and planning 21Gap analysis tool: Element 2 – Industrial hygiene and control of workplace exposures 24Gap analysis tool: Element 3 – Medical emergency management 27Gap analysis tool: Element 4 – Management of ill-health in the workplace 30Gap analysis tool: Element 5 – Fitness for task assessment and health surveillance 33Gap analysis tool: Element 6 – Health impact assessment 36Gap analysis tool: Element 7 – Health reporting and record management 39Gap analysis tool: Element 8 – Public health interface and promotion of good health 42
Appendix A: Percentage tool example 45
Appendix B: Health management system gap analysis tool example 46
Appendix C: The eight elements of the health management system that are measured 47
6Health leading performance indicators – 2015 data
Contributing IOGP and IPIECA member companies
The health leading performance indicators were derived from results provided by the following companies:
ADNOCANADARKOBAKER HUGHES BASHNEFTBG GROUPBHP BILLITONBPCHEVRONCNOOCCONOCOPHILLIPSENIEXXONMOBILGDF SUEZ E&P INTERNATIONALHESS CORPORATIONKUWAIT OIL COMPANY
MARATHON OIL COMPANYOMVPEMEXPETROBRASPETRONASPTTEPRASGASREPSOLSAIPEMSCHLUMBERGER SHELL COMPANIESSTATOILTOTALWINTERSHALL
7Overview
Scope
The Health Committee is run jointly between IPIECA, the global oil and gas industry association for environmental and social issues, and IOGP, the International Association of Oil & Gas Producers.
The IOGP membership includes companies operating in the upstream oil and gas industry whereas the IPIECA membership includes companies operating both upstream and downstream. Therefore the scope of the health performance indicators data presented in this report is different to the data presented in other reports within the IOGP data series.
The health performance indicators are leading indicators. The process involves a self-assessment of the company’s performance in relation to standardized statements about the level of implementation of the company’s own health management systems. The participating companies perform this self-assessment on the scope of their operational activities therefore there is no separation between upstream and downstream operations.
The scope of the health performance indicators reporting also includes data provided by associate member contracting companies that have chosen to participate.
In 2013, the invitation to participate in this analysis was extended to both IOGP and IPIECA member companies and organizations. We are therefore seeing a large increase in the number of companies taking part from 2013 data onwards compared with previous years.
The reporting of all leading or lagging company data is voluntary.
For comparison, Report 2015s, Safety performance indicators – 2015 data, Report 2015p, Safety performance indicators – Process safety events – 2015 data, and Report 2015e, Environmental performance indicators – 2015 data, contain data relating to lagging indicators. In these reports, data are reported by the participating oil and gas operating companies, inclusive of their contracted employees and activities related only to their upstream operations. Contractor companies, even though they may be associate members, do not report data directly to IOGP. This is a deliberate approach that has been taken to avoid duplication of reporting.
8Health leading performance indicators – 2015 data
Introduction
In 2008, the IOGP–IPIECA Health Committee published IOGP Report 393, Health Performance Indicators. A guide for the oil and gas industry.
The principles described in Report 393 were used to develop two tools (gap analysis tool and percentage tool) that could be used to:
• assess health performance within individual companies; and• compare performance between different parts of a company and between
participating companies.
These are all leading performance indicators.
The results of the data gathered using the health performance indicator tools for the years 2008–2014 have previously been published as IOGP Reports 2011h, 2012h, 2013h and 2014h.
This report presents the data reported by participating companies for 2015. The data represent 29 companies, all of which provided data for both tools.
• 19 of the companies also participated in 2014.• Three of the companies are reporting for the first time.• Seven companies that participated in 2014 did not participate in 2015.
In addition to the 2015 data submission, the 2014 data submission is presented for the gap analysis tool by statement score, as a comparison to the 2015 data.
Percentage tool results for the years 2011, 2012, 2013 and 2014 are shown to allow comparison with 2015 results.
• In 2014, 26 companies took part and all submitted data for each analysis.• In 2013, 29 companies took part and all submitted data for each analysis.• In 2012, 16 companies took part and submitted data for the gap analysis and
15 companies submitted data for the percentage tool analysis.• In 2011, 18 companies took part and 17 of these companies submitted data
for each analysis.
Each company is assigned a code letter that changes each year to maintain confidentiality. This code is not in any way related to the company name.
When responses are taken together, they provide a good indication of performance as a whole since differences between the way companies have interpreted and used the tools are likely to even out.
Examples from the percentage tool and the gap analysis tool are given in Appendices A and B.
The eight elements of the health management system are described in Appendix C.

9Percentage tool results
Percentage tool results
The percentage tool measures the extent of a company’s management of the eight elements of their health management system across their business. The results can be used to compare performance between different parts of a company and between companies and the annual mean values of the participating companies.
Percentages are calculated as the result of a self-assessment performed by each company to gauge the extent of their compliance with the requirements of each element. The percentage portion of the business that complies with each level from 1 to 4 is entered into the tool. The total must add up to 100%:
• Level 1. Process under development.• Level 2. Process in place but not fully implemented and embedded.• Level 3. Process in place and implemented. System functioning. System
procedures documented and results being measured.• Level 4. Process in place and implemented. System sustained and supported
by an on-going improvement process.
The results from the percentage tool are displayed as a radar chart representing levels 1 to 4 with the highest level of compliance displayed by the largest block of colour.
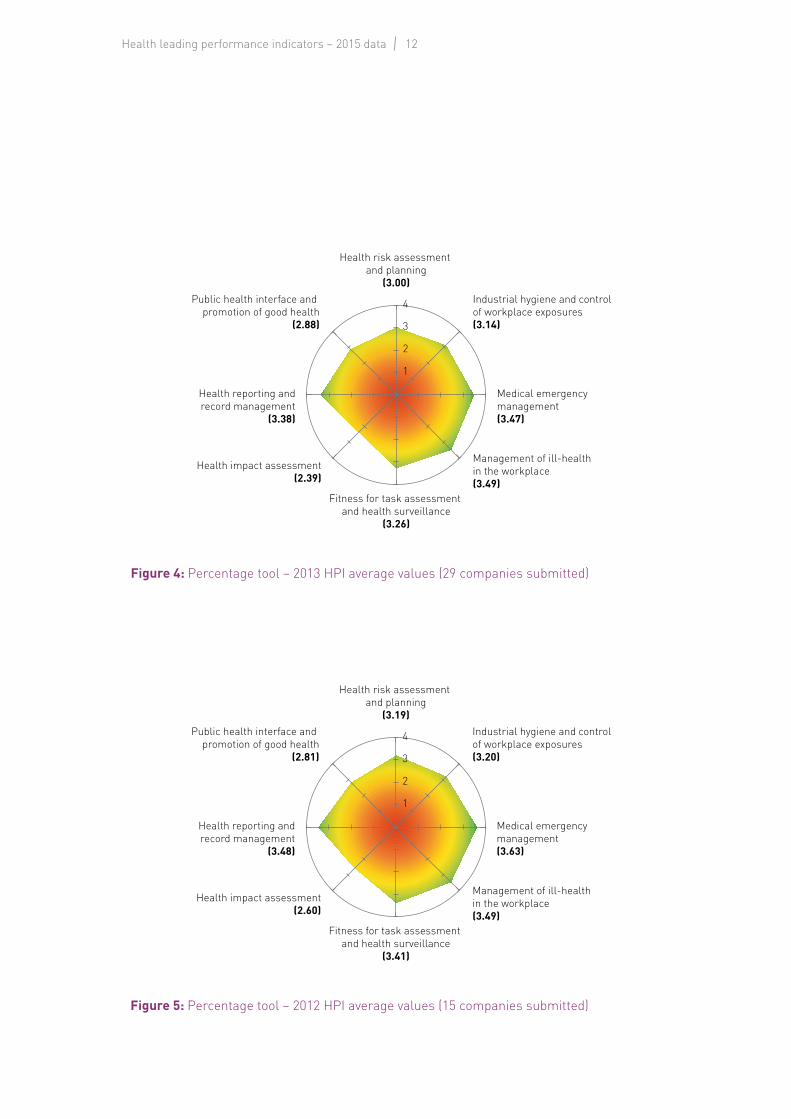
Individual companies can compare their own radar charts with the averages in Figure 2, which represent the consolidated results from the 29 companies that participated in the percentage tool data collection for the year 2015.
The results for the years 2011 to 2014 are shown in Figures 3, 4, 5 and 6.
Progress can be seen by overlapping the results for each year of the 2011–2015 reporting period, shown in Figure 7.
The results from the percentage tool show similar values for the years shown with generally increasing scores in the elements year-on-year.
• The health impact assessment element has consistently scored lowest over the five years of analysis although is showing signs of increasing in 2015.
• Industrial hygiene and control of workplace exposures is the only element to show a decrease in score from 2014 to 2015.
• Medical emergency management and management of ill-health in the workplace have both scored the highest in the past five years.
• Health reporting and record management, critical to the provision of robust data, has been in the top 3 for the past four years.
Both tools show that participating oil and gas company management of medical ill-health and emergencies scored the highest result and health impact assessment scored the lowest.
Despite the variation in participating companies across the five years, average values for each health area are quite consistent.

10Health leading performance indicators – 2015 data
0
5
10
15
20
25
30
35
20152014201320122011
1715
2926
Num
ber o
f par
ticip
atin
g co
mpa
nies
(p
erce
ntag
e to
ol)
29
Figure 1: Number of participating companies 2011–2015 (percentage tool)
Table 1: Percentage tool mean analysis 2011–2015
Element 2011 2012 2013 2014 2015
Health risk assessment and planning 3.09 3.19 3.00 3.21 3.36
Industrial hygiene and control of workplace exposures
3.25 3.20 3.14 3.38 3.26
Medical emergency management 3.71 3.63 3.47 3.74 3.70
Management of ill-health in the workplace 3.57 3.49 3.49 3.64 3.70
Fitness for task assessment and health surveillance
3.46 3.41 3.26 3.36 3.39
Health impact assessment 2.44 2.60 2.39 2.70 2.74
Health reporting and record management 3.35 3.48 3.38 3.49 3.52
Public health interface and promotion of good health
2.97 2.81 2.88 3.09 3.31

11Percentage tool results
1
2
3
4Public health interface and promotion of good health
(3.31)
Health reporting andrecord management
(3.52)
Health impact assessment(2.74)
Fitness for task assessment and health surveillance
(3.39)
Management of ill-health in the workplace(3.70)
Medical emergency management(3.70)
Industrial hygiene and control of workplace exposures(3.26)
Health risk assessment and planning
(3.36)
Figure 2: Percentage tool – 2015 HPI average values (29 companies submitted)
1
2
3
4Public health interface and promotion of good health
(3.09)
Health reporting andrecord management
(3.49)
Health impact assessment(2.70)
Fitness for task assessment and health surveillance
(3.36)
Management of ill-health in the workplace(3.64)
Medical emergency management(3.74)
Industrial hygiene and control of workplace exposures(3.38)
Health risk assessment and planning
(3.21)
Figure 3: Percentage tool – 2014 HPI average values (25 companies submitted)
12Health leading performance indicators – 2015 data
1
2
3
4Public health interface and promotion of good health
(2.81)
Health reporting andrecord management
(3.48)
Health impact assessment(2.60)
Fitness for task assessment and health surveillance
(3.41)
Management of ill-health in the workplace(3.49)
Medical emergency management(3.63)
Industrial hygiene and control of workplace exposures(3.20)
Health risk assessment and planning
(3.19)
Figure 5: Percentage tool – 2012 HPI average values (15 companies submitted)
1
2
3
4Public health interface and promotion of good health
(2.88)
Health reporting andrecord management
(3.38)
Health impact assessment(2.39)
Fitness for task assessment and health surveillance
(3.26)
Management of ill-health in the workplace(3.49)
Medical emergency management(3.47)
Industrial hygiene and control of workplace exposures(3.14)
Health risk assessment and planning
(3.00)
Figure 4: Percentage tool – 2013 HPI average values (29 companies submitted)

13Percentage tool results
1
2
3
4Public health interface and promotion of good health
(2.97)
Health reporting andrecord management
(3.35)
Health impact assessment(2.44)
Fitness for task assessment and health surveillance
(3.46)
Management of ill-health in the workplace(3.57)
Medical emergency management(3.71)
Industrial hygiene and control of workplace exposures(3.25)
Health risk assessment and planning
(3.09)
Figure 6: Percentage tool – 2011 HPI average values (17 companies submitted)
Public health interface and promotion of good health
Health reporting andrecord management
Health impact assessment
Fitness for task assessment and health surveillance
Management of ill-health in the workplace
Medical emergency management
Industrial hygiene and control of workplace exposures
Health risk assessment and planning
201420132012
20112015
1
2
3
4
Figure 7: Percentage tool mean analysis 2011–2015
14Health leading performance indicators – 2015 data
Gap analysis tool results
The gap analysis tool allows for in-depth analysis at site and corporate level.
The same eight health management system elements are used but in this tool each element is further broken down into component statements relating to activities that may be performed by different professionals or may not apply to a particular site or company.
The statements are rated as levels 1–4 (as they are in the percentage tool) with an additional level 5 for ‘not applicable’.
Where a company has allocated a score of 5, indicating that the issue is not applicable, this score is not included in the average values.
Figure 8 shows the number of companies participating in each year. • 29 companies took part in 2015.• 26 companies took part in 2014.• 29 took part in 2013.
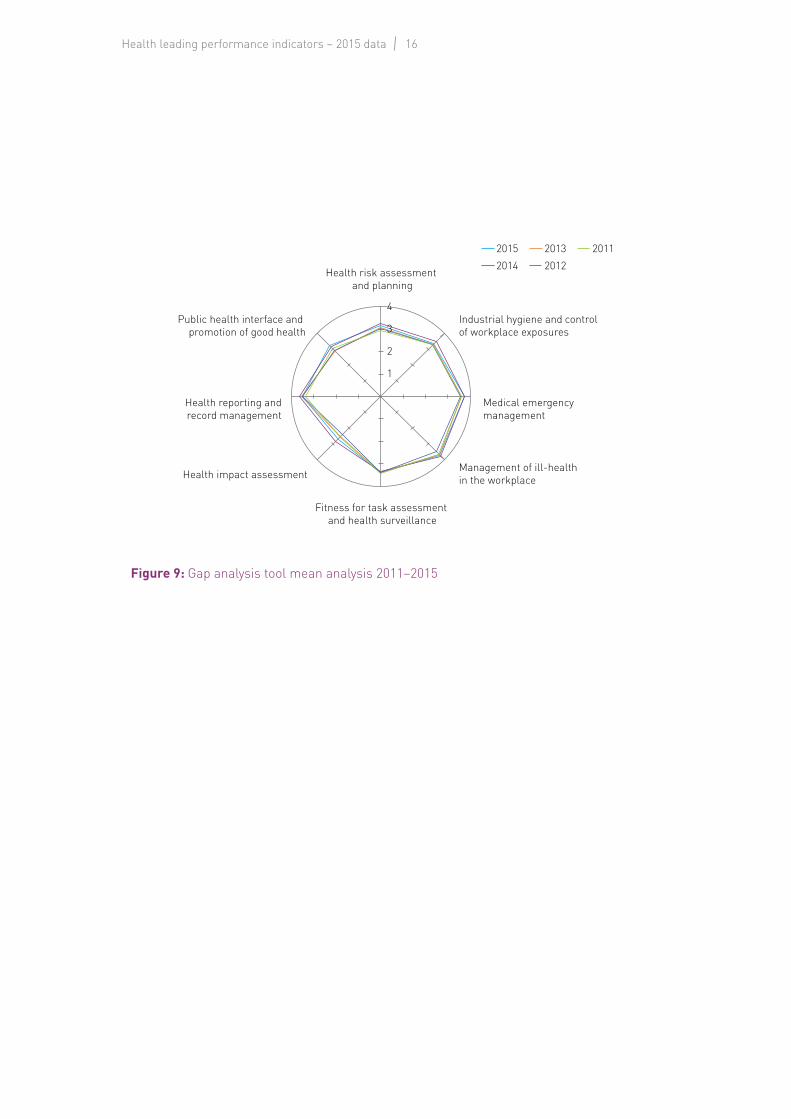
The results for each element can be viewed as a radar chart with the individual statements around the circumference and this enables performance gaps to be visualized, Figure 9. All eight elements can be viewed as a heat chart to identify areas for improvement. As with the percentage tool, results can be overlapped to show overall progress (based on the data provided by the respondents).
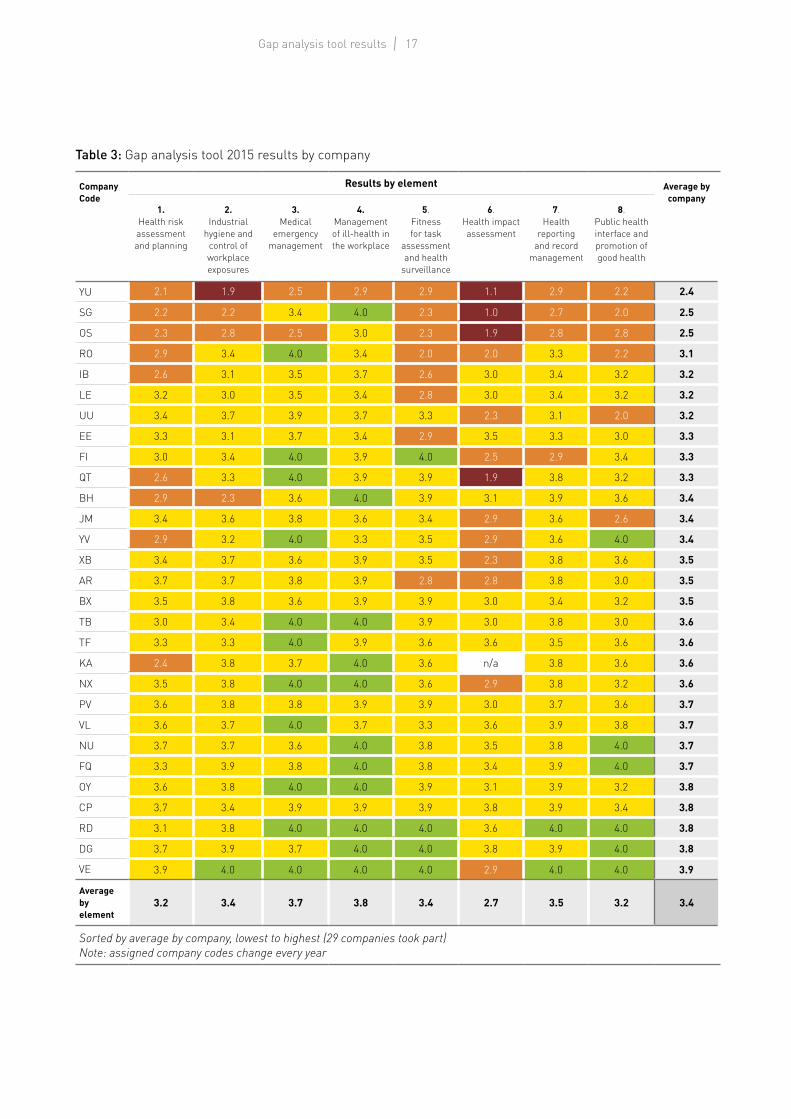
All 77 statements and grouped results are presented in Tables 3–22 for data submitted for 2014 and 2015.
Combined company results from 2015 and 2014 are shown and these can be viewed by company (Tables 3 and 4). This enables individual companies not only to use their results to identify potential gaps in their own health management systems and set targets for improvement but also to indicate how they compare with their peers.
The results from the gap analysis tool show similar values for the years shown:• Health impact assessment has consistently scored lowest over the five years
of analysis and some signs of decline have shown since 2014. • Industrial hygiene and control of workplace exposures scores have declined
from 2014 to 2015.• Medical emergency management and management of ill-health in the
workplace have both scored highest in the past five years.• Health reporting and record management, critical to the provision of robust
data, has been in the top 3 for the past five years.
It can be seen from both tools that participating oil and gas company management of medical ill-health and emergencies scored the highest and health impact assessment scored the lowest.
Despite the variation in participating companies across the five years, average values for each health area are quite consistent.

15Gap analysis tool results
0
5
10
15
20
25
30
35
20152014201320122011
17 16
29 2926
Num
ber o
f par
ticip
atin
g co
mpa
nies
(g
ap a
naly
sis
tool
)
Figure 8: Participating companies 2011–2015 (gap analysis tool)
Table 2: Gap analysis tool mean analysis 2011–2015
Element 2011 2012 2013 2014 2015
Health risk assessment and planning 2.97 3.06 3.08 3.27 3.19
Industrial hygiene and control of workplace exposures
3.29 3.26 3.31 3.49 3.36
Medical emergency management 3.61 3.57 3.59 3.73 3.74
Management of ill-health in the workplace 3.64 3.49 3.68 3.77 3.75
Fitness for task assessment and health surveillance
3.45 3.39 3.40 3.35 3.40
Health impact assessment 2.56 2.42 2.53 2.83 2.73
Health reporting and record management 3.36 3.50 3.55 3.65 3.53
Public health interface and promotion of good health
3.02 2.91 2.89 3.14 3.23
16Health leading performance indicators – 2015 data
Public health interface and promotion of good health
Health reporting andrecord management
Health impact assessment
Fitness for task assessment and health surveillance
Management of ill-health in the workplace
Medical emergency management
Industrial hygiene and control of workplace exposures
Health risk assessment and planning
201420132012
20112015
1
2
3
4
Figure 9: Gap analysis tool mean analysis 2011–2015
17Gap analysis tool results
Table 3: Gap analysis tool 2015 results by company
Company Code
Results by element Average by company
1. Health risk assessment and planning
2. Industrial
hygiene and control of workplace exposures
3. Medical
emergency management
4. Management of ill-health in the workplace
5. Fitness for task
assessment and health
surveillance
6. Health impact assessment
7. Health
reporting and record
management
8. Public health interface and promotion of good health
YU 2.1 1.9 2.5 2.9 2.9 1.1 2.9 2.2 2.4
SG 2.2 2.2 3.4 4.0 2.3 1.0 2.7 2.0 2.5
OS 2.3 2.8 2.5 3.0 2.3 1.9 2.8 2.8 2.5
RO 2.9 3.4 4.0 3.4 2.0 2.0 3.3 2.2 3.1
IB 2.6 3.1 3.5 3.7 2.6 3.0 3.4 3.2 3.2
LE 3.2 3.0 3.5 3.4 2.8 3.0 3.4 3.2 3.2
UU 3.4 3.7 3.9 3.7 3.3 2.3 3.1 2.0 3.2
EE 3.3 3.1 3.7 3.4 2.9 3.5 3.3 3.0 3.3
FI 3.0 3.4 4.0 3.9 4.0 2.5 2.9 3.4 3.3
QT 2.6 3.3 4.0 3.9 3.9 1.9 3.8 3.2 3.3
BH 2.9 2.3 3.6 4.0 3.9 3.1 3.9 3.6 3.4
JM 3.4 3.6 3.8 3.6 3.4 2.9 3.6 2.6 3.4
YV 2.9 3.2 4.0 3.3 3.5 2.9 3.6 4.0 3.4
XB 3.4 3.7 3.6 3.9 3.5 2.3 3.8 3.6 3.5
AR 3.7 3.7 3.8 3.9 2.8 2.8 3.8 3.0 3.5
BX 3.5 3.8 3.6 3.9 3.9 3.0 3.4 3.2 3.5
TB 3.0 3.4 4.0 4.0 3.9 3.0 3.8 3.0 3.6
TF 3.3 3.3 4.0 3.9 3.6 3.6 3.5 3.6 3.6
KA 2.4 3.8 3.7 4.0 3.6 n/a 3.8 3.6 3.6
NX 3.5 3.8 4.0 4.0 3.6 2.9 3.8 3.2 3.6
PV 3.6 3.8 3.8 3.9 3.9 3.0 3.7 3.6 3.7
VL 3.6 3.7 4.0 3.7 3.3 3.6 3.9 3.8 3.7
NU 3.7 3.7 3.6 4.0 3.8 3.5 3.8 4.0 3.7
FQ 3.3 3.9 3.8 4.0 3.8 3.4 3.9 4.0 3.7
OY 3.6 3.8 4.0 4.0 3.9 3.1 3.9 3.2 3.8
CP 3.7 3.4 3.9 3.9 3.9 3.8 3.9 3.4 3.8
RD 3.1 3.8 4.0 4.0 4.0 3.6 4.0 4.0 3.8
DG 3.7 3.9 3.7 4.0 4.0 3.8 3.9 4.0 3.8
VE 3.9 4.0 4.0 4.0 4.0 2.9 4.0 4.0 3.9
Average by element
3.2 3.4 3.7 3.8 3.4 2.7 3.5 3.2 3.4
Sorted by average by company, lowest to highest (29 companies took part)Note: assigned company codes change every year

18Health leading performance indicators – 2015 data
Table 4: Gap analysis tool 2014 results by company
Company Code
Results by element Average by company
1. Health risk assessment and planning
2. Industrial
hygiene and control of workplace exposures
3. Medical
emergency management
4. Management of ill-health in the workplace
5. Fitness for task
assessment and health
surveillance
6. Health impact assessment
7. Health
reporting and record
management
8. Public health interface and promotion of good health
NM 2.0 2.7 3.8 3.6 1.4 1.3 2.1 1.8 2.3
TA 2.4 2.6 3.8 3.1 1.9 1.5 2.3 1.8 2.5
HU 2.0 3.2 4.0 3.9 3.8 1.0 3.2 2.8 3.0
MJ 3.0 3.2 3.4 3.1 2.0 n/a 3.7 1.6 3.0
PE 2.3 3.0 3.0 3.7 3.1 3.0 3.2 3.0 3.1
LL 2.8 3.4 3.0 3.7 3.0 3.0 3.7 1.6 3.2
BB 3.4 3.6 3.9 3.7 3.3 2.3 3.0 2.0 3.2
NA 3.2 3.1 3.5 3.4 2.8 3.4 3.6 3.4 3.3
VB 3.2 3.7 3.6 3.9 3.5 1.0 3.8 3.6 3.3
AT 3.2 3.7 3.8 3.3 3.1 3.0 3.6 2.5 3.4
JU 2.9 3.3 4.0 3.3 3.4 2.9 3.5 3.8 3.4
KE 3.3 3.3 3.6 3.7 3.6 2.5 3.7 3.4 3.4
JM 3.2 3.8 3.5 3.9 3.9 2.9 3.4 3.2 3.4
XP 3.0 3.6 3.6 4.0 3.4 2.9 3.8 3.4 3.5
XX 3.9 3.6 3.8 3.9 2.8 2.8 3.8 3.0 3.5
LN 3.3 3.1 3.6 4.0 3.9 3.4 3.7 3.2 3.5
SA 2.6 3.4 3.7 4.0 3.6 n/a 3.7 3.8 3.5
PG 3.2 3.8 3.9 4.0 3.8 3.0 3.8 3.0 3.6
VY 3.3 3.7 3.7 4.0 4.0 3.0 3.9 3.4 3.6
DT 3.6 3.7 3.8 4.0 3.5 3.4 3.9 3.4 3.7
UT 3.4 3.3 4.0 4.0 3.8 3.8 4.0 3.8 3.8
QB 3.7 3.4 3.9 3.9 3.9 3.8 3.9 3.4 3.8
MC 3.9 4.0 4.0 4.0 4.0 2.4 4.0 3.6 3.8
MT 3.1 3.8 4.0 4.0 4.0 4.0 4.0 4.0 3.8
FJ 4.0 4.0 4.0 3.9 n/a 3.5 3.9 3.4 3.9
HA 4.0 3.9 3.8 3.9 4.0 3.8 4.0 4.0 3.9
Average by element
3.3 3.5 3.7 3.8 3.4 2.8 3.7 3.1 3.5
Sorted by average by company, lowest to highest (26 companies took part)Note: assigned company codes change every year
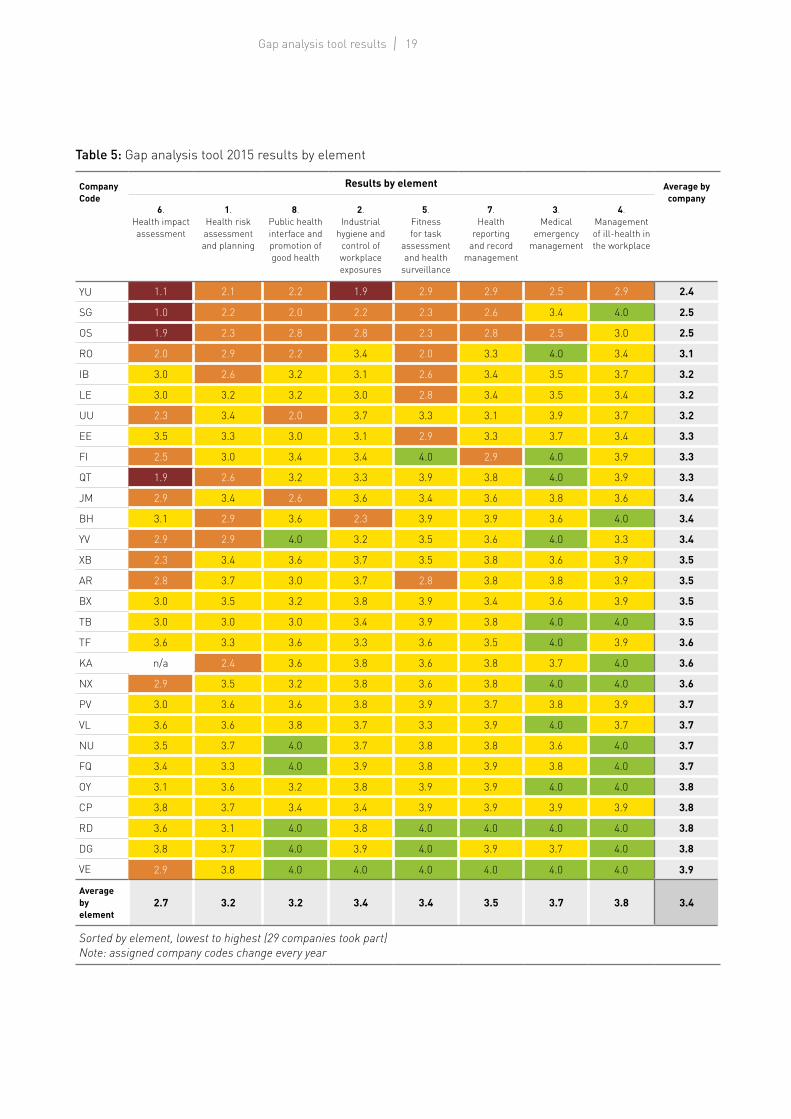
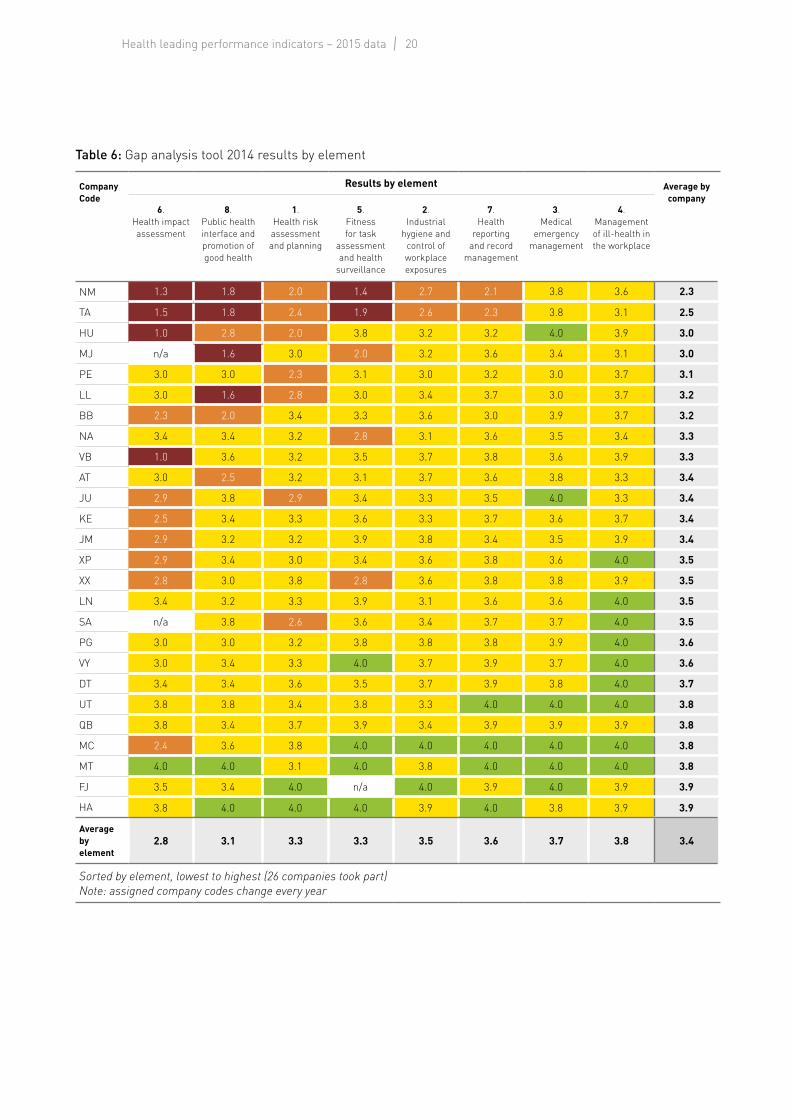
The results can also be viewed by element (Tables 5 and 6) to highlight the health elements in which the participating companies appear to be performing well and those where additional guidance and support would be useful.
19Gap analysis tool results
Table 5: Gap analysis tool 2015 results by element
Company Code
Results by element Average by company
6. Health impact assessment
1. Health risk assessment and planning
8. Public health interface and promotion of good health
2. Industrial
hygiene and control of workplace exposures
5. Fitness for task
assessment and health
surveillance
7. Health
reporting and record
management
3. Medical
emergency management
4. Management of ill-health in the workplace
YU 1.1 2.1 2.2 1.9 2.9 2.9 2.5 2.9 2.4
SG 1.0 2.2 2.0 2.2 2.3 2.6 3.4 4.0 2.5
OS 1.9 2.3 2.8 2.8 2.3 2.8 2.5 3.0 2.5
RO 2.0 2.9 2.2 3.4 2.0 3.3 4.0 3.4 3.1
IB 3.0 2.6 3.2 3.1 2.6 3.4 3.5 3.7 3.2
LE 3.0 3.2 3.2 3.0 2.8 3.4 3.5 3.4 3.2
UU 2.3 3.4 2.0 3.7 3.3 3.1 3.9 3.7 3.2
EE 3.5 3.3 3.0 3.1 2.9 3.3 3.7 3.4 3.3
FI 2.5 3.0 3.4 3.4 4.0 2.9 4.0 3.9 3.3
QT 1.9 2.6 3.2 3.3 3.9 3.8 4.0 3.9 3.3
JM 2.9 3.4 2.6 3.6 3.4 3.6 3.8 3.6 3.4
BH 3.1 2.9 3.6 2.3 3.9 3.9 3.6 4.0 3.4
YV 2.9 2.9 4.0 3.2 3.5 3.6 4.0 3.3 3.4
XB 2.3 3.4 3.6 3.7 3.5 3.8 3.6 3.9 3.5
AR 2.8 3.7 3.0 3.7 2.8 3.8 3.8 3.9 3.5
BX 3.0 3.5 3.2 3.8 3.9 3.4 3.6 3.9 3.5
TB 3.0 3.0 3.0 3.4 3.9 3.8 4.0 4.0 3.5
TF 3.6 3.3 3.6 3.3 3.6 3.5 4.0 3.9 3.6
KA n/a 2.4 3.6 3.8 3.6 3.8 3.7 4.0 3.6
NX 2.9 3.5 3.2 3.8 3.6 3.8 4.0 4.0 3.6
PV 3.0 3.6 3.6 3.8 3.9 3.7 3.8 3.9 3.7
VL 3.6 3.6 3.8 3.7 3.3 3.9 4.0 3.7 3.7
NU 3.5 3.7 4.0 3.7 3.8 3.8 3.6 4.0 3.7
FQ 3.4 3.3 4.0 3.9 3.8 3.9 3.8 4.0 3.7
OY 3.1 3.6 3.2 3.8 3.9 3.9 4.0 4.0 3.8
CP 3.8 3.7 3.4 3.4 3.9 3.9 3.9 3.9 3.8
RD 3.6 3.1 4.0 3.8 4.0 4.0 4.0 4.0 3.8
DG 3.8 3.7 4.0 3.9 4.0 3.9 3.7 4.0 3.8
VE 2.9 3.8 4.0 4.0 4.0 4.0 4.0 4.0 3.9
Average by element
2.7 3.2 3.2 3.4 3.4 3.5 3.7 3.8 3.4
Sorted by element, lowest to highest (29 companies took part)Note: assigned company codes change every year
20Health leading performance indicators – 2015 data
Table 6: Gap analysis tool 2014 results by element
Company Code
Results by element Average by company
6. Health impact assessment
8. Public health interface and promotion of good health
1. Health risk assessment and planning
5. Fitness for task
assessment and health
surveillance
2. Industrial
hygiene and control of workplace exposures
7. Health
reporting and record
management
3. Medical
emergency management
4. Management of ill-health in the workplace
NM 1.3 1.8 2.0 1.4 2.7 2.1 3.8 3.6 2.3
TA 1.5 1.8 2.4 1.9 2.6 2.3 3.8 3.1 2.5
HU 1.0 2.8 2.0 3.8 3.2 3.2 4.0 3.9 3.0
MJ n/a 1.6 3.0 2.0 3.2 3.6 3.4 3.1 3.0
PE 3.0 3.0 2.3 3.1 3.0 3.2 3.0 3.7 3.1
LL 3.0 1.6 2.8 3.0 3.4 3.7 3.0 3.7 3.2
BB 2.3 2.0 3.4 3.3 3.6 3.0 3.9 3.7 3.2
NA 3.4 3.4 3.2 2.8 3.1 3.6 3.5 3.4 3.3
VB 1.0 3.6 3.2 3.5 3.7 3.8 3.6 3.9 3.3
AT 3.0 2.5 3.2 3.1 3.7 3.6 3.8 3.3 3.4
JU 2.9 3.8 2.9 3.4 3.3 3.5 4.0 3.3 3.4
KE 2.5 3.4 3.3 3.6 3.3 3.7 3.6 3.7 3.4
JM 2.9 3.2 3.2 3.9 3.8 3.4 3.5 3.9 3.4
XP 2.9 3.4 3.0 3.4 3.6 3.8 3.6 4.0 3.5
XX 2.8 3.0 3.8 2.8 3.6 3.8 3.8 3.9 3.5
LN 3.4 3.2 3.3 3.9 3.1 3.6 3.6 4.0 3.5
SA n/a 3.8 2.6 3.6 3.4 3.7 3.7 4.0 3.5
PG 3.0 3.0 3.2 3.8 3.8 3.8 3.9 4.0 3.6
VY 3.0 3.4 3.3 4.0 3.7 3.9 3.7 4.0 3.6
DT 3.4 3.4 3.6 3.5 3.7 3.9 3.8 4.0 3.7
UT 3.8 3.8 3.4 3.8 3.3 4.0 4.0 4.0 3.8
QB 3.8 3.4 3.7 3.9 3.4 3.9 3.9 3.9 3.8
MC 2.4 3.6 3.8 4.0 4.0 4.0 4.0 4.0 3.8
MT 4.0 4.0 3.1 4.0 3.8 4.0 4.0 4.0 3.8
FJ 3.5 3.4 4.0 n/a 4.0 3.9 4.0 3.9 3.9
HA 3.8 4.0 4.0 4.0 3.9 4.0 3.8 3.9 3.9
Average by element
2.8 3.1 3.3 3.3 3.5 3.6 3.7 3.8 3.4
Sorted by element, lowest to highest (26 companies took part)Note: assigned company codes change every year
21Gap analysis tool results
Gap analysis tool – each element in detail
A deeper analysis of the data for each element was undertaken.
The results are shown, in descending order of the average score per statement, for the data submitted by participating companies in 2014 and 2015 (Tables 7–22).
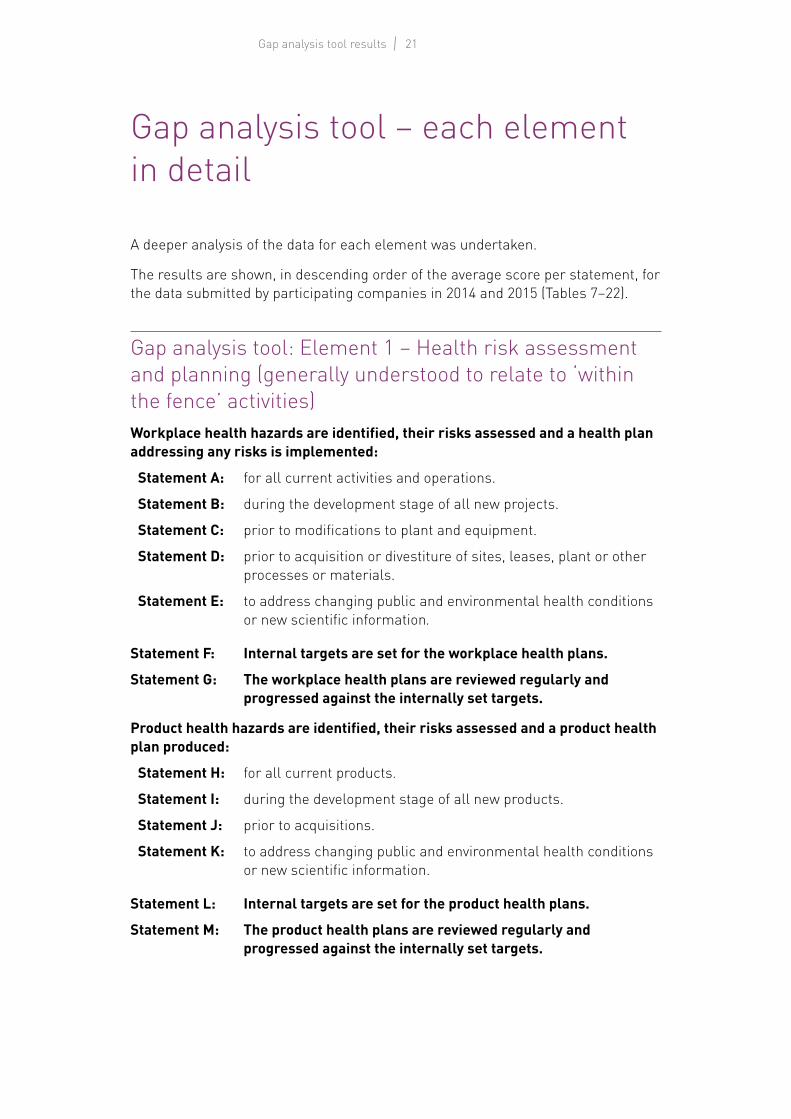
Gap analysis tool: Element 1 – Health risk assessment and planning (generally understood to relate to ‘within the fence’ activities)Workplace health hazards are identified, their risks assessed and a health plan addressing any risks is implemented:
Statement A: for all current activities and operations.
Statement B: during the development stage of all new projects.
Statement C: prior to modifications to plant and equipment.
Statement D: prior to acquisition or divestiture of sites, leases, plant or other processes or materials.
Statement E: to address changing public and environmental health conditions or new scientific information.
Statement F: Internal targets are set for the workplace health plans.
Statement G: The workplace health plans are reviewed regularly and progressed against the internally set targets.
Product health hazards are identified, their risks assessed and a product health plan produced:
Statement H: for all current products.
Statement I: during the development stage of all new products.
Statement J: prior to acquisitions.
Statement K: to address changing public and environmental health conditions or new scientific information.
Statement L: Internal targets are set for the product health plans.
Statement M: The product health plans are reviewed regularly and progressed against the internally set targets.
22Health leading performance indicators – 2015 data
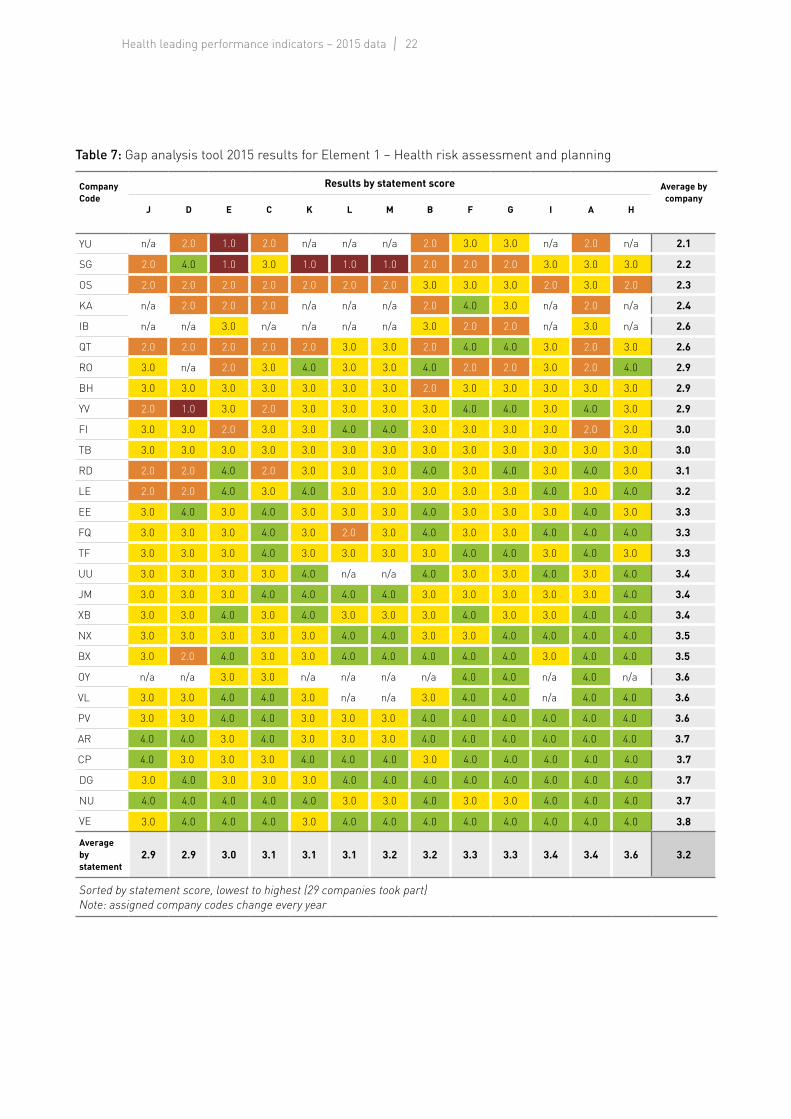
Table 7: Gap analysis tool 2015 results for Element 1 – Health risk assessment and planning
Company Code
Results by statement score Average by company
J D E C K L M B F G I A H
YU n/a 2.0 1.0 2.0 n/a n/a n/a 2.0 3.0 3.0 n/a 2.0 n/a 2.1
SG 2.0 4.0 1.0 3.0 1.0 1.0 1.0 2.0 2.0 2.0 3.0 3.0 3.0 2.2
OS 2.0 2.0 2.0 2.0 2.0 2.0 2.0 3.0 3.0 3.0 2.0 3.0 2.0 2.3
KA n/a 2.0 2.0 2.0 n/a n/a n/a 2.0 4.0 3.0 n/a 2.0 n/a 2.4
IB n/a n/a 3.0 n/a n/a n/a n/a 3.0 2.0 2.0 n/a 3.0 n/a 2.6
QT 2.0 2.0 2.0 2.0 2.0 3.0 3.0 2.0 4.0 4.0 3.0 2.0 3.0 2.6
RO 3.0 n/a 2.0 3.0 4.0 3.0 3.0 4.0 2.0 2.0 3.0 2.0 4.0 2.9
BH 3.0 3.0 3.0 3.0 3.0 3.0 3.0 2.0 3.0 3.0 3.0 3.0 3.0 2.9
YV 2.0 1.0 3.0 2.0 3.0 3.0 3.0 3.0 4.0 4.0 3.0 4.0 3.0 2.9
FI 3.0 3.0 2.0 3.0 3.0 4.0 4.0 3.0 3.0 3.0 3.0 2.0 3.0 3.0
TB 3.0 3.0 3.0 3.0 3.0 3.0 3.0 3.0 3.0 3.0 3.0 3.0 3.0 3.0
RD 2.0 2.0 4.0 2.0 3.0 3.0 3.0 4.0 3.0 4.0 3.0 4.0 3.0 3.1
LE 2.0 2.0 4.0 3.0 4.0 3.0 3.0 3.0 3.0 3.0 4.0 3.0 4.0 3.2
EE 3.0 4.0 3.0 4.0 3.0 3.0 3.0 4.0 3.0 3.0 3.0 4.0 3.0 3.3
FQ 3.0 3.0 3.0 4.0 3.0 2.0 3.0 4.0 3.0 3.0 4.0 4.0 4.0 3.3
TF 3.0 3.0 3.0 4.0 3.0 3.0 3.0 3.0 4.0 4.0 3.0 4.0 3.0 3.3
UU 3.0 3.0 3.0 3.0 4.0 n/a n/a 4.0 3.0 3.0 4.0 3.0 4.0 3.4
JM 3.0 3.0 3.0 4.0 4.0 4.0 4.0 3.0 3.0 3.0 3.0 3.0 4.0 3.4
XB 3.0 3.0 4.0 3.0 4.0 3.0 3.0 3.0 4.0 3.0 3.0 4.0 4.0 3.4
NX 3.0 3.0 3.0 3.0 3.0 4.0 4.0 3.0 3.0 4.0 4.0 4.0 4.0 3.5
BX 3.0 2.0 4.0 3.0 3.0 4.0 4.0 4.0 4.0 4.0 3.0 4.0 4.0 3.5
OY n/a n/a 3.0 3.0 n/a n/a n/a n/a 4.0 4.0 n/a 4.0 n/a 3.6
VL 3.0 3.0 4.0 4.0 3.0 n/a n/a 3.0 4.0 4.0 n/a 4.0 4.0 3.6
PV 3.0 3.0 4.0 4.0 3.0 3.0 3.0 4.0 4.0 4.0 4.0 4.0 4.0 3.6
AR 4.0 4.0 3.0 4.0 3.0 3.0 3.0 4.0 4.0 4.0 4.0 4.0 4.0 3.7
CP 4.0 3.0 3.0 3.0 4.0 4.0 4.0 3.0 4.0 4.0 4.0 4.0 4.0 3.7
DG 3.0 4.0 3.0 3.0 3.0 4.0 4.0 4.0 4.0 4.0 4.0 4.0 4.0 3.7
NU 4.0 4.0 4.0 4.0 4.0 3.0 3.0 4.0 3.0 3.0 4.0 4.0 4.0 3.7
VE 3.0 4.0 4.0 4.0 3.0 4.0 4.0 4.0 4.0 4.0 4.0 4.0 4.0 3.8
Average by statement
2.9 2.9 3.0 3.1 3.1 3.1 3.2 3.2 3.3 3.3 3.4 3.4 3.6 3.2
Sorted by statement score, lowest to highest (29 companies took part)Note: assigned company codes change every year

23Gap analysis tool results
Element 1 requires ‘Workplace health hazards are identified, their risks assessed and a health plan addressing any risks is implemented’ in relation to Statements A to E, as listed. In 2015, compared with 2014, lower scores are shown for Statement A, ‘for all current activities and operations’, and Statement E, ‘to address changing public and environmental health conditions or new scientific information’.
Improvements are shown for Statement F, ‘Internal targets are set for the product health plans’, and for Statement H, ‘Product health hazards are identified, their risks assessed and a product health plan produced for all current products’.
Table 8: Gap analysis tool 2014 results for Element 1 – Health risk assessment and planning
Company Code
Results by statement score Average by company
D J C L M B F E K G I H A
HU 1.0 2.0 2.0 2.0 2.0 1.0 3.0 2.0 2.0 3.0 2.0 2.0 2.0 2.0
NM 3.0 2.0 3.0 1.0 1.0 3.0 1.0 2.0 2.0 1.0 2.0 2.0 3.0 2.0
PE 1.0 n/a n/a n/a n/a 3.0 2.0 3.0 n/a 3.0 n/a n/a 2.0 2.3
TA 2.0 n/a 3.0 n/a n/a 3.0 2.0 2.0 n/a 2.0 n/a n/a 3.0 2.4
SA 2.0 1.0 2.0 n/a n/a 2.0 4.0 2.0 4.0 2.0 4.0 4.0 2.0 2.6
LL 3.0 n/a 2.0 2.0 2.0 2.0 4.0 n/a n/a 3.0 n/a 3.0 4.0 2.8
JU 1.0 2.0 2.0 3.0 3.0 3.0 4.0 3.0 3.0 4.0 3.0 3.0 4.0 2.9
MJ 2.0 4.0 3.0 3.0 3.0 2.0 2.0 2.0 4.0 n/a 4.0 4.0 3.0 3.0
XP 2.0 2.0 3.0 3.0 3.0 3.0 3.0 3.0 3.0 3.0 3.0 4.0 4.0 3.0
MT 2.0 2.0 2.0 3.0 3.0 4.0 3.0 4.0 3.0 4.0 3.0 3.0 4.0 3.1
AT 3.0 3.0 3.0 3.0 3.0 3.0 3.0 4.0 3.0 4.0 3.0 3.0 3.0 3.2
JM 2.0 3.0 2.0 4.0 3.0 3.0 4.0 3.0 3.0 4.0 3.0 3.0 4.0 3.2
NA 2.0 2.0 3.0 3.0 3.0 3.0 3.0 4.0 4.0 3.0 4.0 4.0 3.0 3.2
PG 2.0 n/a 3.0 n/a n/a n/a 4.0 3.0 n/a 4.0 n/a n/a 3.0 3.2
VB 3.0 3.0 3.0 2.0 2.0 3.0 4.0 4.0 4.0 3.0 3.0 4.0 4.0 3.2
KE 3.0 3.0 3.0 3.0 4.0 3.0 3.0 4.0 3.0 4.0 3.0 3.0 4.0 3.3
LN 3.0 4.0 3.0 3.0 3.0 3.0 3.0 3.0 4.0 3.0 4.0 4.0 3.0 3.3
VY 4.0 3.0 3.0 3.0 3.0 4.0 3.0 4.0 3.0 n/a 3.0 3.0 4.0 3.3
BB 3.0 3.0 3.0 n/a n/a 4.0 3.0 3.0 4.0 3.0 4.0 4.0 3.0 3.4
UT 4.0 3.0 4.0 3.0 3.0 4.0 2.0 4.0 3.0 4.0 3.0 3.0 4.0 3.4
DT 3.0 n/a 3.0 n/a n/a 3.0 4.0 4.0 n/a 4.0 n/a n/a 4.0 3.6
QB 3.0 4.0 3.0 4.0 4.0 3.0 4.0 3.0 4.0 4.0 4.0 4.0 4.0 3.7
MC 4.0 3.0 4.0 4.0 4.0 4.0 4.0 4.0 3.0 4.0 4.0 4.0 4.0 3.8
XX 4.0 4.0 4.0 4.0 4.0 4.0 4.0 3.0 3.0 4.0 4.0 4.0 4.0 3.8
FJ 4.0 4.0 4.0 4.0 4.0 4.0 4.0 4.0 4.0 4.0 4.0 4.0 4.0 4.0
HA 4.0 4.0 4.0 4.0 4.0 4.0 4.0 4.0 4.0 4.0 4.0 4.0 4.0 4.0
Average by statement
2.7 2.9 3.0 3.1 3.1 3.1 3.2 3.2 3.3 3.4 3.4 3.5 3.5 3.3
Sorted by statement score, lowest to highest (26 companies took part)Note: assigned company codes change every year
24Health leading performance indicators – 2015 data
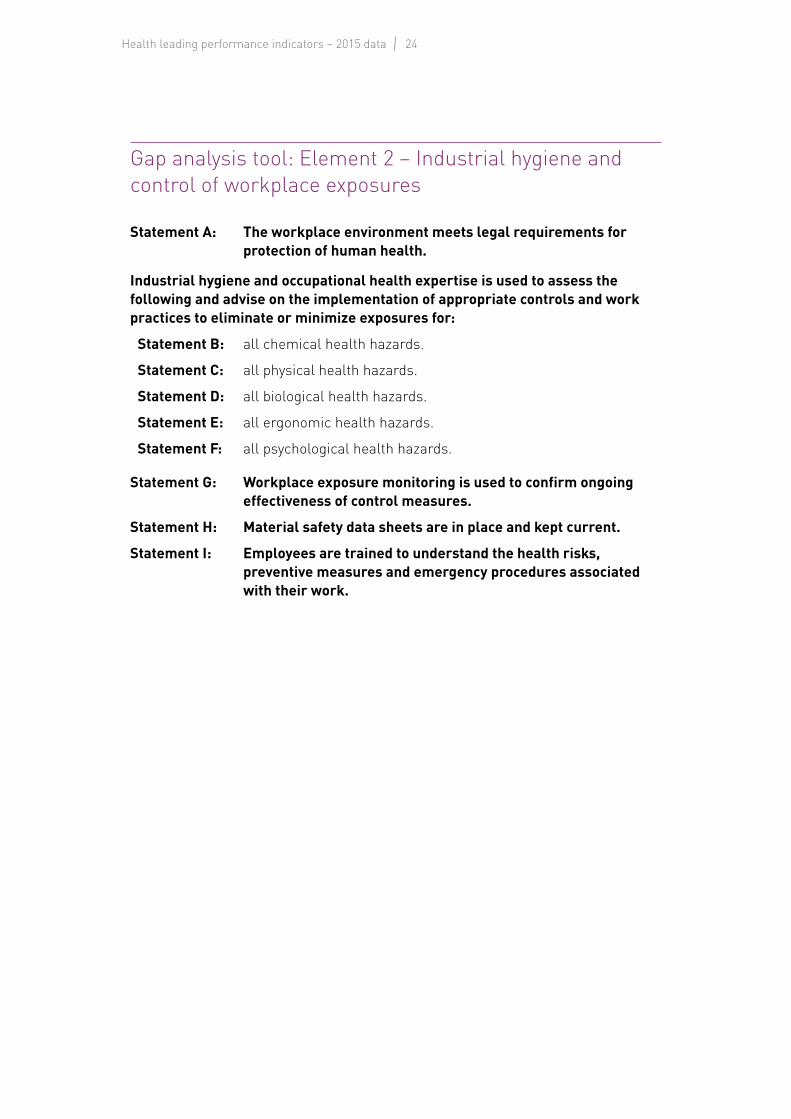
Gap analysis tool: Element 2 – Industrial hygiene and control of workplace exposures
Statement A: The workplace environment meets legal requirements for protection of human health.
Industrial hygiene and occupational health expertise is used to assess the following and advise on the implementation of appropriate controls and work practices to eliminate or minimize exposures for:
Statement B: all chemical health hazards.
Statement C: all physical health hazards.
Statement D: all biological health hazards.
Statement E: all ergonomic health hazards.
Statement F: all psychological health hazards.
Statement G: Workplace exposure monitoring is used to confirm ongoing effectiveness of control measures.
Statement H: Material safety data sheets are in place and kept current.
Statement I: Employees are trained to understand the health risks, preventive measures and emergency procedures associated with their work.
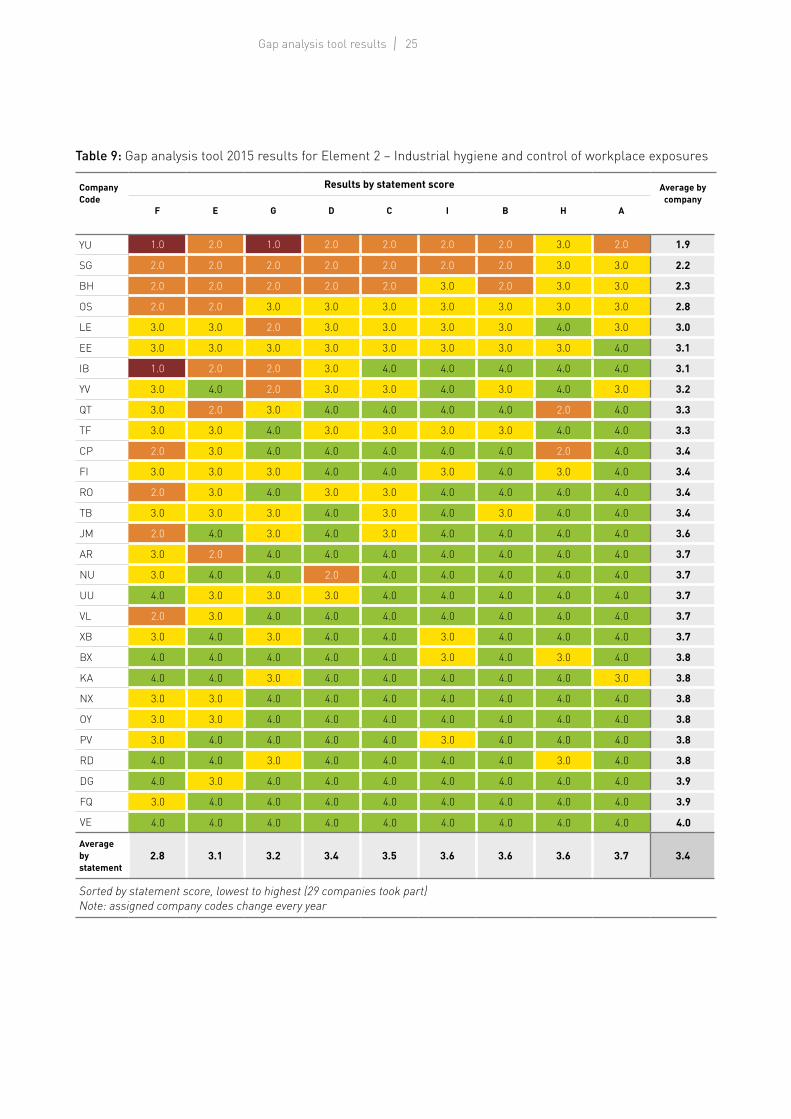
25Gap analysis tool results
Table 9: Gap analysis tool 2015 results for Element 2 – Industrial hygiene and control of workplace exposures
Company Code
Results by statement score Average by company
F E G D C I B H A
YU 1.0 2.0 1.0 2.0 2.0 2.0 2.0 3.0 2.0 1.9
SG 2.0 2.0 2.0 2.0 2.0 2.0 2.0 3.0 3.0 2.2
BH 2.0 2.0 2.0 2.0 2.0 3.0 2.0 3.0 3.0 2.3
OS 2.0 2.0 3.0 3.0 3.0 3.0 3.0 3.0 3.0 2.8
LE 3.0 3.0 2.0 3.0 3.0 3.0 3.0 4.0 3.0 3.0
EE 3.0 3.0 3.0 3.0 3.0 3.0 3.0 3.0 4.0 3.1
IB 1.0 2.0 2.0 3.0 4.0 4.0 4.0 4.0 4.0 3.1
YV 3.0 4.0 2.0 3.0 3.0 4.0 3.0 4.0 3.0 3.2
QT 3.0 2.0 3.0 4.0 4.0 4.0 4.0 2.0 4.0 3.3
TF 3.0 3.0 4.0 3.0 3.0 3.0 3.0 4.0 4.0 3.3
CP 2.0 3.0 4.0 4.0 4.0 4.0 4.0 2.0 4.0 3.4
FI 3.0 3.0 3.0 4.0 4.0 3.0 4.0 3.0 4.0 3.4
RO 2.0 3.0 4.0 3.0 3.0 4.0 4.0 4.0 4.0 3.4
TB 3.0 3.0 3.0 4.0 3.0 4.0 3.0 4.0 4.0 3.4
JM 2.0 4.0 3.0 4.0 3.0 4.0 4.0 4.0 4.0 3.6
AR 3.0 2.0 4.0 4.0 4.0 4.0 4.0 4.0 4.0 3.7
NU 3.0 4.0 4.0 2.0 4.0 4.0 4.0 4.0 4.0 3.7
UU 4.0 3.0 3.0 3.0 4.0 4.0 4.0 4.0 4.0 3.7
VL 2.0 3.0 4.0 4.0 4.0 4.0 4.0 4.0 4.0 3.7
XB 3.0 4.0 3.0 4.0 4.0 3.0 4.0 4.0 4.0 3.7
BX 4.0 4.0 4.0 4.0 4.0 3.0 4.0 3.0 4.0 3.8
KA 4.0 4.0 3.0 4.0 4.0 4.0 4.0 4.0 3.0 3.8
NX 3.0 3.0 4.0 4.0 4.0 4.0 4.0 4.0 4.0 3.8
OY 3.0 3.0 4.0 4.0 4.0 4.0 4.0 4.0 4.0 3.8
PV 3.0 4.0 4.0 4.0 4.0 3.0 4.0 4.0 4.0 3.8
RD 4.0 4.0 3.0 4.0 4.0 4.0 4.0 3.0 4.0 3.8
DG 4.0 3.0 4.0 4.0 4.0 4.0 4.0 4.0 4.0 3.9
FQ 3.0 4.0 4.0 4.0 4.0 4.0 4.0 4.0 4.0 3.9
VE 4.0 4.0 4.0 4.0 4.0 4.0 4.0 4.0 4.0 4.0
Average by statement
2.8 3.1 3.2 3.4 3.5 3.6 3.6 3.6 3.7 3.4
Sorted by statement score, lowest to highest (29 companies took part)Note: assigned company codes change every year
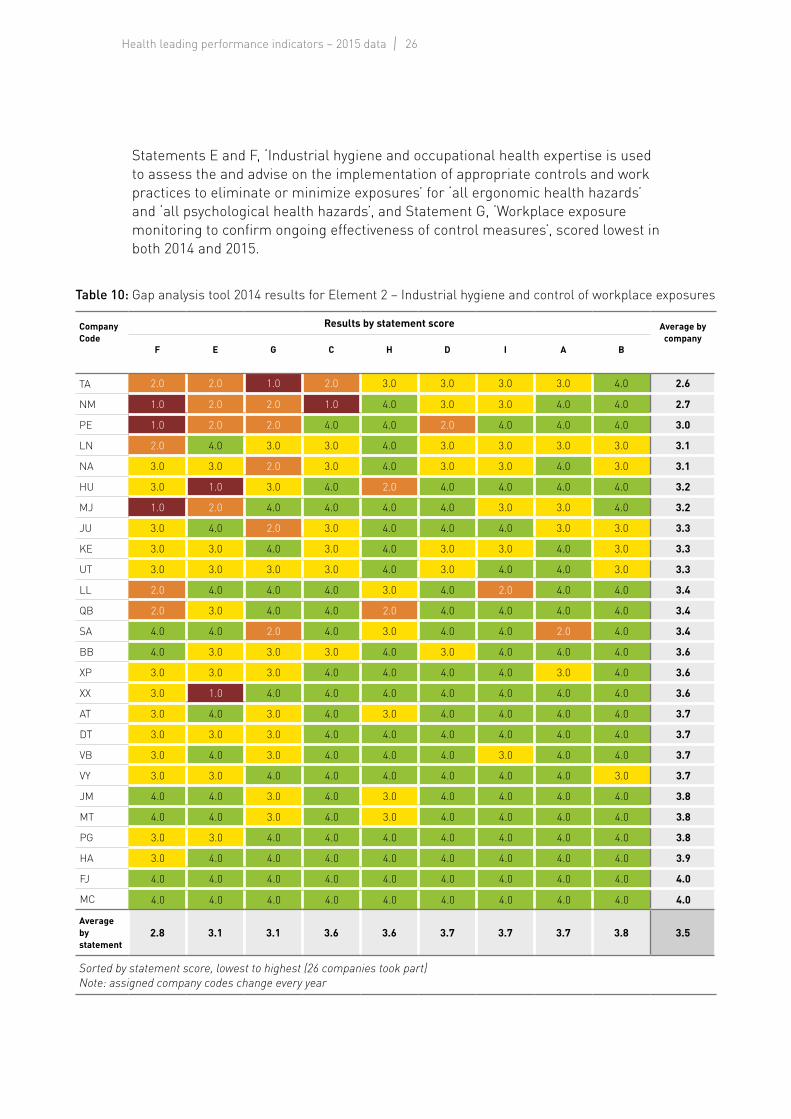
26Health leading performance indicators – 2015 data
Statements E and F, ‘Industrial hygiene and occupational health expertise is used to assess the and advise on the implementation of appropriate controls and work practices to eliminate or minimize exposures’ for ‘all ergonomic health hazards’ and ‘all psychological health hazards’, and Statement G, ‘Workplace exposure monitoring to confirm ongoing effectiveness of control measures’, scored lowest in both 2014 and 2015.
Table 10: Gap analysis tool 2014 results for Element 2 – Industrial hygiene and control of workplace exposures
Company Code
Results by statement score Average by company
F E G C H D I A B
TA 2.0 2.0 1.0 2.0 3.0 3.0 3.0 3.0 4.0 2.6
NM 1.0 2.0 2.0 1.0 4.0 3.0 3.0 4.0 4.0 2.7
PE 1.0 2.0 2.0 4.0 4.0 2.0 4.0 4.0 4.0 3.0
LN 2.0 4.0 3.0 3.0 4.0 3.0 3.0 3.0 3.0 3.1
NA 3.0 3.0 2.0 3.0 4.0 3.0 3.0 4.0 3.0 3.1
HU 3.0 1.0 3.0 4.0 2.0 4.0 4.0 4.0 4.0 3.2
MJ 1.0 2.0 4.0 4.0 4.0 4.0 3.0 3.0 4.0 3.2
JU 3.0 4.0 2.0 3.0 4.0 4.0 4.0 3.0 3.0 3.3
KE 3.0 3.0 4.0 3.0 4.0 3.0 3.0 4.0 3.0 3.3
UT 3.0 3.0 3.0 3.0 4.0 3.0 4.0 4.0 3.0 3.3
LL 2.0 4.0 4.0 4.0 3.0 4.0 2.0 4.0 4.0 3.4
QB 2.0 3.0 4.0 4.0 2.0 4.0 4.0 4.0 4.0 3.4
SA 4.0 4.0 2.0 4.0 3.0 4.0 4.0 2.0 4.0 3.4
BB 4.0 3.0 3.0 3.0 4.0 3.0 4.0 4.0 4.0 3.6
XP 3.0 3.0 3.0 4.0 4.0 4.0 4.0 3.0 4.0 3.6
XX 3.0 1.0 4.0 4.0 4.0 4.0 4.0 4.0 4.0 3.6
AT 3.0 4.0 3.0 4.0 3.0 4.0 4.0 4.0 4.0 3.7
DT 3.0 3.0 3.0 4.0 4.0 4.0 4.0 4.0 4.0 3.7
VB 3.0 4.0 3.0 4.0 4.0 4.0 3.0 4.0 4.0 3.7
VY 3.0 3.0 4.0 4.0 4.0 4.0 4.0 4.0 3.0 3.7
JM 4.0 4.0 3.0 4.0 3.0 4.0 4.0 4.0 4.0 3.8
MT 4.0 4.0 3.0 4.0 3.0 4.0 4.0 4.0 4.0 3.8
PG 3.0 3.0 4.0 4.0 4.0 4.0 4.0 4.0 4.0 3.8
HA 3.0 4.0 4.0 4.0 4.0 4.0 4.0 4.0 4.0 3.9
FJ 4.0 4.0 4.0 4.0 4.0 4.0 4.0 4.0 4.0 4.0
MC 4.0 4.0 4.0 4.0 4.0 4.0 4.0 4.0 4.0 4.0
Average by statement
2.8 3.1 3.1 3.6 3.6 3.7 3.7 3.7 3.8 3.5
Sorted by statement score, lowest to highest (26 companies took part)Note: assigned company codes change every year

27Gap analysis tool results
Gap analysis tool: Element 3 – Medical emergency management
Statement A: Provision is made for the management of medical emergencies associated with company operations and activities.
Statement B: There is a medical emergency plan based on competent medical advice and level of risk, and it is in alignment with existing local provisions.
Statement C: The medical emergency plan is integrated into other emergency procedures.
Statement D: The medical emergency plan is communicated effectively.
Statement E: The medical emergency plan is practiced regularly with drills and reviews as appropriate.
Statement F: A process is in place to ensure that lessons learned are acted upon as a result of drills or incidents.
Statement G: Appropriate response times are established for first aid, emergency medical care and evacuation.
Statement H: Adequate resources have been made available to meet established response times for first aid, emergency medical care and evacuation.
Statement I: All staff are provided with emergency contact numbers for medical assistance on each work site.
Statement J: All staff are provided with emergency contact numbers for medical assistance during travel.
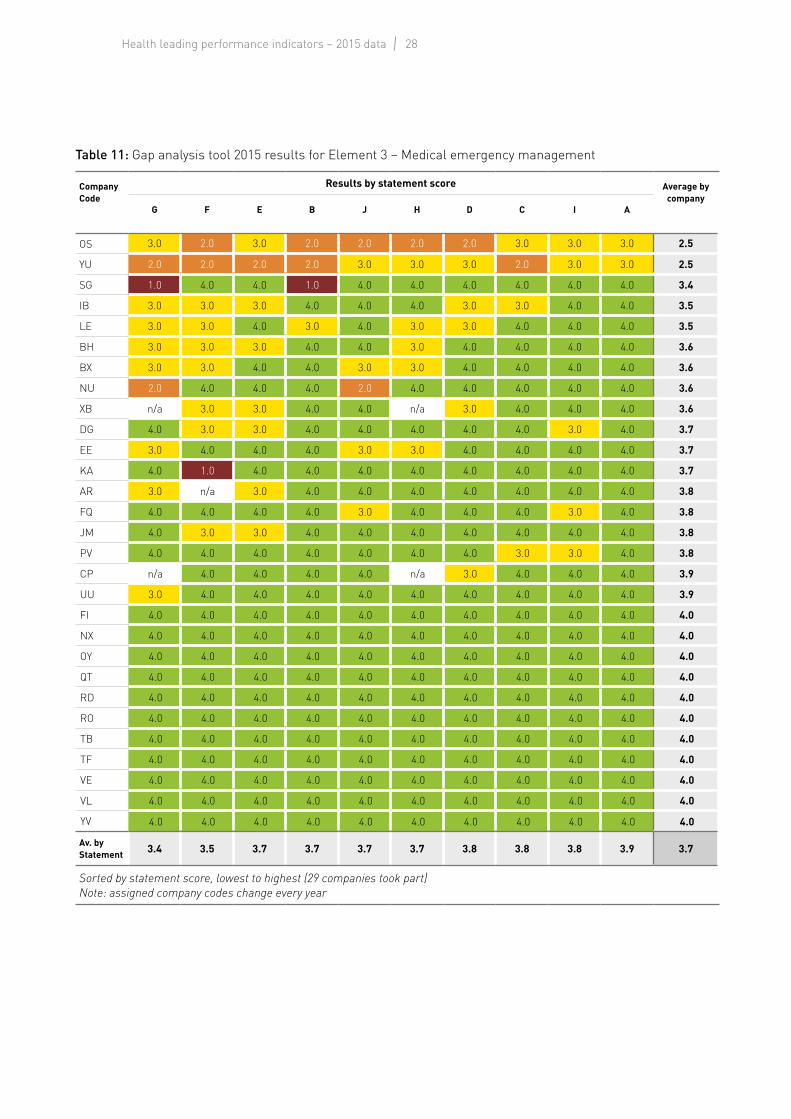
28Health leading performance indicators – 2015 data
Table 11: Gap analysis tool 2015 results for Element 3 – Medical emergency management
Company Code
Results by statement score Average by company
G F E B J H D C I A
OS 3.0 2.0 3.0 2.0 2.0 2.0 2.0 3.0 3.0 3.0 2.5
YU 2.0 2.0 2.0 2.0 3.0 3.0 3.0 2.0 3.0 3.0 2.5
SG 1.0 4.0 4.0 1.0 4.0 4.0 4.0 4.0 4.0 4.0 3.4
IB 3.0 3.0 3.0 4.0 4.0 4.0 3.0 3.0 4.0 4.0 3.5
LE 3.0 3.0 4.0 3.0 4.0 3.0 3.0 4.0 4.0 4.0 3.5
BH 3.0 3.0 3.0 4.0 4.0 3.0 4.0 4.0 4.0 4.0 3.6
BX 3.0 3.0 4.0 4.0 3.0 3.0 4.0 4.0 4.0 4.0 3.6
NU 2.0 4.0 4.0 4.0 2.0 4.0 4.0 4.0 4.0 4.0 3.6
XB n/a 3.0 3.0 4.0 4.0 n/a 3.0 4.0 4.0 4.0 3.6
DG 4.0 3.0 3.0 4.0 4.0 4.0 4.0 4.0 3.0 4.0 3.7
EE 3.0 4.0 4.0 4.0 3.0 3.0 4.0 4.0 4.0 4.0 3.7
KA 4.0 1.0 4.0 4.0 4.0 4.0 4.0 4.0 4.0 4.0 3.7
AR 3.0 n/a 3.0 4.0 4.0 4.0 4.0 4.0 4.0 4.0 3.8
FQ 4.0 4.0 4.0 4.0 3.0 4.0 4.0 4.0 3.0 4.0 3.8
JM 4.0 3.0 3.0 4.0 4.0 4.0 4.0 4.0 4.0 4.0 3.8
PV 4.0 4.0 4.0 4.0 4.0 4.0 4.0 3.0 3.0 4.0 3.8
CP n/a 4.0 4.0 4.0 4.0 n/a 3.0 4.0 4.0 4.0 3.9
UU 3.0 4.0 4.0 4.0 4.0 4.0 4.0 4.0 4.0 4.0 3.9
FI 4.0 4.0 4.0 4.0 4.0 4.0 4.0 4.0 4.0 4.0 4.0
NX 4.0 4.0 4.0 4.0 4.0 4.0 4.0 4.0 4.0 4.0 4.0
OY 4.0 4.0 4.0 4.0 4.0 4.0 4.0 4.0 4.0 4.0 4.0
QT 4.0 4.0 4.0 4.0 4.0 4.0 4.0 4.0 4.0 4.0 4.0
RD 4.0 4.0 4.0 4.0 4.0 4.0 4.0 4.0 4.0 4.0 4.0
RO 4.0 4.0 4.0 4.0 4.0 4.0 4.0 4.0 4.0 4.0 4.0
TB 4.0 4.0 4.0 4.0 4.0 4.0 4.0 4.0 4.0 4.0 4.0
TF 4.0 4.0 4.0 4.0 4.0 4.0 4.0 4.0 4.0 4.0 4.0
VE 4.0 4.0 4.0 4.0 4.0 4.0 4.0 4.0 4.0 4.0 4.0
VL 4.0 4.0 4.0 4.0 4.0 4.0 4.0 4.0 4.0 4.0 4.0
YV 4.0 4.0 4.0 4.0 4.0 4.0 4.0 4.0 4.0 4.0 4.0
Av. by Statement 3.4 3.5 3.7 3.7 3.7 3.7 3.8 3.8 3.8 3.9 3.7
Sorted by statement score, lowest to highest (29 companies took part)Note: assigned company codes change every year

29Gap analysis tool results
Many companies had high scores in this element and could offer advice via the IOGP-IPIECA Health Committee to those companies with less mature systems.
Putting a ‘process in place to ensure that lessons learned are acted upon as a result of drills or incidents’ (Statement F) and establishing ‘appropriate response times for first aid, emergency medical care and evacuation’ (Statement G) would help the majority of lower scoring companies.
Statement A, ‘provision is made for the management of medical emergencies associated with company operations and activities’, scored highest in both 2014 and 2015.
Table 12: Gap analysis tool 2014 results for Element 3 – Medical emergency management
Company Code
Results by statement score Average by company
F G E J H D I B C A
LL 1.0 3.0 3.0 2.0 3.0 4.0 2.0 4.0 4.0 4.0 3.0
PE 2.0 3.0 2.0 4.0 3.0 3.0 4.0 3.0 3.0 3.0 3.0
MJ 3.0 3.0 3.0 4.0 3.0 3.0 4.0 4.0 3.0 4.0 3.4
JM 3.0 3.0 4.0 3.0 3.0 4.0 3.0 4.0 4.0 4.0 3.5
NA 3.0 3.0 4.0 4.0 3.0 3.0 4.0 3.0 4.0 4.0 3.5
KE 3.0 3.0 4.0 4.0 4.0 3.0 3.0 4.0 4.0 4.0 3.6
LN 3.0 3.0 3.0 4.0 4.0 4.0 4.0 4.0 3.0 4.0 3.6
XP 3.0 3.0 4.0 3.0 3.0 4.0 4.0 4.0 4.0 4.0 3.6
VB 3.0 n/a 3.0 4.0 n/a 3.0 4.0 4.0 4.0 4.0 3.6
SA 2.0 4.0 4.0 4.0 4.0 4.0 3.0 4.0 4.0 4.0 3.7
VY 3.0 3.0 4.0 4.0 4.0 4.0 4.0 3.0 4.0 4.0 3.7
XX n/a 3.0 3.0 4.0 4.0 4.0 4.0 4.0 4.0 4.0 3.8
AT 4.0 4.0 4.0 3.0 4.0 4.0 3.0 4.0 4.0 4.0 3.8
DT 4.0 4.0 4.0 3.0 4.0 4.0 4.0 4.0 4.0 3.0 3.8
HA 3.0 4.0 3.0 4.0 4.0 4.0 4.0 4.0 4.0 4.0 3.8
NM 3.0 4.0 4.0 3.0 4.0 4.0 4.0 4.0 4.0 4.0 3.8
TA 4.0 3.0 4.0 3.0 4.0 4.0 4.0 4.0 4.0 4.0 3.8
QB 4.0 n/a 4.0 4.0 n/a 3.0 4.0 4.0 4.0 4.0 3.9
BB 3.0 4.0 4.0 4.0 4.0 4.0 4.0 4.0 4.0 4.0 3.9
PG 4.0 3.0 4.0 4.0 4.0 4.0 4.0 4.0 4.0 4.0 3.9
FJ 4.0 4.0 4.0 4.0 4.0 4.0 4.0 4.0 4.0 4.0 4.0
HU 4.0 4.0 4.0 4.0 4.0 4.0 4.0 4.0 4.0 4.0 4.0
JU 4.0 4.0 4.0 4.0 4.0 4.0 4.0 4.0 4.0 4.0 4.0
MC 4.0 4.0 4.0 4.0 4.0 4.0 4.0 4.0 4.0 4.0 4.0
MT 4.0 4.0 4.0 4.0 4.0 4.0 4.0 4.0 4.0 4.0 4.0
UT 4.0 4.0 4.0 4.0 4.0 4.0 4.0 4.0 4.0 4.0 4.0
Average by statement
3.3 3.5 3.7 3.7 3.8 3.8 3.8 3.9 3.9 3.9 3.7
Sorted by statement score, lowest to highest (26 companies took part)Note: assigned company codes change every year

30Health leading performance indicators – 2015 data
Gap analysis tool: Element 4 – Management of ill-health in the workplace
Employees have access to occupational health practitioners who can:
Statement A: help mitigate the effects of ill-health on their ability to work effectively.
Statement B: facilitate employee rehabilitation.
Statement C: facilitate return to work post-illness or post-injury.
A system is in place to provide access for employees to:
Statement D: primary medical care facilities.
Statement E: secondary medical care facilities.
Statement F: emergency medical care facilities.
Statement G: counseling and employee assistance where appropriate.
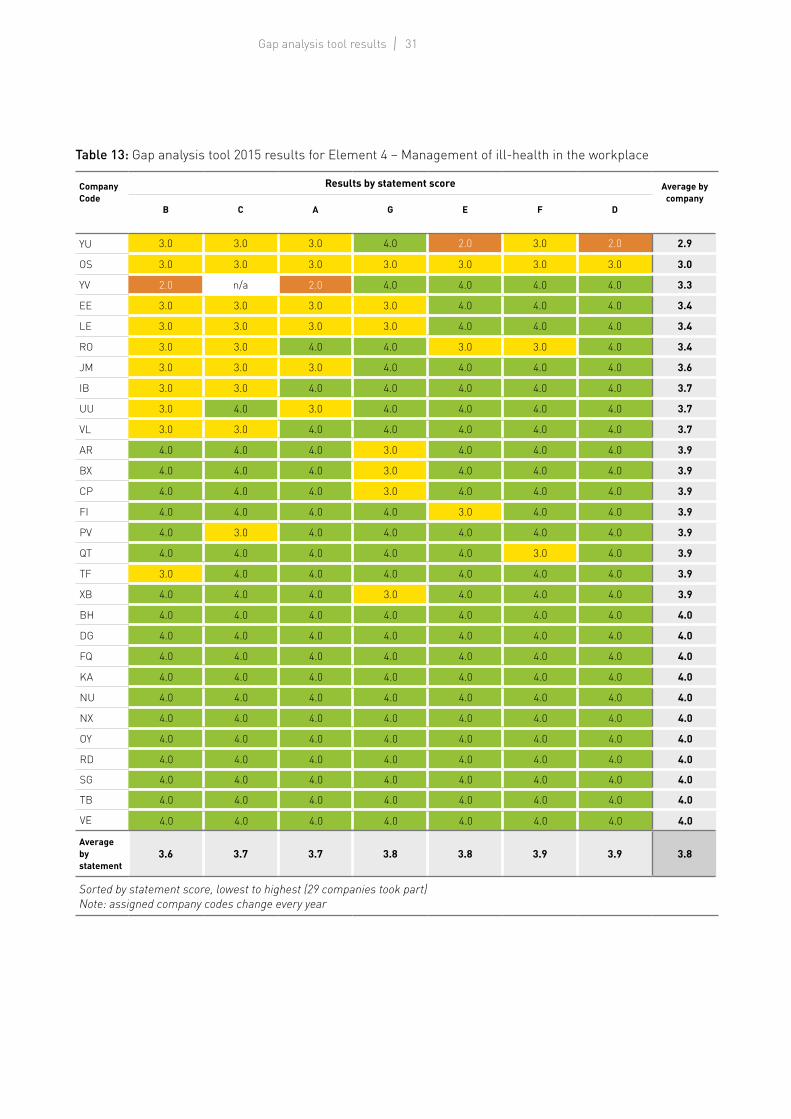
31Gap analysis tool results
Table 13: Gap analysis tool 2015 results for Element 4 – Management of ill-health in the workplace
Company Code
Results by statement score Average by company
B C A G E F D
YU 3.0 3.0 3.0 4.0 2.0 3.0 2.0 2.9
OS 3.0 3.0 3.0 3.0 3.0 3.0 3.0 3.0
YV 2.0 n/a 2.0 4.0 4.0 4.0 4.0 3.3
EE 3.0 3.0 3.0 3.0 4.0 4.0 4.0 3.4
LE 3.0 3.0 3.0 3.0 4.0 4.0 4.0 3.4
RO 3.0 3.0 4.0 4.0 3.0 3.0 4.0 3.4
JM 3.0 3.0 3.0 4.0 4.0 4.0 4.0 3.6
IB 3.0 3.0 4.0 4.0 4.0 4.0 4.0 3.7
UU 3.0 4.0 3.0 4.0 4.0 4.0 4.0 3.7
VL 3.0 3.0 4.0 4.0 4.0 4.0 4.0 3.7
AR 4.0 4.0 4.0 3.0 4.0 4.0 4.0 3.9
BX 4.0 4.0 4.0 3.0 4.0 4.0 4.0 3.9
CP 4.0 4.0 4.0 3.0 4.0 4.0 4.0 3.9
FI 4.0 4.0 4.0 4.0 3.0 4.0 4.0 3.9
PV 4.0 3.0 4.0 4.0 4.0 4.0 4.0 3.9
QT 4.0 4.0 4.0 4.0 4.0 3.0 4.0 3.9
TF 3.0 4.0 4.0 4.0 4.0 4.0 4.0 3.9
XB 4.0 4.0 4.0 3.0 4.0 4.0 4.0 3.9
BH 4.0 4.0 4.0 4.0 4.0 4.0 4.0 4.0
DG 4.0 4.0 4.0 4.0 4.0 4.0 4.0 4.0
FQ 4.0 4.0 4.0 4.0 4.0 4.0 4.0 4.0
KA 4.0 4.0 4.0 4.0 4.0 4.0 4.0 4.0
NU 4.0 4.0 4.0 4.0 4.0 4.0 4.0 4.0
NX 4.0 4.0 4.0 4.0 4.0 4.0 4.0 4.0
OY 4.0 4.0 4.0 4.0 4.0 4.0 4.0 4.0
RD 4.0 4.0 4.0 4.0 4.0 4.0 4.0 4.0
SG 4.0 4.0 4.0 4.0 4.0 4.0 4.0 4.0
TB 4.0 4.0 4.0 4.0 4.0 4.0 4.0 4.0
VE 4.0 4.0 4.0 4.0 4.0 4.0 4.0 4.0
Average by statement
3.6 3.7 3.7 3.8 3.8 3.9 3.9 3.8
Sorted by statement score, lowest to highest (29 companies took part)Note: assigned company codes change every year
32Health leading performance indicators – 2015 data
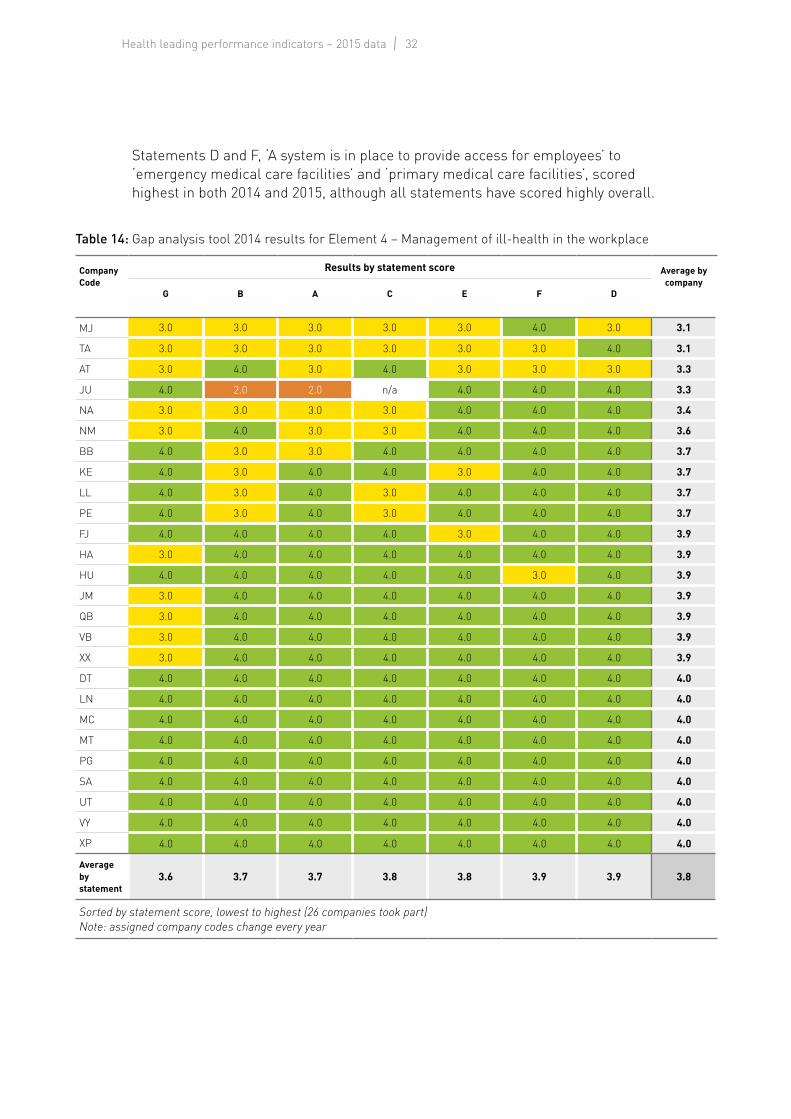
Statements D and F, ‘A system is in place to provide access for employees’ to ‘emergency medical care facilities’ and ‘primary medical care facilities’, scored highest in both 2014 and 2015, although all statements have scored highly overall.
Table 14: Gap analysis tool 2014 results for Element 4 – Management of ill-health in the workplace
Company Code
Results by statement score Average by company
G B A C E F D
MJ 3.0 3.0 3.0 3.0 3.0 4.0 3.0 3.1
TA 3.0 3.0 3.0 3.0 3.0 3.0 4.0 3.1
AT 3.0 4.0 3.0 4.0 3.0 3.0 3.0 3.3
JU 4.0 2.0 2.0 n/a 4.0 4.0 4.0 3.3
NA 3.0 3.0 3.0 3.0 4.0 4.0 4.0 3.4
NM 3.0 4.0 3.0 3.0 4.0 4.0 4.0 3.6
BB 4.0 3.0 3.0 4.0 4.0 4.0 4.0 3.7
KE 4.0 3.0 4.0 4.0 3.0 4.0 4.0 3.7
LL 4.0 3.0 4.0 3.0 4.0 4.0 4.0 3.7
PE 4.0 3.0 4.0 3.0 4.0 4.0 4.0 3.7
FJ 4.0 4.0 4.0 4.0 3.0 4.0 4.0 3.9
HA 3.0 4.0 4.0 4.0 4.0 4.0 4.0 3.9
HU 4.0 4.0 4.0 4.0 4.0 3.0 4.0 3.9
JM 3.0 4.0 4.0 4.0 4.0 4.0 4.0 3.9
QB 3.0 4.0 4.0 4.0 4.0 4.0 4.0 3.9
VB 3.0 4.0 4.0 4.0 4.0 4.0 4.0 3.9
XX 3.0 4.0 4.0 4.0 4.0 4.0 4.0 3.9
DT 4.0 4.0 4.0 4.0 4.0 4.0 4.0 4.0
LN 4.0 4.0 4.0 4.0 4.0 4.0 4.0 4.0
MC 4.0 4.0 4.0 4.0 4.0 4.0 4.0 4.0
MT 4.0 4.0 4.0 4.0 4.0 4.0 4.0 4.0
PG 4.0 4.0 4.0 4.0 4.0 4.0 4.0 4.0
SA 4.0 4.0 4.0 4.0 4.0 4.0 4.0 4.0
UT 4.0 4.0 4.0 4.0 4.0 4.0 4.0 4.0
VY 4.0 4.0 4.0 4.0 4.0 4.0 4.0 4.0
XP 4.0 4.0 4.0 4.0 4.0 4.0 4.0 4.0
Average by statement
3.6 3.7 3.7 3.8 3.8 3.9 3.9 3.8
Sorted by statement score, lowest to highest (26 companies took part)Note: assigned company codes change every year
33Gap analysis tool results
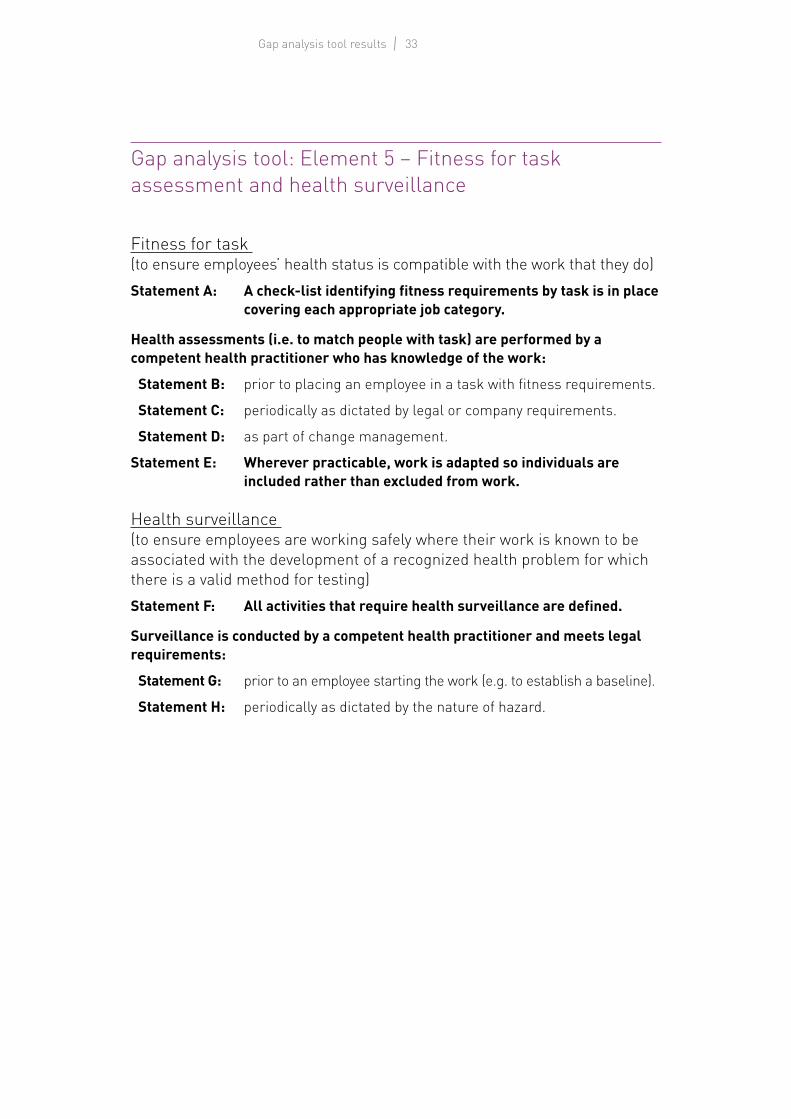
Gap analysis tool: Element 5 – Fitness for task assessment and health surveillance
Fitness for task (to ensure employees’ health status is compatible with the work that they do)Statement A: A check-list identifying fitness requirements by task is in place
covering each appropriate job category.
Health assessments (i.e. to match people with task) are performed by a competent health practitioner who has knowledge of the work:
Statement B: prior to placing an employee in a task with fitness requirements.
Statement C: periodically as dictated by legal or company requirements.
Statement D: as part of change management.
Statement E: Wherever practicable, work is adapted so individuals are included rather than excluded from work.
Health surveillance (to ensure employees are working safely where their work is known to be associated with the development of a recognized health problem for which there is a valid method for testing)Statement F: All activities that require health surveillance are defined.
Surveillance is conducted by a competent health practitioner and meets legal requirements:
Statement G: prior to an employee starting the work (e.g. to establish a baseline).
Statement H: periodically as dictated by the nature of hazard.

34Health leading performance indicators – 2015 data
Table 15: Gap analysis tool 2015 results for Element 5 – Fitness for task assessment and health
Company Code
Results by statement score Average by company
D A B C E F H G
RO 1.0 1.0 1.0 1.0 3.0 3.0 3.0 3.0 2.0
OS 2.0 2.0 2.0 3.0 2.0 2.0 2.0 3.0 2.3
SG 1.0 2.0 1.0 1.0 4.0 3.0 3.0 3.0 2.3
IB 2.0 2.0 2.0 3.0 3.0 3.0 3.0 3.0 2.6
AR 2.0 2.0 2.0 2.0 2.0 4.0 4.0 4.0 2.8
LE 2.0 2.0 3.0 3.0 3.0 3.0 3.0 3.0 2.8
EE 3.0 3.0 4.0 3.0 3.0 2.0 2.0 3.0 2.9
YU 2.0 4.0 3.0 4.0 4.0 2.0 2.0 2.0 2.9
VL 2.0 2.0 2.0 4.0 4.0 4.0 4.0 4.0 3.3
UU n/a 3.0 3.0 3.0 4.0 4.0 3.0 3.0 3.3
JM 3.0 2.0 4.0 3.0 4.0 4.0 4.0 3.0 3.4
XB 4.0 4.0 4.0 3.0 2.0 3.0 4.0 4.0 3.5
YV 4.0 3.0 4.0 4.0 4.0 3.0 3.0 3.0 3.5
KA 1.0 4.0 4.0 4.0 4.0 4.0 4.0 4.0 3.6
NX 3.0 3.0 4.0 4.0 3.0 4.0 4.0 4.0 3.6
TF 3.0 4.0 4.0 4.0 3.0 3.0 4.0 4.0 3.6
FQ 3.0 3.0 4.0 4.0 4.0 4.0 4.0 4.0 3.8
NU 4.0 2.0 4.0 4.0 4.0 4.0 4.0 4.0 3.8
BH 4.0 3.0 4.0 4.0 4.0 4.0 4.0 4.0 3.9
BX 3.0 4.0 4.0 4.0 4.0 4.0 4.0 4.0 3.9
CP 3.0 4.0 4.0 4.0 4.0 4.0 4.0 4.0 3.9
OY 3.0 4.0 4.0 4.0 4.0 4.0 4.0 4.0 3.9
PV 4.0 4.0 4.0 4.0 3.0 4.0 4.0 4.0 3.9
QT 4.0 4.0 4.0 4.0 3.0 4.0 4.0 4.0 3.9
TB 4.0 4.0 4.0 4.0 3.0 4.0 4.0 4.0 3.9
DG 4.0 4.0 4.0 4.0 4.0 4.0 4.0 4.0 4.0
FI 4.0 4.0 4.0 4.0 4.0 4.0 4.0 4.0 4.0
RD 4.0 4.0 4.0 4.0 4.0 4.0 4.0 4.0 4.0
VE 4.0 4.0 4.0 4.0 4.0 4.0 4.0 4.0 4.0
Average by statement
3.0 3.1 3.4 3.5 3.5 3.6 3.6 3.6 3.4
Sorted by statement score, lowest to highest (29 companies took part)Note: assigned company codes change every year
35Gap analysis tool results
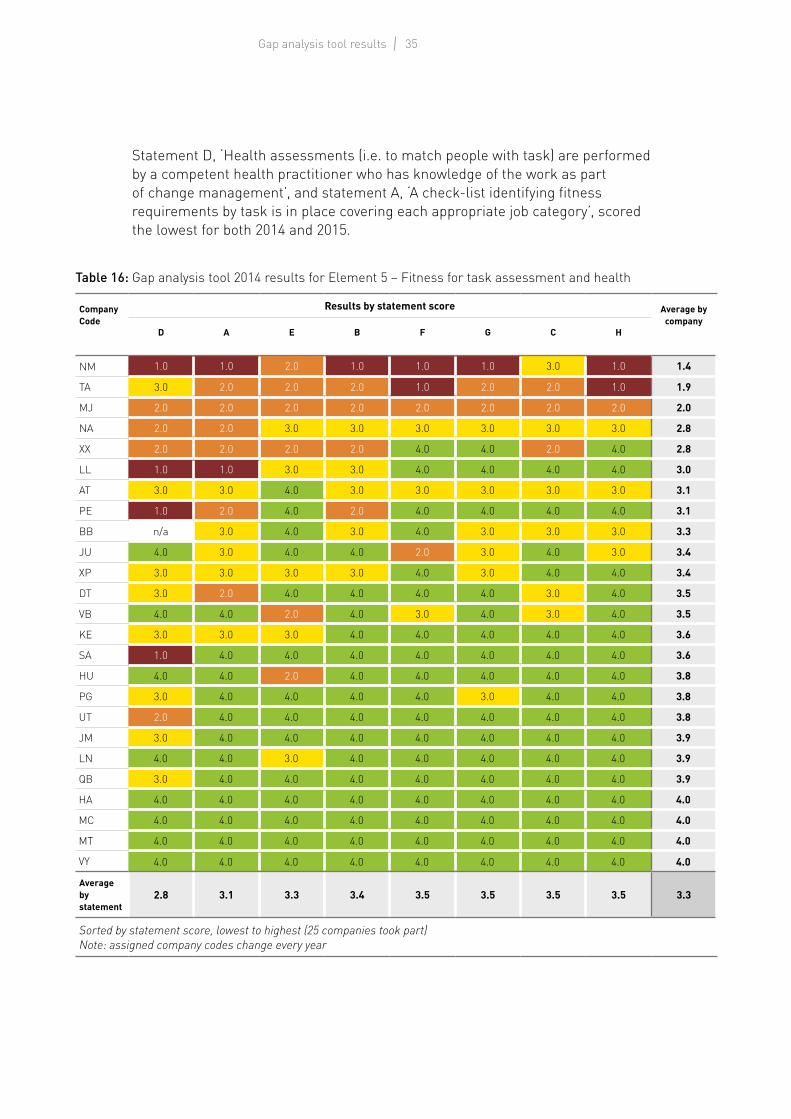
Statement D, ‘Health assessments (i.e. to match people with task) are performed by a competent health practitioner who has knowledge of the work as part of change management’, and statement A, ‘A check-list identifying fitness requirements by task is in place covering each appropriate job category’, scored the lowest for both 2014 and 2015.
Table 16: Gap analysis tool 2014 results for Element 5 – Fitness for task assessment and health
Company Code
Results by statement score Average by company
D A E B F G C H
NM 1.0 1.0 2.0 1.0 1.0 1.0 3.0 1.0 1.4
TA 3.0 2.0 2.0 2.0 1.0 2.0 2.0 1.0 1.9
MJ 2.0 2.0 2.0 2.0 2.0 2.0 2.0 2.0 2.0
NA 2.0 2.0 3.0 3.0 3.0 3.0 3.0 3.0 2.8
XX 2.0 2.0 2.0 2.0 4.0 4.0 2.0 4.0 2.8
LL 1.0 1.0 3.0 3.0 4.0 4.0 4.0 4.0 3.0
AT 3.0 3.0 4.0 3.0 3.0 3.0 3.0 3.0 3.1
PE 1.0 2.0 4.0 2.0 4.0 4.0 4.0 4.0 3.1
BB n/a 3.0 4.0 3.0 4.0 3.0 3.0 3.0 3.3
JU 4.0 3.0 4.0 4.0 2.0 3.0 4.0 3.0 3.4
XP 3.0 3.0 3.0 3.0 4.0 3.0 4.0 4.0 3.4
DT 3.0 2.0 4.0 4.0 4.0 4.0 3.0 4.0 3.5
VB 4.0 4.0 2.0 4.0 3.0 4.0 3.0 4.0 3.5
KE 3.0 3.0 3.0 4.0 4.0 4.0 4.0 4.0 3.6
SA 1.0 4.0 4.0 4.0 4.0 4.0 4.0 4.0 3.6
HU 4.0 4.0 2.0 4.0 4.0 4.0 4.0 4.0 3.8
PG 3.0 4.0 4.0 4.0 4.0 3.0 4.0 4.0 3.8
UT 2.0 4.0 4.0 4.0 4.0 4.0 4.0 4.0 3.8
JM 3.0 4.0 4.0 4.0 4.0 4.0 4.0 4.0 3.9
LN 4.0 4.0 3.0 4.0 4.0 4.0 4.0 4.0 3.9
QB 3.0 4.0 4.0 4.0 4.0 4.0 4.0 4.0 3.9
HA 4.0 4.0 4.0 4.0 4.0 4.0 4.0 4.0 4.0
MC 4.0 4.0 4.0 4.0 4.0 4.0 4.0 4.0 4.0
MT 4.0 4.0 4.0 4.0 4.0 4.0 4.0 4.0 4.0
VY 4.0 4.0 4.0 4.0 4.0 4.0 4.0 4.0 4.0
Average by statement
2.8 3.1 3.3 3.4 3.5 3.5 3.5 3.5 3.3
Sorted by statement score, lowest to highest (25 companies took part)Note: assigned company codes change every year
36Health leading performance indicators – 2015 data
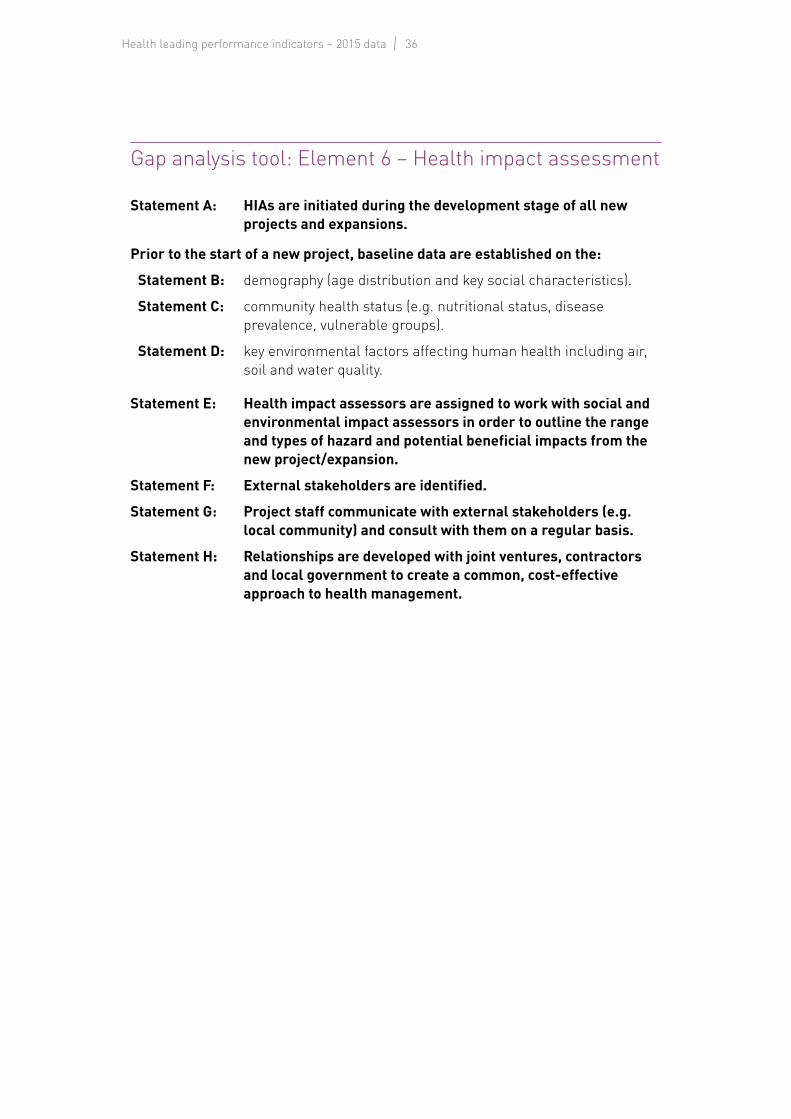
Gap analysis tool: Element 6 – Health impact assessment
Statement A: HIAs are initiated during the development stage of all new projects and expansions.
Prior to the start of a new project, baseline data are established on the:
Statement B: demography (age distribution and key social characteristics).
Statement C: community health status (e.g. nutritional status, disease prevalence, vulnerable groups).
Statement D: key environmental factors affecting human health including air, soil and water quality.
Statement E: Health impact assessors are assigned to work with social and environmental impact assessors in order to outline the range and types of hazard and potential beneficial impacts from the new project/expansion.
Statement F: External stakeholders are identified.
Statement G: Project staff communicate with external stakeholders (e.g. local community) and consult with them on a regular basis.
Statement H: Relationships are developed with joint ventures, contractors and local government to create a common, cost-effective approach to health management.
37Gap analysis tool results
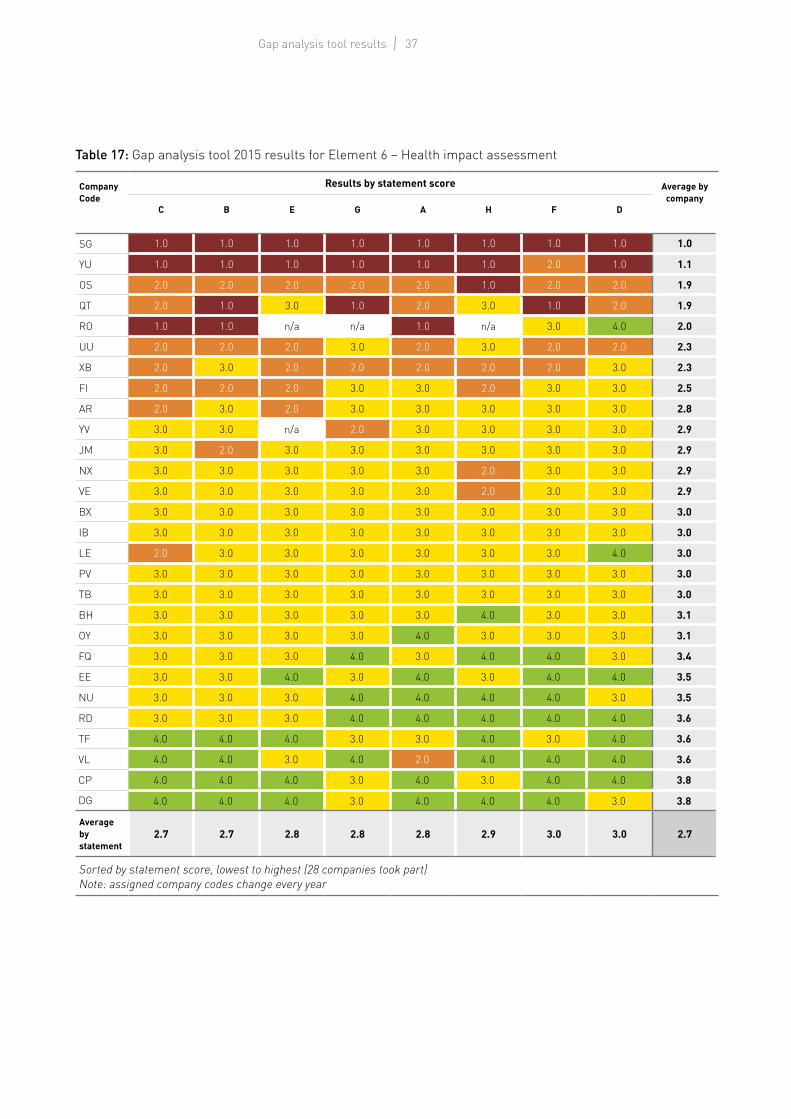
Table 17: Gap analysis tool 2015 results for Element 6 – Health impact assessment
Company Code
Results by statement score Average by company
C B E G A H F D
SG 1.0 1.0 1.0 1.0 1.0 1.0 1.0 1.0 1.0
YU 1.0 1.0 1.0 1.0 1.0 1.0 2.0 1.0 1.1
OS 2.0 2.0 2.0 2.0 2.0 1.0 2.0 2.0 1.9
QT 2.0 1.0 3.0 1.0 2.0 3.0 1.0 2.0 1.9
RO 1.0 1.0 n/a n/a 1.0 n/a 3.0 4.0 2.0
UU 2.0 2.0 2.0 3.0 2.0 3.0 2.0 2.0 2.3
XB 2.0 3.0 2.0 2.0 2.0 2.0 2.0 3.0 2.3
FI 2.0 2.0 2.0 3.0 3.0 2.0 3.0 3.0 2.5
AR 2.0 3.0 2.0 3.0 3.0 3.0 3.0 3.0 2.8
YV 3.0 3.0 n/a 2.0 3.0 3.0 3.0 3.0 2.9
JM 3.0 2.0 3.0 3.0 3.0 3.0 3.0 3.0 2.9
NX 3.0 3.0 3.0 3.0 3.0 2.0 3.0 3.0 2.9
VE 3.0 3.0 3.0 3.0 3.0 2.0 3.0 3.0 2.9
BX 3.0 3.0 3.0 3.0 3.0 3.0 3.0 3.0 3.0
IB 3.0 3.0 3.0 3.0 3.0 3.0 3.0 3.0 3.0
LE 2.0 3.0 3.0 3.0 3.0 3.0 3.0 4.0 3.0
PV 3.0 3.0 3.0 3.0 3.0 3.0 3.0 3.0 3.0
TB 3.0 3.0 3.0 3.0 3.0 3.0 3.0 3.0 3.0
BH 3.0 3.0 3.0 3.0 3.0 4.0 3.0 3.0 3.1
OY 3.0 3.0 3.0 3.0 4.0 3.0 3.0 3.0 3.1
FQ 3.0 3.0 3.0 4.0 3.0 4.0 4.0 3.0 3.4
EE 3.0 3.0 4.0 3.0 4.0 3.0 4.0 4.0 3.5
NU 3.0 3.0 3.0 4.0 4.0 4.0 4.0 3.0 3.5
RD 3.0 3.0 3.0 4.0 4.0 4.0 4.0 4.0 3.6
TF 4.0 4.0 4.0 3.0 3.0 4.0 3.0 4.0 3.6
VL 4.0 4.0 3.0 4.0 2.0 4.0 4.0 4.0 3.6
CP 4.0 4.0 4.0 3.0 4.0 3.0 4.0 4.0 3.8
DG 4.0 4.0 4.0 3.0 4.0 4.0 4.0 3.0 3.8
Average by statement
2.7 2.7 2.8 2.8 2.8 2.9 3.0 3.0 2.7
Sorted by statement score, lowest to highest (28 companies took part)Note: assigned company codes change every year
38Health leading performance indicators – 2015 data
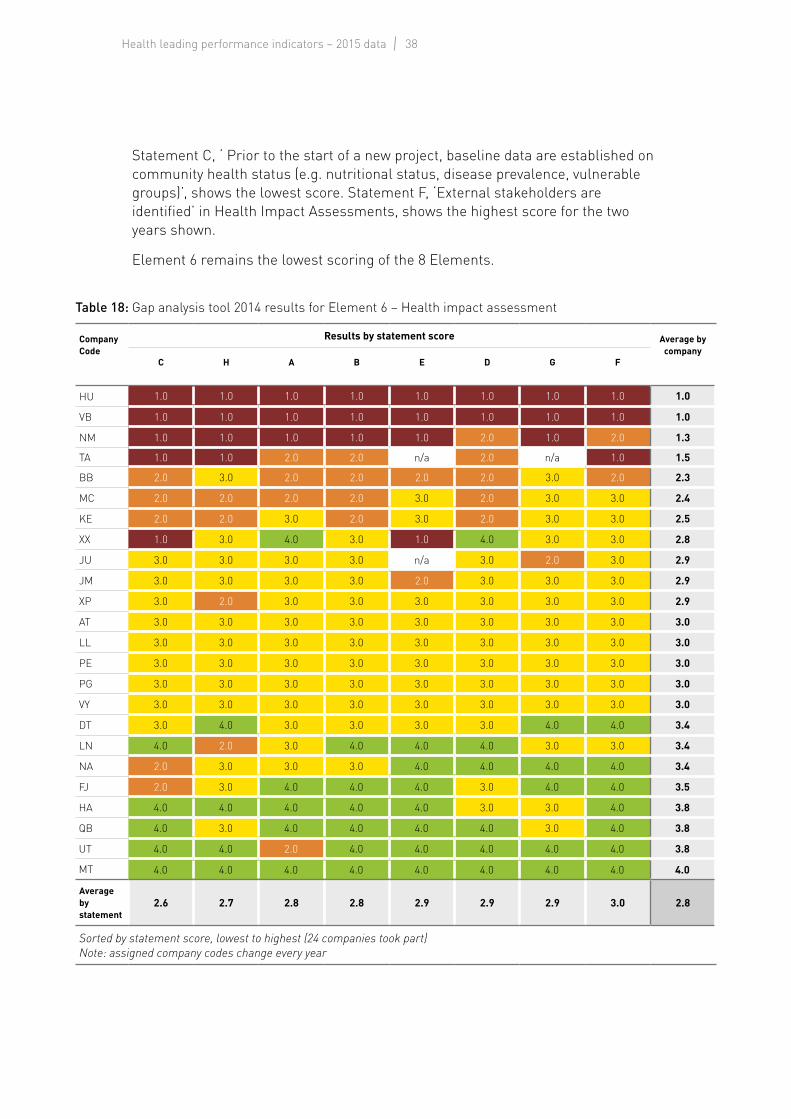
Statement C, ‘ Prior to the start of a new project, baseline data are established on community health status (e.g. nutritional status, disease prevalence, vulnerable groups)’, shows the lowest score. Statement F, ‘External stakeholders are identified’ in Health Impact Assessments, shows the highest score for the two years shown.
Element 6 remains the lowest scoring of the 8 Elements.
Table 18: Gap analysis tool 2014 results for Element 6 – Health impact assessment
Company Code
Results by statement score Average by company
C H A B E D G F
HU 1.0 1.0 1.0 1.0 1.0 1.0 1.0 1.0 1.0
VB 1.0 1.0 1.0 1.0 1.0 1.0 1.0 1.0 1.0
NM 1.0 1.0 1.0 1.0 1.0 2.0 1.0 2.0 1.3
TA 1.0 1.0 2.0 2.0 n/a 2.0 n/a 1.0 1.5
BB 2.0 3.0 2.0 2.0 2.0 2.0 3.0 2.0 2.3
MC 2.0 2.0 2.0 2.0 3.0 2.0 3.0 3.0 2.4
KE 2.0 2.0 3.0 2.0 3.0 2.0 3.0 3.0 2.5
XX 1.0 3.0 4.0 3.0 1.0 4.0 3.0 3.0 2.8
JU 3.0 3.0 3.0 3.0 n/a 3.0 2.0 3.0 2.9
JM 3.0 3.0 3.0 3.0 2.0 3.0 3.0 3.0 2.9
XP 3.0 2.0 3.0 3.0 3.0 3.0 3.0 3.0 2.9
AT 3.0 3.0 3.0 3.0 3.0 3.0 3.0 3.0 3.0
LL 3.0 3.0 3.0 3.0 3.0 3.0 3.0 3.0 3.0
PE 3.0 3.0 3.0 3.0 3.0 3.0 3.0 3.0 3.0
PG 3.0 3.0 3.0 3.0 3.0 3.0 3.0 3.0 3.0
VY 3.0 3.0 3.0 3.0 3.0 3.0 3.0 3.0 3.0
DT 3.0 4.0 3.0 3.0 3.0 3.0 4.0 4.0 3.4
LN 4.0 2.0 3.0 4.0 4.0 4.0 3.0 3.0 3.4
NA 2.0 3.0 3.0 3.0 4.0 4.0 4.0 4.0 3.4
FJ 2.0 3.0 4.0 4.0 4.0 3.0 4.0 4.0 3.5
HA 4.0 4.0 4.0 4.0 4.0 3.0 3.0 4.0 3.8
QB 4.0 3.0 4.0 4.0 4.0 4.0 3.0 4.0 3.8
UT 4.0 4.0 2.0 4.0 4.0 4.0 4.0 4.0 3.8
MT 4.0 4.0 4.0 4.0 4.0 4.0 4.0 4.0 4.0
Average by statement
2.6 2.7 2.8 2.8 2.9 2.9 2.9 3.0 2.8
Sorted by statement score, lowest to highest (24 companies took part)Note: assigned company codes change every year
39Gap analysis tool results
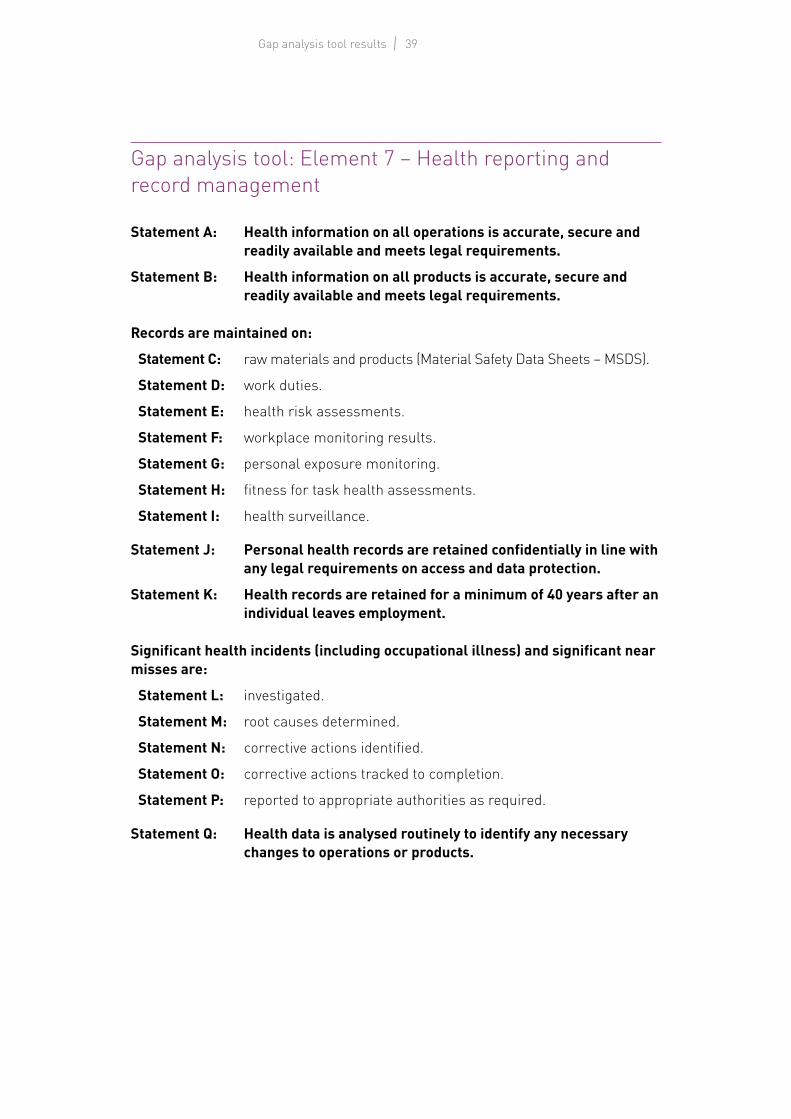
Gap analysis tool: Element 7 – Health reporting and record management
Statement A: Health information on all operations is accurate, secure and readily available and meets legal requirements.
Statement B: Health information on all products is accurate, secure and readily available and meets legal requirements.
Records are maintained on:
Statement C: raw materials and products (Material Safety Data Sheets – MSDS).
Statement D: work duties.
Statement E: health risk assessments.
Statement F: workplace monitoring results.
Statement G: personal exposure monitoring.
Statement H: fitness for task health assessments.
Statement I: health surveillance.
Statement J: Personal health records are retained confidentially in line with any legal requirements on access and data protection.
Statement K: Health records are retained for a minimum of 40 years after an individual leaves employment.
Significant health incidents (including occupational illness) and significant near misses are:
Statement L: investigated.
Statement M: root causes determined.
Statement N: corrective actions identified.
Statement O: corrective actions tracked to completion.
Statement P: reported to appropriate authorities as required.
Statement Q: Health data is analysed routinely to identify any necessary changes to operations or products.

40Health leading performance indicators – 2015 data
Table 19: Gap analysis tool 2015 results for Element 7 – Health reporting and record management
Company Code
Results by statement score Average by company
Q G F E D H I A B K M N O L C P J
SG 2.0 2.0 2.0 2.0 2.0 2.0 2.0 1.0 1.0 2.0 4.0 4.0 4.0 4.0 3.0 4.0 4.0 2.6
OS 2.0 3.0 3.0 3.0 3.0 3.0 3.0 3.0 2.0 1.0 3.0 3.0 3.0 3.0 3.0 3.0 3.0 2.8
YU 3.0 2.0 2.0 2.0 3.0 4.0 2.0 2.0 n/a 4.0 3.0 3.0 3.0 3.0 3.0 3.0 4.0 2.9
FI 3.0 3.0 3.0 3.0 3.0 3.0 3.0 3.0 3.0 3.0 2.0 2.0 2.0 2.0 4.0 4.0 4.0 2.9
UU 2.0 3.0 3.0 3.0 2.0 2.0 3.0 3.0 3.0 4.0 3.0 3.0 4.0 3.0 4.0 4.0 4.0 3.1
EE 3.0 3.0 3.0 3.0 4.0 3.0 3.0 3.0 4.0 4.0 3.0 3.0 3.0 3.0 4.0 3.0 4.0 3.3
RO 1.0 3.0 3.0 2.0 2.0 2.0 3.0 4.0 4.0 4.0 4.0 4.0 4.0 4.0 4.0 4.0 4.0 3.3
BX 2.0 4.0 4.0 4.0 4.0 4.0 4.0 3.0 3.0 4.0 3.0 3.0 3.0 3.0 3.0 4.0 3.0 3.4
IB 3.0 2.0 3.0 3.0 3.0 2.0 3.0 4.0 4.0 4.0 4.0 4.0 3.0 4.0 4.0 4.0 4.0 3.4
LE 3.0 3.0 3.0 4.0 3.0 4.0 4.0 3.0 4.0 4.0 3.0 3.0 3.0 3.0 4.0 3.0 4.0 3.4
TF 4.0 3.0 3.0 3.0 2.0 3.0 3.0 3.0 4.0 4.0 4.0 4.0 4.0 4.0 3.0 4.0 4.0 3.5
JM 3.0 3.0 4.0 3.0 4.0 4.0 3.0 4.0 4.0 3.0 3.0 3.0 4.0 4.0 4.0 4.0 4.0 3.6
YV n/a 2.0 2.0 4.0 4.0 4.0 2.0 4.0 4.0 4.0 4.0 4.0 4.0 4.0 4.0 4.0 4.0 3.6
PV 3.0 4.0 3.0 3.0 3.0 4.0 4.0 4.0 4.0 4.0 4.0 4.0 4.0 4.0 4.0 3.0 4.0 3.7
KA 4.0 3.0 4.0 3.0 4.0 4.0 4.0 4.0 n/a 2.0 4.0 4.0 4.0 4.0 4.0 4.0 4.0 3.8
NU 2.0 2.0 4.0 4.0 4.0 4.0 4.0 4.0 4.0 4.0 4.0 4.0 4.0 4.0 4.0 4.0 4.0 3.8
QT 3.0 3.0 4.0 4.0 4.0 3.0 4.0 4.0 4.0 4.0 4.0 4.0 4.0 4.0 3.0 4.0 4.0 3.8
XB 3.0 3.0 3.0 4.0 4.0 4.0 4.0 4.0 4.0 n/a 4.0 4.0 4.0 4.0 4.0 4.0 4.0 3.8
AR 3.0 4.0 4.0 4.0 4.0 3.0 4.0 4.0 4.0 3.0 4.0 4.0 4.0 4.0 4.0 4.0 4.0 3.8
NX 4.0 4.0 3.0 4.0 4.0 4.0 4.0 4.0 3.0 4.0 4.0 4.0 3.0 4.0 4.0 4.0 4.0 3.8
TB 4.0 3.0 3.0 3.0 4.0 4.0 4.0 4.0 4.0 4.0 4.0 4.0 4.0 4.0 4.0 4.0 4.0 3.8
BH 2.0 4.0 4.0 4.0 4.0 4.0 4.0 4.0 4.0 4.0 4.0 4.0 4.0 4.0 4.0 4.0 4.0 3.9
DG 3.0 4.0 4.0 4.0 4.0 4.0 4.0 3.0 4.0 4.0 4.0 4.0 4.0 4.0 4.0 4.0 4.0 3.9
VL 3.0 4.0 4.0 3.0 4.0 4.0 4.0 4.0 4.0 4.0 4.0 4.0 4.0 4.0 4.0 4.0 4.0 3.9
CP 3.0 4.0 4.0 4.0 4.0 4.0 4.0 4.0 4.0 4.0 4.0 4.0 4.0 4.0 4.0 4.0 4.0 3.9
FQ 4.0 4.0 4.0 4.0 4.0 4.0 4.0 4.0 3.0 4.0 4.0 4.0 4.0 4.0 4.0 4.0 4.0 3.9
OY 3.0 4.0 4.0 4.0 4.0 4.0 4.0 4.0 4.0 4.0 4.0 4.0 4.0 4.0 4.0 4.0 4.0 3.9
RD 4.0 4.0 4.0 4.0 4.0 4.0 4.0 4.0 4.0 4.0 4.0 4.0 4.0 4.0 4.0 4.0 4.0 4.0
VE 4.0 4.0 4.0 4.0 4.0 4.0 4.0 4.0 4.0 4.0 4.0 4.0 4.0 4.0 4.0 4.0 4.0 4.0
Average by statement
3.0 3.2 3.4 3.4 3.5 3.5 3.5 3.6 3.6 3.6 3.7 3.7 3.7 3.7 3.8 3.8 3.9 3.5
Sorted by statement score, lowest to highest (29 companies took part)Note: assigned company codes change every year
41Gap analysis tool results
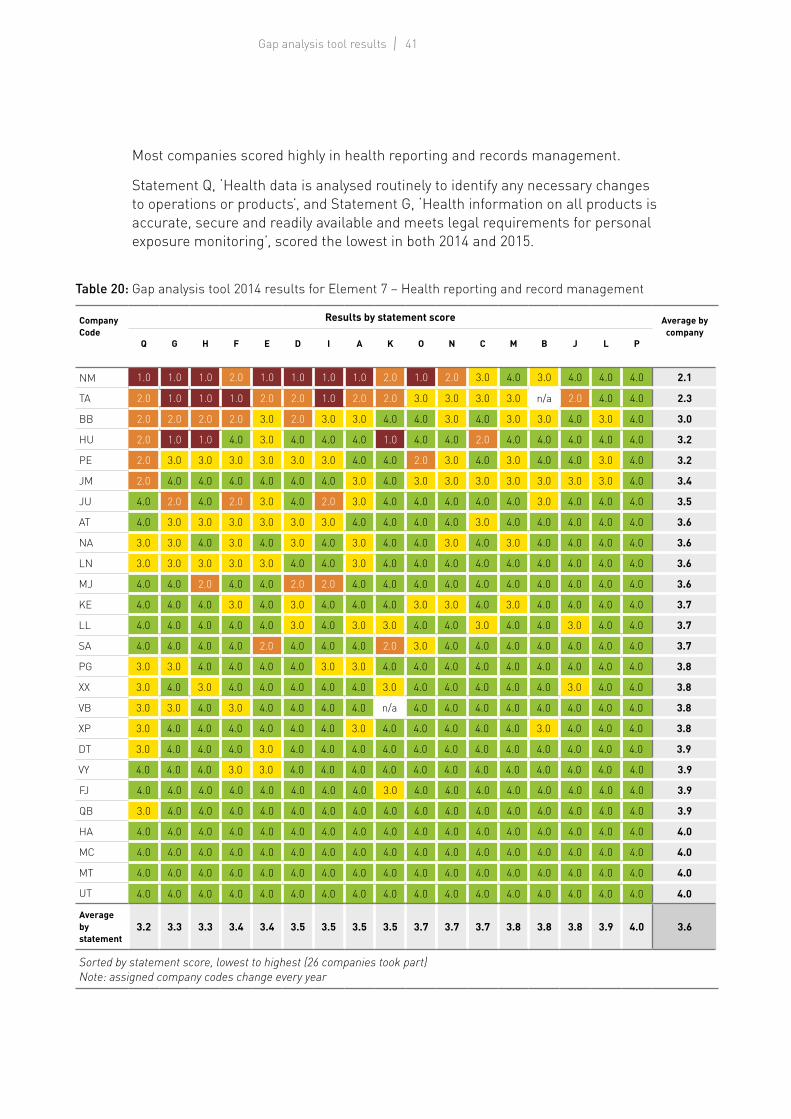
Most companies scored highly in health reporting and records management.
Statement Q, ‘Health data is analysed routinely to identify any necessary changes to operations or products’, and Statement G, ‘Health information on all products is accurate, secure and readily available and meets legal requirements for personal exposure monitoring’, scored the lowest in both 2014 and 2015.
Table 20: Gap analysis tool 2014 results for Element 7 – Health reporting and record management
Company Code
Results by statement score Average by company
Q G H F E D I A K O N C M B J L P
NM 1.0 1.0 1.0 2.0 1.0 1.0 1.0 1.0 2.0 1.0 2.0 3.0 4.0 3.0 4.0 4.0 4.0 2.1
TA 2.0 1.0 1.0 1.0 2.0 2.0 1.0 2.0 2.0 3.0 3.0 3.0 3.0 n/a 2.0 4.0 4.0 2.3
BB 2.0 2.0 2.0 2.0 3.0 2.0 3.0 3.0 4.0 4.0 3.0 4.0 3.0 3.0 4.0 3.0 4.0 3.0
HU 2.0 1.0 1.0 4.0 3.0 4.0 4.0 4.0 1.0 4.0 4.0 2.0 4.0 4.0 4.0 4.0 4.0 3.2
PE 2.0 3.0 3.0 3.0 3.0 3.0 3.0 4.0 4.0 2.0 3.0 4.0 3.0 4.0 4.0 3.0 4.0 3.2
JM 2.0 4.0 4.0 4.0 4.0 4.0 4.0 3.0 4.0 3.0 3.0 3.0 3.0 3.0 3.0 3.0 4.0 3.4
JU 4.0 2.0 4.0 2.0 3.0 4.0 2.0 3.0 4.0 4.0 4.0 4.0 4.0 3.0 4.0 4.0 4.0 3.5
AT 4.0 3.0 3.0 3.0 3.0 3.0 3.0 4.0 4.0 4.0 4.0 3.0 4.0 4.0 4.0 4.0 4.0 3.6
NA 3.0 3.0 4.0 3.0 4.0 3.0 4.0 3.0 4.0 4.0 3.0 4.0 3.0 4.0 4.0 4.0 4.0 3.6
LN 3.0 3.0 3.0 3.0 3.0 4.0 4.0 3.0 4.0 4.0 4.0 4.0 4.0 4.0 4.0 4.0 4.0 3.6
MJ 4.0 4.0 2.0 4.0 4.0 2.0 2.0 4.0 4.0 4.0 4.0 4.0 4.0 4.0 4.0 4.0 4.0 3.6
KE 4.0 4.0 4.0 3.0 4.0 3.0 4.0 4.0 4.0 3.0 3.0 4.0 3.0 4.0 4.0 4.0 4.0 3.7
LL 4.0 4.0 4.0 4.0 4.0 3.0 4.0 3.0 3.0 4.0 4.0 3.0 4.0 4.0 3.0 4.0 4.0 3.7
SA 4.0 4.0 4.0 4.0 2.0 4.0 4.0 4.0 2.0 3.0 4.0 4.0 4.0 4.0 4.0 4.0 4.0 3.7
PG 3.0 3.0 4.0 4.0 4.0 4.0 3.0 3.0 4.0 4.0 4.0 4.0 4.0 4.0 4.0 4.0 4.0 3.8
XX 3.0 4.0 3.0 4.0 4.0 4.0 4.0 4.0 3.0 4.0 4.0 4.0 4.0 4.0 3.0 4.0 4.0 3.8
VB 3.0 3.0 4.0 3.0 4.0 4.0 4.0 4.0 n/a 4.0 4.0 4.0 4.0 4.0 4.0 4.0 4.0 3.8
XP 3.0 4.0 4.0 4.0 4.0 4.0 4.0 3.0 4.0 4.0 4.0 4.0 4.0 3.0 4.0 4.0 4.0 3.8
DT 3.0 4.0 4.0 4.0 3.0 4.0 4.0 4.0 4.0 4.0 4.0 4.0 4.0 4.0 4.0 4.0 4.0 3.9
VY 4.0 4.0 4.0 3.0 3.0 4.0 4.0 4.0 4.0 4.0 4.0 4.0 4.0 4.0 4.0 4.0 4.0 3.9
FJ 4.0 4.0 4.0 4.0 4.0 4.0 4.0 4.0 3.0 4.0 4.0 4.0 4.0 4.0 4.0 4.0 4.0 3.9
QB 3.0 4.0 4.0 4.0 4.0 4.0 4.0 4.0 4.0 4.0 4.0 4.0 4.0 4.0 4.0 4.0 4.0 3.9
HA 4.0 4.0 4.0 4.0 4.0 4.0 4.0 4.0 4.0 4.0 4.0 4.0 4.0 4.0 4.0 4.0 4.0 4.0
MC 4.0 4.0 4.0 4.0 4.0 4.0 4.0 4.0 4.0 4.0 4.0 4.0 4.0 4.0 4.0 4.0 4.0 4.0
MT 4.0 4.0 4.0 4.0 4.0 4.0 4.0 4.0 4.0 4.0 4.0 4.0 4.0 4.0 4.0 4.0 4.0 4.0
UT 4.0 4.0 4.0 4.0 4.0 4.0 4.0 4.0 4.0 4.0 4.0 4.0 4.0 4.0 4.0 4.0 4.0 4.0
Average by statement
3.2 3.3 3.3 3.4 3.4 3.5 3.5 3.5 3.5 3.7 3.7 3.7 3.8 3.8 3.8 3.9 4.0 3.6
Sorted by statement score, lowest to highest (26 companies took part)Note: assigned company codes change every year

42Health leading performance indicators – 2015 data
Gap analysis tool: Element 8 – Public health interface and promotion of good health
Statement A: An effective interface between public health and occupational health is maintained to mitigate major business risks and identify key sources of epidemiological information.
Statement B: Communications are maintained with local governments and health authorities to plan timely response to major outbreaks of infectious diseases.
A programme is in place to:
Statement C: identify key employee health and wellness (e.g. smoking, obesity, heart disease, high risk behaviour) issues.
Statement D: develop programmes to educate employees on prevention and risk reduction (e.g. anti-smoking and fitness campaigns).
Statement E: Where appropriate extend these programmes beyond the workforce to include the community (e.g. HIV, tuberculosis, malaria and vaccination programmes).

43Gap analysis tool results
Table 21: Gap analysis tool 2015 results for Element 8 – Public health interface and promotion of good health
Company Code
Results by statement score Average by company
E B A D C
SG 1.0 2.0 1.0 3.0 3.0 2.0
UU 2.0 3.0 3.0 1.0 1.0 2.0
RO 3.0 2.0 4.0 1.0 1.0 2.2
YU 1.0 2.0 2.0 3.0 3.0 2.2
JM 2.0 2.0 3.0 3.0 3.0 2.6
OS 2.0 3.0 3.0 3.0 3.0 2.8
AR 3.0 3.0 3.0 3.0 3.0 3.0
EE 3.0 3.0 3.0 3.0 3.0 3.0
TB 3.0 3.0 3.0 3.0 3.0 3.0
BX 3.0 4.0 3.0 3.0 3.0 3.2
IB 3.0 4.0 3.0 3.0 3.0 3.2
LE 3.0 3.0 3.0 3.0 4.0 3.2
NX 2.0 3.0 3.0 4.0 4.0 3.2
OY 3.0 3.0 4.0 3.0 3.0 3.2
QT 1.0 4.0 3.0 4.0 4.0 3.2
CP 3.0 4.0 4.0 3.0 3.0 3.4
FI 2.0 4.0 3.0 4.0 4.0 3.4
BH 4.0 3.0 3.0 4.0 4.0 3.6
KA 3.0 3.0 4.0 4.0 4.0 3.6
PV 3.0 3.0 4.0 4.0 4.0 3.6
TF 4.0 3.0 3.0 4.0 4.0 3.6
XB 4.0 3.0 3.0 4.0 4.0 3.6
VL 4.0 3.0 4.0 4.0 4.0 3.8
DG 4.0 4.0 4.0 4.0 4.0 4.0
FQ 4.0 4.0 4.0 4.0 4.0 4.0
NU 4.0 4.0 4.0 4.0 4.0 4.0
RD 4.0 4.0 4.0 4.0 4.0 4.0
VE 4.0 4.0 4.0 4.0 4.0 4.0
YV 4.0 4.0 4.0 4.0 4.0 4.0
Average by statement
3.0 3.2 3.3 3.4 3.4 3.2
Sorted by statement score, lowest to highest (29 companies took part)Note: assigned company codes change every year
44Health leading performance indicators – 2015 data
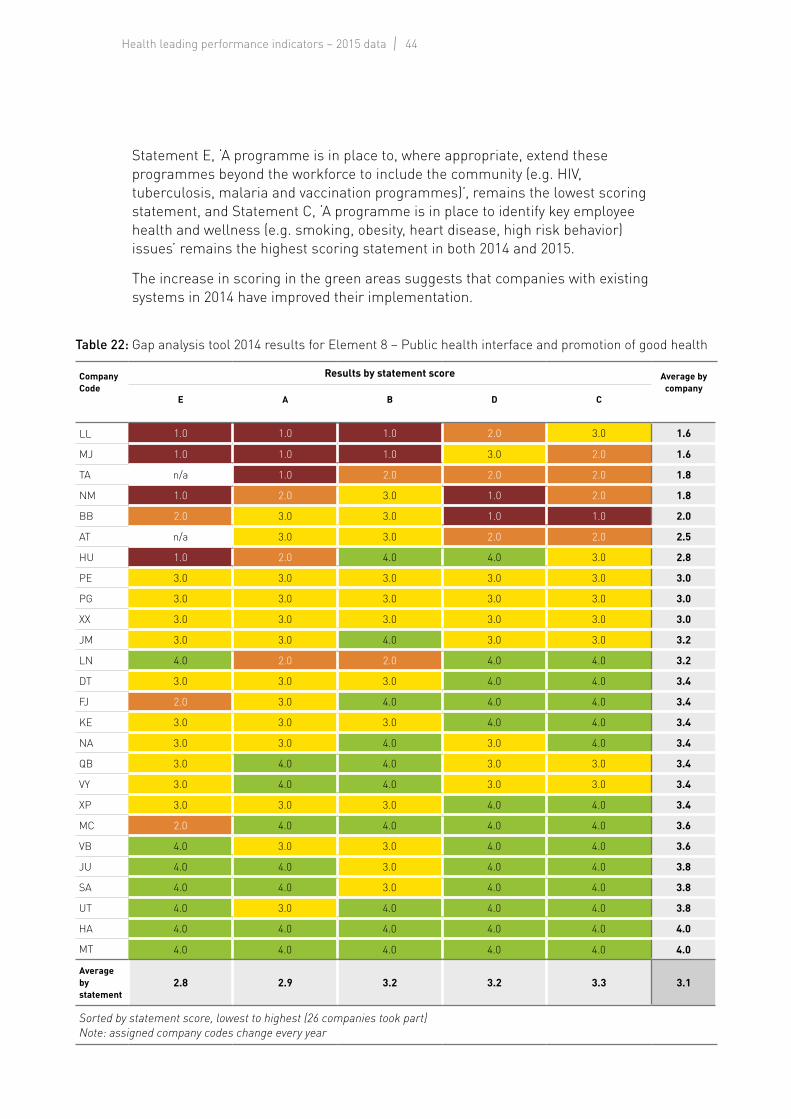
Statement E, ‘A programme is in place to, where appropriate, extend these programmes beyond the workforce to include the community (e.g. HIV, tuberculosis, malaria and vaccination programmes)’, remains the lowest scoring statement, and Statement C, ‘A programme is in place to identify key employee health and wellness (e.g. smoking, obesity, heart disease, high risk behavior) issues’ remains the highest scoring statement in both 2014 and 2015.
The increase in scoring in the green areas suggests that companies with existing systems in 2014 have improved their implementation.
Table 22: Gap analysis tool 2014 results for Element 8 – Public health interface and promotion of good health
Company Code
Results by statement score Average by company
E A B D C
LL 1.0 1.0 1.0 2.0 3.0 1.6
MJ 1.0 1.0 1.0 3.0 2.0 1.6
TA n/a 1.0 2.0 2.0 2.0 1.8
NM 1.0 2.0 3.0 1.0 2.0 1.8
BB 2.0 3.0 3.0 1.0 1.0 2.0
AT n/a 3.0 3.0 2.0 2.0 2.5
HU 1.0 2.0 4.0 4.0 3.0 2.8
PE 3.0 3.0 3.0 3.0 3.0 3.0
PG 3.0 3.0 3.0 3.0 3.0 3.0
XX 3.0 3.0 3.0 3.0 3.0 3.0
JM 3.0 3.0 4.0 3.0 3.0 3.2
LN 4.0 2.0 2.0 4.0 4.0 3.2
DT 3.0 3.0 3.0 4.0 4.0 3.4
FJ 2.0 3.0 4.0 4.0 4.0 3.4
KE 3.0 3.0 3.0 4.0 4.0 3.4
NA 3.0 3.0 4.0 3.0 4.0 3.4
QB 3.0 4.0 4.0 3.0 3.0 3.4
VY 3.0 4.0 4.0 3.0 3.0 3.4
XP 3.0 3.0 3.0 4.0 4.0 3.4
MC 2.0 4.0 4.0 4.0 4.0 3.6
VB 4.0 3.0 3.0 4.0 4.0 3.6
JU 4.0 4.0 3.0 4.0 4.0 3.8
SA 4.0 4.0 3.0 4.0 4.0 3.8
UT 4.0 3.0 4.0 4.0 4.0 3.8
HA 4.0 4.0 4.0 4.0 4.0 4.0
MT 4.0 4.0 4.0 4.0 4.0 4.0
Average by statement
2.8 2.9 3.2 3.2 3.3 3.1
Sorted by statement score, lowest to highest (26 companies took part)Note: assigned company codes change every year
45Appendix A
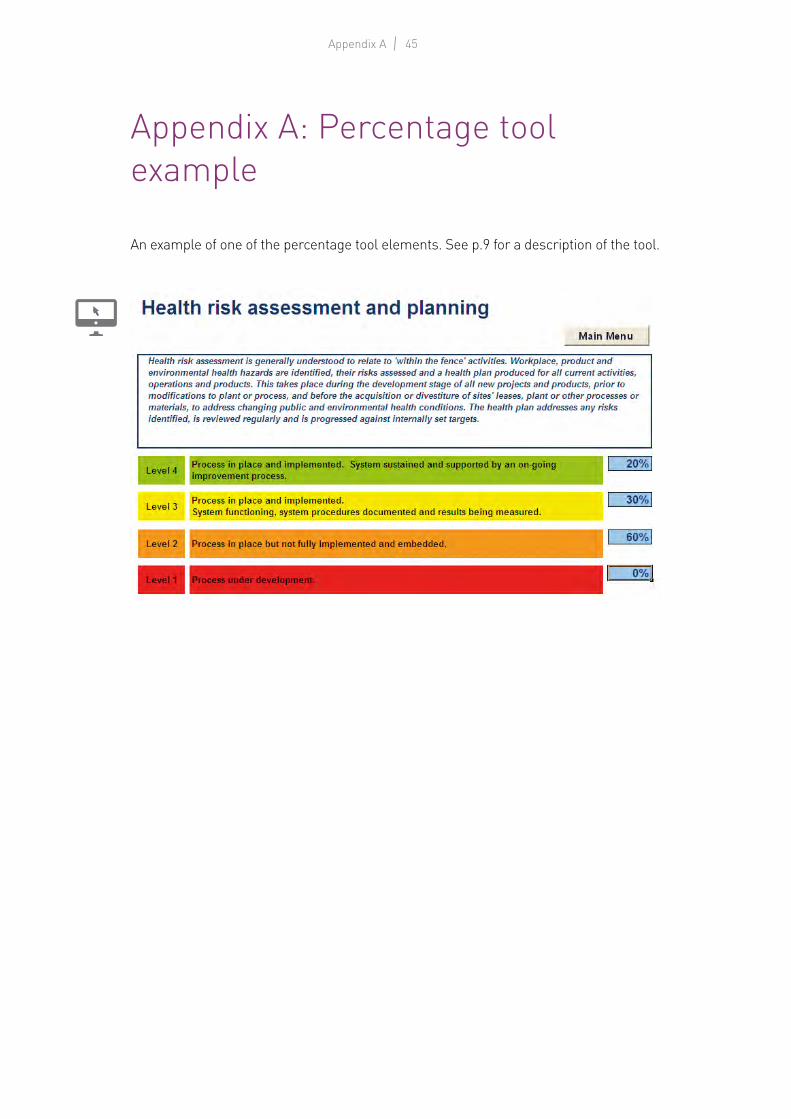
Appendix A: Percentage tool example
An example of one of the percentage tool elements. See p.9 for a description of the tool.
46Health leading performance indicators – 2015 data
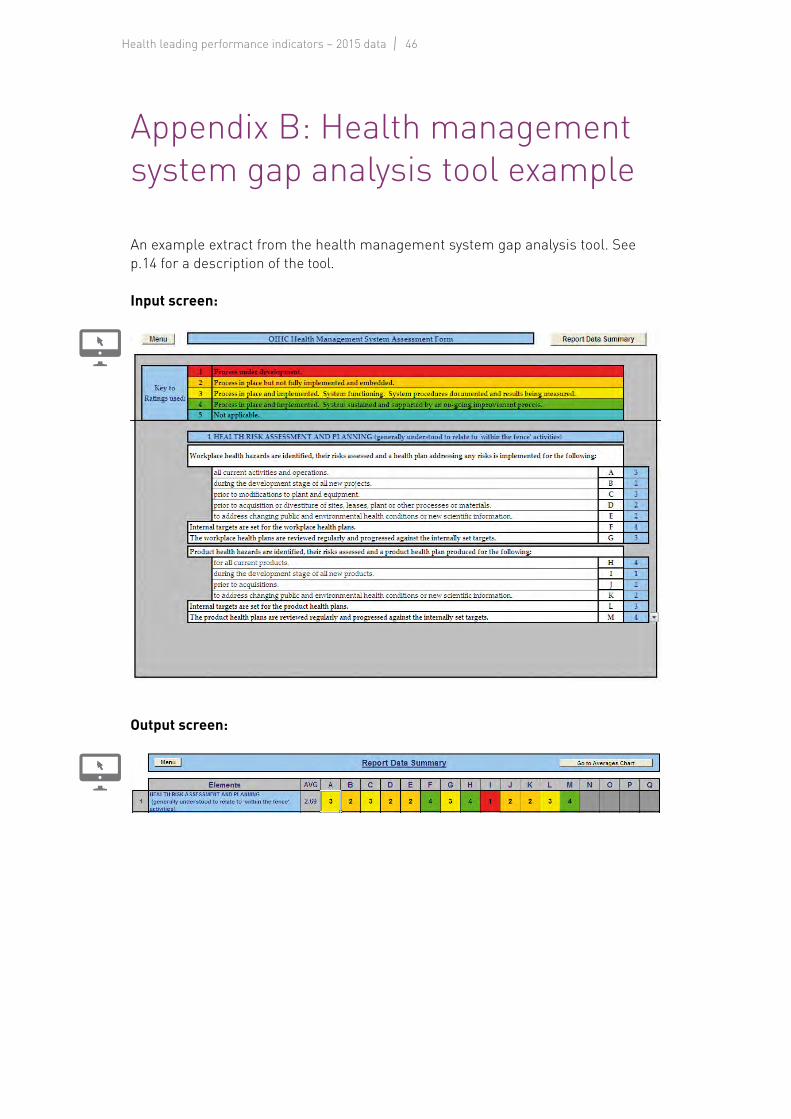
Appendix B: Health management system gap analysis tool example
An example extract from the health management system gap analysis tool. See p.14 for a description of the tool.
Input screen:
Output screen:
47Appendix C
Appendix C: The eight elements of the health management system that are measuredThe eight measured health management elements are
1. Health risk assessment and planning
2. Industrial hygiene and control of workplace exposures
3. Medical emergency management
4. Management of ill-health in the workplace
5. Fitness for task assessment and health surveillance
6. Health impact assessment
7. Health reporting and record management
8. Public health interface and promotion of good health.
Qualitative descriptions covering the key aspects of what needs to be done to adequately manage each element follow. These are taken from IOGP Report 393, Health Performance Indicators. A guide for the oil and gas industry.
Element 1 : Health risk assessment and planningHealth risk assessment is generally understood to relate to ‘within the fence’ activities. Workplace, product and environmental health hazards are identified, their risks assessed and a health plan produced for all current activities, operations and products. This takes place during the development stage of all new projects and products, prior to modifications to plant or process, and before the acquisition or divestiture of sites, leases, plant or other processes or materials, to address changing public and environment health conditions. The health plan addresses any risks identified, is reviewed regularly and is progressed against internally set targets.
Element 2: Industrial hygiene and control of workplace exposuresThe workplace environment meets legal requirements and does not harm health. Industrial hygiene and occupational health expertise is used to assess all chemical, physical, biological, ergonomic and psychological health hazards and advise on the implementation of appropriate controls and work practices to eliminate or minimize exposures. Workplace exposure monitoring is used to confirm on-going effectiveness of control measures. Material storage, labelling and safety data sheets are kept current. Employees are trained to understand the health risks, preventive measures and emergency procedures associated with their work. The workplace maintains adequate records for auditing and demonstrating compliance.
48Health leading performance indicators – 2015 data
Element 3 : Medical emergency managementProvision is made for the management of medical emergencies associated with company operations and activities. There is a medical emergency plan based on competent medical advice and level of risk, and it is in alignment with existing local provisions. The plan is integrated into other emergency procedures, communicated effectively, and practised regularly with drills and reviews as appropriate. A process is in place to ensure that lessons learned are acted upon as a result of drills or incidents. Appropriate response times are established for first aid, emergency medical care and evacuation, and adequate resources have been made available to meet these times. All staff are provided with emergency contact numbers for medical assistance on each work site and during travel.
Element 4: Management of ill-health in the workplaceEmployees have access to occupational health practitioners who can help mitigate the effects of ill-health on their ability to work effectively, including facilitating employee rehabilitation and return to work post-illness or post-injury. A system is in place to provide access to primary, secondary and emergency medical facilities as well as counselling and employee assistance where appropriate.
Element 5 : Fitness for task assessment and health surveillanceEmployees’ health status is compatible with the work that they do, and this is confirmed by assessments when necessary. There is a task checklist for different job categories, and health assessments/surveillance are performed by a competent health practitioner who has knowledge of the work to be performed. Pre-employment, pre-placement and periodic health assessments are conducted as dictated by legal requirements and by the health risks associated with specific tasks. Wherever possible, work is adapted so that individuals are included rather than needlessly excluded from work. Health surveillance is performed where required by legislation or where the work is known to be associated with the development of a recognized health problem for which there is a valid method for testing.
49Appendix C
Element 6: Health impact assessmentHealth impact assessment is generally understood to relate to ‘outside the fence’ activities. HIAs are initiated during the development stage of all new projects and expansions. Baseline data are established on the demography, community health status, air, soil and water quality prior to the start of a new project. Health impact assessors are assigned to work with social and environmental impact assessors in order to outline the range and types of hazard and potential beneficial impacts from the new project/expansion. External stakeholders are defined, and the product/project staff communicate and consult with them on a regular basis. Partnerships are developed with joint ventures, contractors and local government to create a common, cost-effective approach to health management.
Element 7: Health reporting and record managementHealth information on all operations and products meets legal requirements and is accurate, secure and readily available. Records are maintained on raw materials, processes, products, work locations and work duties, as well as monitoring the assessment activities such as health risk assessments, workplace and personal exposure monitoring. Significant health incidents or trends are investigated. Personal health records are retained for a minimum of 40 years after an individual leaves employment. Categories and cases of occupational ill-health are tracked and analysed on a regular basis, and form part of the routine presentation of operating, business and financial metrics to facility management. In turn, these data are aggregated to form part of the annual business planning process.
Element 8: Public health interface and promotion of good healthAn effective interface between public health and occupational health is maintained to mitigate major business risks and identify key sources of epidemiological information. Communications are maintained with local governments and health authorities to plan timely response to major outbreaks of infectious diseases. A programme is in place to identify key employee health issues and develop programmes to educate around prevention/harm reduction. Where appropriate these programmes extend beyond the workforce and into the community; examples might include HIV, tuberculosis, smoking, obesity, heart disease, malaria and vaccination programmes.

50Health leading performance indicators – 2015 data

About IOGPThe International Association of Oil & Gas Producers (IOGP) is the voice of the global upstream industry. Oil and gas continue to provide a significant proportion of the world’s energy to meet growing demands for heat, light and transport.
Our Members produce more than a third of the world’s oil and gas. They operate in all producing regions: the Americas, Africa, Europe, the Middle East, the Caspian, Asia and Australia.
We serve industry regulators as a global partner for improving safety, environmental and social performance. We also act as a uniquely upstream forum in which our Members identify and share knowledge and good practices to achieve improvements in health, safety, the environment, security and social responsibility.
About IPIECAIPIECA is the global oil and gas industry association for environmental and social issues. It develops, shares and promotes good practices and knowledge to help the industry improve its environmental and social performance, and is the industry’s principal channel of communication with the United Nations. Through its member-led working groups and executive leadership, IPIECA brings together the collective expertise of oil and gas companies and associations. Its unique position within the industry enables its members to respond effectively to key environmental and social issues.
Health leading performance indicators – 2015 data includes data provided by both IOGP and IPIECA member companies and organizations, representing both upstream and downstream operators and associated contracting companies.
Participating companies perform a self-assessment of the their performance in relation to standardized statements about the level of implementation of the company’s own health management systems.
Two tools (gap analysis tool and percentage tool) are used to• assess health performance within
individual companies, and• compare performance between
different parts of a company and between participating companies.
Unlike other IOGP data reports, the health indicators are leading indicators. There is no separation between upstream and downstream operations.
www.iogp.orgRegistered OfficeCity Tower40 Basinghall Street 14th FloorLondon EC2V 5DE United Kingdom
T +44 (0)20 3763 9700F +44 (0)20 3763 [email protected]
Brussels OfficeBd du Souverain,1654th FloorB-1160 BrusselsBelgium
T +32 (0)2 566 9150 F +32 (0)2 566 [email protected]
Houston Office10777 Westheimer Road Suite 1100 Houston, Texas 77042 United States
T +1 (713) 470 [email protected]