Embed Size (px)
Citation preview
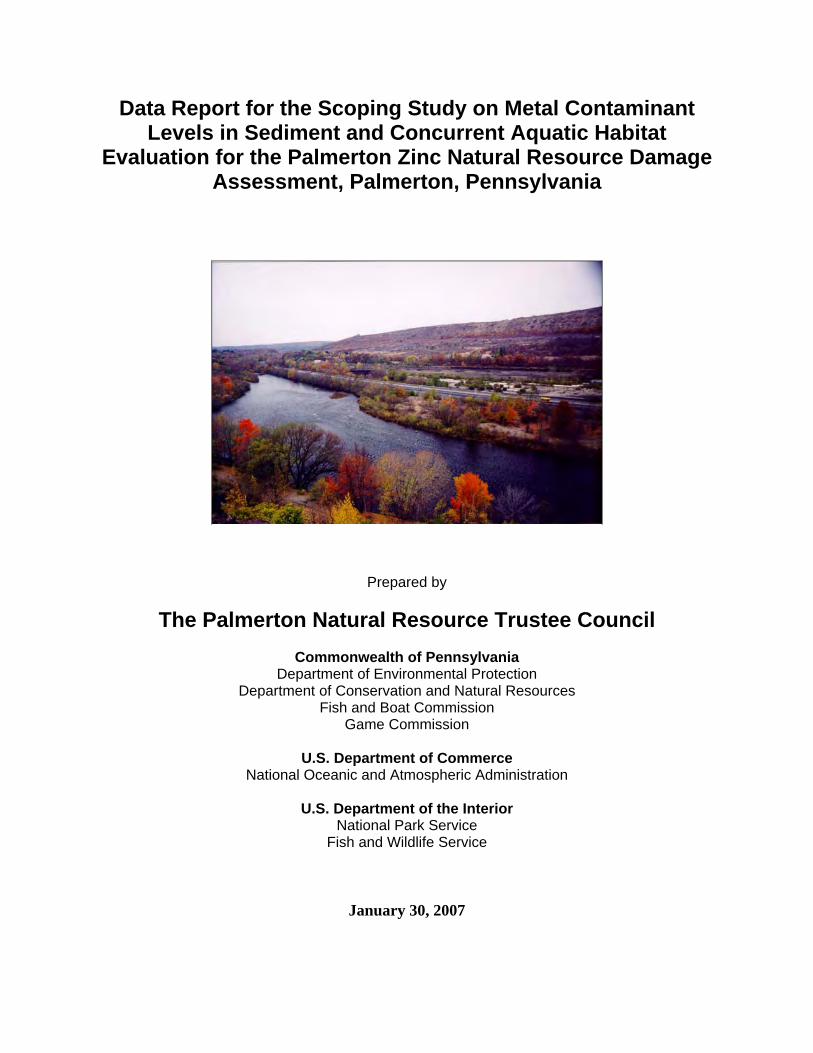
Data Report for the Scoping Study on Metal Contaminant Levels in Sediment and Concurrent Aquatic Habitat
Evaluation for the Palmerton Zinc Natural Resource Damage Assessment, Palmerton, Pennsylvania
Prepared by
The Palmerton Natural Resource Trustee Council
Commonwealth of Pennsylvania Department of Environmental Protection
Department of Conservation and Natural Resources Fish and Boat Commission
Game Commission
U.S. Department of Commerce National Oceanic and Atmospheric Administration
U.S. Department of the Interior
National Park Service Fish and Wildlife Service
January 30, 2007
TABLE OF CONTENTS Introduction................................................................................................................................... 3 Objectives....................................................................................................................................... 1 Methods.......................................................................................................................................... 2
Sediment sampling methods .................................................................................................... 2 Sediment sample analyses ........................................................................................................ 2 Habitat Characterization methods.......................................................................................... 2
Results ............................................................................................................................................ 3
Rapid Bioassessment Protocol habitat evaluation ................................................................. 3 Sediment analysis ...................................................................................................................... 3
Tables and Figures........................................................................................................................ 7 References.................................................................................................................................... 29
FIGURES
Figure 1. Sediment sample and habitat assessment locations..................................................10Figure 2. Lehigh River Rapid Bioassessment Protocol Habitat Scores ..................................12Figure 3. Aquashicola Creek and tributaries RBP habitat scores ..........................................12Figure 4. Lehigh River RBP Substrate Composition ...............................................................13Figure 5. Aquashicola Creek and Tributaries RBP Substrate Composition .........................13Figure 6. Sediment zinc results ...................................................................................................18Figure 7. Sediment cadmium results..........................................................................................19Figure 8. Sediment copper results ..............................................................................................20Figure 9. Sediment lead results...................................................................................................21Figure 10. Sediment arsenic results............................................................................................22Figure 11. Sediment chromium results ......................................................................................23Figure 12. Sediment iron results.................................................................................................24Figure 13. Sediment aluminum results ......................................................................................25 Figure 14. Zinc, cadmium and copper box and whisker plots.................................................26Figure 15. Lead, arsenic and chromium box and whisker plots..............................................27
TABLES
Table 1. Sediment sample locations in the vicinity of the
Palmerton Zinc Pile Superfund Site..............................................................................8Table 2. Lehigh River Rapid Bioassessment Protocol Habitat Scores....................................11Table 3. Aquashicola Creek and tributaries Rapid
Bioassessment Protocol Habitat Scores ......................................................................11Table 4. Sediment sample results from the Lehigh River,
Aquashicola Creek and selected tributaries ...............................................................14Table 5. Predicted relative aquatic toxicity and associated
sediment contaminant levels ........................................................................................16Table 6. Incidence of samples falling within specified
sediment quality guideline (SQG) ranges ...................................................................17Table 7. Incidence of samples falling within specified sediment
quality guideline (SQG) ranges by sample location...................................................17Table 8. Sediment results from duplicate and split samples taken
from the Lehigh River and Aquashicola Creek .........................................................28
Introduction Metals released from the Palmerton Zinc Pile Superfund Site (the Site) have been transported aerially and hydrologically throughout the area's environment, exposing natural resources to these contaminants. Concentrations of metals (e.g., zinc and cadmium) in sediment have the potential to cause injury to biota in aquatic ecosystems such as Aquashicola Creek and the Lehigh River. For example, an independent scientific investigation by Carline and Jobsis (1989) and a Site-related risk assessment conducted by the U. S. Environmental Protection Agency (2001) showed that sediment metal concentrations in the vicinity of the Site were elevated above concentrations typically encountered in Pennsylvania. In 1998, the U. S. Army Corps of Engineers dredged approximately 0.8 miles of lower Aquashicola Creek in Palmerton Borough for flood control. This action disturbed and removed substrate, and the impact on sediment quality had not been reassessed. Evidence of metals concentrations of concern and data gaps near the Site (e.g., limited metals data exist for the Lehigh River) prompted the Palmerton Trustee Council and Blasland, Bouck & Lee, Inc. (BB&L) acting for Viacom, Inc. (now CBS), to jointly execute the Sediment Sampling and Analysis Plan (Palmerton Trustee Council 2004) on October 25, 26 and 27, 2004. This broad scale sediment characterization was designed to determine sediment metals concentrations upstream, adjacent to, within, and downstream of the Site. Post-dredging sediments in lower Aquashicola Creek following 1998 removal were also reevaluated through Plan execution. The Sediment Sampling and Analysis Plan (Palmerton Trustee Council 2004) described the locations and methodology that were used to obtain and analyze sediments in this study.
Objectives Objectives of this sediment scoping study are the same objectives found in the Sampling and Analysis Plan (Palmerton Trustee Council 2004) that was completed to guide the sediment characterization effort. Sampling scope was expanded beyond the U. S. EPA (2001) draft Ecological Risk Assessment to systematically examine the variability of metals concentrations over a relatively broad geographic area. Objectives from the Sampling and Analysis Plan are paraphrased below:
• Characterize sediment metals concentrations in depositional areas in the vicinity of the Site that may affect Trustee resources occurring in the Lehigh River and tributaries in the vicinity of Palmerton, Pennsylvania. A geographic scope expanded beyond the U. S. Environmental Protection Agency (2001) study provided information on background concentrations and addressed some data gaps.
• Analyze sediment on a total dry weight basis for arsenic, cadmium, copper, lead and zinc, which are contaminants associated with the Site. Also analyze for total chromium, iron and aluminum, possible indicators of mining and metal-plating and pigment industry influences that could affect sediment in waters near the Site. The site-related contaminants of concern as well as metals associated with other activities were therefore identified and sampled.
• Measure total organic carbon, grain size, and percent moisture. Correlations between metals concentrations, total organic carbon and grain size may be determined if desired.
• Sample upstream and downstream of significant tributaries and potential sources of contaminant inputs. Sample both sides of the stream as well as the center of the stream when flows may cause different depositional patterns. Standard sampling techniques bracketed potential sources of contamination and showed the distribution of contaminants across the stream width.
• Concurrently characterize aquatic habitat quality in the immediate vicinity of the sediment sampling site. This exercise provided a measure of habitat quality and is
1
especially important if biological community data is to be correlated with sediment metal results.
• Determine latitude and longitude of sampling locations, which allows a georeferenced dataset to be developed.
Methods
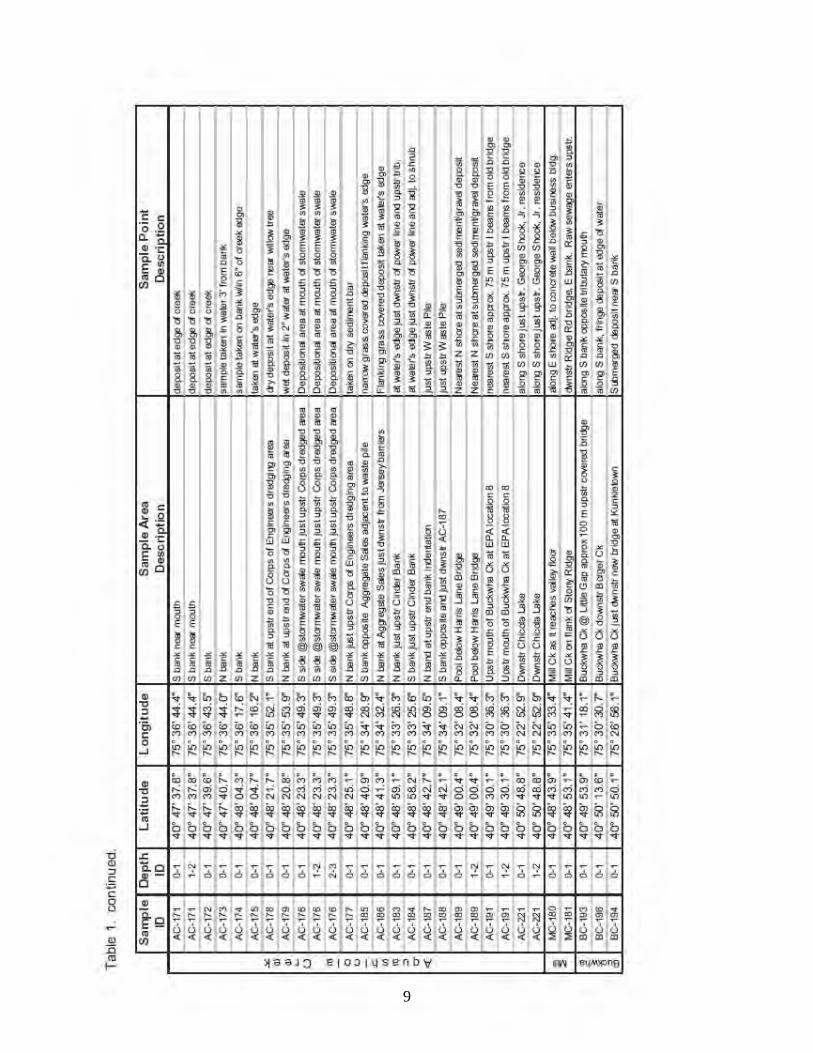
Sediment sampling methods Sediment samples were located upstream, adjacent to, within and downstream of the Palmerton Site in order to ascertain the concentrations of eight metals in stream sediments. Sample location latitude and longitudes were determined using hand-held GPS units and coordinates, and were incorporated into site-related GIS maps. Two teams composed of a combination of Trustee and BB&L representatives performed sampling activities on October 25 – 27, 2004. Sediment sampling depths and standard operating procedures were followed as detailed in the Palmerton Trustee Council (2004) Plan. Samples were taken from the vicinity of Jim Thorpe on the Lehigh River, south to Coplay, which is downstream of the Northampton Dam. Sampling teams worked eastward from the mouth of Aquashicola Creek upstream to Buckwha Creek and points upstream of Little Gap. Figure 1 shows sediment sample and habitat assessment locations and the geographic scope of the sampling effort. Table 1 provides GPS coordinates and sample location descriptions. Two or three inch Lexan® tubes driven to the bottom of fine deposits were used to obtain all samples. Sample cores were segregated into approximate one-foot increments. Multiple depth-specific sample cores were composited in polyethylene bags to obtain sufficient sample quantity and then placed in appropriate glass sample jars. Jars were placed in coolers, iced and shipped to EnChem, Inc. Laboratory in Kimberly, Wisconsin for analysis. Chain-of-custody documentation was performed. Sediments were sampled at locations detailed in Table 1 and Figure 1 and were analyzed for total aluminum, arsenic, cadmium, chromium, copper, iron, lead and zinc. Split samples were taken to represent 10% of the total number of samples, resulting in five samples being sent to Lancaster Laboratories, located in Lancaster, Pennsylvania, for comparative analysis. Four duplicate samples of origin unknown to the laboratory were collected and included in the samples submitted to EnChem. Sediment sample analyses Upon receipt of sediment samples, Enchem and Lancaster Laboratories used preparation method SW-846 3051 for metals. The analytical method for sediment metals was SW-846 6020, also known as Inductively Coupled Plasma – Mass Spectrometry. Lancaster Laboratories used method SW-846 6010B, an Inductively Coupled Plasma technique for aluminum, iron and zinc. Percent moisture was determined using method SM-2540G M by EnChem and using EPA 160.3 modified methodology by Lancaster. Total Organic Carbon was ascertained by EnChem with method SW-846 9060 (combustion, infared spectrometry) and by Lancaster Laboratory with method SM18 5310B (high temperature combustion), modified. Habitat Characterization methods Habitat characterization was performed by the two sampling teams using U. S. EPA Rapid Bioassessment Protocols and forms (Barbour et. al 1999). Sampling teams completed the first assessment jointly to standardize methods, and then worked independently to complete habitat characterization tasks coincident with sediment sampling.
2
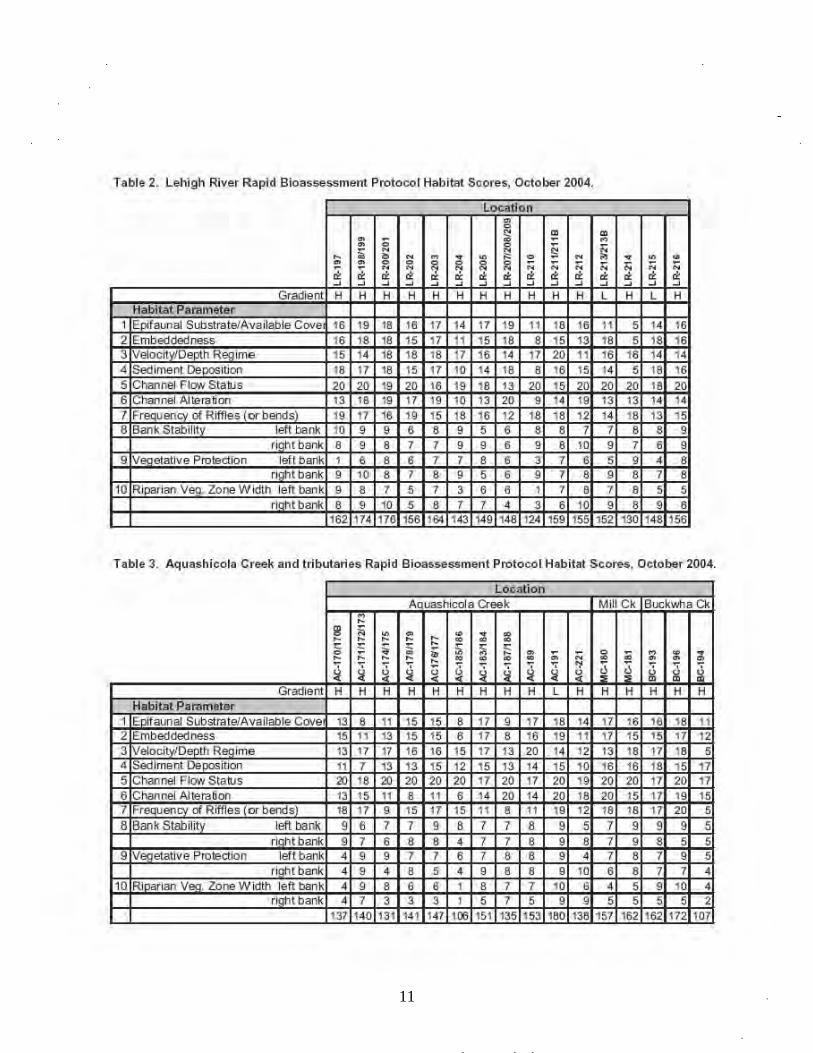
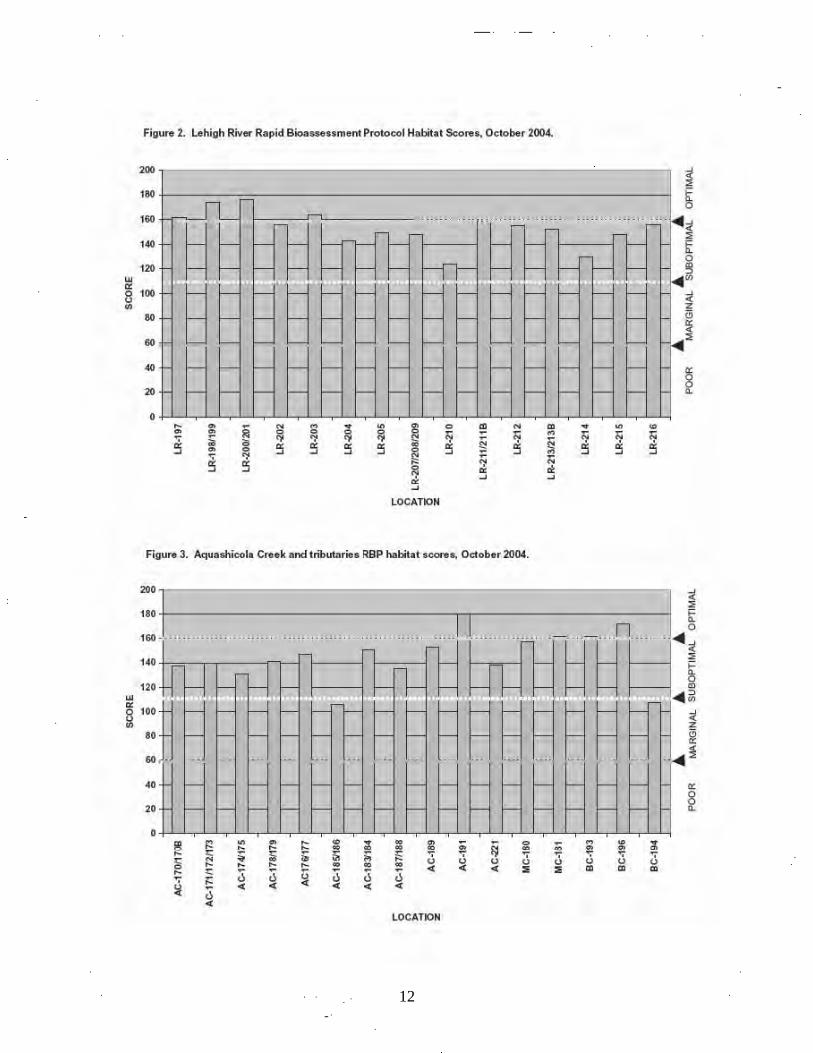
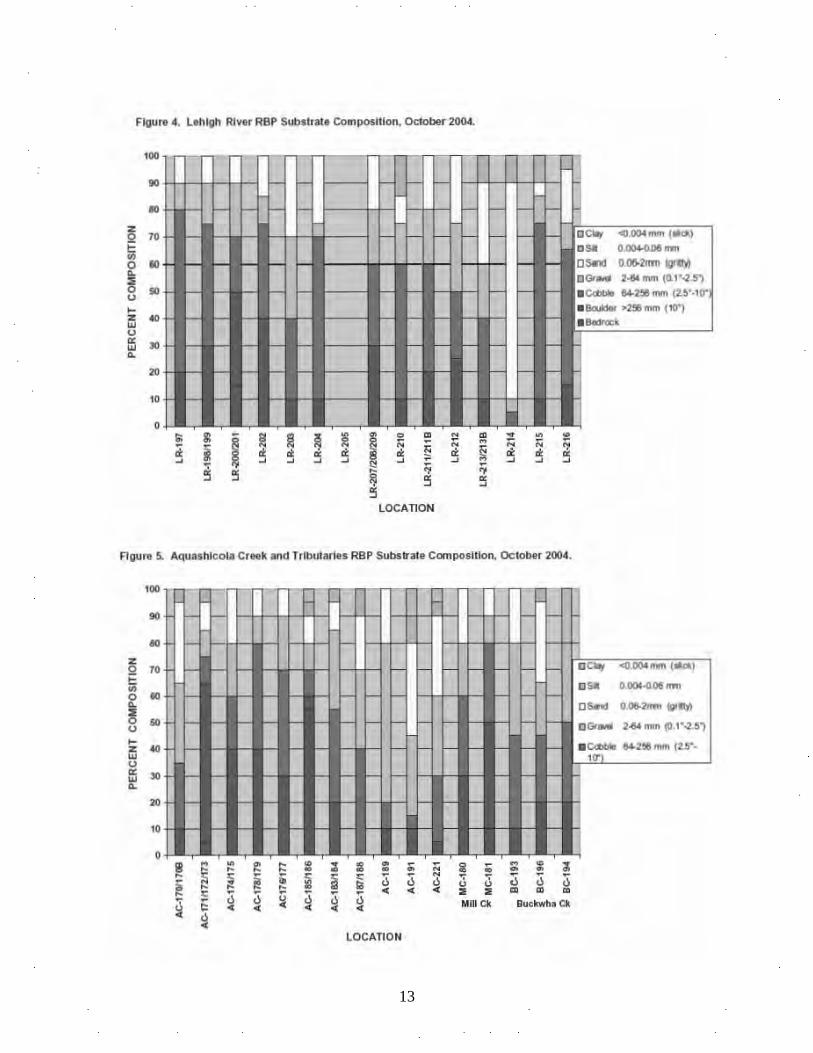
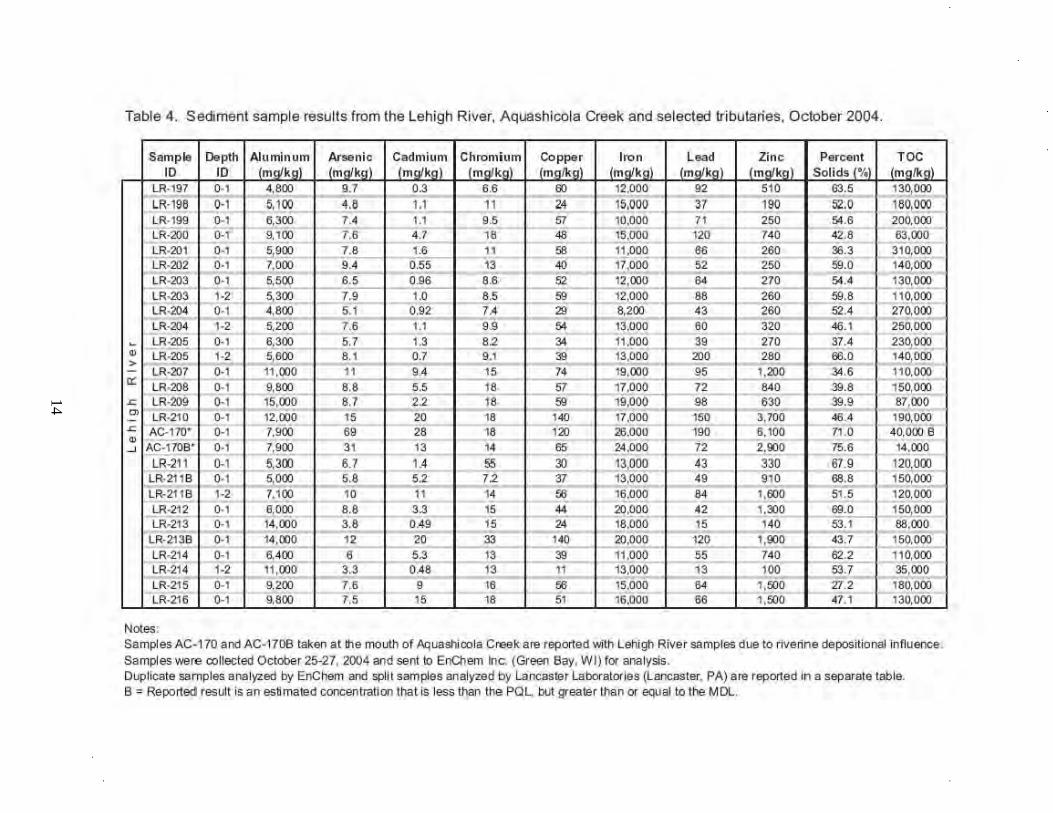
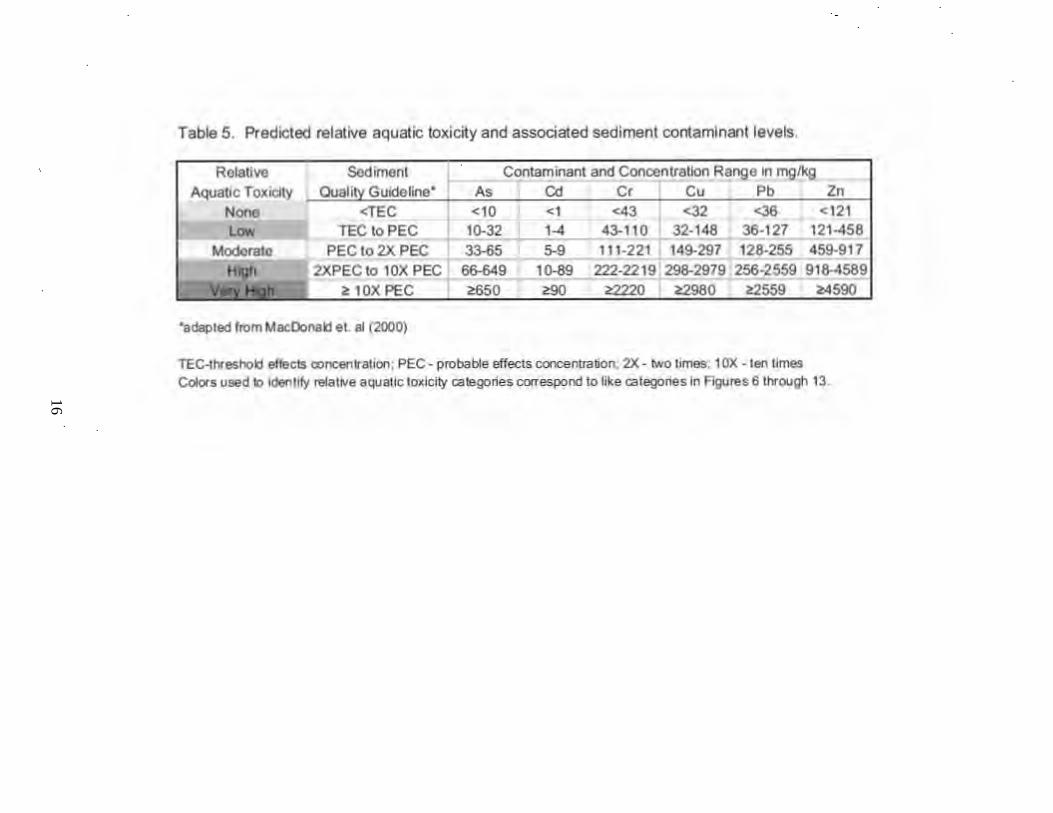
Results Rapid Bioassessment Protocol habitat evaluation Habitat scores are summarized in Table 2 and Figure 2 for the Lehigh River and Table 3 and Figure 3 for Aquashicola Creek, Mill Creek and Buckwha Creek. Habitat scores in the Lehigh River reaches ranged from suboptimal to low optimal (Figure 2), which indicates good habitat. Scores in the Bowmanstown to Palmerton area were slightly lower than up- or downstream, but differences were minimal. Scores in Aquashicola Creek and tributaries were primarily in the suboptimal range (Figure 3), which indicates good habitat. Notable exceptions occurred where marginal scores showed poorer habitat in a disrupted area at AC-185/186 between the Site Cinder Bank and Stoney Ridge Materials Aggregate Sales and BC-194 on Buckwha Creek at a disturbed area downstream of the new bridge at Kunkletown. Particle sizes were visually evaluated as part of the habitat assessment. Particle size distribution in Figures 4 and 5 showed that a combination of gravel and cobble were predominant throughout the stream reaches assessed. Depositional areas dominated by sand, silt and clay fines were relatively uncommon, even though these areas were actively sought as sediment sample locations. Two authors (Sopper 1989 and Oyler 1988) estimated that 12 to 24 inches of contaminated soil have been eroded from Blue Mountain in recent decades. Stony Ridge has also suffered from severe erosion (PA DCNR, et al. 2003). Given the amount of material that has washed off Blue Mountain and Stony Ridge in the vicinity of the Palmerton Zinc Pile Superfund Site, the relatively high and consistent habitat scores, and the relatively large particle sizes (Figures 4 and 5); a strong case can be made that the Lehigh River, Aquashicola Creek and its tributaries are very effective sediment moving systems. This suggests that sampling may be necessary a significant distance downstream to fully characterize impacts from transported sediments. Sediment analysis Results A total of 57 sediment samples, plus 4 duplicates and 5 split samples were analyzed. Complete results of sediment analyses for total aluminum, arsenic, cadmium, chromium, copper, iron, lead and zinc, as well as percent moisture, total organic carbon and grain size performed by EnChem, Inc. are shown in Table 4. Sediment quality guidelines and predicted toxicity The Trustee Council has agreed that presentation of results could be enhanced by providing an indication of relative predicted toxicity of sediments using peer-reviewed literature. One widely used tool provided by MacDonald et al. (2000) was selected for use in this report by the Trustees. MacDonald et al. (2000) used seventeen high quality data sets and previously established sediment quality guidelines (SQGs) to develop two related SQGs described as the Threshold Effects Concentration (TEC) and Probable Effects Concentration (PEC). The TEC is the concentrations below which toxic effects would not be expected and can be used to predict the absence of sediment toxicity. The PEC is the concentration above which toxic effects would be expected and can be used to predict the presence of sediment toxicity. MacDonald et al. (2000) indicated that SQGs function as a tool that could be used to identify contaminant “hotspots”, that the magnitude by which results exceed SQGs can assist reviewers’ evaluation of potential dataset toxicity, and that the predictive ability of the SQGs should increase when multiple contaminants of concern are evaluated together in sediment results analysis. The Palmerton Trustee Council (2004) recognized in their Palmerton Zinc Pile Superfund Site Natural Resource Damage Assessment Plan that biotic community and sediment exposure and effects studies may be conducted to verify toxicity that may be predictively indicated by use of
3
SQGs. The SQGs of MacDonald et al. (2000) were used to provide ranges used to consider Palmerton sediment data. The TEC and PEC values for contaminants of concern expressed as dry weight are shown below. Metal TEC PEC Arsenic 9.79 mg/kg 33.0 mg/kg
Cadmium 0.99 mg/kg 4.98 mg/kg Chromium 43.4 mg/kg 111 mg/kg Copper 31.6 mg/kg 149 mg/kg Lead 35.8 mg/kg 128 mg/kg Zinc 121 mg/kg 459 mg/kg
SQGs for aluminum and iron were not developed by MacDonald et al. (2000). The following concentration ranges, expressed as mg/kg dry weight, were developed using Trustee judgement to break the data into reasonably descriptive categories that subdivided the range of observed data. Low Medium Elevated High Aluminum < 5,000 5,001-10,000 10,001-20,000 not applicable
Iron <10,000 10,001-20,000 20,001-40,000 >40,000 Table 5 translates concentrations to relative toxicity using the predictive toxicity of MacDonald et. al (2000) as its basis. For the purposes of this report, concentrations less than the TEC were indicated in terms of relative toxicity as “none”, TEC to PEC relative toxicity was “low”, and PEC to 2 times PEC was termed “moderate” relative toxicity. Higher results, from 2 to 10 times the PEC, were differentiated as “high” relative toxicity and results more than 10 times the PEC were predicted to be “very high” relative toxicity. Organic carbon Sediment metals results were not normalized based on organic carbon content. The U.S. EPA (2001) Site-related sediment samples showed poor correlation between organic content and metals concentrations. MacDonald, et al. (2000) did not use organic carbon-normalized data in development of their SQGs because empirical evidence showed the predictive value of SQGs was at least as good for non-normalized data. Results summary Some metals results were highly variable; others were not. Zinc exhibited the largest variation with results showing differences of three orders of magnitude (25 mg/kg to 23,000 mg/kg). Zinc also had the highest portion of samples (67%) in the moderate to very high relative toxicity range (exceeding the PEC). Percentages of samples in the moderate to very high predicted sediment toxicity range in declining order were cadmium (53%), lead (30%), copper (21%), arsenic (14%), and chromium (2%). Incidence of sediment samples falling within the defined SQG ranges are found in Table 6 for each metal and in Table 7 for each geographic area. The Trustees have summarized predicted sediment toxicity levels. Table 6 shows the overall incidence of arsenic, cadmium, chromium, copper lead and zinc among three ranges of SQGs throughout the assessment area. Moderate, high and very high toxicity categories from Table 5 were consolidated for this summary since all three categories represent concentrations that exceed the PEC and sediment toxicity would be predicted.
• Incidence of samples with predicted toxicity was notably higher for zinc (67%) and cadmium (53%).
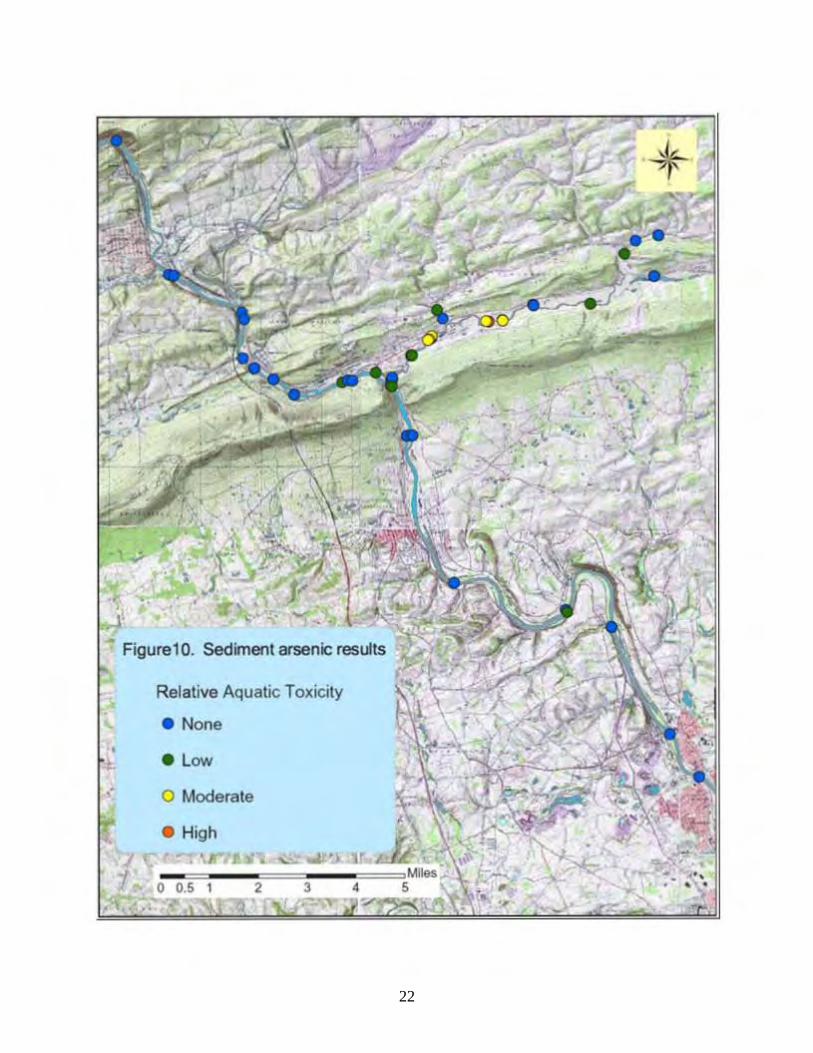
• Other metals in decreasing incidence of toxicity were lead (30%), copper (21%), arsenic (14%) and chromium (2%).
4
The same three ranges of predicted toxicity were used to individually examine the four streams that were sampled. Table 7 combined all metals within the Lehigh River, Aquashicola Creek and two tributaries, Mill Creek and Buckwha Creek, and summarizes the number of samples in the same three predicted toxicity categories used in Table 6.
• Aquashicola Creek and Mill Creek, had the highest incidence of samples with predicted toxicity at 48% and 50%, respectively.
• Buckwha Creek, upstream from the Palmerton Zinc Pile Site, produced sediment samples with the lowest predicted toxicity. No toxicity was predicted in 61% of samples.
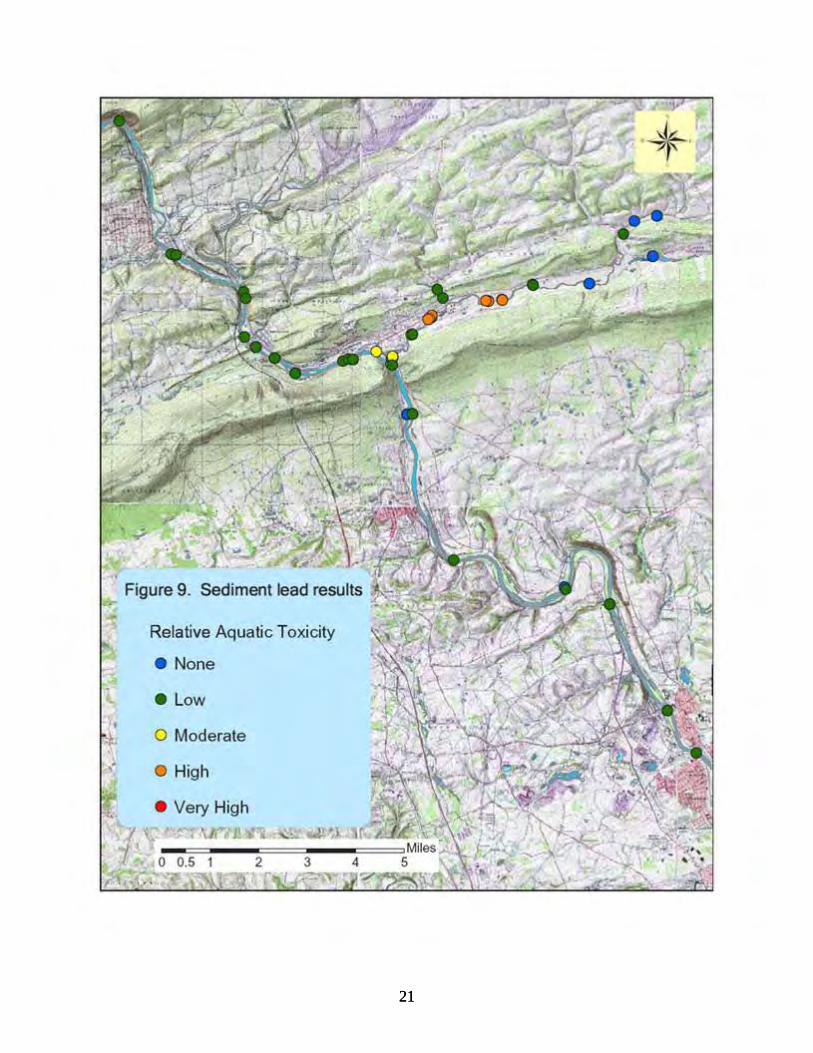
• Lehigh River results showed 18% of metals samples with moderate or higher predicted toxicity. Most of these samples were located downstream of the defunct West Smelting Plant at Palmerton (Tables 1 and 4).
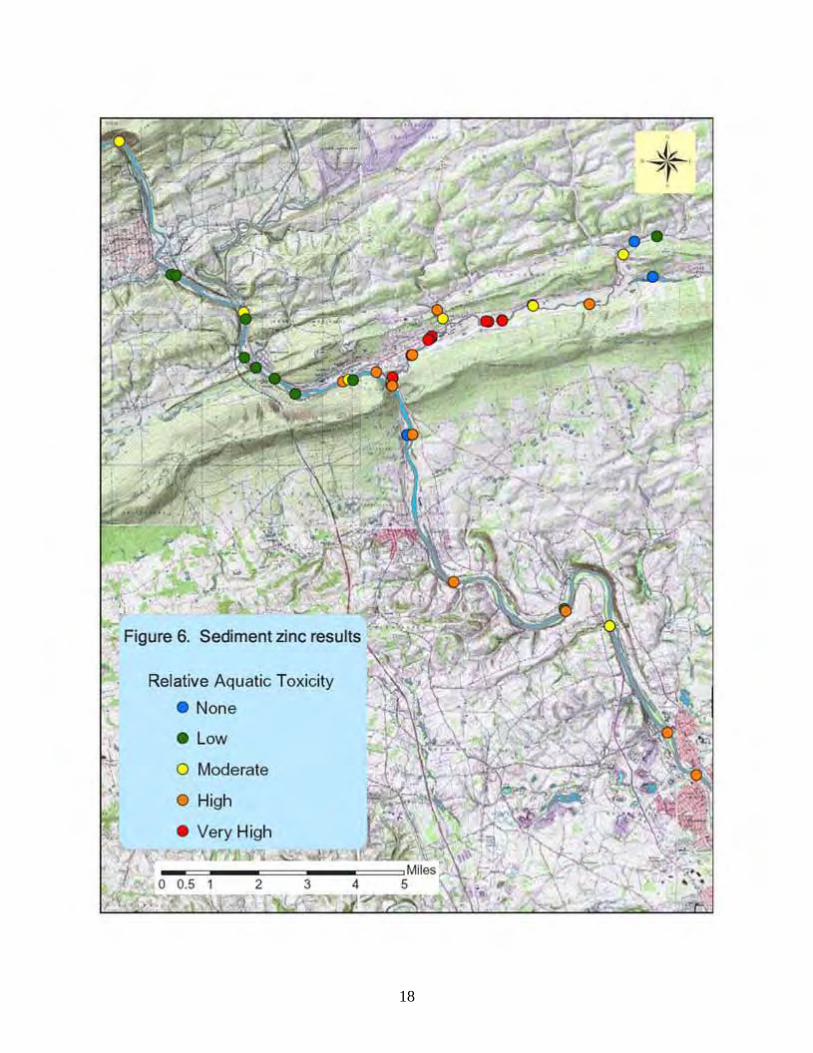
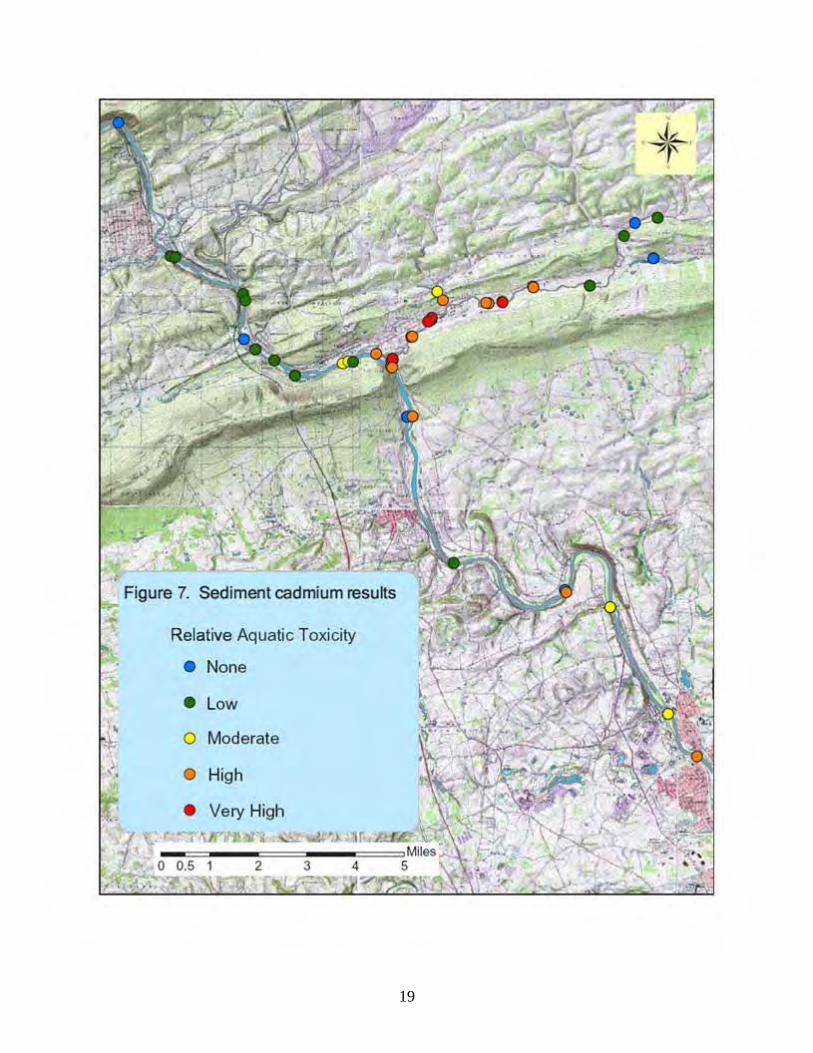
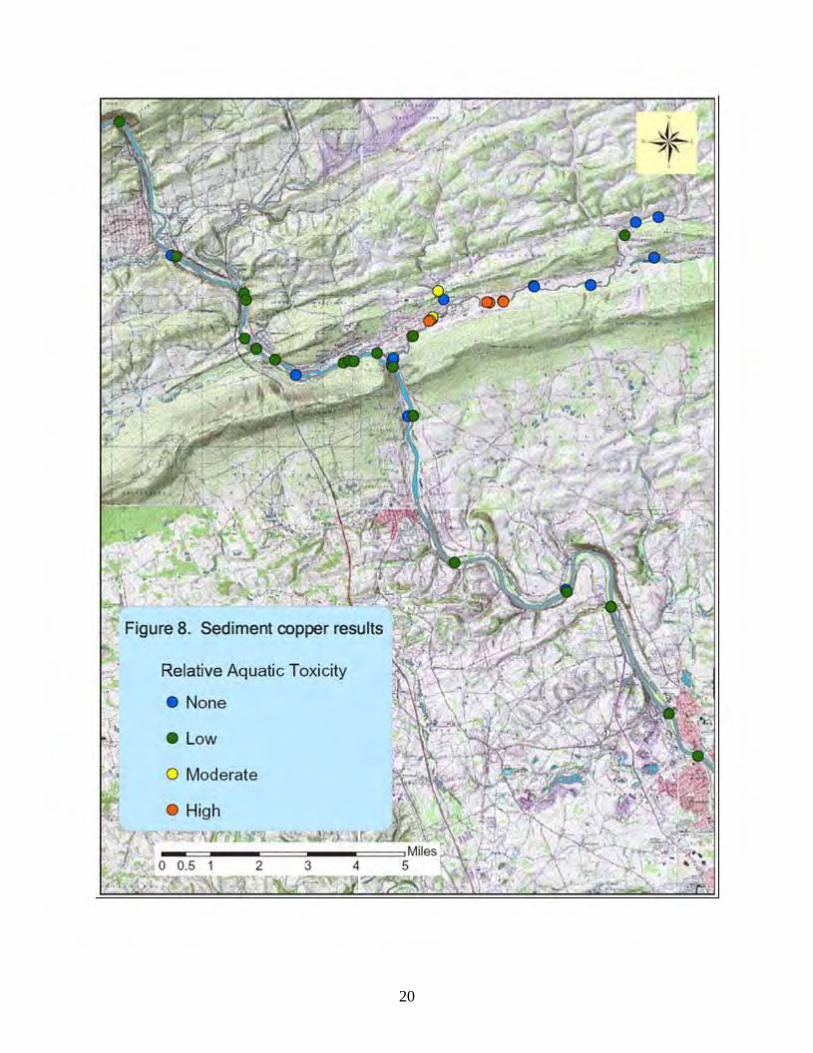
Predicted toxicity and geographic distribution Maps showing sediment sample locations and relative toxicity are informative in showing where higher probability of toxicity exists. Figures 6 through 13 are GIS maps that illustrate zinc, cadmium, copper, lead, arsenic, chromium, iron, and aluminum results respectively using the predictive toxicity ranges established in Table 5. Collective results from the mapping exercise indicate the following key points:
• One locale stood out as the focal area of elevated Site-related metals concentrations in stream sediments. High to very high relative sediment toxicity, particularly with zinc (Figure 6) and cadmium (Figure 7), were shown by study samples (samples AC-185 &186 and AC-171 through AC-179) in Aquashicola Creek from the upstream end of the Cinder Bank to the creek mouth.
• Moderate to high predicted zinc and cadmium toxicity (Figures 6 and 7 respectively) were found downstream of the focal area delineated above. The area of moderate to high relative zinc and cadmium toxicity extended upstream in Aquashicola Creek to Little Gap near the confluence of Buckwha and Aquashicola Creeks and downstream in the Lehigh River from the West Plant (at the SW edge of Palmerton) downstream to Coplay where sampling was terminated.
• Zinc and cadmium results (Table 4 and Figures 6 and 7) were higher along the east bank of the Lehigh River adjacent to Palmerton (locations LR-208 and LR-209) than a corresponding location on the opposite bank (LR-210).
• Notable occurrences of zinc samples of moderate toxicity were found upstream of Palmerton at LR-197 near Jim Thorpe and LR-200 below the mouth of Pohopoco Creek.
• Iron and aluminum displayed concentrations termed “medium” through the preponderance of the geographic area covered by this report. Elevated to high concentrations, however, were common in lower Aquashicola Creek, Mill Creek and the Lehigh River in the vicinity of Palmerton and location in Buckwha Creek nearest to the mouth. The focal area identified under the first bullet item for Site-related metals showed a high degree of overlap with higher iron and aluminum concentrations.
The U. S. EPA (2001) sediment results from 1997 for similar locations on Aquashicola Creek were comparable to results of this study. The same focal area of greatly elevated metals was delineated from the upstream limit of the Cinder Bank downstream to the mouth. The Corps of Engineers 1998 Aquashicola Creek dredging project, which occurred between the two sampling efforts, did not appear to reduce later sediment metals concentrations. Limited Lehigh River sediment sample results from 1997 (U. S. EPA 2001) mirrored 2004 sample results. Zinc and cadmium in particular were elevated at and downstream of the West Smelter location. It is notable that at sample locations near Cementon, 1997 zinc (1,500 mg/kg) and cadmium (11 mg/kg) results (U. S. EPA 2001) were nearly identical to 2004 zinc (1,500 mg/kg at LR-215) and
5
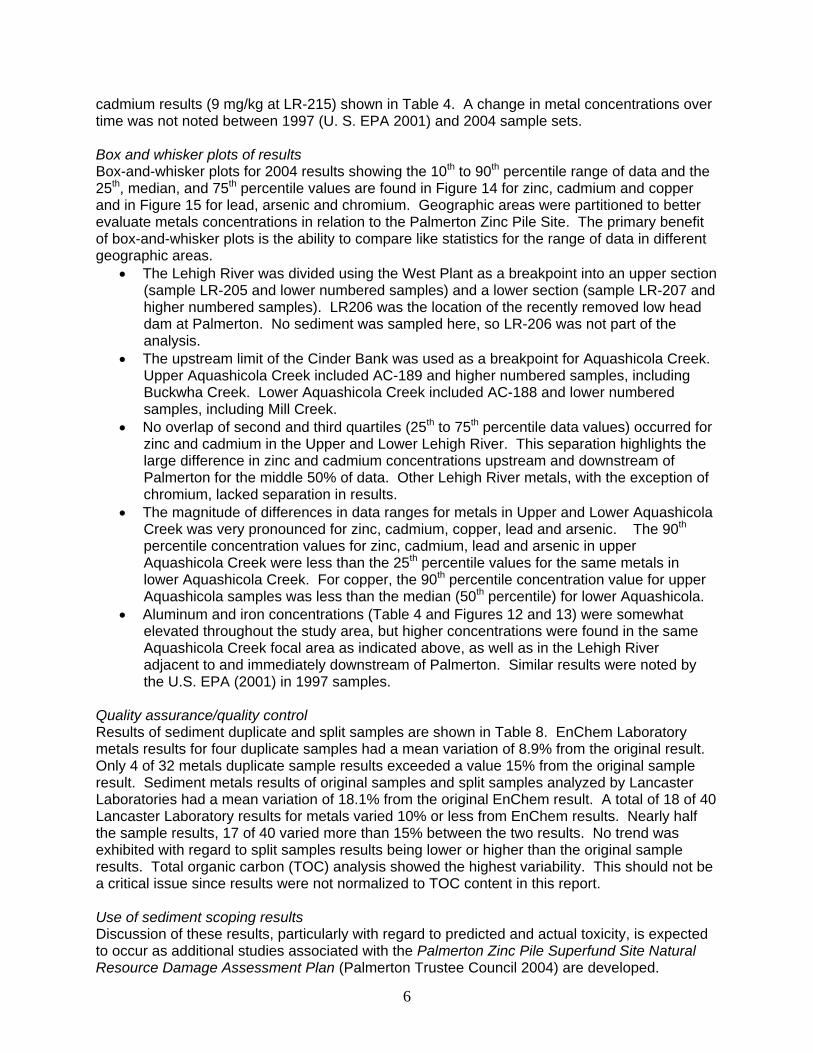
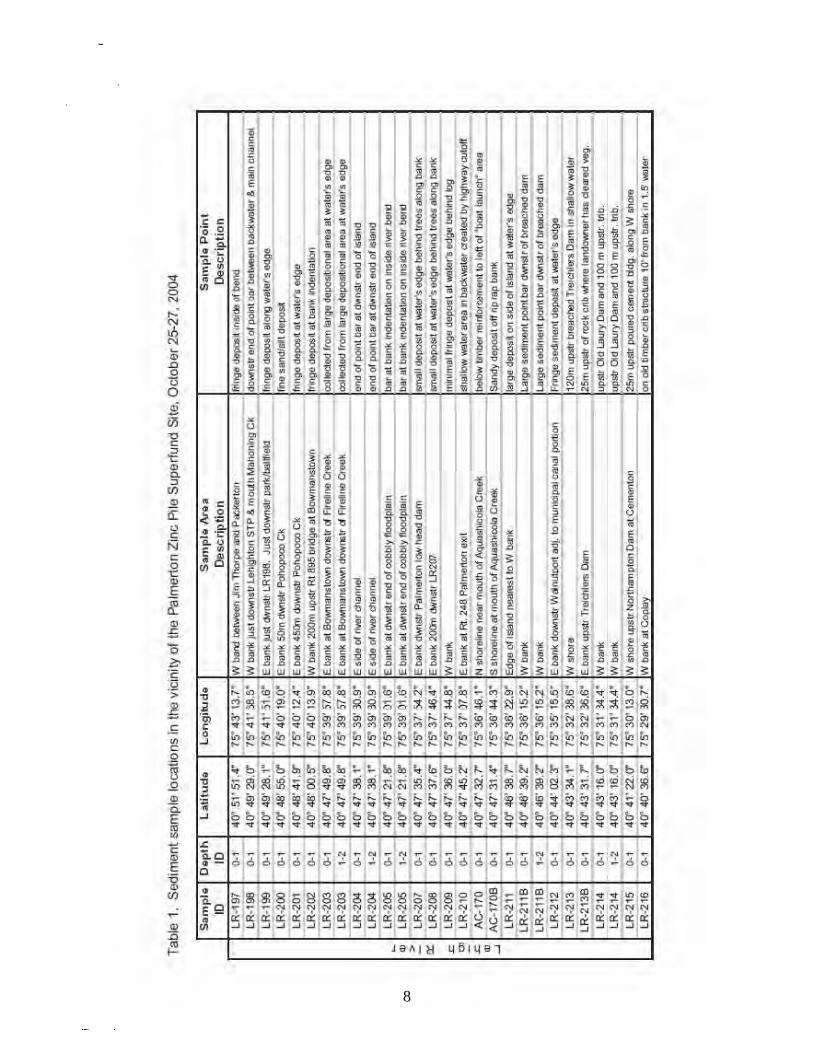
cadmium results (9 mg/kg at LR-215) shown in Table 4. A change in metal concentrations over time was not noted between 1997 (U. S. EPA 2001) and 2004 sample sets. Box and whisker plots of results Box-and-whisker plots for 2004 results showing the 10th to 90th percentile range of data and the 25th, median, and 75th percentile values are found in Figure 14 for zinc, cadmium and copper and in Figure 15 for lead, arsenic and chromium. Geographic areas were partitioned to better evaluate metals concentrations in relation to the Palmerton Zinc Pile Site. The primary benefit of box-and-whisker plots is the ability to compare like statistics for the range of data in different geographic areas.
• The Lehigh River was divided using the West Plant as a breakpoint into an upper section (sample LR-205 and lower numbered samples) and a lower section (sample LR-207 and higher numbered samples). LR206 was the location of the recently removed low head dam at Palmerton. No sediment was sampled here, so LR-206 was not part of the analysis.
• The upstream limit of the Cinder Bank was used as a breakpoint for Aquashicola Creek. Upper Aquashicola Creek included AC-189 and higher numbered samples, including Buckwha Creek. Lower Aquashicola Creek included AC-188 and lower numbered samples, including Mill Creek.
• No overlap of second and third quartiles (25th to 75th percentile data values) occurred for zinc and cadmium in the Upper and Lower Lehigh River. This separation highlights the large difference in zinc and cadmium concentrations upstream and downstream of Palmerton for the middle 50% of data. Other Lehigh River metals, with the exception of chromium, lacked separation in results.
• The magnitude of differences in data ranges for metals in Upper and Lower Aquashicola Creek was very pronounced for zinc, cadmium, copper, lead and arsenic. The 90th percentile concentration values for zinc, cadmium, lead and arsenic in upper Aquashicola Creek were less than the 25th percentile values for the same metals in lower Aquashicola Creek. For copper, the 90th percentile concentration value for upper Aquashicola samples was less than the median (50th percentile) for lower Aquashicola.
• Aluminum and iron concentrations (Table 4 and Figures 12 and 13) were somewhat elevated throughout the study area, but higher concentrations were found in the same Aquashicola Creek focal area as indicated above, as well as in the Lehigh River adjacent to and immediately downstream of Palmerton. Similar results were noted by the U.S. EPA (2001) in 1997 samples.
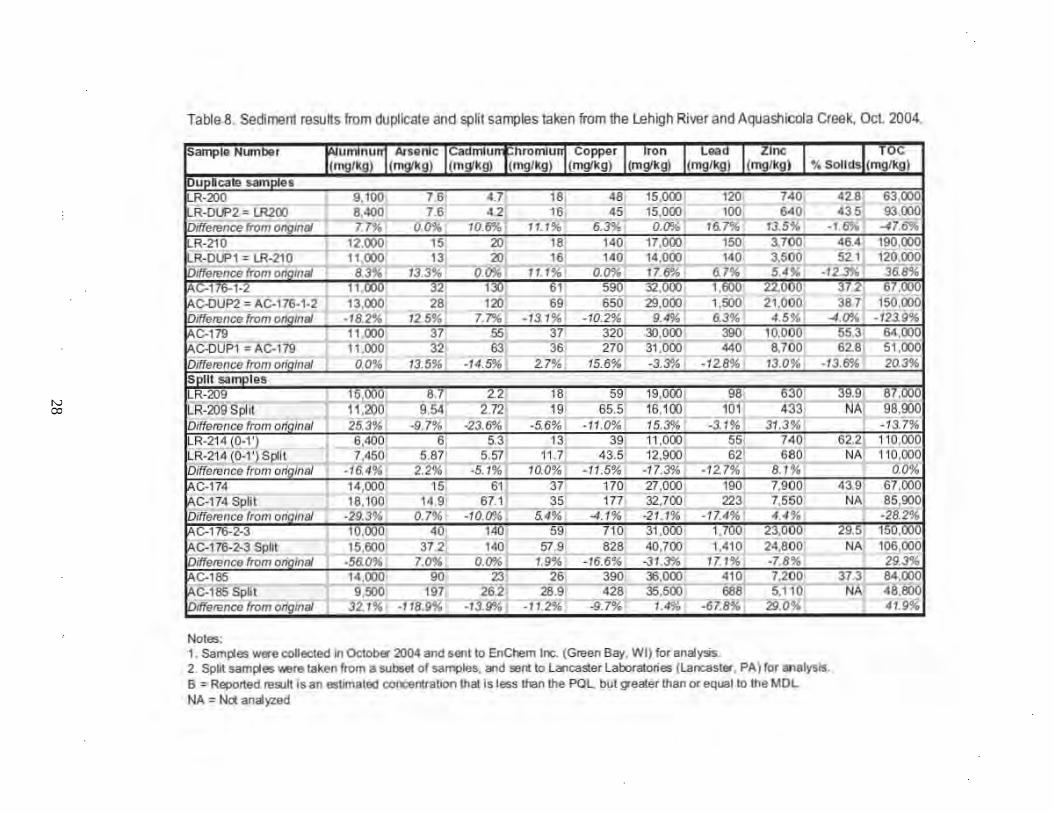
Quality assurance/quality control Results of sediment duplicate and split samples are shown in Table 8. EnChem Laboratory metals results for four duplicate samples had a mean variation of 8.9% from the original result. Only 4 of 32 metals duplicate sample results exceeded a value 15% from the original sample result. Sediment metals results of original samples and split samples analyzed by Lancaster Laboratories had a mean variation of 18.1% from the original EnChem result. A total of 18 of 40 Lancaster Laboratory results for metals varied 10% or less from EnChem results. Nearly half the sample results, 17 of 40 varied more than 15% between the two results. No trend was exhibited with regard to split samples results being lower or higher than the original sample results. Total organic carbon (TOC) analysis showed the highest variability. This should not be a critical issue since results were not normalized to TOC content in this report. Use of sediment scoping results Discussion of these results, particularly with regard to predicted and actual toxicity, is expected to occur as additional studies associated with the Palmerton Zinc Pile Superfund Site Natural Resource Damage Assessment Plan (Palmerton Trustee Council 2004) are developed.
6

Tables and Figures
7
8
!! I !! II .. •
! !
I' < • ! 1 1 I HI
~b~~~~~~bb~bb~~~~~hh~~bb
~~~8~~~~NN~~~~~~~~~a~~~~
~~~~~~~~~~~~~~~~~~~ i ~~~~ ~~~~~~~~~~~~~~~~~~~~~~~~
, , , , - , • • • • • • • • • • • • • • • • • • .~ $8185a88<S<S88f58S~ - " " ':t':t - -• ';"<:' <:'<:' <:'<:' <:'<:' <:'<:' <:'<:' <:'<:' , , , <:'<:' .. .. .. .. .. .. .. • • • .. ~ ~~ ~~ ~~ ~~ ~~ ~~ ~~ ~ ~ ~ ~~
•
9
I I I '
I
f !
HI •••
III ... III ... iii
! II
I I
! 1
.~bb ~ ~~hhhb~.hb~~ •• hh~ ~~~ ~.~~ ••• ~~~~~~~~~~~~ ~~~~~~~~~~~~~~~~~~~~~~ ~~~~~~~~~~~~~~~~~~~~~~
;: ~ :2 ~ ~ ~ ~ ~ ~ ~ ~ :(j $ :;J ~ ~ ~ ~ ~ ;;; ;;; ;:; - - - - - - - - - - - - - - - - - - - - - " .~~~~~~~~~~~~~~~~~~~~~~
10
•
. -~. T •
11
Table 2. Le high Rive r Rapid Bioassessme nt Protocol Habitat Scores. October 2004.
::;:::;::::;::::;::::;:::::;::
Table 3. Aquashicola Creek and tributari as Rapid Bioassessme nt Protocol Habitat Scores. October 2004.
12
Fig ... 2. Lehigh Rjy .. Rapid BioII ..... m.nt Protocol Habit., 50:0 .... Oetoba, 201U.
~
,. ,. - . .. . ,. - r- - r- r-,.
• :- r- :- r- r- r- r-8 100
• • •
~ r- ~ r- r- r- 8 r- r-- r- - r- r- r- r- r-- r- - r- r- r- r- r-
• - r- - r- r- r- r- r-• - r- - r- r- r- r- r-• ,
• " , • , ~ " • •
I 0 • " • • , 0 • , " , " ,
• " ~ i • 0 , , , , , , , " " , , , • • • " "
" lOCATION
Fig ... 3. Aquaohicol. C, .. k ard lributa, • • RBP habit., .co,u , Odobe,2ON.
- - ..
,. r-,. • ~ 100 ..
• ~ H H~ r- r- r-r- r- r-
• r- r- r- r-r- r- r- r-
• • , • • ~ • ! • • ~
, • • " , , • • ~ , 0 , , , " , " , " 0 0 0 , ~
, , • ! • , 0 j j j < < • • • , , , j < <
lOCATION
8 • • , , , ,
r-
r-r-
• , • " , 0 • •
....
...
...
.
i i
I I
...
. ... I
13
,w
• •
~ N e • 0 • • ~ • 0
• • • • u • » • •
» .. • • • I i ! , ! I
0 • , • " • • , " " " , " • i • • • • • , • • • • • • • • • • • • • • • ! , ij
, , , , , LOCATION
AIJU'" 5. """u lllcoia C'Hk.oo T,lbutarle. RBP Subs .. ,t. Compolillon, October ZOO4.
,w
• •
~ N e • 0 • • ~ • 0
• • • • u • » • • • .. •
! • • • ! , , • • , ,
! •
~ • , i i < , , "
i • ~ 1 j
, , , < < , , , < < < < ;
Buc:l<wh. 0.
LOCATION
a~ ... .ooo ... (~ o.-.oDII ... O.IJtI.2nm ".."
aa._ 2-11<_ (0.1·.,2.5,
. c- .... ;z,e .... (15· .. '
. _ .:z,e mm (10")
."" <U._ ... l"""'l
,M 0.00 . .. (1.1,. ... .- o.oe.2nm ".." .. -2.&1 mm (0.,·.,2.5, .- i\4-;z,e """ (15·· ,.
14
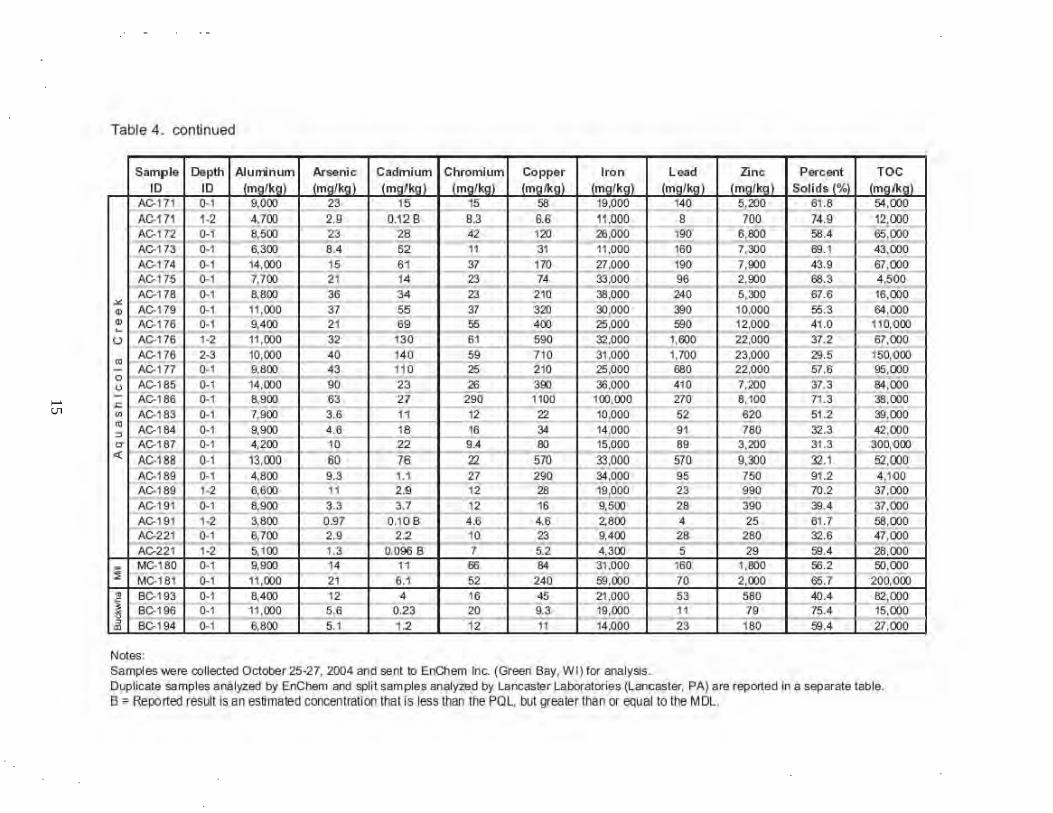
Table 4. Sediment sample resu lts from the Lehigh River, Aquashicola Creek and selected tributaries, October 2004.
Arsenic I Cadmium
LR·l99 ., ~}OO , .• U " • ""'" " "" "' LR·2()() ., 9:.1.00 " .. , " " 1W;lo "" "" ~ ,
LR·2()l ., ; JOO " " " ~ 1!.900 " "" ~,
LR·2()2 ., '.000 , .• 0.55- " .,
" "'" " "" ~" LR·2()3 ., ;_500 " "" " • 12_.5QO " "" ". LR·2()3 ,., ;}oo " '" " ~ 12_.900 " "" ~, 110:.9'Xl LR·2()4 ., '.'" " 0.92 , .• ~ '.m " "" •• 270.()(() LR·2()4 ,., ; _200 " U " " 1~.900
., "" ." 250:.9'Xl ., <'00 " U " " 1!.900 " "" ". 23(l:.9'Xl ,., 5."600 " '" " ~ ""'" "'" "" .. " 1~0.()(() .,
~.5QO " , .• " " 19:.5QO " __ 1._2()() "' 110:.9'Xl ., '.'" " " " • 1~.9OO " "" ~, ., lS-;-COO " " " ~ 19.000 " "" ~, ., 12,5QO " '" " ,.,
1l.900 "" ~.190 .,. ~ I AC-I70'
., '.000 " " " '''' " .m "" 6.100 71.0 --' AC-I 700' ., __ 1.JOO " " "
.. -- li.9OO " 2_ . .!OO 75--:-6 LR·ll1 .,
~300 " " ~ ~ 1~.9OO " "" ~,
LR·ll1B ., '.m 5--:-6 ,., "
, 13.000 " "" ." LR·ll1B ,., __ 1.1.00 " " " ~ 1!!..900 " __ 1.~ 51.5 LR·112 .,
~9'Xl " " " " "'.m " , .m .. " LR·113 ., l~ .COO " 0.~9 ,,--
" LR·ll :)8 ., ~.5QO " '" "
,., LR·ll~
., !!..~oo ,
" " ~ LR·ll~ ,., II.COO " 0.~6 "
Noles : Samples AC- l 70 and AC-17OB taken al tie m(HJlh 01 Aq""sn;oo la C reek a", repo1ed "";Ih LOOi~ RNer samples doo 10 rNenne depos il""',. influence. Samples ...... re oo llocloo Ocl<ber 25-27. 2004...,d sent tJ EnOlem n c. (Qeoo Bay. WI) lor ana lysis. Dl4J licaie samples a"" l)/Zoo by EnChem and ~i l samples ...,,.yzed by Larocaslllr Labor-at","ies (Lancasl .... PAl a", repo1ed in a sep,..-ate tab l ... B : Repo~oo resujl fs an es~ mallld coocenlrffiion thai fs less than 100 POL. but gealll r than or oqu,. 10 the M DL.
15
Table 4. continued
" " ~ '" ,. " " " " " " 'ro I!...9'JO '" , .m '" " " " " ".""" "
--2.000 ."
" " " '" 3I!.,9(lO '" ~.JXl 67.6 AC-179 ., 11.000 " " "
,,, :xl..:.OOO ,., 1!?,9(lO ~,
AC-176 " -----s.-4"00 " " ~--
"" ""'" "" 12.000 ~1 .0
AC-176 ,., -2!.SQO " "" " '" 32_.9'JO __ 1.~ 22_.9'JO '" AC-176 ,., 1!?.SQO ." "" " '" 31.000 '.roo 2~.9'JO '" AC-l n " '.'" " '''' ,,--'" 25-;-000 - .., 22 .000 .,
AC-165 " 1~ .000 ., " "
,., ~,9(lO .'" '.m ,,'
AC-I86 " -s.9oxl " " "" "., 100.000 m 6 .-100 71.3 AC-1S3 " __ 7.JOO " " " " 1!?.9'JO " '" 51 .2 AC-I8-4 " 9:.JOO .,
" " " 1~ .OOO " '" "' AC-1S7 " '.'" '" " , .. ., 15.000 " '.m 31_3
AC-I 88 " l.},SQO '" " " ,ro 3:!900 ., 9:.}:lO "' AC-189 " '.'" " " " "" ~,9(lO " '" '" AC-189 ,., 6 .600 " " " " 19.000 " ,., ro'
AC-191 " ; JOO " " " " 9:._500 " ,., ~.
AC-191 ,., ,.,., 0_97 0.108 " ., ,,., • "
Noles : Sampjes "."e oo llected Ocl<be r 25-27. 2004 and sent tJ EnOlem i'lc. (Green Bay . W I) lor ana lysis. D'4J lkate sa"'9 les a"" l)/Zed by EnChem and ~i l samples anayzed by Laocasle r Labocalories (Laocast .... PAl are repo1ed in a sep,..-ate tab le . B ~ Re~ ~ed res!.il ~ an esti maled COI'lCffilralioo thai is less than the POL. but !Tealer than or eq.Ja 10 the M ct. .
16
Table 5. Predicted relalive aqualk: loxicity and associaled sedimenl contaminanllevels.
ReIa~Y8
Aqua~e Toxicity N~
"'" Tee to PEe
"adapted from Mac())I\II!t!.t." (2000)
10-32 33-S5
' 4 ~9
43-110 32-148 36-127 121-458 111-221 149-297 128-255 459-917
298-2979 256-2559 918-458S
TEC-Il'ifesoo!t! elf9clI oorcenlraticn. PEC • probable effects concllrira'ion; 2X - two !;n.s; lOX - ten !In.s Color. used ~ Ideo!;~ rela! .... aquatic loxicily <::alllgories correspond to ~kll categories in Fq.If1t16 tl'ifcu~ 13.
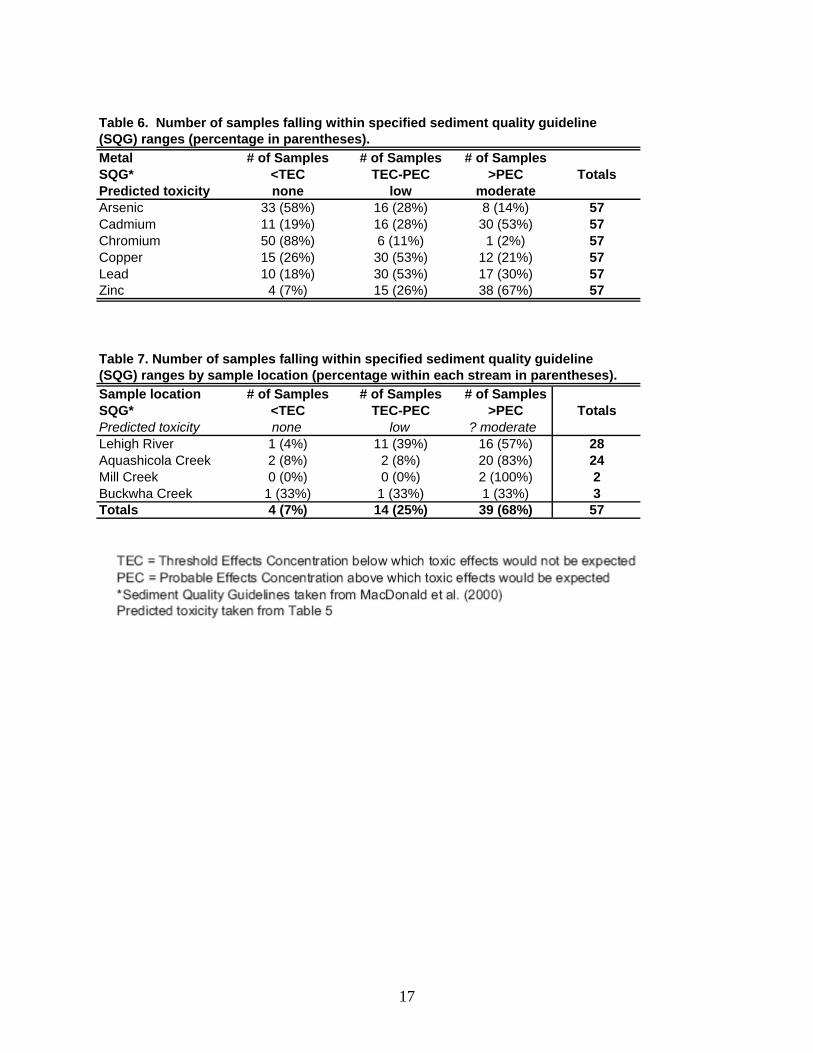
Table 6. Number of samples falling within specified sediment quality guideline(SQG) ranges (percentage in parentheses).Metal # of Samples # of Samples # of SamplesSQG* <TEC TEC-PEC >PEC TotalsPredicted toxicity none low moderateArsenic 33 (58%) 16 (28%) 8 (14%) 57Cadmium 11 (19%) 16 (28%) 30 (53%) 57Chromium 50 (88%) 6 (11%) 1 (2%) 57Copper 15 (26%) 30 (53%) 12 (21%) 57Lead 10 (18%) 30 (53%) 17 (30%) 57Zinc 4 (7%) 15 (26%) 38 (67%) 57
Table 7. Number of samples falling within specified sediment quality guideline(SQG) ranges by sample location (percentage within each stream in parentheses).Sample location # of Samples # of Samples # of SamplesSQG* <TEC TEC-PEC >PEC TotalsPredicted toxicity none low ? moderate Lehigh River 1 (4%) 11 (39%) 16 (57%) 28Aquashicola Creek 2 (8%) 2 (8%) 20 (83%) 24Mill Creek 0 (0%) 0 (0%) 2 (100%) 2Buckwha Creek 1 (33%) 1 (33%) 1 (33%) 3Totals 4 (7%) 14 (25%) 39 (68%) 57
17
18
Figure 6. Sediment zinc results
Relative Aquatic Tox.ici ty
• None
.L~
o Moderate
• High
• Very High
19
Sediment cadmium resuHs
Relative Aquatic Toxicity
• None
• Low
o Moderate
• High
• Very High ,..,
20
Sediment copper results
Relative Aquatic Toxicity
• None
• Low
o Moderate
21 21
, Figure 9. Sediment lead results
Relative Aquatic Toxicity
• None
• Low
a Modera te
• High
• Very High
22
" , -
• FigurelQ. Sediment arsenic results
Relative Aquatic Toxicity
• Non.
o Moderate
• High
23
"
Figure 11 . Sediment Chromium results
Relative Aquatic TOKicity
. N~
• Low
o Moderate
• High
24
•
~
Figure 12. Sediment iron results
Relative Levels
• Low
• Medium
o Elevated
• High
25
Figure 13. Sediment aluminum results '
Relative Levels
• Low
• Medium
o Elevated
., . .-:, ;., ,
' . .;f .
J
" Aluminum used as possible indicator of upstream mining or other off-site impacts
, to water quality. Aquatic to){icity not evaluated so displayed as relative levels.
-" ~ ,::!~~ ,,,.~ .~
. .
Figure 14. Zinc, cadmium and copper box and whisker plots showing the median, 2nd and 3rd quartile values, as well as a range encompassing the 10th to 90th percentiles and outliers (●) for data location subsets. PEC = probable effects concentration above which toxic effects would be expected.
26
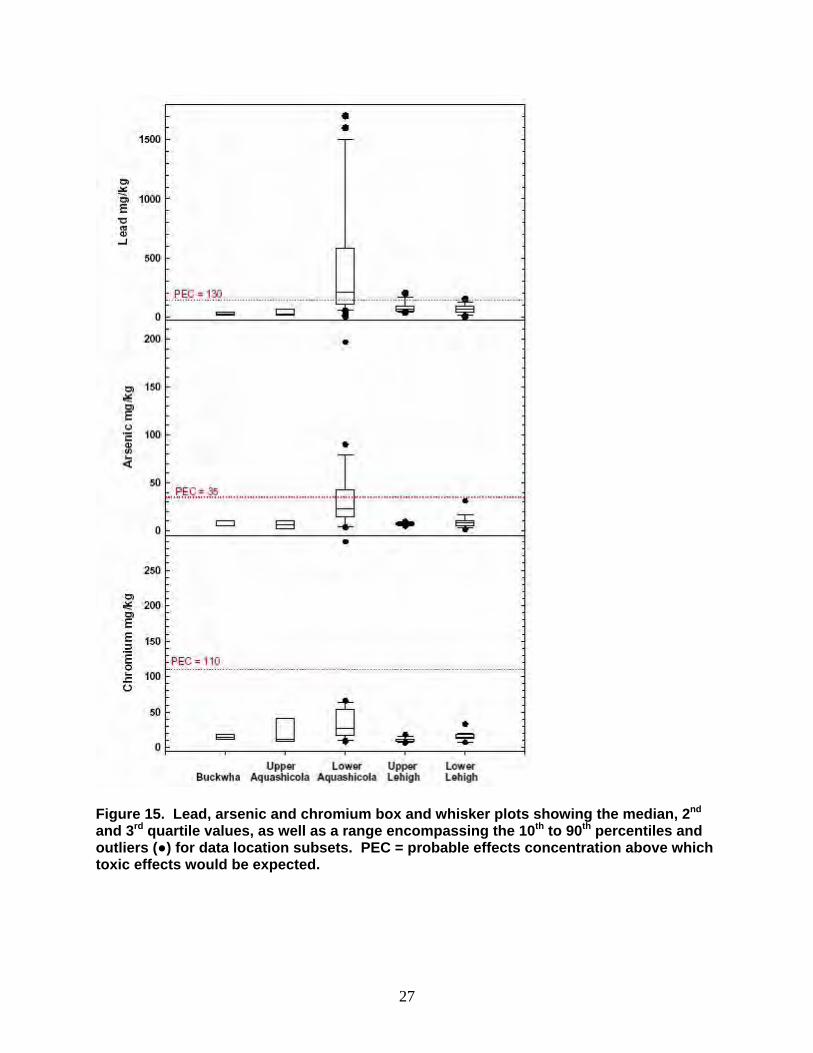
Figure 15. Lead, arsenic and chromium box and whisker plots showing the median, 2nd and 3rd quartile values, as well as a range encompassing the 10th to 90th percentiles and outliers (●) for data location subsets. PEC = probable effects concentration above which toxic effects would be expected.
27
28
Table 8. Sediment resufts from duplicate and spMt sall1lles 18kBn from the Lehigh Riyor and Aquashicola CrBElk. Oct 2004.
Noles: 1. Samples were coIBCled in 0c100. 2004 and I1InllO EnChem Inc. (Green Bay. WI) ror enaly!lis. 2. Split samples ...ere !eken from a subset of sa~s. !Irld OOnllO UneaSIer laboratories (Laro:asler. PAl for ~alysis.
B z Reponed resuft II en estimaled con;;ertralion!hal i,less Ih;ln!he POL. bul ~eater than or equal 10 the MOL NA z Not analyzed
References Barbour, M.T., J. Gerritsen, B.D. Snyder, and J.B. Stribling. 1999. Rapid bioassessment
protocols for use in streams and wadeable rivers: periphyton, benthic macroinvertebrates and fish, second ed. EPA 841-B-99-002. U. S. EPA, Office of Water. Washington, D.C.
Carline, R.F. and G.J. Jobsis.1989. Effects of heavy metal contamination on aquatic fauna in
the vicinity of Palmerton, Pennsylvania smelters. Report to U.S. Fish and Wildlife Service Ecological Field Services Field Office, State College, PA. University Park. 134p.
MacDonald, D.D., C.G. Ingersoll and T.A. Berger, 2000. Development and evaluation of
consensus-based sediment quality guidelines for freshwater systems. Arch. Envrion. Contam. Toxicol. 39:20-31.
Oyler, J.A. 1988. Remediation of metals-contaminated site near a zinc smelter usinr sludge/fly
ash amendments: herbaceous species. In Trace Substances in Environmental Health, Vol. 22. Univ. of Missouri, Columbia. P. 306.
Palmerton Natural Resource Trustee Council. 2005. Palmerton Zinc Pile Superfund Site Natural
Resource Damage Assessment Plan, July 2005. State College, PA. 41p. Palmerton Trustee Council. 2004. Sediment sampling and analysis plan, November 2004.
Bellefonte, PA. 7p. plus two appendices Pennsylvania Department of Conservation and Natural Resources, Pennsylvania Department of
Environmental Protection, Pennsylvania Fish and Boat Commission. Pennsylvania Game Commission, United States Department of Commerce and United States Department of Interior. 2003. Preassessment screen determination for the Palmerton Zinc Pile Superfund Site. Report issued in their capacity as Trustees of Natural Resources. 34pp.
Sopper, W.M. 1989. Revegetation of a contaminated zinc smelter site. Landscape and Urban
Planning. 17:241-250. U.S. EPA Environmental Response Team. 2001. Final Draft Palmerton Zinc Site ecological risk
assessment, Volume 2: Aquatic community endpoints.
29


![Air Contaminant _54.12_ [Preamb]](https://img.pdfslide.us/doc/110x75/5695cf481a28ab9b028d6988/air-contaminant-5412-preamb.jpg)


