Embed Size (px)
Citation preview

Assessment
of health facility data quality
Data quality report card
Cambodia, 2011

This report was prepared by the Department of Health Statistics and Information Systems (HSI), WHO, Geneva, in close
collaboration with the Department of Planning and Health Information (DPHI) of the Cambodia Ministry of Health, and the
Cambodia WHO country office.
Published in Geneva, April 2012.

Assessment of health facility data quality: Data quality report card – Cambodia, 2011 3
Table of contents
Executive summary ........................................................................................................................ 6
Introduction ..................................................................................................................................... 8
Completeness of reporting ............................................................................................................ 9
Indicator 1a: Completeness of district reporting ....................................................................................... 9
Indicator 1b: Completeness of facility reporting ....................................................................................... 9
Indicator 1c: Completeness of indicator reporting (missing data for selected indicators) ...................... 10
Internal consistency of reported data ......................................................................................... 11
Indicator 2a: Accuracy of event reporting (moderate/extreme outliers) ................................................ 11
Indicator 2b: Consistency over time......................................................................................................... 12
Indicator 2c: Consistency between indicator values ................................................................................ 14
Indicator 2d: Consistency between DTP1 and DTP3 ................................................................................ 15
Indicator 2e: Verification of reporting consistency through facility survey ............................................. 16
Consistency of population data................................................................................................... 17
Indicator 3a: Consistency with UN population projection ....................................................................... 17
Indicator 3a.1: Availability of crude birth rate and infant mortality rates ............................................... 17
Indicator 3a.2: Consistency of local population projection (PHD and NIS) .............................................. 18
Indicator 3b.1: Consistency of estimated number of pregnant women ................................................. 19
Indicator 3b.2: Consistency of estimated number of children under 1 year ........................................... 20
External comparison of coverage rates ...................................................................................... 22
Indicators 4a–4c: External comparison with values derived from household surveys: antenatal care
revisits, measles immunization, and institutional deliveries .................................................................... 22

4 Assessment of health facility data quality: Data quality report card – Cambodia, 2011
List of tables
Table 1: Facility reporting completeness rate and provinces with poor completeness rate (for 1089 facilities) ........................ 9
Table 2: Completeness of indicator reporting –Missing and zero values in monthly reports at provincial level
for 4 indicators for 2009–2011 ......................................................................................................................................................... 10
Table 3: Accuracy of event reporting – Extreme and moderate outliers among data points for 2010 and 2011
for 4 indicators ................................................................................................................................................................................... 11
Table 4: National ratio of total number of events in the current year to mean number of events in preceding 3 years ......... 13
Table 5: Provinces with percent change between current year and preceding 3 years more than 33% higher
or lower than the national average change ..................................................................................................................................... 13
Table 6: Consistency between indicator values – Rate ratios for DTP1 and ANC1 at national level,
and provinces with poor consistency (outliers more than 33% above or below national ratio) ................................................. 15
Table 7: National consistency ratio for DTP1 and 3, and provinces that have a consistency ratio gr eater than 1 ................... 16
Table 8: Consistency ratio of expected number of pregnant women to number of children under 1,
and provinces with large deviation from national ratio.................................................................................................................. 18
Table 9: National population consistency ratios (population from PHD divided by population from NIS),
and provinces with population estimates with more than a 15% difference ............................................................................... 19
Table 10: National ANC1 denominator consistency ratio and provinces with more than 33% difference
between the two population estimates for 2009–2011 ................................................................................................................. 20
Table 11: National DTP1 denominator consistency ratio and provinces with more than 33% difference
between the two population estimates for 2009–2011 ................................................................................................................. 21
Table 12: Comparison of coverage rates from surveys and from facility reports ........................................................................ 23
Table 13: Consistency ratio for measles immunization coverage rates, and provinces with very low and very high
consistency ratios............................................................................................................................................................................... 24
Table 14: Consistency ratio (facility/survey) for institutional deliveries rates in public facilities,
and provinces with very low and very high consistency ratios ...................................................................................................... 25
Table 15: Comparison of immunization coverage rates................................................................................................................. 25
List of figures Figure 1: Consistency over time for ANC2, measles immunizations, institutional deliveries,
and total outpatient visits for 2011 compared to 2008–2010 ....................................................................................................... 12
Figure 2: Consistency between DTP1 and ANC1 events in 2011 ................................................................................................... 14
Figure 3: Ratio of the number of third DTP doses to first DTP doses by province ....................................................................... 15
Figure 4: Consistency between the number of pregnant women and the number of children under 1 year ............................ 18
Figure 5: Estimated number of pregnant women, official estimate vs. estimate derived from ANC1 coverage, 2011 ............ 20
Figure 6: Estimated number of children under 1 year, official estimate vs. estimate derived from DTP1 coverage, 2011 ..... 21
Figure 7: Comparison of measles immunization coverage rates from facility reports in 2011 (bars)
and from CDHS 2010 (points) by province. ...................................................................................................................................... 23
Figure 8: Comparison of institutional delivery rates from facility reports in 2011 (bars) and CDHS 2010 by province ............ 24

Assessment of health facility data quality: Data quality report card – Cambodia, 2011 5
Abbreviations
ANC Antenatal care
ANC1 Antenatal care first visit
ANC4+ Four or more antenatal care visits
CDHS Cambodia Demographic and Health Survey
DHS Demographic and Health Survey
DTP Diphtheria-tetanus-pertussis vaccine
DTP1 Diphtheria-tetanus-pertussis vaccine – first dose
DTP3 Diphtheria-tetanus-pertussis vaccine – third dose
HMIS Health Management Information system
IPT2 Intermittent Presumptive Treatment – second dose
NIS National Institute of Statistics
OD Operational District
OP Outpatient
OPD Outpatient Department
PHD Provincial Health Department
SD Standard deviation
UNPD United Nations Population Division

6 Assessment of health facility data quality: Data quality report card – Cambodia, 2011
Executive summary
Health facility data are a critical input into assessing national progress and performance on an annual basis and they provide the basis for subnational/district performance assessment. This report assesses the quality of Cambodia’s health facility data collected through the health management information system (HMIS) for the period January to December 2011. The assessment focuses on four dimensions of quality and within each dimension, several indicators are used to track progress and assess the quality of the facility data generated by the HMIS, for both national level and for provinces.
At the national level, health facility reporting produces data of good quality for most indicators of intervention coverage, but problems with the denominators which seem to be too low:
Completeness of reporting: excellent; 99.8% of facilities submitted monthly reports for the year and there were no missing/zero values at the provincial and district level for four tracer indicators (Antenatal care second visit–ANC2–, measles immunization, institutional deliveries, and outpatient department –OPD–).
Internal consistency of the reported data: good; extreme outlying values from provinces were very rare, consistency over time was good, consistency between antenatal care first visit (ANC1) and diphteria-tetanus-pertussis vaccine first dose (DTP1) was good, DTP1 and DTP3 (diphteria-tetanus-pertussis vaccine third dose) consistency was good; no facility data verification was conducted in 2011.
Consistency of population denominators: fair; projections are based on 2008 census with published birth and death rates; highly consistent with UN projections and high level of internal consistency; the survey findings however suggest that the national population denominators for diphteria-tetanus-pertussis vaccine (DTP) is too low.
External comparison of coverage rates: poor correspondence for measles immunization but no reason to assume that antenatal care and deliveries at public health facilities based on facility reporting were poor.
For the assessment of performance in the 24 provinces the data quality assessment shows that:
Completeness of reporting: excellent; for all provinces.
Internal consistency of the reported data: good; extreme outlying values from provinces were very rare, consistency over time was good, consistency between ANC1 and DTP1 was good, one fourth of provinces had DTP3 higher than DTP1.
Consistency of population denominators: not good for all provinces; the analysis using the survey findings suggest that population denominators are often too low, especially in Phnom Penh.
External comparison of coverage rates: poor correspondence; coverage of measles immunization based on facility reporting were much higher than that from the survey data, with some provinces having greater differences.
Cambodia has a well-functioning reporting system, which has performed consistently over the past years. It can be further strengthened in two ways: (1) conduct a regular facility survey with data verification to know the accuracy of reporting for key indicators; (2) review and improve the provincial population denominators using the census and Cambodia Demographic and Health Survey (CDHS) 2010 results.
Assessment of health facility data quality: Data quality report card – Cambodia, 2011 7
Indicator Definition National DQ Score
% of provinces with poor DQ
score
2011 2011
1 COMPLETENESS OF REPORTING Very good
1a Completeness of district reporting
% of monthly district reports received N/A
N/A[1]
1b Completeness of facility
reporting
% of expected monthly facility reports received 99.8% 0%[2]
1c Completeness of indicator reporting (missing data for
selected indicators)
% of monthly provincial/district reports that are not zero/missing values (average for 4 indicators: ANC2,
measles, deliveries, OPD)
100% 0%[3]
2 INTERNAL CONSISTENCY OF REPORTED DATA Good, but no data verification done
2a Accuracy of event reporting (moderate/extreme outliers)
% of monthly provincial values that are moderate/extreme outliers (2 SD/3 SD or more from mean) (average for 4 indicators)
2.7%/0.1% 4%[4]/4%[5]
2b Consistency over time Number of events for current year divided by mean
of preceding 3 years (average for 4 indicators)
1.17
5%[6]
2c Consistency between indicator values
Rate ratio DTP1 to ANC1: facility DTP1/ANC1 ratio divided by survey-derived DTP1/ANC1 ratio
0.92 0%[7]
2d Consistency between DTP1 and DTP3
Number of DTP3 immunizations divided by the number of DTP1 immunizations (should be less than 1)
0.97 8%[8]
2e Verification of reporting
consistency through facility survey
% of agreement between data in sampled facility
records and national records for the same facilities for 3 core indicators
Not done
in 2011
N/A
3 CONSISTENCY OF POPULATION DATA National data good,
denominator problems for provinces
3a Consistency with UN
population projection
NIS (official) population projection divided by UN
population
1.01 N/A
3a.1 Availability of crude birth rates and infant mortality
rates
Rates used to compute target population estimates are available and clearly documented
Partially Partially
3a.2 Consistency of local population projection (PHD and NIS)
Provincial health department (PHD) population divided by the NIS (official) population
0.98 8%[9]
3b.1 Consistency with survey derived estimates (estimated number of pregnant women)
Number of pregnant women derived from ANC1 survey coverage (CDHS 2010) and reported number of events, divided by the official estimate
0.96 16%
3b.2 Consistency with survey
derived estimates (estimated number of children under 1 year)
Number of children under 1 year derived from DTP1
survey coverage (CDHS 2010) and reported number of events, divided by the official estimate
0.85 11%
4 EXTERNAL COMPARISON OF COVERAGE RATES Major differences for
immunization with facility coverage higher than survey
4a External comparison: ANC2 Coverage from facility reports divided by survey for the most recent comparable year (2010)[10]
0.94 N/A
4b External comparison:
Measles immunization
Coverage from facility reports divided by survey for
the most recent comparable year (2010)[10]
1.36 21%[11]
4c External comparison: Institutional deliveries
Coverage from facility reports divided by survey for the most recent comparable year (2010)[10]
1.28 58%[11]
[1] N/A because of web based reporting. [2] % of provinces with monthly facility reporting rates below 80%. [3] % of provinces with more than 20% zero values. [4] % of provinces with at least 5% of the values that are moderate or worse outliers (+/-2 standard deviations). [5] % of provinces in which at least one of the monthly provincial values are extreme outliers in any of the 4 indicators (+/-3 standard deviations from the provincial mean). [6] % of provinces with at least 33% difference with the national ratio of current year to mean of preceding 3 years (mean over 4 indicators). [7] % of provinces with at least 33% difference with the national ratio of DTP3 to ANC1 coverage. [8] % of provinces with the number of DTP3 immunizations over 2% higher than DTP1 immunization. [9] % of provinces with at least 15% difference between NIS and PHD population projections. [10] Most recent survey year was used for the comparison. If there is a significant gap between the year of survey and year of HMIS data, the two data points are not be directly comparable. [11] % of provinces with at least 33% off the expected coverage.
8 Assessment of health facility data quality: Data quality report card – Cambodia, 2011
Introduction
Quality data on health sector performance should be available on a regular, preferably annual basis. Population-based surveys are conducted only periodically, usually once every 3–5 years, and collect retrospective information. Thus surveys are generally not a reliable reflection of the current health situation. Health facility data are collected and aggregated on a continuing basis and are also needed, especially to monitor annual and subnational progress.
All health data are imperfect in some way. Data quality assessment should always be undertaken to understand how much confidence can be placed in the health data reported. Population-based surveys use standard methods to assess data quality and make adjustments as needed to address problems of bias or missing values. These adjustments are carefully documented. Such rigorous quality control mechanisms are rarely applied to routinely-collected administrative and health facility data. Yet these data are often the basis for annual monitoring; decision makers using them need assurance of their reliability and soundness.
In practice, HMIS data have a number of limitations and quality problems, such as missing values, bias, and computation errors. Furthermore, when HMIS data are used to estimate population coverage rates, assumptions have to be made about the relevant denominators or target populations. These assumptions are often prone to errors. Within each dimension, several indicators are used to track progress. Based on the assessment of data completeness and quality, the report discusses the quality of national coverage estimates derived from the HMIS. The assessment of HMIS data quality focuses on four dimensions:
1. completeness of reporting, including timeliness;
2. internal consistency of reported data;
3. consistency of population data;
4. external comparison: using independent external sources of data, notably survey data.
This report card describes the quality of the HMIS health facility data in Cambodia for January to December 2011, using indicators for these four dimensions. Data were downloaded from the web-based HMIS (http://hiscambodia.org/public/homepage_en.php) on January 25, 2012. Comparisons with data from 2009 and 2010 are provided where possible to track progress.
Cambodia's reporting system has the following general characteristics:
Reporting units: 24 provincial health departments (PHDs), which are further subdivided into 77 operational districts (ODs).
Population per unit: the national population was estimated at 14 million in 2011, projected from the 2008 census; provincial populations range from around 36,000 (Kep) to 1.8 million (Kampong Cham) with an average population of approximately 600 000 per province. OD populations range from 36 000 (Kep) to 480 000 (Lech) with a mean OD population of approximately 180 000.
Facilities: 1001 functioning health centers and 88 hospitals (district, provincial, and national) in the public sector. Private-for-profit and NGO health facilities are currently being added to the HMIS; however, only a few have submitted reports, and they are currently not included in completeness measures nor in coverage estimates based on HMIS data.

Assessment of health facility data quality: Data quality report card – Cambodia, 2011 9
Completeness of reporting
Indicator Definition National DQ Score
% of provinces with poor DQ
score
2011 2011 1a Completeness of district
reporting % of monthly district reports received N/A
N/A[1]
1b Completeness of facility
reporting
% of expected monthly facility reports received 99.8% 0%[2]
1c Completeness of indicator reporting (missing data for selected indicators)
% of monthly provincial/district reports that are not zero/missing values (average for 4 indicators: ANC2, measles, deliveries, OPD)
100% 0%[3]
[1] N/A because of web based reporting. [2] % of provinces with monthly facility reporting rates below 80%. [3] % of provinces with more than 20% zero values.
Indicator 1a: Completeness of district reporting
The Cambodia Ministry of Health requires all public facilities (referral hospitals and health centers) to submit reports by the 5th of each month. Reporting forms are standardized (HC1 for health centers, HO2 for referral hospitals) and are either entered directly into the web-based HMIS at the health facility or sent to the district office where the forms are entered into the web-based system. Once entered into the web-based HMIS, the data are available for viewing to all users with access authorization, and all aggregations of the data are computed automatically using routines programmed into the web-based HMIS. Thus districts no longer submit a monthly report to higher levels. However, district HMIS staff are required to check the data in the forms, and correct any errors by the 10th of each month. All districts are expected to perform data checking and correcting; however, there is no method to verify the extent of this process, and whether it is consistently applied across districts.
Indicator 1b: Completeness of facility reporting
All public facilities are expected to submit reports every month. The facility reporting completeness is defined as the total number of monthly facility reports (HC1 for health centers, HO2 for hospitals) received divided by the total expected number of monthly facility reports and expressed as a percentage. Table 1 shows the facility reporting completeness for 2011. Cambodia had 99.8% reporting of public facilities in 2011. There were 2 national hospitals that did not submit a report for December 2011 (as of January 31, 2012). Facility reporting completeness has improved since 2009, when the completeness rate was 94%, due in part to the introduction of the web-based system.
Table 1: Facility reporting completeness rate and provinces with poor completeness rate (for 1089 facilities)
2009 2010 2011
National facility reporting completeness rate
94.2% 100% 99.8%
Number (%) of provinces with completeness rate below 80%
2 (8%) 0 (0%) 0 (0%)
Provinces with facility completeness rate below 80%
Mondul Kiri, Oddar Meanchey
– –

10 Assessment of health facility data quality: Data quality report card – Cambodia, 2011
Indicator 1c: Completeness of indicator reporting (missing data for selected indicators)
Completeness of indicator reporting refers to the extent to which facility and OD/PHD reports include all reportable events. Missing data should be clearly differentiated from zero values in district and facility reports. A true zero value indicates that no reportable events occurred that month; a missing value indicates that reportable events occurred but were not actually reported. In many HMIS reports, missing entries are assigned a value of 0, making it impossible to distinguish between a true zero value (no events occurred) from a missing value (events occurred but were not reported).
In Cambodia, the analysis includes ANC2 (revisits), measles vaccination, deliveries, and total number of outpatient visits. There were no missing or zero values in monthly provincial totals in 2010 and 2011.
Table 2: Completeness of indicator reporting – Missing and zero values in monthly reports at provincial level for 4 indicators for 2009–2011
Number (%) of data points with missing or zero value
2009 2010 2011 ANC2 (revisits) 6 (2.1%) 0 (0%) 0 (0%)
Measles 41 (14.2%) 0 (0%) 0 (0%)
Institutional deliveries 1 (0.3%) 0 (0%) 0 (0%)
OPD 1 (0.3%) 0 (0%) 0 (0%)
Total 49 (4.2%) 0 (0%) 0 (0%)
(Total data points = 12 x Number of provinces)
Assessment of health facility data quality: Data quality report card – Cambodia, 2011 11
Internal consistency of reported data
Indicator Definition National DQ Score
% of provinces with poor DQ
score
2011 2011 2a Accuracy of event reporting
(moderate/extreme outliers) % of monthly provincial values that are moderate/extreme outliers (2 SD/3 SD or more from mean) (average for 4 indicators)
2.7%/0.1% 4%[4]/4%[5]
2b Consistency over time Number of events for current year divided by mean of preceding 3 years (average for 4 indicators)
1.17
5%[6]
2c Consistency between indicator values
Rate ratio DTP1 to ANC1: facility DTP1/ANC1 ratio divided by survey-derived DTP1/ANC1 ratio
0.92 0%[7]
2d Consistency between DTP1 and DTP3
Number of DTP3 immunizations divided by the number of DTP1 immunizations (should be less than 1)
0.97 8%[8]
2e Verification of reporting
consistency through facility survey
% of agreement between data in sampled facility
records and national records for the same facilities for 3 core indicators
Not done
in 2011
N/A
[4] % of provinces with at least 5% of the values that are moderate or worse outliers (+/-2 standard deviations). [5] % of provinces in which at least one of the monthly provincial values are extreme outliers in any of the 4 indicators (+/-3 standard deviations from the provincial mean). [6] % of provinces with at least 33% difference with the national ratio of current year to mean of preceding 3 years (mean over 4 indicators). [7] % of provinces with at least 33% difference with the national ratio of DTP3 to ANC1 coverage. [8] % of provinces with the number of DTP3 immunizations over 2% higher than DTP1 immunization.
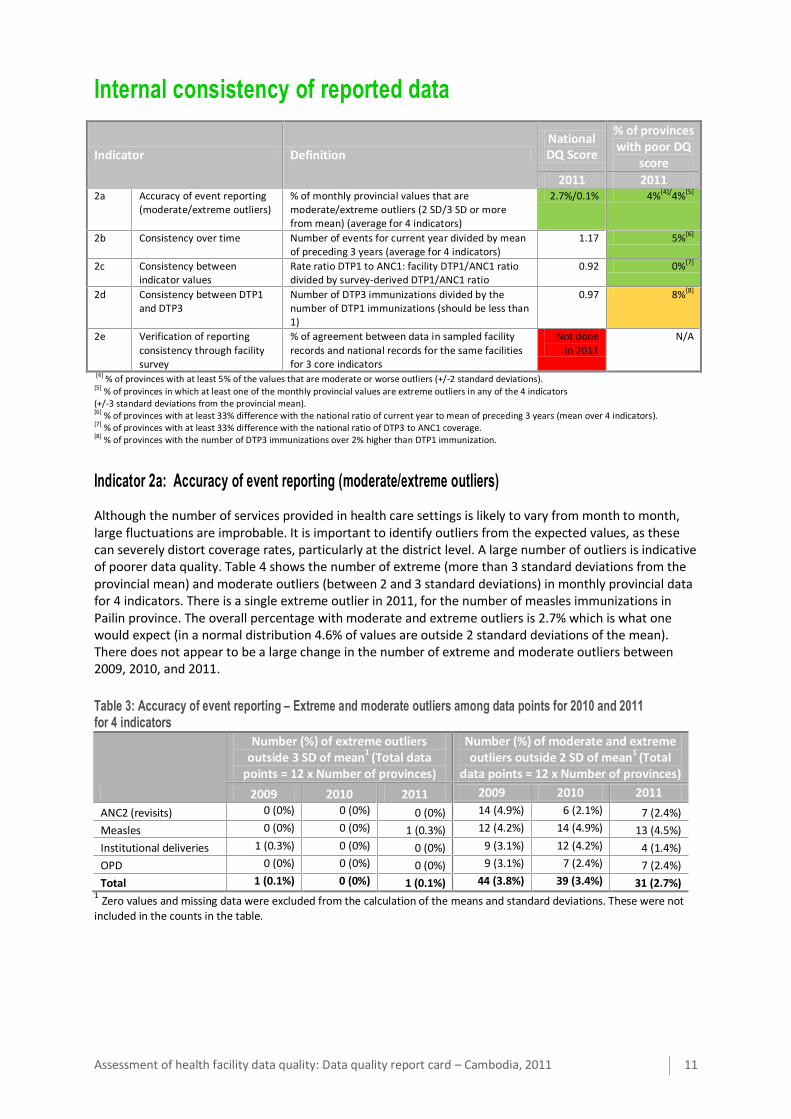
Indicator 2a: Accuracy of event reporting (moderate/extreme outliers)
Although the number of services provided in health care settings is likely to vary from month to month, large fluctuations are improbable. It is important to identify outliers from the expected values, as these can severely distort coverage rates, particularly at the district level. A large number of outliers is indicative of poorer data quality. Table 4 shows the number of extreme (more than 3 standard deviations from the provincial mean) and moderate outliers (between 2 and 3 standard deviations) in monthly provincial data for 4 indicators. There is a single extreme outlier in 2011, for the number of measles immunizations in Pailin province. The overall percentage with moderate and extreme outliers is 2.7% which is what one would expect (in a normal distribution 4.6% of values are outside 2 standard deviations of the mean). There does not appear to be a large change in the number of extreme and moderate outliers between 2009, 2010, and 2011.
Table 3: Accuracy of event reporting – Extreme and moderate outliers among data points for 2010 and 2011 for 4 indicators
Number (%) of extreme outliers outside 3 SD of mean
1 (Total data
points = 12 x Number of provinces)
Number (%) of moderate and extreme outliers outside 2 SD of mean
1 (Total
data points = 12 x Number of provinces)
2009 2010 2011 2009 2010 2011
ANC2 (revisits) 0 (0%) 0 (0%) 0 (0%) 14 (4.9%) 6 (2.1%) 7 (2.4%)
Measles 0 (0%) 0 (0%) 1 (0.3%) 12 (4.2%) 14 (4.9%) 13 (4.5%)
Institutional deliveries 1 (0.3%) 0 (0%) 0 (0%) 9 (3.1%) 12 (4.2%) 4 (1.4%)
OPD 0 (0%) 0 (0%) 0 (0%) 9 (3.1%) 7 (2.4%) 7 (2.4%)
Total 1 (0.1%) 0 (0%) 1 (0.1%) 44 (3.8%) 39 (3.4%) 31 (2.7%) 1 Zero values and missing data were excluded from the calculation of the means and standard deviations. These were not included in the counts in the table.

12 Assessment of health facility data quality: Data quality report card – Cambodia, 2011
Indicator 2b: Consistency over time
This indicator shows the consistency of the values for key indicators in the most recent year compared with the previous 3 years. While some differences are to be expected, very large changes are likely to be due to reporting errors.
Consistency over time was measured using the ratio of the total number of events in the current year with the mean number of events from the preceding 3 years for each indicator. A consistency over time ratio greater than 1 indicates an increase in the number of events from previous years, while a ratio less than 1 indicates a decrease. Figure 1 shows scatterplots of the number of events in 2011 compared to the mean number of events in 2008–2010 for 4 indicators.
Figure 1: Consistency over time for ANC2, measles immunizations, institutional deliveries, and total outpatient visits for 2011 compared to 2008–2010 (solid line indicates the national ratio; dashed lines indicate 33% relative difference from the national ratio)
ANC2
Measles immunizations
Institutional deliveries
Total outpatient (OP) visits

Assessment of health facility data quality: Data quality report card – Cambodia, 2011 13
Table 4 shows the consistency over time ratios for 2009 (comparison with 2006–2008), 2010 (comparison with 2007–2009), and 2011 (comparison with 2008–2010). Most indicators showed a fairly large increase in the number of events for all 3 years. Institutional deliveries showed particularly dramatic increases in all 3 years. This likely reflects a true underlying increase in the number of institutional deliveries, as well as higher reporting completeness. However, large and rapid changes such as these should nonetheless be flagged for further examination for reporting errors.
Table 4: National ratio of total number of events in the current year to mean number of events in preceding 3 years
2009
(comparison to 2006–2008)
2010 (comparison to
2007–2009)
2011 (comparison to
2008–2010) ANC2 1.34 1.08 1.10
Measles 1.01 1.14 1.00
Institutional deliveries 2.02 1.67 1.32
Total OP visits 1.13 1.41 1.26
Overall (excl. deliveries)
1.37 (1.16)
1.32 (1.21)
1.17 (1.12)
A similar analysis was done at the provincial level. Provinces that had a relative difference greater than 33% between the provincial percent change and the national average change were flagged in Table 5.
Table 5: Provinces with percent change between current year and preceding 3 years more than 33% higher or lower than the national average change
Provinces with consistency ratio 33%+ lower than national ratio
Provinces with consistency ratio 33%+ higher than national ratio
2009 2010 2011 2009 2010 2011
ANC2 0 (0%) –
0 (0%) –
0 (0%) –
1 (4%) Sihanoukville
3 (12%) Phnom Penh, Mondul Kiri, Preah Vihear
0 (0%) –
Measles 4 (17%) Kampot,
Stung Treng, Oddar
Meanchey, Pailin
0 (0%) –
0 (0%) –
1 (4%) Phnom Penh
1 (4%) Phnom Penh
1 (4%) Pailin
Deliveries 2 (8%) Mondul Kiri, Preah Vihear
0 (0%) –
0 (0%) –
4 (17%) Kampong
Speu, Kapong Thom,
Phnom Penh, Kep
0 (0%) –
3 (12%) Kratie,
Mondul Kiri, Pursat
OPD 0 (0%) –
0 (0%) –
0 (0%) –
1 (4%) Phnom Penh
2 (8%) Phnom Penh,
Siemreap
1 (4%) Phnom Penh
Overall (mean % of provinces)
6% 0% 0% 7% 6% 5%

14 Assessment of health facility data quality: Data quality report card – Cambodia, 2011
Indicator 2c: Consistency between indicator values
As high priority health interventions with a high level of continuity of care, ANC1 and DTP1 coverage rates are expected to show a high degree of correlation. The CDHS 2010 showed that 90% of pregnant women had at least one antenatal care visit, and 93% of children under 1 received the first dose of DTP vaccine. There was a fairly high degree of correlation between the two indicators across provinces (ρ=0.72). A large discrepancy between the ANC1 and DTP1 may be indicative of errors in reporting and problems with data quality.
The survey based expected ratio of the number of DTP1/ANC1 reported events is (0.93)/(0.90) * (1-k). K is the correction for different denominators: antenatal care is for all pregnant women, DTP1 for all children 12–23 months. Mostly, the infant mortality rate is used for k. In the case of Cambodia, we will use the value of 0.100. So here the survey based DTP1/ANC1 ratio for the numbers is .93/.90*(1-.90)=.93. This is what would be the expected ratio from the facility numbers.
Nationally, there were 320 601 DTP1 immunizations and 371 445 ANC1 visits, for a national DTP1 to ANC1 ratio of 0.86 in 2011. The indicator used is the rate ratio – facility over survey, where 1 indicates perfect agreement, a value greater more than 10% lower or higher indicates possible inconsistency and problems with the reporting of one or both. The rate ratio is 0.86/0.93 = 0.92. There is no strong evidence of inconsistency at the national level.
Figure 2 shows a scatterplot of DTP1 and ANC1 events for all provinces. The solid line shows the national DTP1/ANC1 ratio, and the dotted lines show a relative difference of 33% from the national ratio. All provinces had a DTP1 to ANC1 ratio within 33% of the national ratio.
Figure 2: Consistency between DTP1 and ANC1 events in 2011 (solid line indicates the national ratio of DTP1 to ANC1 number of events; dashed lines indicate 33% relative difference from the national ratio)

Assessment of health facility data quality: Data quality report card – Cambodia, 2011 15
Table 6 shows the rate ratios for 2009–2011, and provinces with more than 33% relative difference with the national ratio.
Table 6: Consistency between indicator values – Rate ratios for DTP1 and ANC1 at national level, and provinces with poor consistency (outliers more than 33% above or below national ratio)
2009 2010 2011
National rate ratio 0.89 1.07 0.92
Provinces with DTP1/ANC1 ratio 33% above national ratio (DTP1 too high)
0 (0%) –
1 (4%) Kep
0 (0%) –
Provinces with DTP1/ANC1 ratio 33% below national ratio (DTP1 too low)
4 (16%) Kampot, Mondul Kiri, Stung Treng, Oddar
Meanchey
0 (0%) –
0 (0%) –
Indicator 2d: Consistency between DTP1 and DTP3
The CDHS 2010 indicated that the national dropout rate from the first dose to third dose of DTP was 8.3% among children 12–23 months, with provincial dropout rates ranging from 0% (Takeo) to 26.5% (Mondul Kiri/Ratanakiri). While it is theoretically possible for the number of DTP third doses to be slightly higher than the number of first doses, such as in provinces with a lot of in-migration or due to the size of cohorts, it is unlikely to happen systematically and have a large effect. Thus if DTP3 immunizations is higher than DTP1, this indicates problems with data quality.
The DTP1-3 consistency ratio is defined to be the number of DTP3 immunization divided by the number of DTP1 immunizations. Normally, one would expect this ratio to be below 1. At the national level, there were 320 601 DTP1 immunizations reported for 2011, and 311 608 DTP3 immunizations reported for a DTP1-3 consistency ratio of 0.97 (2.8% drop out rate). Figure 3 shows the DTP1-3 consistency ratios by province. There were 6 provinces that had DTP3 greater than DTP1, and there were 2 provinces, Oddar Meanchey and Ratanakiri, where this difference was more than 2%. This could indicate some problems with recording of the information at the facility level (e.g. inaccurate recording of the dose of DTP when it is administered) or when the numbers are tallied for reporting purposes.
Figure 3: Ratio of the number of third DTP doses to first DTP doses by province (this ratio should be below one; provinces with ratio greater than one are shown in dark gray; provinces with DTP3 more than 2% higher than DTP1 are labelled)
16 Assessment of health facility data quality: Data quality report card – Cambodia, 2011
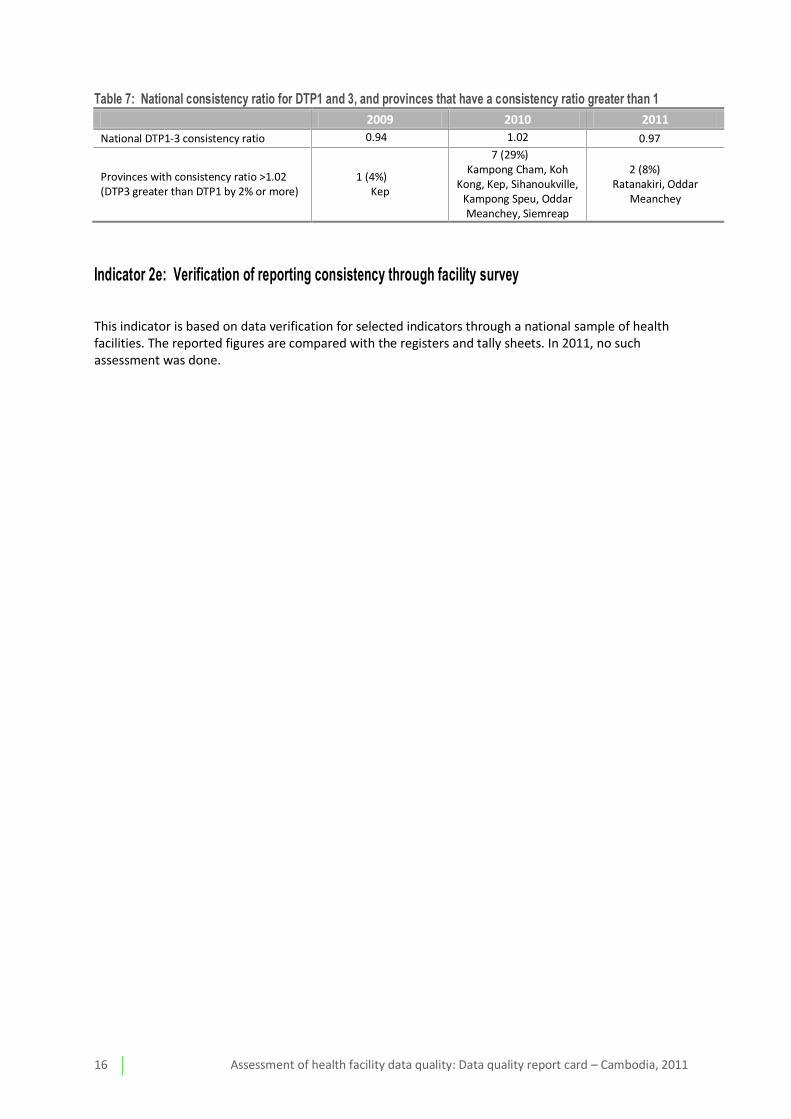
Table 7: National consistency ratio for DTP1 and 3, and provinces that have a consistency ratio greater than 1
2009 2010 2011
National DTP1-3 consistency ratio 0.94 1.02 0.97
Provinces with consistency ratio >1.02 (DTP3 greater than DTP1 by 2% or more)
1 (4%) Kep
7 (29%) Kampong Cham, Koh
Kong, Kep, Sihanoukville, Kampong Speu, Oddar Meanchey, Siemreap
2 (8%) Ratanakiri, Oddar
Meanchey
Indicator 2e: Verification of reporting consistency through facility survey
This indicator is based on data verification for selected indicators through a national sample of health facilities. The reported figures are compared with the registers and tally sheets. In 2011, no such assessment was done.

Assessment of health facility data quality: Data quality report card – Cambodia, 2011 17
Consistency of population data
Indicator Definition National DQ Score
% of provinces with poor DQ
score
2011 2011 3a Consistency with UN
population projection NIS (official) population projection divided by UN population
1.01 N/A
3a.1 Availability of crude birth
rates and infant mortality rates
Rates used to compute target population estimates
are available and clearly documented
Partially Partially
3a.2 Consistency of local population projection (PHD
and NIS)
Provincial health department (PHD) population divided by the NIS (official) population
0.98 8%[9]
3b.1 Consistency with survey derived estimates (estimated number of pregnant women)
Number of pregnant women derived from ANC1 survey coverage (CDHS 2010) and reported number of events, divided by the official estimate
0.96 16%
3b.2 Consistency with survey derived estimates (estimated number of children under 1 year)
Number of children under 1 year derived from DTP1 survey coverage (CDHS 2010) and reported number of events, divided by the official estimate
0.85 11%
[9] % of provinces with at least 15% difference between NIS and PHD population projections.
Indicator 3a: Consistency with UN population projection
Population projections at the national and provincial levels are provided by the Cambodia National Institute of Statistics (NIS) and are based on the 2008 General Population Census. The coverage estimates for the health indicators use the NIS population projections for the national and provincial levels. These projections are based on mortality and fertility estimates that are adjusted for under-enumeration of births and infant deaths in the 2008 census. Due to the rapid decrease in fertility rates in Cambodia in recent years, it is possible that population projections are based on higher than actual fertility, resulting in over-estimation of population figures. The national population projection from the NIS is compared with UNPD population projections. The higher the level of consistency between denominators from different sources, the more confidence can be placed in the accuracy of the population projections.
Population Consistency ratio (UN): The total population from NIS for 2011 (14.5 million) divided by the population projection (medium variant) from UNPD for 2011 (14.3 million). The population consistency ratio (UN) is 1.01, indicating high consistency.
Indicator 3a.1: Availability of crude birth rate and infant mortality rates
Crude birth rate and infant mortality rates are used to obtain population denominators, such as live births and surviving infants. The following sources were used in the Cambodia projections:
National Provincial Total population 2008 census 2008 census
Crude birth rate HMIS HMIS
Infant mortality rate No data available No data available
While national and provincial crude birth rates are presented in the HMIS report, the source of these numbers is not clear. It is also unclear whether these figures were used to derive denominators (such as the estimated number of pregnant women and children under 1 year) and how these denominators were derived, as the formulas are not presented.

18 Assessment of health facility data quality: Data quality report card – Cambodia, 2011
Overall, the estimated number of pregnant women is 1.36 times higher than the estimated number of children under 1 (Figure 4). This suggests that a very high late pregnancy loss and infant mortality figure is used, and may possibly lead to underestimation of the denominators, for instance, for immunization.
Figure 4: Consistency between the number of pregnant women and the number of children under 1 year (solid line indicates the national ratio; dashed lines indicate 15% relative difference from the national ratio)
Table 8: Consistency ratio of expected number of pregnant women to number of children under 1, and provinces with large deviation from national ratio
2011
National denominator consistency ratio (expected pregnant women/children under 1 year)
1.36
Provinces with ratio >15% higher than national ratio 3 (12%)
Mondul Kiri, Ratanakiri, Takeo
Provinces with ratio >15% lower than national ratio 4 (17%)
Preah Vihear, Stung Treng, Oddar Meanchey, Pailin
Indicator 3a.2: Consistency of local population projection (PHD and NIS)
Since operational district boundaries do not necessarily coincide with those of administrative districts, PHDs are responsible for providing population estimates for their operational districts. Estimates from PHDs result in provincial and national populations that are slightly different from official NIS estimates.
Population Consistency ratio (NIS): The total population derived from PHDs (14.03 million) divided by the population projection from NIS. The population consistency ratio (NIS) is 0.98 in 2011, indicating high consistency, with a slightly lower population projection by the PHDs, resulting in a small overestimation of coverage rates compared to using the NIS estimates.
The total populations from NIS and PHDs were also compared at the provincial level. Table 8 shows the consistency between the two data sources for population for 2009–2011.
Assessment of health facility data quality: Data quality report card – Cambodia, 2011 19
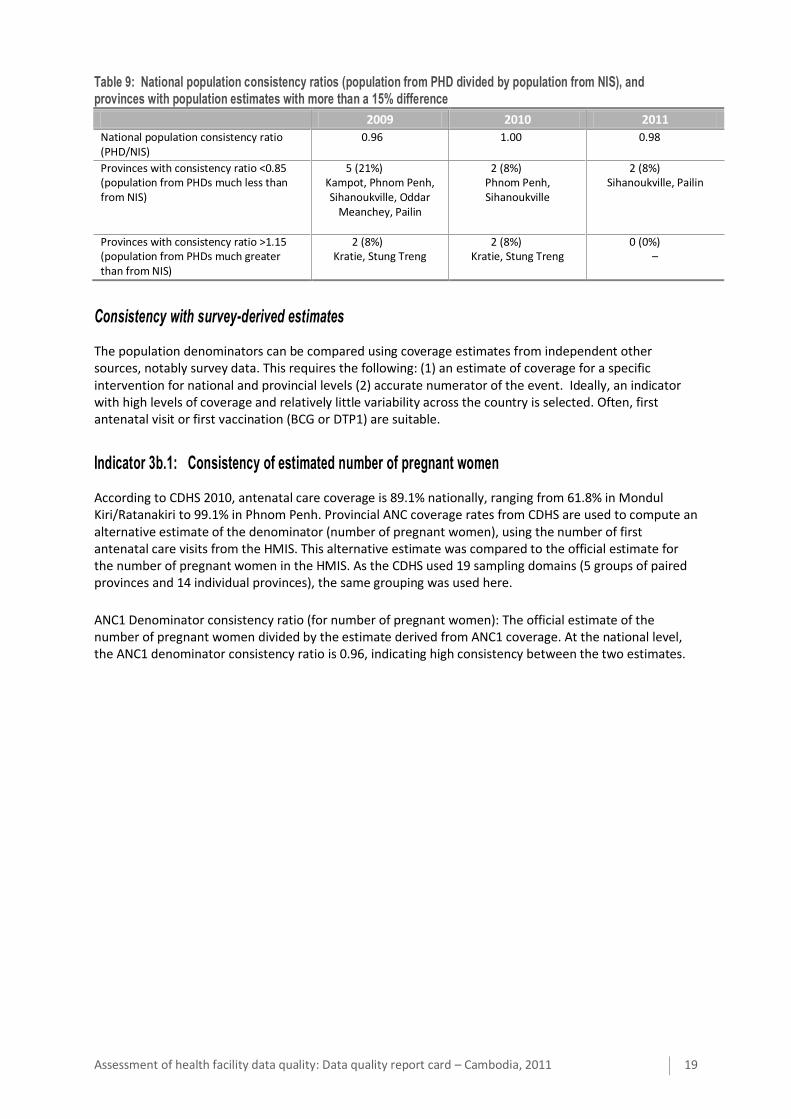
Table 9: National population consistency ratios (population from PHD divided by population from NIS), and provinces with population estimates with more than a 15% difference
2009 2010 2011
National population consistency ratio (PHD/NIS)
0.96 1.00 0.98
Provinces with consistency ratio <0.85 (population from PHDs much less than from NIS)
5 (21%) Kampot, Phnom Penh, Sihanoukville, Oddar
Meanchey, Pailin
2 (8%) Phnom Penh, Sihanoukville
2 (8%) Sihanoukville, Pailin
Provinces with consistency ratio >1.15 (population from PHDs much greater than from NIS)
2 (8%) Kratie, Stung Treng
2 (8%) Kratie, Stung Treng
0 (0%) –
Consistency with survey-derived estimates
The population denominators can be compared using coverage estimates from independent other sources, notably survey data. This requires the following: (1) an estimate of coverage for a specific intervention for national and provincial levels (2) accurate numerator of the event. Ideally, an indicator with high levels of coverage and relatively little variability across the country is selected. Often, first antenatal visit or first vaccination (BCG or DTP1) are suitable.
Indicator 3b.1: Consistency of estimated number of pregnant women
According to CDHS 2010, antenatal care coverage is 89.1% nationally, ranging from 61.8% in Mondul Kiri/Ratanakiri to 99.1% in Phnom Penh. Provincial ANC coverage rates from CDHS are used to compute an alternative estimate of the denominator (number of pregnant women), using the number of first antenatal care visits from the HMIS. This alternative estimate was compared to the official estimate for the number of pregnant women in the HMIS. As the CDHS used 19 sampling domains (5 groups of paired provinces and 14 individual provinces), the same grouping was used here.
ANC1 Denominator consistency ratio (for number of pregnant women): The official estimate of the number of pregnant women divided by the estimate derived from ANC1 coverage. At the national level, the ANC1 denominator consistency ratio is 0.96, indicating high consistency between the two estimates.

20 Assessment of health facility data quality: Data quality report card – Cambodia, 2011
Comparison at the provincial level showed greater variability. Figure 5 shows the two estimates for the number of pregnant women for each province.
Figure 5: Estimated number of pregnant women, official estimate vs. estimate derived from ANC1 coverage, 2011 (solid line indicates an exact match between the two estimates; dashed lines indicate 33% relative difference from an exact match)
Two provinces, Phnom Penh and Oddar Meanchey, had an official population estimate over 33% lower than ANC1 derived estimate in 2011. One province, Takeo, had an official population over 33% higher than the ANC1 derived estimate.
Table 10: National ANC1 denominator consistency ratio and provinces with more than 33% difference between the two population estimates for 2009–2011
2009 2010 2011
National ANC1 denominator consistency ratio
0.86 1.03 0.96
Provinces with consistency ratio <0.67 (official estimate too low)
3 (16%) Mondul Kiri/Ratanakiri,
Oddar Meanchey, Phnom Penh
1 (5%) Phnom Penh
2 (11%) Oddar Meanchey,
Phnom Penh
Provinces with consistency ratio >1.33 (official estimate too high)
0 (0%) –
2 (11%) Kratie, Takeo
1 (5%) Takeo
* Percentages in this table are computed for the 19 provinces or paired provinces.
Indicator 3b.2: Consistency of estimated number of children under 1 year
The CDHS 2010 showed that DTP1 coverage is 93.1% nationally, ranging from 66.5% in Mondul Kiri/Ratanakiri to 97.9% in Banteay Meanchey. Provincial DTP1 coverage rates from CDHS are used to compute an alternative estimate of the denominator (number of children under 1 year), using the number of DTP1 immunizations from the HMIS. This alternative estimate was compared to the official estimated number of children under 1 year in the HMIS. As for ANC1, the 19 CDHS sampling domains (5 groups of paired provinces and 14 individual provinces) were used for this analysis instead of 24 individual provinces.

Assessment of health facility data quality: Data quality report card – Cambodia, 2011 21
DTP1 Denominator consistency ratio (for number of children under 1 year): The official estimate of the number of children under 1 divided by the estimate derived from DTP1 coverage. At the national level, the DTP1 denominator consistency ratio is 0.85, indicating a moderately large disparity between the two estimates. Figure 6 shows the comparison of the two at the provincial level.
Figure 6: Estimated number of children under 1 year, official estimate vs. estimate derived from DTP1 coverage, 2011 (solid line indicates an exact match between the two estimates; the dashed lines indicate 33% relative difference from an exact match)
There were 2 provinces or paired provinces in which the official estimated number of children under 1 year was more than 33% lower than the estimate derived from survey DTP1 coverage: Mondul Kiri/Ratanakiri, and Phnom Penh. Interestingly, almost all provinces had an official estimate that was lower than the DTP1-derived estimated denominator, which was not the case for the ANC1-derived denominators above. Only one province, Kampong Speu, had an official estimate that was higher than the DTP1-derived estimated number of children under 1 year.
Table 11: National DTP1 denominator consistency ratio and provinces with more than 33% difference between the two population estimates for 2009–2011
2009 2010 2011
National DTP1 denominator consistency ratio
0.82 0.83 0.85
Provinces with consistency ratio <0.67 (official estimate too low)
2 (11%) Mondul Kiri/Ratanakiri,
Phnom Penh
1 (5%) Kratie
2 (11%) Mondul Kiri/Ratanakiri,
Phnom Penh
Provinces with consistency ratio >1.33 (official estimate too high)
2 (11%) Oddar Meanchey, Preah
Vihear/Stung Treng
2 (11%) Mondul Kiri/Ratanakiri,
Phnom Penh
0 (0%) –
* Percentages in this table are computed for the 19 provinces or paired provinces.
22 Assessment of health facility data quality: Data quality report card – Cambodia, 2011
External comparison of coverage rates
Indicator Definition National DQ Score
% of provinces with poor DQ
score
2011 2011 4a External comparison: ANC2 Coverage from facility reports divided by survey for
the most recent comparable year (2010)[10] 0.94 N/A
4b External comparison:
Measles immunization
Coverage from facility reports divided by survey for
the most recent comparable year (2010)[10]
1.36 21%[11]
4c External comparison: Institutional deliveries
Coverage from facility reports divided by survey for the most recent comparable year (2010)[10]
1.28 58%[11]
[10] Most recent survey year was used for the comparison. If there is a significant gap between the year of survey and year of HMIS data, the two data points are not be directly comparable. [11] % of provinces with at least 33% off the expected coverage.
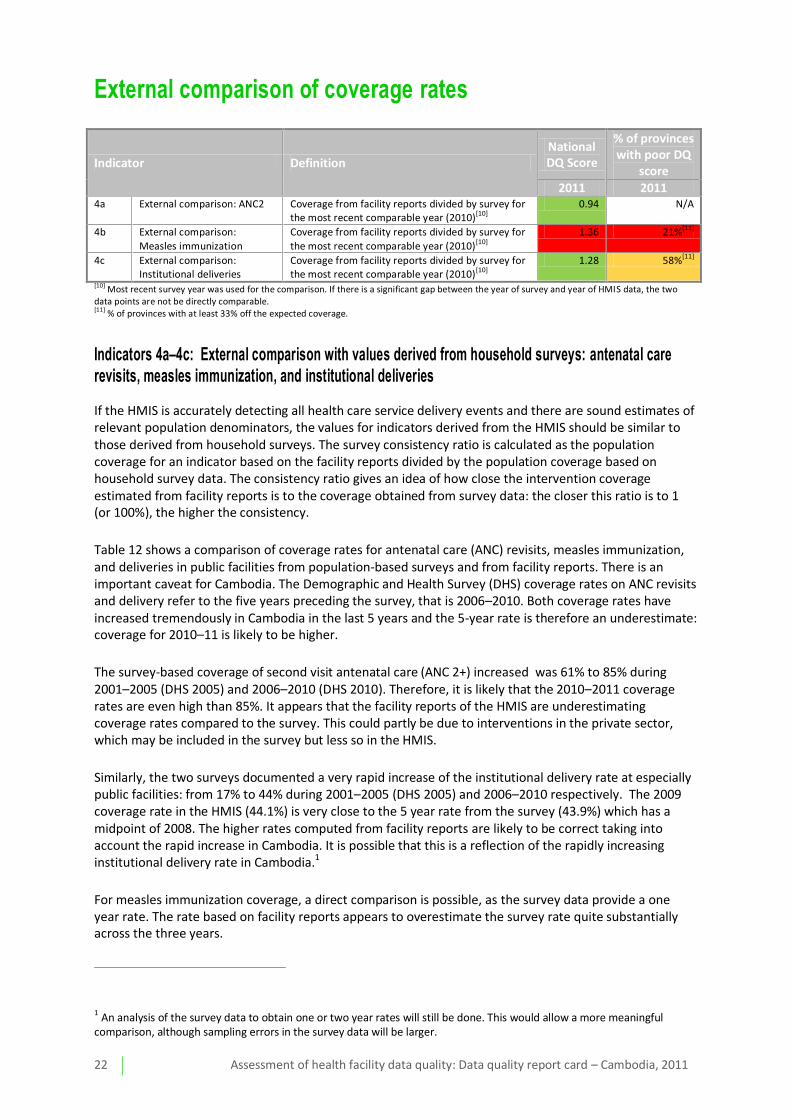
Indicators 4a–4c: External comparison with values derived from household surveys: antenatal care revisits, measles immunization, and institutional deliveries
If the HMIS is accurately detecting all health care service delivery events and there are sound estimates of relevant population denominators, the values for indicators derived from the HMIS should be similar to those derived from household surveys. The survey consistency ratio is calculated as the population coverage for an indicator based on the facility reports divided by the population coverage based on household survey data. The consistency ratio gives an idea of how close the intervention coverage estimated from facility reports is to the coverage obtained from survey data: the closer this ratio is to 1 (or 100%), the higher the consistency.
Table 12 shows a comparison of coverage rates for antenatal care (ANC) revisits, measles immunization, and deliveries in public facilities from population-based surveys and from facility reports. There is an important caveat for Cambodia. The Demographic and Health Survey (DHS) coverage rates on ANC revisits and delivery refer to the five years preceding the survey, that is 2006–2010. Both coverage rates have increased tremendously in Cambodia in the last 5 years and the 5-year rate is therefore an underestimate: coverage for 2010–11 is likely to be higher.
The survey-based coverage of second visit antenatal care (ANC 2+) increased was 61% to 85% during 2001–2005 (DHS 2005) and 2006–2010 (DHS 2010). Therefore, it is likely that the 2010–2011 coverage rates are even high than 85%. It appears that the facility reports of the HMIS are underestimating coverage rates compared to the survey. This could partly be due to interventions in the private sector, which may be included in the survey but less so in the HMIS.
Similarly, the two surveys documented a very rapid increase of the institutional delivery rate at especially public facilities: from 17% to 44% during 2001–2005 (DHS 2005) and 2006–2010 respectively. The 2009 coverage rate in the HMIS (44.1%) is very close to the 5 year rate from the survey (43.9%) which has a midpoint of 2008. The higher rates computed from facility reports are likely to be correct taking into account the rapid increase in Cambodia. It is possible that this is a reflection of the rapidly increasing institutional delivery rate in Cambodia.1
For measles immunization coverage, a direct comparison is possible, as the survey data provide a one year rate. The rate based on facility reports appears to overestimate the survey rate quite substantially across the three years.
1 An analysis of the survey data to obtain one or two year rates will still be done. This would allow a more meaningful
comparison, although sampling errors in the survey data will be larger.
Assessment of health facility data quality: Data quality report card – Cambodia, 2011 23
Table 12: Comparison of coverage rates from surveys and from facility reports
Most recent
surveys (DHS 2010)
Facility reports (HMIS) Ratio (coverage from facility data/coverage from survey)
2009 2010 2011 2009 2010 2011
ANC2+ (revisits) 84.5% & 77.8% 72.7% 79.1% 0.92 0.86 0.94
Measles immunization
77.0%* 97.5% 114% 104% 1.27 1.48 1.36
Institutional deliveries
43.9% & (53.8%)**
44.1% 53.0% 56.3% 1.01 (0.82)**
1.21 (0.99)**
1.28 (1.05)**
* Immunized by 12 months of age
** Deliveries in public facilities (9.9% of deliveries occurred in private facilities) (with private ratios in parenthesis); & these
data refer to the 5 year period preceding the survey, i.e. 2006–2010.
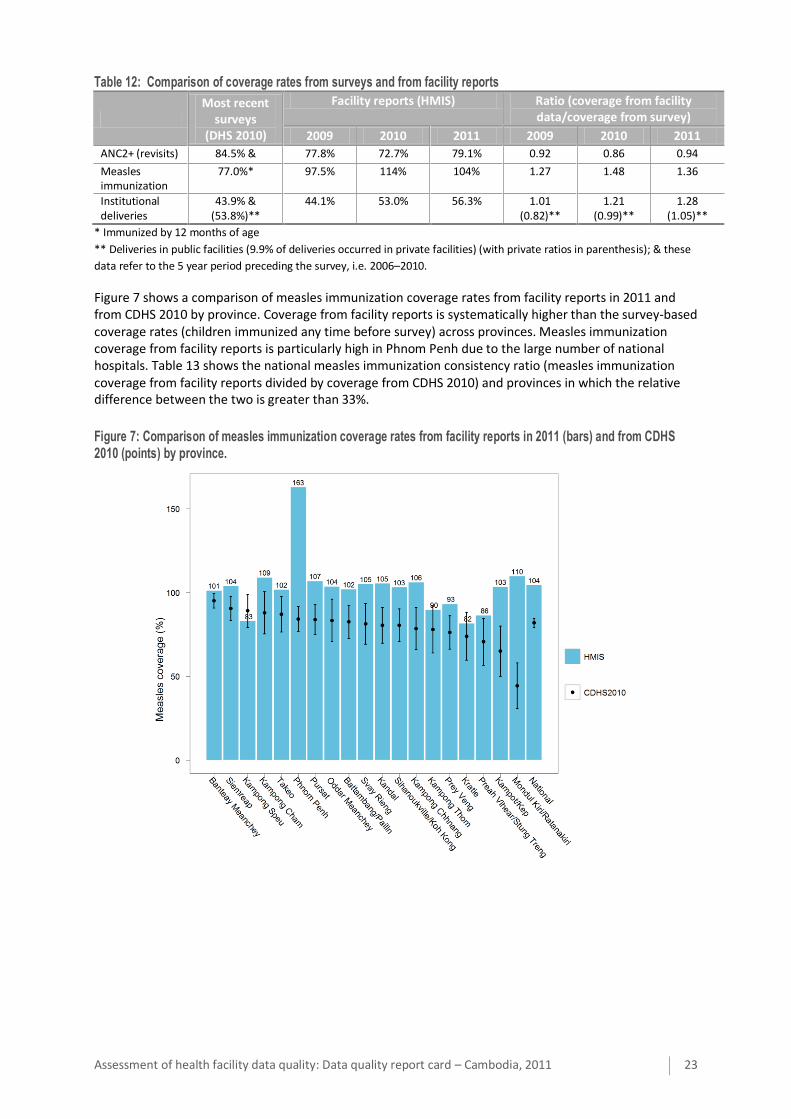
Figure 7 shows a comparison of measles immunization coverage rates from facility reports in 2011 and from CDHS 2010 by province. Coverage from facility reports is systematically higher than the survey-based coverage rates (children immunized any time before survey) across provinces. Measles immunization coverage from facility reports is particularly high in Phnom Penh due to the large number of national hospitals. Table 13 shows the national measles immunization consistency ratio (measles immunization coverage from facility reports divided by coverage from CDHS 2010) and provinces in which the relative difference between the two is greater than 33%.
Figure 7: Comparison of measles immunization coverage rates from facility reports in 2011 (bars) and from CDHS 2010 (points) by province.
24 Assessment of health facility data quality: Data quality report card – Cambodia, 2011
Table 13: Consistency ratio for measles immunization coverage rates, and provinces with very low and very high consistency ratios
2009 2010 2011
National measles consistency ratio* 1.19 1.40 1.27
Provinces with measles consistency ratio <0.67
3 (16%) Kratie, Oddar Meanchey,
Preah Vihear/Stung
Treng
0 (0%) –
0 (0%) –
Provinces with measles consistency ratio >1.33
4 (21%) Kampong Chhnang,
Kandal, Mondul
Kiri/Ratanakiri, Phnom
Penh
11 (58%) Kampong Cham,
Kampong Chhnang, Kampot/Kep, Kandal,
Mondul Kiri/Ratanakiri, National, Phnom Penh,
Prey Veng, Pursat, Siemreap,
Sihanoukville/Koh Kong
4 (21%) Kampong Chhnang,
Kampot/Kep, Mondul Kiri/Ratanakiri, Phnom
Penh
* Consistency ratios computed with immunization rate in children 12–23 months any time before survey. Note: Percentages in this table are computed for the 19 provinces or paired provinces.
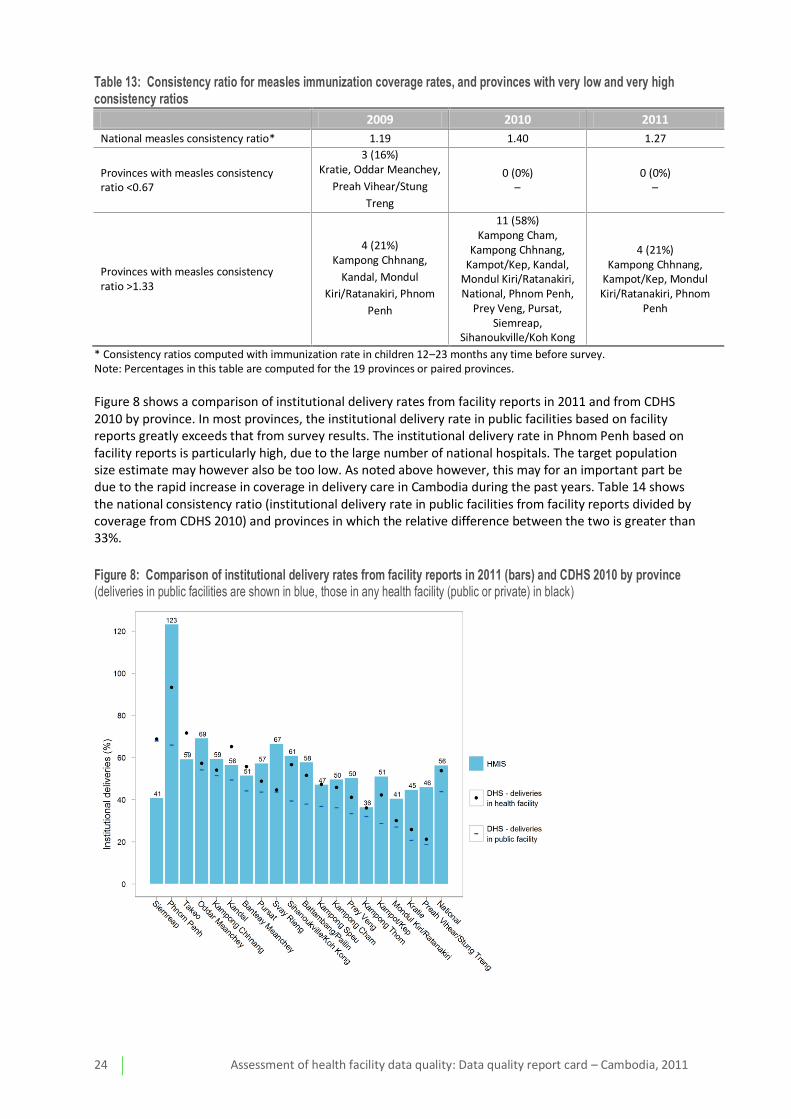
Figure 8 shows a comparison of institutional delivery rates from facility reports in 2011 and from CDHS 2010 by province. In most provinces, the institutional delivery rate in public facilities based on facility reports greatly exceeds that from survey results. The institutional delivery rate in Phnom Penh based on facility reports is particularly high, due to the large number of national hospitals. The target population size estimate may however also be too low. As noted above however, this may for an important part be due to the rapid increase in coverage in delivery care in Cambodia during the past years. Table 14 shows the national consistency ratio (institutional delivery rate in public facilities from facility reports divided by coverage from CDHS 2010) and provinces in which the relative difference between the two is greater than 33%.
Figure 8: Comparison of institutional delivery rates from facility reports in 2011 (bars) and CDHS 2010 by province (deliveries in public facilities are shown in blue, those in any health facility (public or private) in black)

Assessment of health facility data quality: Data quality report card – Cambodia, 2011 25
Table 14: Consistency ratio (facility/survey) for institutional deliveries rates in public facilities, and provinces with very low and very high consistency ratios
2009 2010 2011
National institutional delivery (public) consistency ratio
1.01 1.21 1.28
Provinces with consistency ratio <0.67 3 (16%)
Kratie, Pursat, Siemreap 1 (5%)
1 (5%) Siemreap
Provinces with consistency ratio >1.33
2 (11%) Kampot/Kep, Phnom
Penh
8 (42%) Battambang/Pailin, Kampot/Kep, Kratie, Phnom Penh, Preah
Vihear/Stung Treng, Prey Veng, Sihanoukville/Koh
Kong, Svay Rieng
10 (53%) Battambang/Pailin,
Kampong Cham, Kampot/Kep, Kratie,
Mondul Kiri/Ratanakiri, Phnom Penh, Preah
Vihear/Stung Treng, Prey Veng, Sihanoukville/Koh
Kong, Svay Rieng
* Percentages in this table are computed for the 19 provinces or paired provinces.
There are many possible reasons for discrepancies between the coverage rates from routine facility reports and from surveys. First, as noted there is true increase in the underlying coverage rate since the time of the survey. The 2010 CDHS results are data for the five years preceding the survey, when the institutional delivery rate was much lower, so it is possible that both are correct. However, this is not the case for measles immunization, as coverage rates are approximately 30% lower in CDHS 2010 than facility reports in 2009, the comparable year for immunizations. Moreover, measles immunization rates are over 100% nationally for 2010 and 2011. This is seen not just for measles, but for other immunizations as well, as shown in Table 15.
Table 15: Comparison of immunization coverage rates
Facility reports (HMIS)
January–December 2011
Most recent survey (children 12–23 months, DHS 2010)
By 12 months/any time before survey DTP1 109% 92.6%/93.1%
DTP3 106% 83.6%/84.8%
Measles immunization 104% 77.0%/81.9%
Immunization rates from facility reports that are too high can be due to a numerator that is too large or a denominator that is too small (or both). Since there is no convincing evidence from the ANC2+ or institutional deliveries coverage analysis and the population denominator analysis that the denominator at the national level is well-off, the most likely explanation is this is a numerator issue.
A numerator could be too large due to over-reporting of the number of immunizations, for example, inflating of reported numbers due to financial incentives, or systematically failing to disaggregate immunizations in children under and over the age of 1 year in reporting.
It is however necessary to further examine the denominators. It is possible that the denominator used to compute coverage rates is too small, the coverage rates would be overestimated. Since the birth rate in Cambodia has been decreasing in the past few years, it would seem more likely for the denominators to be overestimated rather than underestimated. However, it is not entirely clear how denominators for immunization and deliveries are derived for provinces and for districts, and there is the added complication of having two population projections for provinces, one from NIS based on the 2008 census, and the other from PHDs. Preliminary analysis appears to show that the number of children under 1 year of age is rather low for most provinces; this needs to be investigated in further detail.


![Australasian Health Facility GuidelinesB-0490] Hospital Mortuary Autopsy Unit.pdfAustralasian Health Facility Guidelines Part B - Health Facility Briefing and Planning Page 2 490 -](https://img.pdfslide.us/doc/110x75/5e4f9c42cfcca74e640bc848/australasian-health-facility-guidelines-b-0490-hospital-mortuary-autopsy-unitpdf.jpg)