Embed Size (px)
Citation preview

Data Production and Provenance
Being an Exploration of the Mathematical Plumbing Required to Track Provenance
in the Sense of Production History, as well as Custodianship and Intellectual Property Rights Transfer, with a Touch
of How to Organize Error Budgets
- Bruce R. BarkstromUnaffiliated

Outline
Industrial Data Production High Throughput and High Regularity Use of Directed Acyclic Graphs to Plan,
Control, and Describe Provenance Tracking <==> DAG Traversal
High-Variability Workflow Production High Human Interaction and Low Regularity Versioning and Provenance More Difficult
Custodianship and IPR Transfer Graphs Using Graphs for Error Propagation

Satellite and In-Situ Data Production Characteristics
Numbers of Files Produced Per DayMODIS : 5 minutes per file
300 files per day per spectral channel Number of Jobs Per Day
MODIS : 104 or more jobs per dayCERES : 0.5 X 10⁴ Jobs Per Day
At 5,000 jobs per day, each job can only take about 1/3 minute before the next arrives:
No time for detailed examination or human choice

Impact of Production Pressure – Standardize Code
Write Code for Jobs, Minimizing Variability from One Job to Another
program ProcessData(DataFileName, CoefficientFileName, ProcessedFileName);
beginOpenAndRead(CoefficientFile);OpenAndRead(DataFile);... [Do stuff];CreateAndWrite(ProcessedDataFile);
end ProcessData;

Impact of Production Pressure – Automate Control
Use Scripts to Provide Variable Connection to Production Configuration
#!perl.exefor i in 1 .. NumberOfJobs loop
./ProcessData DataFile(i) CalibrationFile ProcessedFile(i)end loop;
In a Single Execution Loop Single executable (ProcessData) Parametrized File Identifiers
Standardized Relationship Between Executable, Input Files, Output Files

Converting Words to Math
Each executable runs as a “job” - represented as an ellipse
Each job ingests files and creates them – file represented as a box
Graph Representation: Vertices (jobs or files) Edges (connections
between vertices) Edges for production
are Directed

Real Production Connects Multiple Kinds of Jobs and Files (Bigger Graph)
Typical Sequence: Raw Data ->
Geolocated and Calibrated Data;
Geoloc & Cal Data -> Geophysical Interpreted Data;
Geophys Data -> Averaged Data
Time Dependence in Raw Data Modulated by Later Production Jobs(Sequences of Daily Files appear as Rows of Boxes)

Versioning Adds More Nodes
Changes can appear because Source Code (Algorithm) Changes Coefficient Changes Changes in Input Data
(Cascade of Changes) Changes in Machines or Production Control
No Topological Change to Graph – Just More Nodes
Total Production Graph
Provenance Tracking
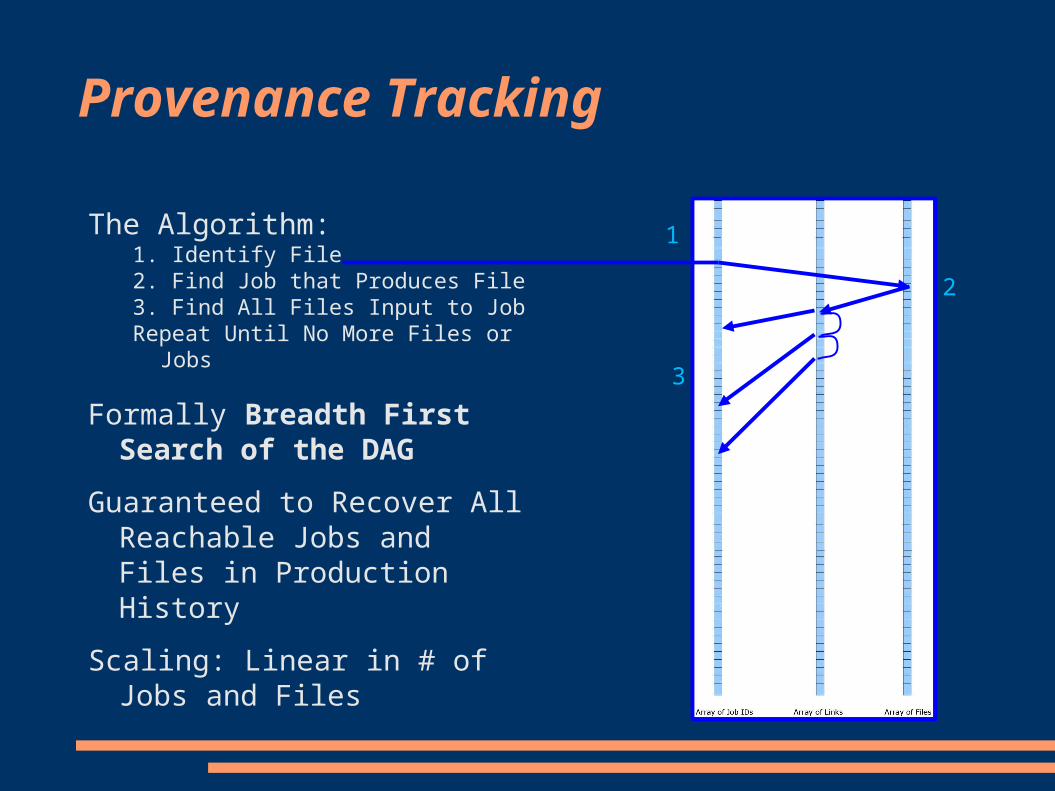
The Algorithm:1. Identify File2. Find Job that Produces File3. Find All Files Input to JobRepeat Until No More Files or
Jobs
Formally Breadth First Search of the DAG
Guaranteed to Recover All Reachable Jobs and Files in Production History
Scaling: Linear in # of Jobs and Files
1
3
2

Example 1: Single Data Day Geolocation and Calibration
Production for single day of Level 1 Data:
Raw Data at top Earth Geoid and DEM Compilation and Linking Cal Coefficients Execution “Script” Job Run Output File at bottom
Data Day, Versions, Input Files, and Execution Script match

Example 2: Single Data Day Geophysical Interpretation
Important Dependencies of Level 2 Data – Version 2
Level 1 (Geoloc & Cal) – Version 2
Geophysical Interpretation Code
Execution Script Coordination
Matching of Versions through tracked production history
Importance of Provenance Tracking
Ability to identify which data sources were (or were not) included
Important for “Hockey Stick Controversy” FOIA and Congressional Investigation
Identification of (or exclusion of) particular error sources
Reduction of diagnostic “misinterpretation” by data users unfamiliar with data production
Quantification of Impact of Production Problems
Requires use of algorithm variant – same basic logic, but reverse direction of search
Relational Database vs Code
Graph Traversal Not Well-Suited to RDBMS Normal SQL query produces a single result set Graph Traversal requires an indeterminate number
of query iterations- or -
Graph Traversal uses recursive table queries (not allowed in standard SQL)
Table Joins known to be computationally expensive Code for Graph Traversal Algorithm
~2 to 3 pages Linear Scaling of Computational Expense
with number of (files + jobs)

Thoughts on Graphical Workflow Engines
Context Difference in Tool Use GWEs of greater use in exploration
e.g. Validation and Calibration GWEs designed for human use with
high variability in scenarios, visualization of results
Provenance Tracking that includes “script editing” valuable
Interest in data elements within files, not just packaged data collections

Enthusiasm Control for GWEs
GWEs are not designed for high throughput data production
For intelligent use, users need to select data and processes carefully – in sessions longer than what high throughput will allow
DAG is fundamental structure for production GWEs may use recursive operations on file Provenance tracking then equivalent to transaction auditing Versioning is difficult and potentially irregular
Scaling of GWE provenance tracking may be NP-hard (exponential increase in computational cost with number of files and jobs) [Buneman, Kanna, and Tan, 2002]
Custodianship
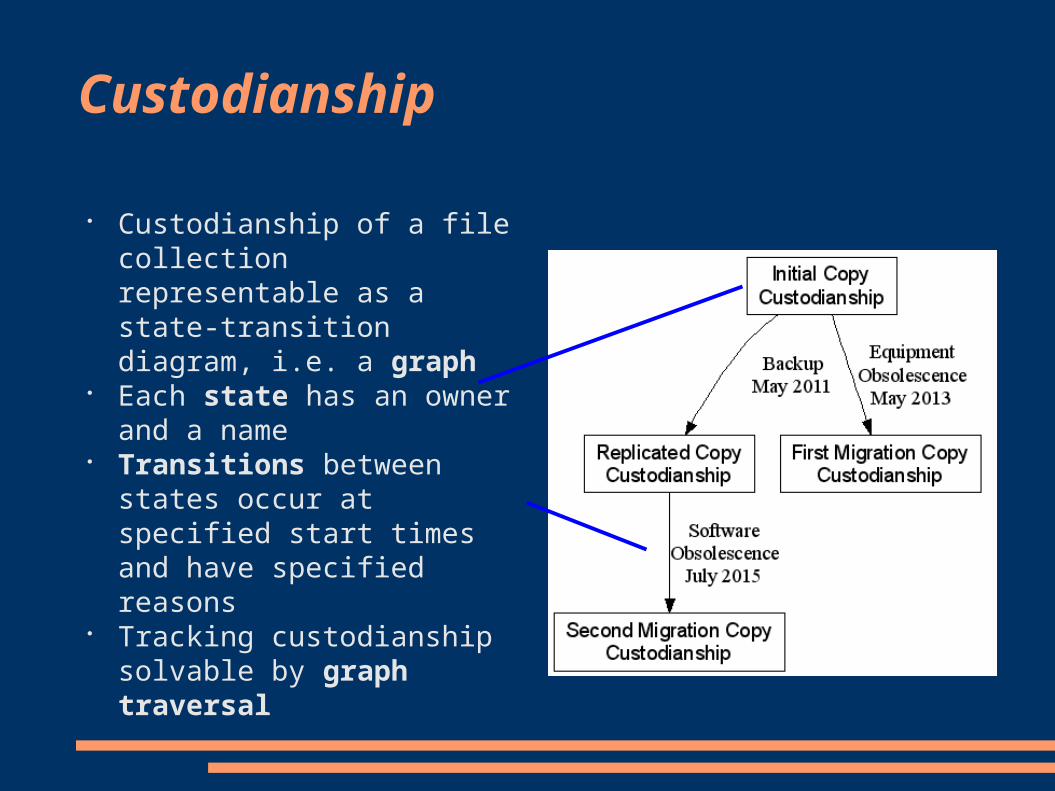
Custodianship of a file collection representable as a state-transition diagram, i.e. a graph
Each state has an owner and a name
Transitions between states occur at specified start times and have specified reasons
Tracking custodianship solvable by graph traversal
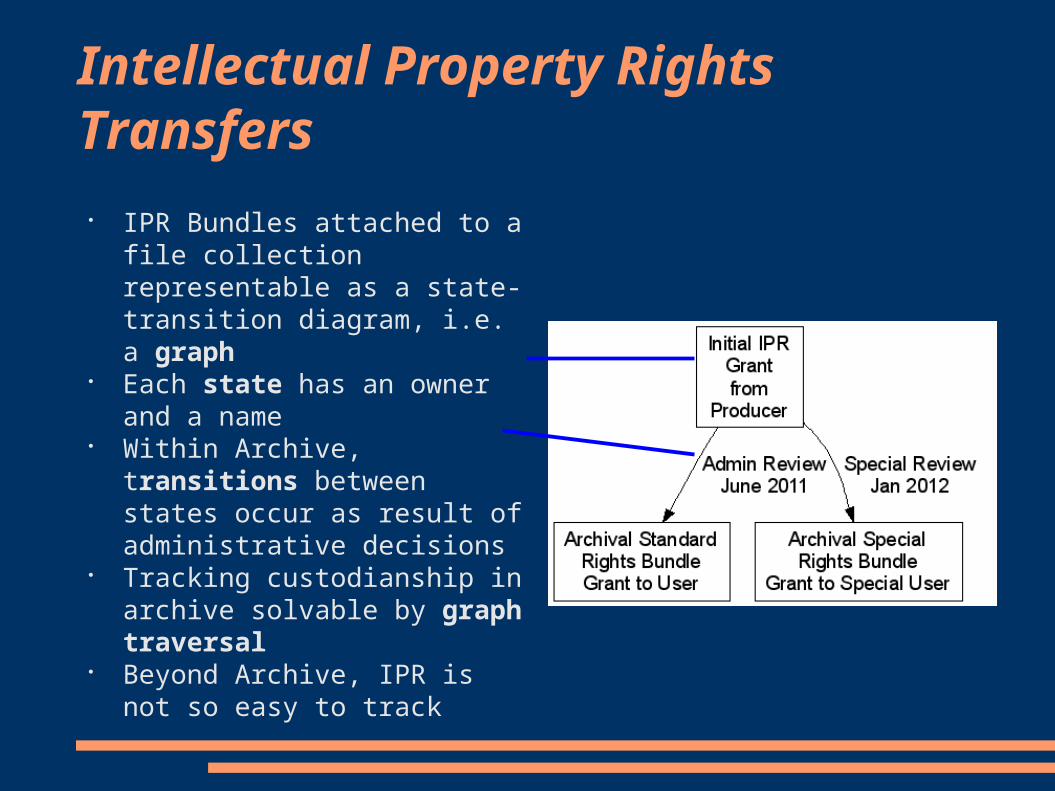
Intellectual Property Rights Transfers
IPR Bundles attached to a file collection representable as a state-transition diagram, i.e. a graph
Each state has an owner and a name
Within Archive, transitions between states occur as result of administrative decisions
Tracking custodianship in archive solvable by graph traversal
Beyond Archive, IPR is not so easy to track

A Note on Error Propagation Studies
Removing details from files and jobs gives a Data Flow Diagram
Files -> Data Products Jobs -> Algorithm Families
Algorithm Families are generic error sources and uncertainty modifiers
Note: Data Flow Diagrams can organize studies of data product error and uncertainty

Practical Comments
For data produced now Production control already provides data for
provenance tracking – just needs collection For data produced in past
Data for provenance tracking (and understanding) may not exist
Attempt to collect provenance information where it exists
Evaluate and record the state of missing provenance information