Embed Size (px)
Citation preview
Data Preprocessing
Dr. Bernard Chen Ph.D.University of Central Arkansas
Fall 2010
Outline Introduction Descriptive Data Summarization Data Cleaning
Missing value Noise data
Data Integration Redundancy
Data Transformation
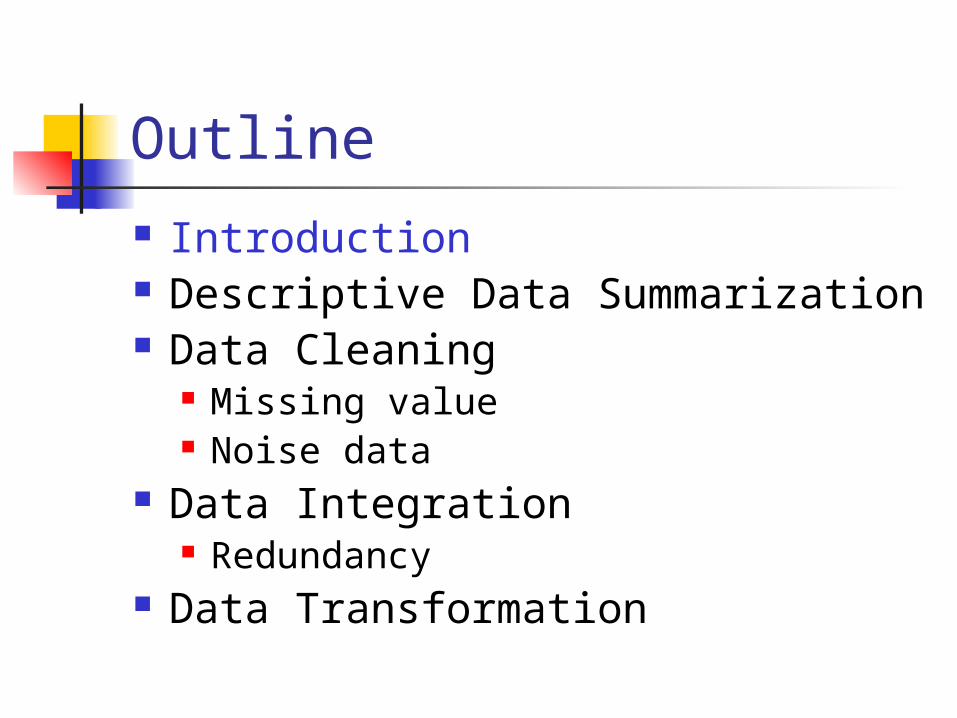
Knowledge Discovery (KDD) Process
Data mining—core of knowledge discovery process
Data Cleaning
Data Integration
Databases
Data Warehouse
Task-relevant Data
Selection
Data Mining
Pattern Evaluation
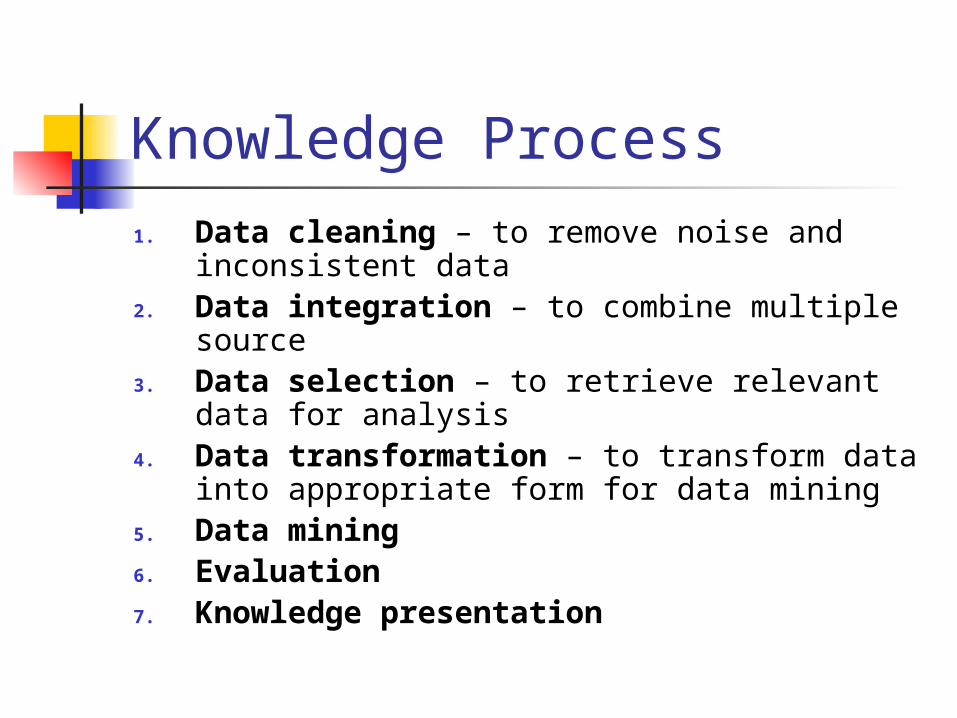
Knowledge Process1. Data cleaning – to remove noise and
inconsistent data2. Data integration – to combine multiple
source 3. Data selection – to retrieve relevant data
for analysis4. Data transformation – to transform data
into appropriate form for data mining5. Data mining6. Evaluation7. Knowledge presentation
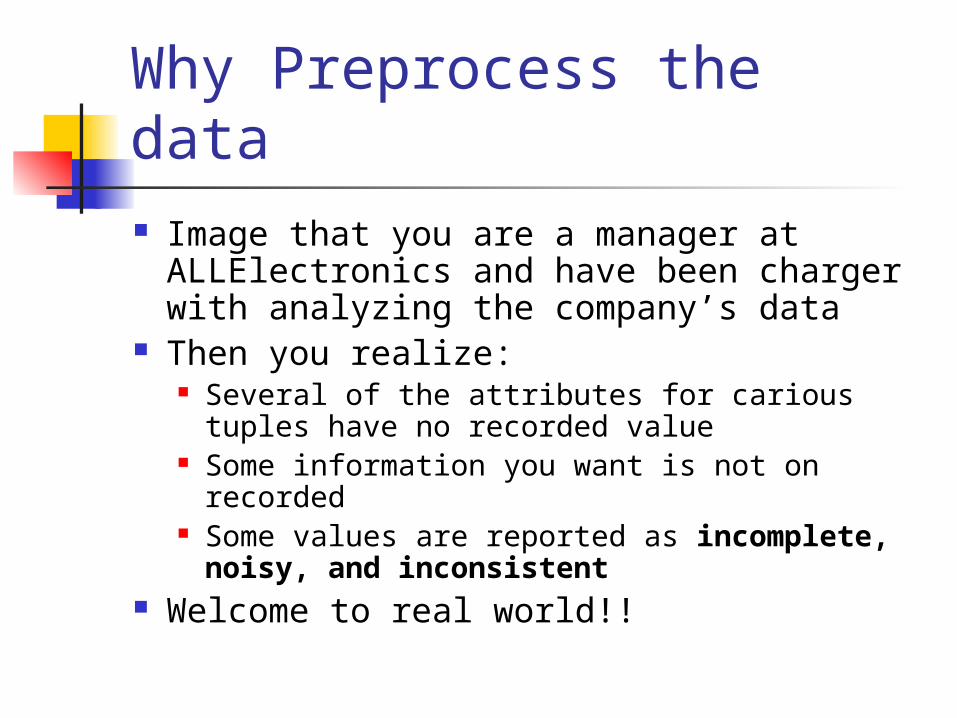
Why Preprocess the data Image that you are a manager at
ALLElectronics and have been charger with analyzing the company’s data
Then you realize: Several of the attributes for carious tuples
have no recorded value Some information you want is not on recorded Some values are reported as incomplete,
noisy, and inconsistent Welcome to real world!!
Why Data Preprocessing?
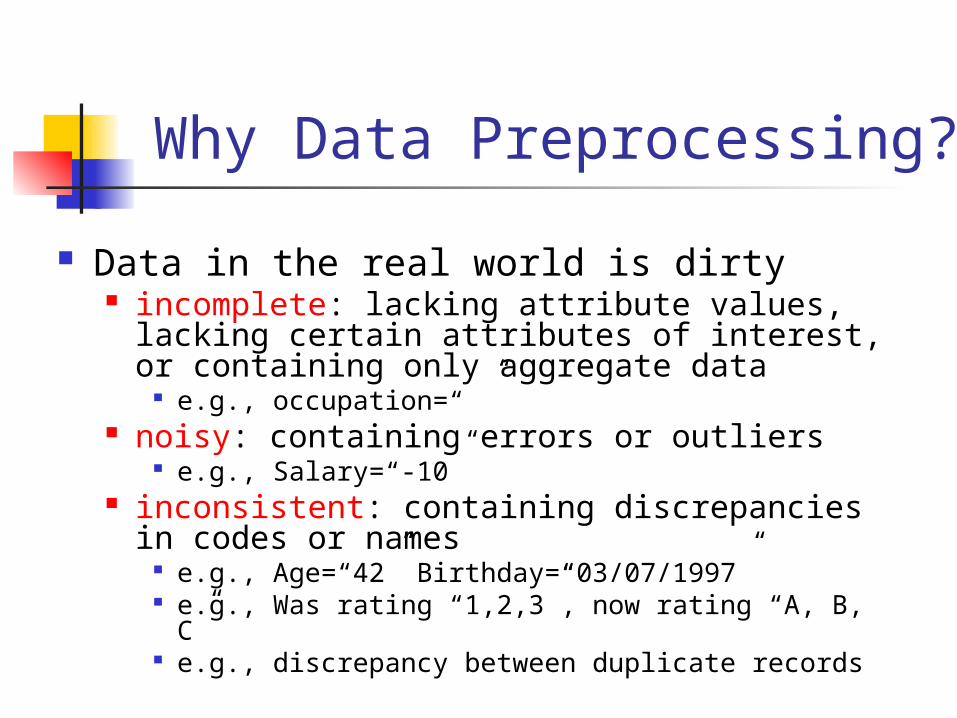
Data in the real world is dirty incomplete: lacking attribute values, lacking
certain attributes of interest, or containing only aggregate data
e.g., occupation=“ ” noisy: containing errors or outliers
e.g., Salary=“-10” inconsistent: containing discrepancies in codes
or names e.g., Age=“42” Birthday=“03/07/1997” e.g., Was rating “1,2,3”, now rating “A, B, C” e.g., discrepancy between duplicate records
Why Is Data Dirty?
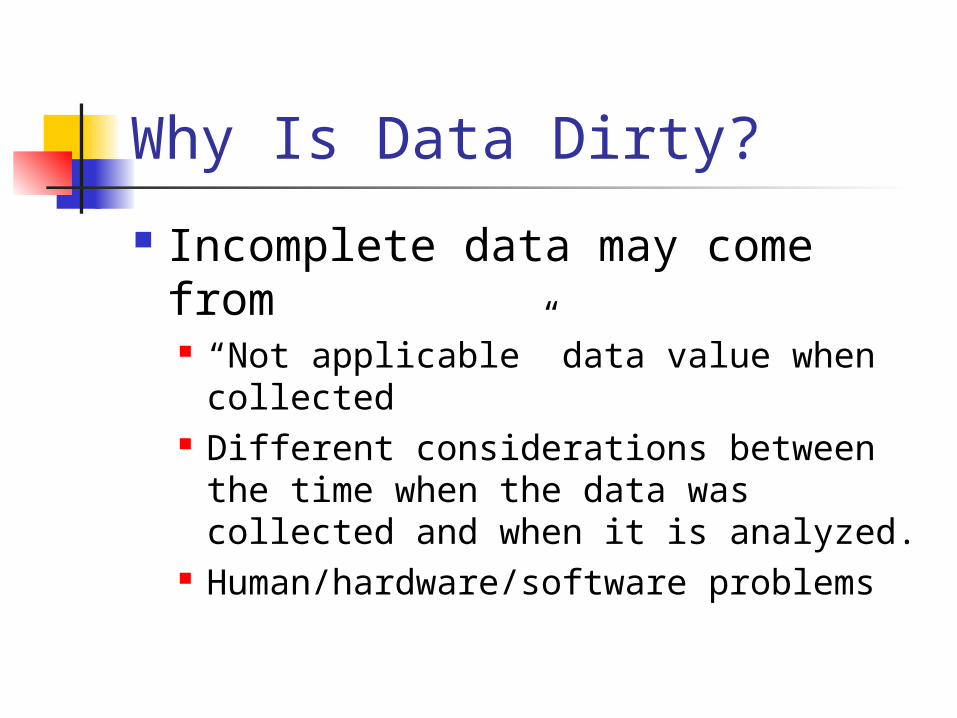
Incomplete data may come from “Not applicable” data value when
collected Different considerations between the
time when the data was collected and when it is analyzed.
Human/hardware/software problems
Why Is Data Dirty?
Noisy data (incorrect values) may come from Faulty data collection instruments Human or computer error at data
entry Errors in data transmission
Why Is Data Dirty?
Inconsistent data may come from Different data sources Functional dependency violation (e.g.,
modify some linked data)
Duplicate records also need data cleaning
Why Is Data Preprocessing Important?
No quality data, no quality mining results! Quality decisions must be based on quality
data e.g., duplicate or missing data may cause
incorrect or even misleading statistics.
Data extraction, cleaning, and transformation comprises the majority of the work of building a data warehouse
Major Tasks in Data Preprocessing Data cleaning
Fill in missing values, smooth noisy data, identify or remove outliers, and resolve inconsistencies
Data integration Integration of multiple databases, data cubes, or files
Data transformation Normalization and aggregation
Data reduction Obtains reduced representation in volume but
produces the same or similar analytical results
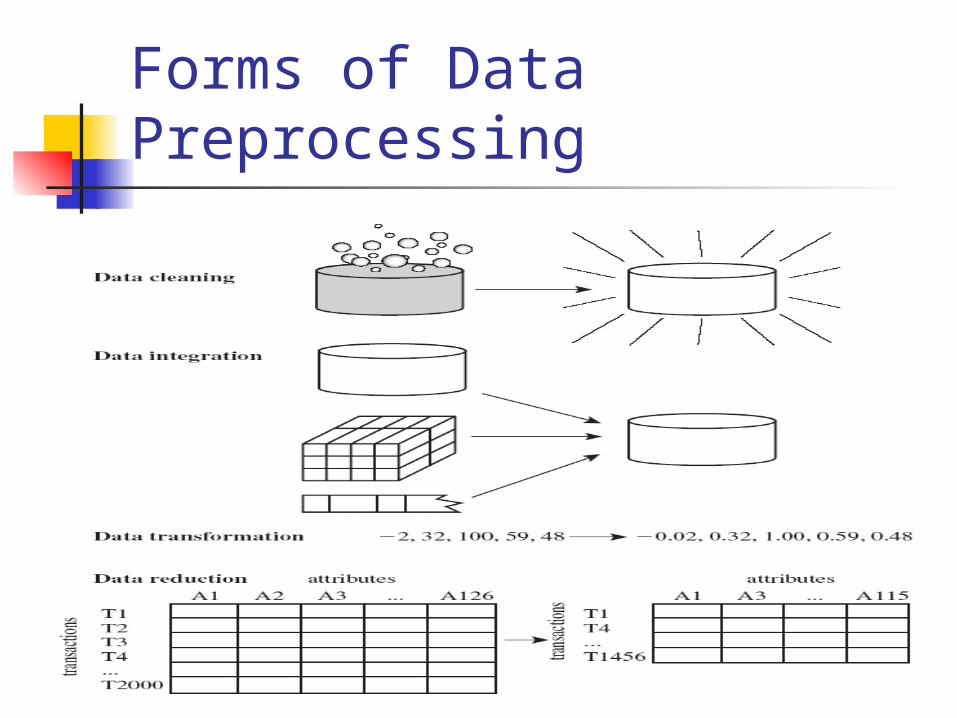
Forms of Data Preprocessing
Outline Introduction Descriptive Data Summarization Data Cleaning
Missing value Noise data
Data Integration Redundancy
Data Transformation
Descriptive data summarization
Motivation To better understand the data:
central tendency, variation and spread
Data dispersion characteristics median, max, min, quantiles, outliers,
variance, etc.
Descriptive data summarization
Numerical dimensions correspond to sorted intervals Data dispersion: analyzed with
multiple granularities of precision Boxplot or quantile analysis on sorted
intervals
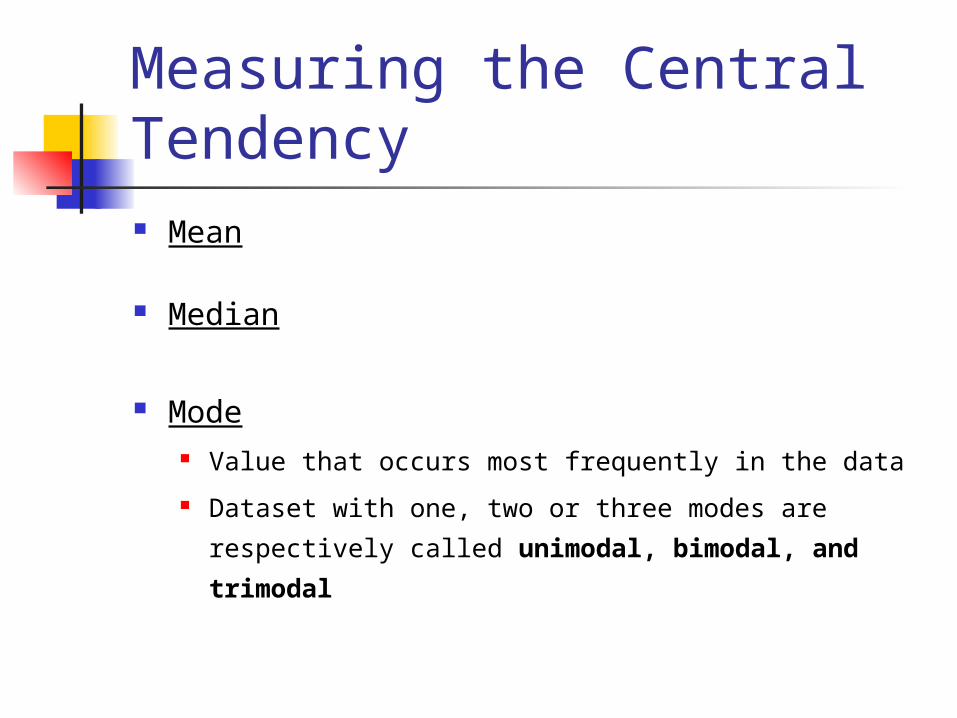
Measuring the Central Tendency Mean
Median
Mode Value that occurs most frequently in the data
Dataset with one, two or three modes are
respectively called unimodal, bimodal, and
trimodal
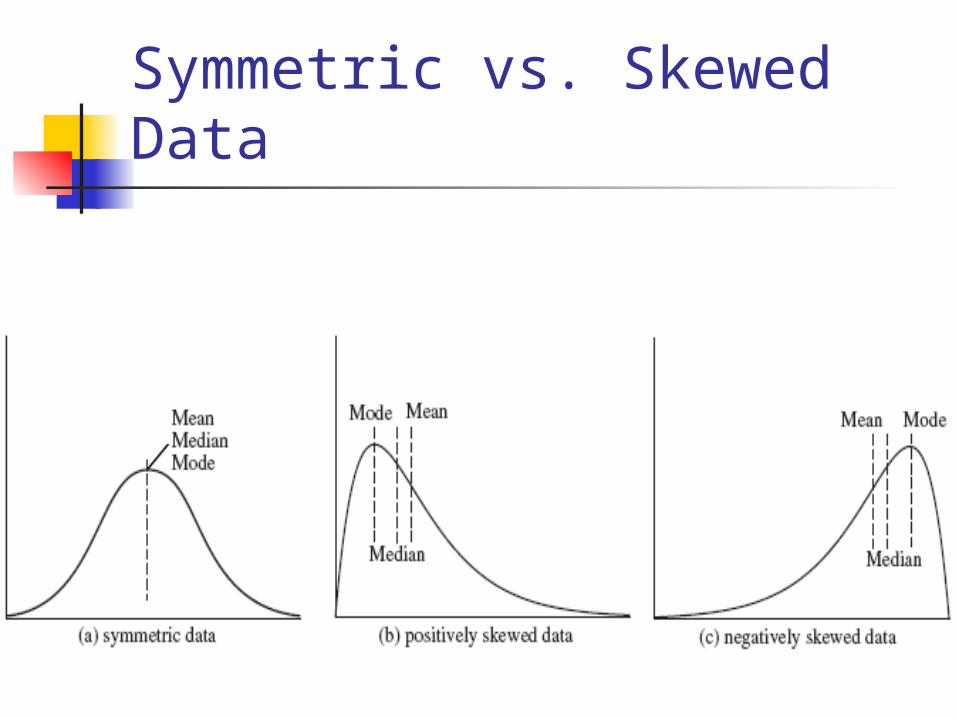
Symmetric vs. Skewed Data
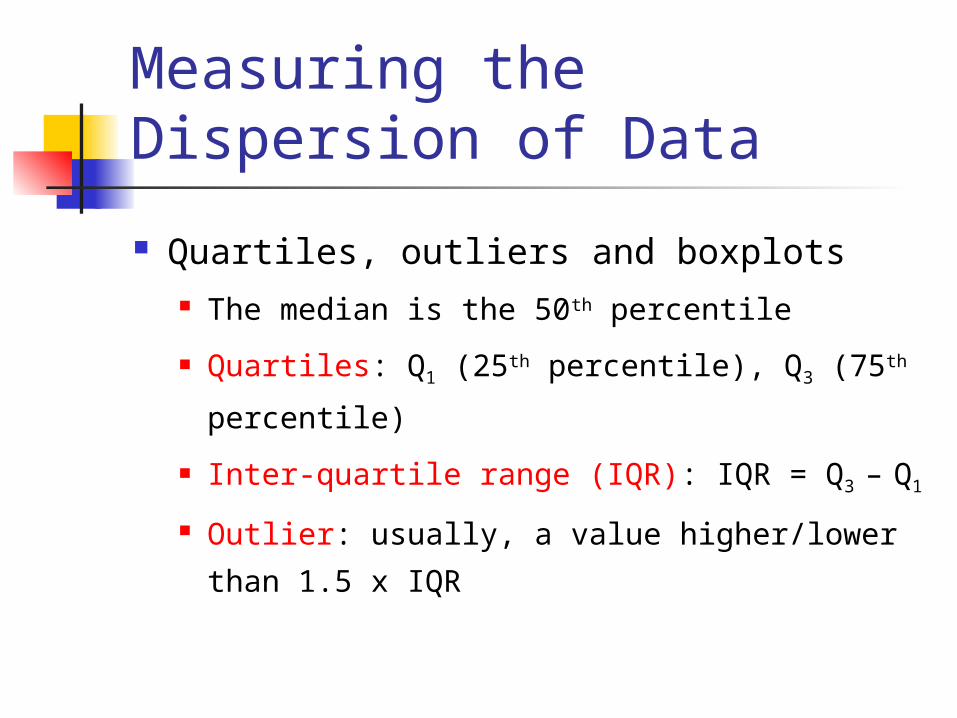
Measuring the Dispersion of Data
Quartiles, outliers and boxplots The median is the 50th percentile
Quartiles: Q1 (25th percentile), Q3 (75th
percentile)
Inter-quartile range (IQR): IQR = Q3 – Q1
Outlier: usually, a value higher/lower than
1.5 x IQR
Boxplot Analysis
Five-number summary of a distribution:Minimum, Q1, M, Q3, Maximum
Boxplot Data is represented with a box The ends of the box are at the first and third
quartiles, i.e., the height of the box is IRQ The median is marked by a line within the box Whiskers: two lines outside the box extend to
Minimum and Maximum
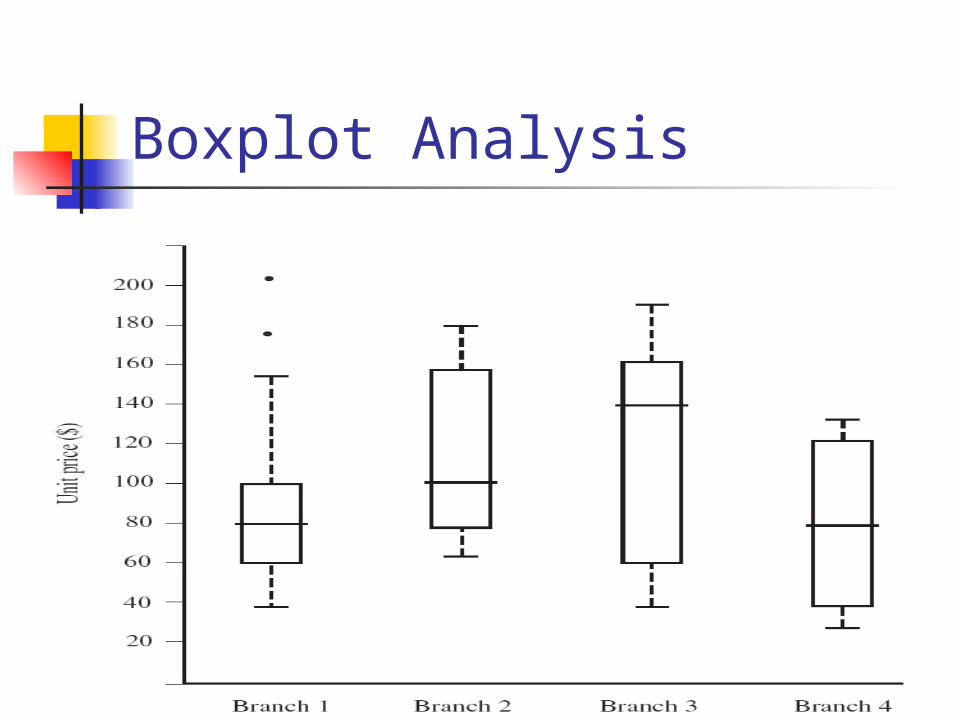
Boxplot Analysis
Histogram Analysis
Graph displays of basic statistical class descriptions Frequency histograms
A univariate graphical method Consists of a set of rectangles that reflect
the counts or frequencies of the classes present in the given data
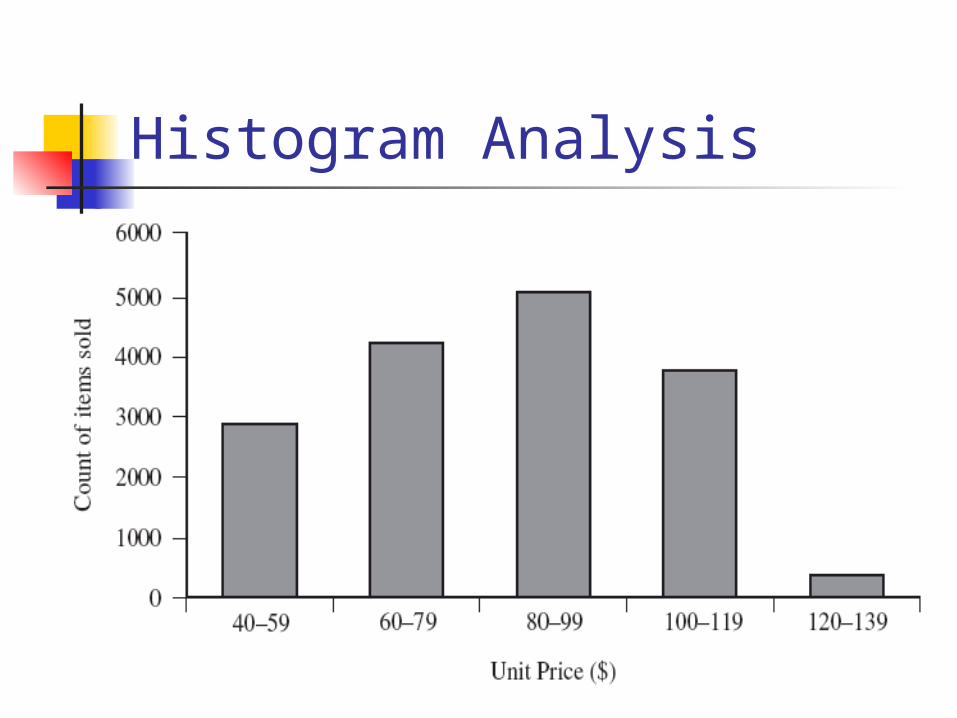
Histogram Analysis
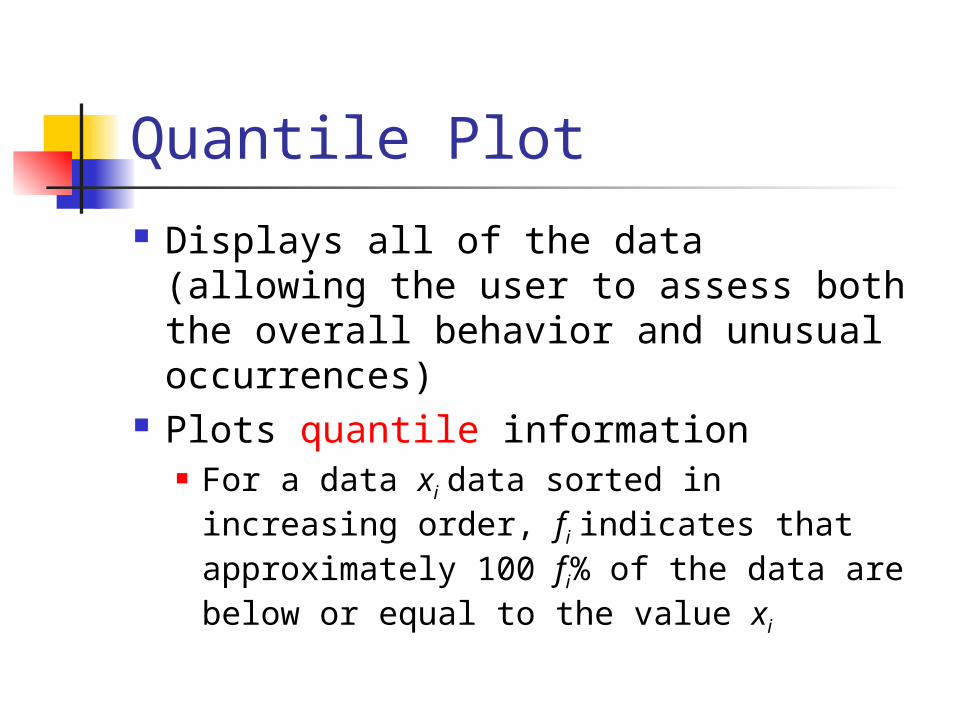
Quantile Plot
Displays all of the data (allowing the user to assess both the overall behavior and unusual occurrences)
Plots quantile information For a data xi data sorted in increasing
order, fi indicates that approximately 100 fi% of the data are below or equal to the value xi
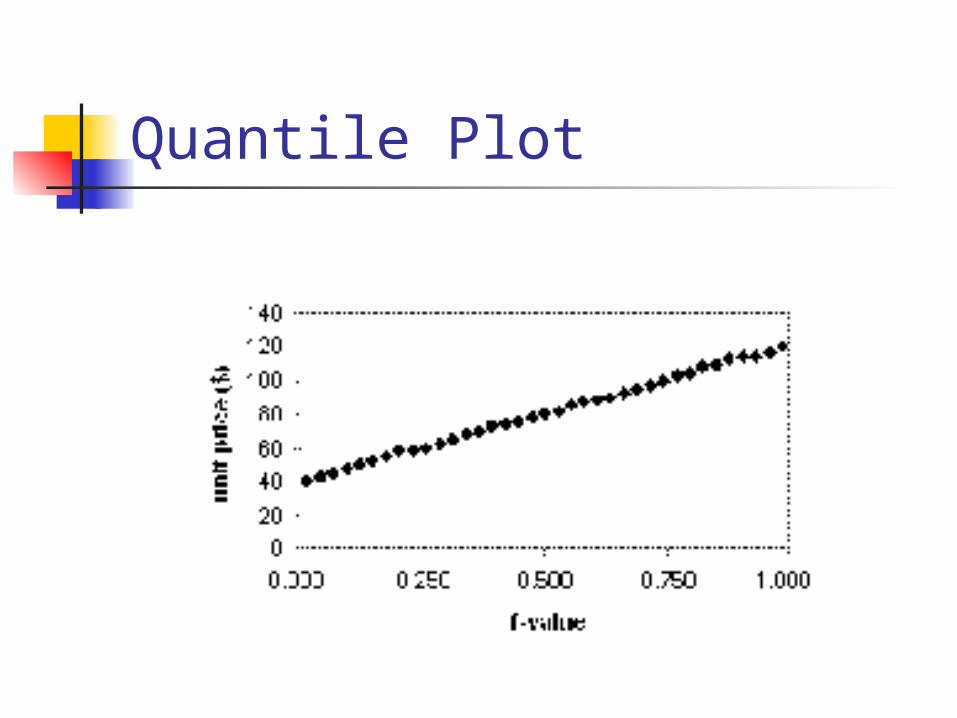
Quantile Plot