Embed Size (px)
Citation preview

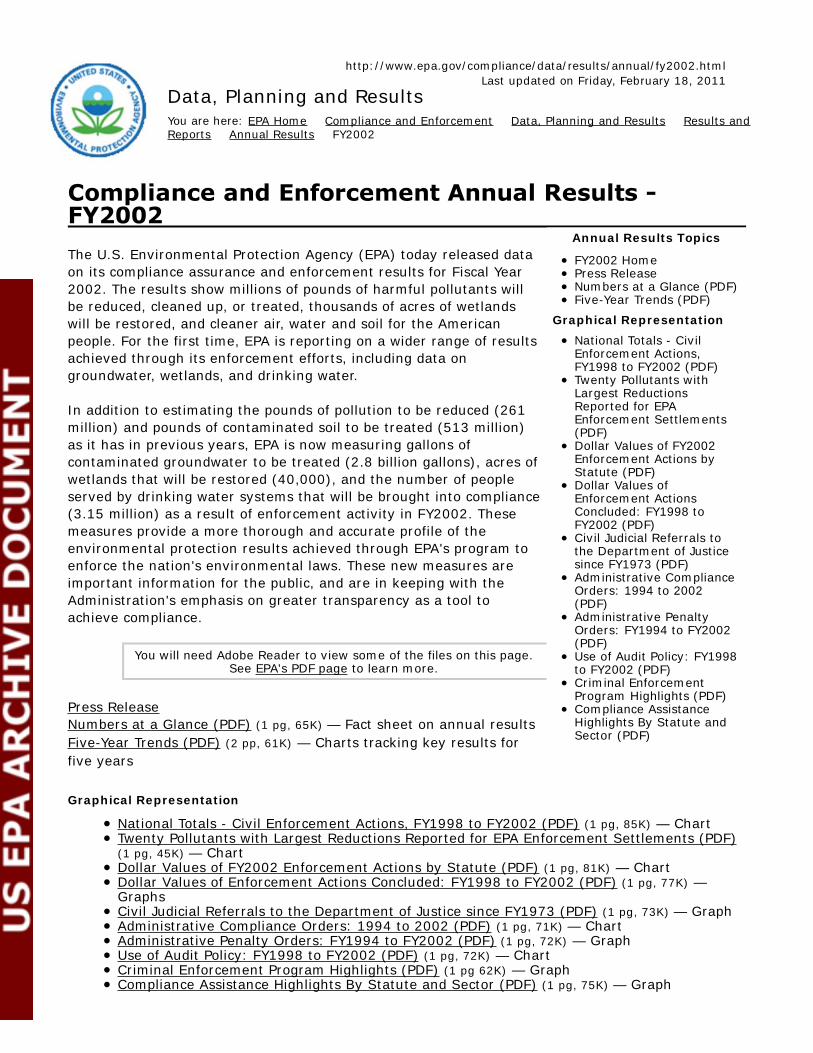
http://www.epa.gov/compliance/data/results/annual/fy2002.html Last updated on Friday, February 18, 2011
Data, Planning and Results You are here: EPA Home Compliance and Enforcement Data, Planning and Results Results and Reports Annual Results FY2002
The U.S. Environmental Protection Agency (EPA) today released data on its compliance assurance and enforcement results for Fiscal Year 2002. The results show millions of pounds of harmful pollutants will be reduced, cleaned up, or treated, thousands of acres of wetlands will be restored, and cleaner air, water and soil for the American people. For the first time, EPA is reporting on a wider range of results achieved through its enforcement efforts, including data on groundwater, wetlands, and drinking water.
In addition to estimating the pounds of pollution to be reduced (261 million) and pounds of contaminated soil to be treated (513 million) as it has in previous years, EPA is now measuring gallons of contaminated groundwater to be treated (2.8 billion gallons), acres of wetlands that will be restored (40,000), and the number of people served by drinking water systems that will be brought into compliance (3.15 million) as a result of enforcement activity in FY2002. These measures provide a more thorough and accurate profile of the environmental protection results achieved through EPA's program to enforce the nation's environmental laws. These new measures are important information for the public, and are in keeping with the Administration's emphasis on greater transparency as a tool to achieve compliance.
Annual Results Topics
FY2002 Home Press Release Numbers at a Glance (PDF) Five-Year Trends (PDF)
Graphical Representation
National Totals - Civil Enforcement Actions, FY1998 to FY2002 (PDF) Twenty Pollutants with Largest Reductions Reported for EPA Enforcement Settlements (PDF) Dollar Values of FY2002 Enforcement Actions by Statute (PDF) Dollar Values of Enforcement Actions Concluded: FY1998 to FY2002 (PDF) Civil Judicial Referrals to the Department of Justice since FY1973 (PDF) Administrative Compliance Orders: 1994 to 2002 (PDF) Administrative Penalty Orders: FY1994 to FY2002 (PDF)
You will need Adobe Reader to view some of the files on this page. Use of Audit Policy: FY1998 See EPA's PDF page to learn more. to FY2002 (PDF)
Criminal Enforcement Program Highlights (PDF)
Press Release Compliance Assistance Numbers at a Glance (PDF) (1 pg, 65K) — Fact sheet on annual results Highlights By Statute and
Sector (PDF) Five-Year Trends (PDF) (2 pp, 61K) — Charts tracking key results for five years
Graphical Representation
National Totals - Civil Enforcement Actions, FY1998 to FY2002 (PDF) (1 pg, 85K) — Chart Twenty Pollutants with Largest Reductions Reported for EPA Enforcement Settlements (PDF) (1 pg, 45K) — Chart Dollar Values of FY2002 Enforcement Actions by Statute (PDF) (1 pg, 81K) — Chart Dollar Values of Enforcement Actions Concluded: FY1998 to FY2002 (PDF) (1 pg, 77K) — Graphs Civil Judicial Referrals to the Department of Justice since FY1973 (PDF) (1 pg, 73K) — Graph Administrative Compliance Orders: 1994 to 2002 (PDF) (1 pg, 71K) — Chart Administrative Penalty Orders: FY1994 to FY2002 (PDF) (1 pg, 72K) — Graph Use of Audit Policy: FY1998 to FY2002 (PDF) (1 pg, 72K) — Chart Criminal Enforcement Program Highlights (PDF) (1 pg 62K) — Graph Compliance Assistance Highlights By Statute and Sector (PDF) (1 pg, 75K) — Graph

Annual Results by Fiscal Year: FY2010 | FY2009 | FY2008 | FY2007 | FY2006 | FY2005 | FY2004 | FY2003 | FY2002 | FY2001 | FY2000 | FY1999

U.S. Environmental Protection Agency Enforcement and Compliance Program
Numbers at a Glance Fiscal Year 2002
EPA Inspections 17,668 Civil Referrals to the Department of Justice 342 Civil Judicial Settlements 216 Civil Judicial Penalties $55,571,404 Value of Injunctive Relief $3,931,931,345 Value of Supplemental Environmental Projects $56,458,594 Facilities Self Disclosing Violations 927 Companies Self Disclosing Violations 500 Administrative Penalty Order Complaints 1441 Administrative Compliance Orders 1,251 Total Entities Reached by Compliance Assistance 589,566 Administrative Penalties $25,766,401 Criminal Penalties $62,252,318 Criminal Referrals 250 Criminal Sentences (Years) 215 Defendants Charged 325 Criminal Cases Initiated 674 Estimated Pounds of Pollutants Reduced 261,000,000 Pounds of Contaminated Soil to be Reduced 513,000,000 Gallons of Contaminated Groundwater To Be Treated 2,800,000,000 Acres of Wetlands To Be Restored 40,000 Individuals Served by Drinking Water Systems To Be Brought into 3,150,000
Compliance Superfund Cleanup Enforcement
Private Party Commitments $627 Million Orphan Share Compensation Offers $12.5 Million De minimis Settlements/Parties 20/1,600 Parties
January 29, 2003 (4:44pm)

U.S. Environm ental Prote ction Age ncyEnforcement and Com plia nce Program
Numbe rs at a Glance Fiscal Years 2002-1998
FY02 FY01 FY00 FY99 FY98
EPA Inspect ions A17,668 17,560 20,417 21,847 23,237
Civ il Ref errals to the Department of Just ice
342 327 368 403 411
Civi l Judicial Sett lements 216 221 219 215 253
Value of Injunct iv e Relief $3,931,931,345 $4,453,961,458 $1,562,824,364 $3,424,223,733 $1,978,686,766
Judicial Penalties $55,571,404 $101,683,157 $54,851,765 $141,211,765 $63,531,731
Administrativ e Penalties $25,766,401 $23,782,264 $29,258,502 $25,509,879 $28,263,762
Value of Supplemental Environmental Projects
$56,458,594 $89,114,956 $55,888,396 $236,768,552 $90,836,361
Criminal Referrals to Department of Just ice
250 256 236 241 266
Cr iminal Sentences (years) 215.9 256 146.2 208.3 172.9
Def endants Charged 325 372 360 324 350
Criminal Cases Initiated B674 482 477 471 636
Criminal Penalties $62,252,318 $94,726,283 $121,974,488 $61,552,874 $92,800,711
Facilities Self Disclos ing Vio lat ions
927 1,095 C 2,190 990 954
Com panies Self D isclosing Violations
500 397 429 260 200
Administrat ive Penalty Order Complaints
1,441 1,582 1,763 1,654 1,400
Administrativ e ComplianceOrders
1,251 1,494 D 3,388 1,516 1,721
Total Entities Reached by Compliance Assistance
589,566 551,340 351,287 333,108 246,596
Estimat ed Pounds of Pollutants To Be Reduced
261,000,000 660,000,000 335,000,000 E6,800,000,000 629,000,000
Pounds of Contam inated Soil To Be Treated
513,000,000 1,800,000,000 1,300,000,000 574,000,000 n/a
Gallons of C ontaminated Groundwater To Be Treated
2,800,000,000
Acres of Wetlands To Be Rest ored
40,000
Indiv iduals Served by Drinking Water Sy stem s To Be Brought into Compliance
3,150,000

U.S. Environm ental Prote ction Age ncyEnforcement and Com plia nce Program
Numbe rs at a Glance Fiscal Years 2002-1998
FY02 FY01 FY00 FY99 FY98
Superfund C leanup Enf orcement
Priv ate Party Commitments
$627 Million Over $1.7 billion
Over $1.4 billion
Orphan Share Com pensa tion Of f ers
$12.5 Million Over $22.9
million
More than $19.1
billion
De minimis
Settlements /Parties
20/1,600
Parties
15/Ov er 1,900
AIn FY2002, OECA adopted a new policy for counting CAA inspec tions. Under the previous c ounting method, ‘02 inspec tions w ould be over 18,000. BFY02 includes 190 counter-ter rorism initiations. CThe increas e in fac ilities involved in Audit Policy settlements w as due, largely in part, to the Agency 's ef for ts to encourage c orporations w ith multiple facilities to conduc t corporate-w ide audits and develop corporate compliance sys tems. EPA reached
corporate-w ide agreements w ith the telecommunications and iron and steel sectors. DThe significant number of administrative settlements in FY 2001 w as due to the first
time enforcement of a new Safe Drinking Water Ac t requirement to submit Consumer Confidence Reports, dr inking w ater quality reports fo r consumers . EIn FY99, EPA’s s ett lement w ith s even major dies el engine manufac turers to resolve
claims that they installed illegal computer sof tw are on heavy duty diesel engines
resulted in millions of tons of harmf ul nitrogen ox ide (NOx) emiss ions reduced.
January 30, 2003 (2:00pm)

National Totals - EPA Civil Enforcement Activity, FY 1998 - FY 2002
EPA Inspections
FY 1998 FY 1999 FY 2000 FY 2001 FY 2002
23,237 21,847 20,417 17,560 17668*
* In FY02 OECA adopted a new policy for counting CAA inspections. Under the previous method, '02 inspections would exceed 18,000.
EPA Administrative Penalty Order Complaints
FY 1998 FY 1999 FY 2000 FY 2001 FY 2002
1,400 1,654 1,763 1,582 1,441
EPA Civil Judicial New Referrals to DOJ
EPA Administrative Non-Penalty Orders - Cases Concluded
FY 1998 FY 1999 FY 2000 FY 2001 FY 2002
1,721 1,516 3388* 1,494 1,251
The significant number of FY02 administrative settlements was due to 1st time enforcement of a new SDWA requirement to submit Consumer Confidence Reports (drinking water quality reports for consumers).
EPA Administrative Penalty Order Settlements
FY 1998 FY 1999 FY 2000 FY 2001 FY 2002
1,245 1,358 1,730 1,584 1,279
EPA Civil Judicial Settlements
FY 1998 FY 1999 FY 2000 FY 2001 FY 2002
411 403 368 327 342
FY 1998 FY 1999 FY 2000 FY 2001 FY 2002
253 215 219 221 216
OECA/OC/EPTDD/IUTB Source: MOS Reports, ICIS November 14, 2002 January 14, 2003

Twenty Pollutants with the Largest Reductions* Reported for EPA Enforcement Settlements FY 2002
Pollutant Lbs. Reduced Sulfur Dioxide (SO2) 37,344,000 Total Suspended Solids 22,254,198 Nitrogen 16,240,325 Volatile Organic Compounds 11,790,625 Ammonia 6,473,000 BOD 5,536,281 Lead 5,175,439 Nitrogen Oxides (NOX) 4,217,904 Crude Oil 3,511,182 Particulate Matter 2,727,274 Oil and Grease 2,616,329 Electroplating Treatment Sludge 2,414,960 Sulfuric Acid 1,092,423 Fluoride 946,666 Carbon Monoxide (CO) 714,000 Diesel Fuel 683,873 Hydrogen Sulfide 664,000 PCBs 658,694 Solvents 654,428 Zinc 316,501
*This ranking does not include contaminated soil or groundwater
OECA/OC/EPTDD/IUTB Data Source: ICIS (November 14, 2002) January 23, 2002

Dollar Value of FY 2002 EPA Enforcement Actions (by Statute)
Criminal Civil Judicial Administrative $ Value of $ Value of
Penalties Penalties Penalties Jud. Injunctive Adm. Injunctive $ Value of
Assessed Assessed* Assessed* Relief Relief SEPs
CAA $7,162,382 $33,857,828 $5,930,181 $462,502,233 $16,576,601 $31,662,129
CERCLA $3,054,294 $1,589,300 $1,101,822 $429,359,353 $360,940,872 $2,960,218
CWA $29,928,606 $8,706,339 $4,940,169 $1,491,853,587 $813,784,601 $13,078,678
EPCRA $0 $225,000 $3,100,756 $0 $582,589 $1,223,257
FIFRA $120,100 $12,000 $2,945,960 $500,000 $218,150 $12,000
RCRA $2,569,531 $11,130,437 $5,493,918 $12,972,600 $47,288,155 $6,261,460
SDWA $8,750 $500 $373,752 $290,000,000 $2,152,581 $428,200
TSCA $280,000 $50,000 $1,879,843 $400,000 $2,800,023 $832,652
Title 18 & other $19,128,655 $0 $0 $0 $0 $0
Totals $62,252,318 $55,571,404 $25,766,401 $2,687,587,773 $1,244,343,572 $56,458,594
*The national total for administrative and civil judicial penalties assessed is $81,337,805 which includes $93,100 regional RCRA UST field citations not included in this chart.
OECA/OC/EPTDD/IUTB December 9, 2002
Source: ICIS (November 14, 2002)

Dollar Value of EPA Enforcement Actions Concluded: FY 1998 to FY 2002
EPA Criminal Penalties EPA Civil Penalties
160
$62.3 M
$92.8 M
$61.6 M
$122 M
$94.7 M
200
$81.3 M
$91.8 M
$166.7 M
$84.1 M
$125.5 M
160120
$ M
illio
ns 120
$ M
illio
ns
$ M
illio
ns
80
80
40
40
0 0FY 1998 FY 1999 FY 2000 FY 2001 FY 2002 FY 1998 FY 1999 FY 2000 FY 2001 FY 2002
Judicial Administrative
Value of Injunctive Relief Value of EPA SEPs
501
0 FY 1998 FY 1999 FY 2000 FY 2001 FY 2002 FY 1998 FY 1999 FY 2000 FY 2001 FY 2002
0
$56.5 M$55.9 M
$89.1 M$90.8 M
$236.8 M
$3.9
$1.6 B
$4.5 B
$3.4 B
$2.0 B
B
2505
2004
1503
$ B
illio
ns
1002
OECA/OC/EPTDD/IUTB Source: MOS Reports, ICIS November 14, 2002 January 15, 2003

0
50
100
150
200
250
300
350
400
450
Num
ber o
f Cas
es
FY 73
FY 75
FY 77
FY 79
FY 81
FY 83
FY 85
FY 87
FY 89
FY 91
FY 93
FY 95
FY 97
FY 99
FY 01
EPA Civil Referrals to DOJ Since FY 1973
Air CERCLA Water RCRA Toxics/Pesticides/EPCRA
7,969 Total Referrals (2,528
0
1000
2000
3000
4000
5000
6000
7000
8000
1
Tota
lC
ases
Air, 2,282 Water, 2,266 CERCLA, 608 RCRA and 285 Toxics/Pesticides/EPCRA)
OECA/OC/EPTDD/IUTB Data Source: ICIS, Docket and Historical Records December 2, 2002

EPA Administrative Compliance Orders: FY 1994 to FY 2002
3,500
3,000
2,500
TSCA
SDWA 2,000
RCRA
FIFRA
EPCRA1,500
CWA
CERCLA
CAA1,000
500
0
The significant number of FY02 administrative settlements was due to 1st time enforcement of a new SDWA requirement to submit Consumer Confidence Reports (drinking water quality reports for consumers).
FY 94 FY 95 FY 96 FY 97 FY 98 FY 99 FY 00 FY 01 FY02
Source: MOS Reports, Annual Accomplishments in 1996, OECA/OC/EPTDD/IUTB 1999, ICIS Nov. 14, 2002 January 15, 2003
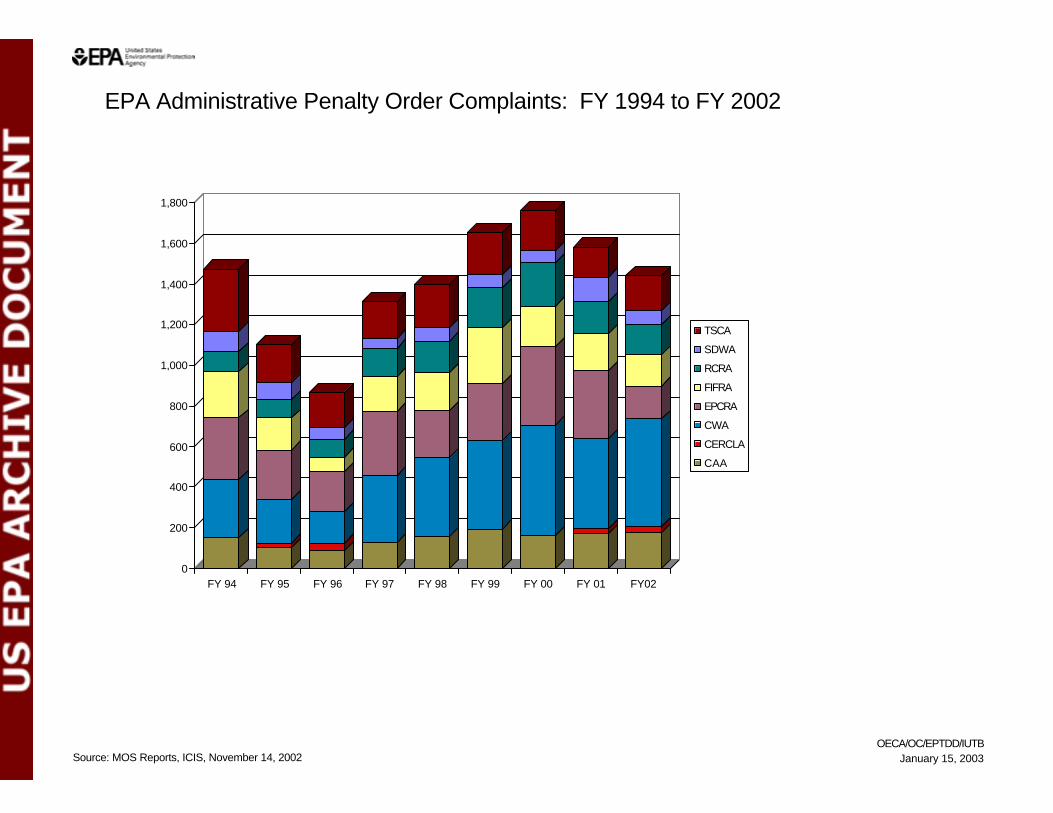
EPA Administrative Penalty Order Complaints: FY 1994 to FY 2002
1,800
1,600
1,400
1,200
1,000
800
600
400
200
0 FY 94 FY 95 FY 96 FY 97 FY 98 FY 99 FY 00 FY 01 FY02
Source: MOS Reports, ICIS, November 14, 2002
TSCA
SDWA
RCRA
FIFRA
EPCRA
CWA
CERCLA
CAA
OECA/OC/EPTDD/IUTB January 15, 2003
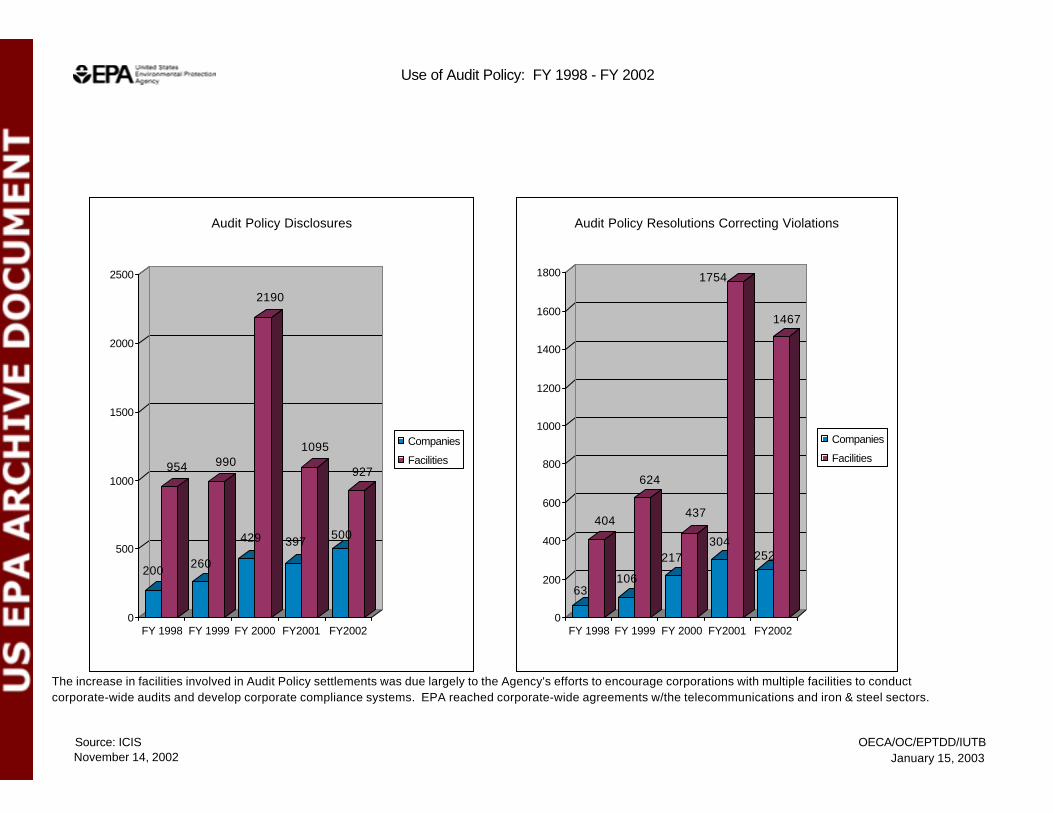
Use of Audit Policy: FY 1998 - FY 2002
200
954
260
990
429
2190
397
1095
500
927
0
500
1000
1500
2000
2500
FY 1998 FY 1999 FY 2000 FY2001 FY2002
Audit Policy Disclosures
Companies
Facilities
63
404
106
624
217
437
304
1754
252
1467
0
200
400
600
800
1000
1200
1400
1600
1800
FY 1998 FY 1999 FY 2000 FY2001 FY2002
Audit Policy Resolutions Correcting Violations
Companies
Facilities
The increase in facilities involved in Audit Policy settlements was due largely to the Agency's efforts to encourage corporations with multiple facilities to conduct corporate-wide audits and develop corporate compliance systems. EPA reached corporate-wide agreements w/the telecommunications and iron & steel sectors.
Source: ICIS OECA/OC/EPTDD/IUTB November 14, 2002 January 15, 2003

EPA Criminal Enforcement : Major Outputs FY 1998 to FY 2002
800
700
600
500
400
300
200
100
0 Cases Initiated Referrals Defendants Sentences Fines
FY98 FY99 FY00 FY01 FY02
Cases Initiated Referrals Defendants Charged Sentences (Years) Fines ($ Millions)
FY 1998 636 266 350 173 93
FY 1999 471 241 322 208 62
FY 2000 477 236 360 146 122
FY 2001 482 256 477 256 95
FY 2002 674* 250 325 215 62
*FY'02 includes 190 counter-terrorism investigation initiations.
OECA/OC/EPTDD/IUTB Data Source: Criminal Docket 10/29/02 January 15, 2003
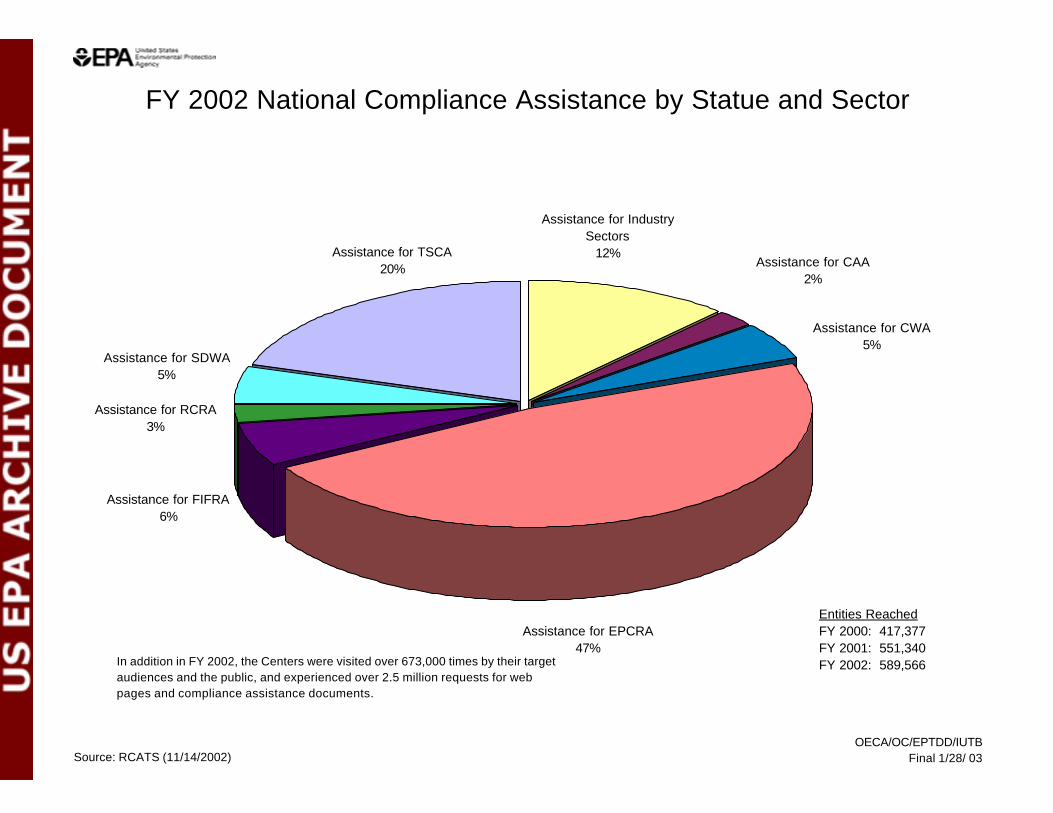
FY 2002 National Compliance Assistance by Statue and Sector
Assistance for Industry Sectors
Assistance for TSCA 12% Assistance for CAA20%
Assistance for CWA
2%
5% Assistance for SDWA
5%
Assistance for RCRA 3%
Assistance for FIFRA 6%
Assistance for EPCRA 47%
In addition in FY 2002, the Centers were visited over 673,000 times by their target audiences and the public, and experienced over 2.5 million requests for web pages and compliance assistance documents.
Entities Reached FY 2000: 417,377 FY 2001: 551,340 FY 2002: 589,566
Source: RCATS (11/14/2002) OECA/OC/EPTDD/IUTB
Final 1/28/ 03