Embed Size (px)
Citation preview
PNNL-20706
Prepared for the U.S. Department of Energy under Contract DE-AC05-76RL01830
Data Package for Secondary Waste Form Down-Selection—Cast Stone RJ Serne JH Westsik, Jr. September 2011


PNNL-20706
Data Package for Secondary Waste Form Down-Selection—Cast Stone RJ Serne JH Westsik, Jr. September 2011 Prepared for the U.S. Department of Energy under Contract DE-AC05-76RL01830 Pacific Northwest National Laboratory Richland, Washington 99352

iii
Executive Summary
The objective of the data packages being generated for four potential waste forms for solidification/ stabilization of Hanford liquid secondary waste streams is to identify, evaluate, and summarize the existing information. This Cast Stone data package includes information available in the open literature and from data obtained from testing currently underway at Pacific Northwest National Laboratory (PNNL). As used at Hanford, the term Cast Stone describes a “grout”-based waste form made predominantly with fly ash and blast furnace slag (BFS) with lesser amounts of Portland cement as the starting dry blend. At Savannah River, this waste form is called Saltstone. The blend of grout reagents in Saltstone has been constant (45 weight percent [wt%] Grade 100 slag cement, 45 wt% Class F fly ash, and 10-wt% Type I/II Portland cement) since the Saltstone Disposal Facility began production in the early 1990s. At Hanford, some cementitious variants to Cast Stone have also been investigated, in which either the fly ash or the BFS is absent or replaced with another material. In this data package, these Cast Stone variants are included for completeness in the review. However, almost all the current Cast Stone waste form testing performed at PNNL uses a dry blend consisting of 47-wt% blast furnace slag (Grade 100), 45-wt% fly ash (Class F), and 8-wt% Portland cement (Type I/II). The sources of the three dry blend ingredients used at Hanford and Savannah River differ and may have subtle impacts on the physical and chemical attributes of the subsequent waste forms. The compositions of the secondary waste simulants used for the PNNL Cast Stone studies also differ from the simulants and actual wastes solidified at Savannah River; although both are caustic-, saline- and sodium-dominated solutions. The Hanford secondary waste simulants anion composition contains much less nitrate/nitrite than the waste streams solidified at Savannah River.
Available literature on Cast Stone and Saltstone was reviewed with an emphasis on determining how Cast Stone and related grout waste forms performed in relationship to various criteria that will be used to decide whether a specific type of waste form meets acceptance criteria for disposal in the Integrated Disposal Facility (IDF) at Hanford. The draft waste acceptance criteria include the following requirements or targets:
• acceptable leachate concentrations (less than the Universal Treatment Standards in 40 CFR 268) for Resource Conservation and Recovery Act (RCRA) metals using the Toxicity Characteristic Leach Procedure (TCLP) leach test
• low bleed water criteria (i.e., no bleed water is tolerated after 28 days of curing)
• low leachability index (LI) values for sodium (LI>6), technetium-99 (target LI>9) and iodine-129 (target LI>11)
• minimum compressive strength of 500 psi (3.45 MPa).
Other attributes of the Cast Stone process were compared with additional criteria, such as:
• worker and public safety concerns
• cost effectiveness versus other candidate waste forms in regard to starting ingredients
• process and equipment costs and ease in operability of the entire system
• maturity and robustness of the process to variations in waste stream composition.
iv
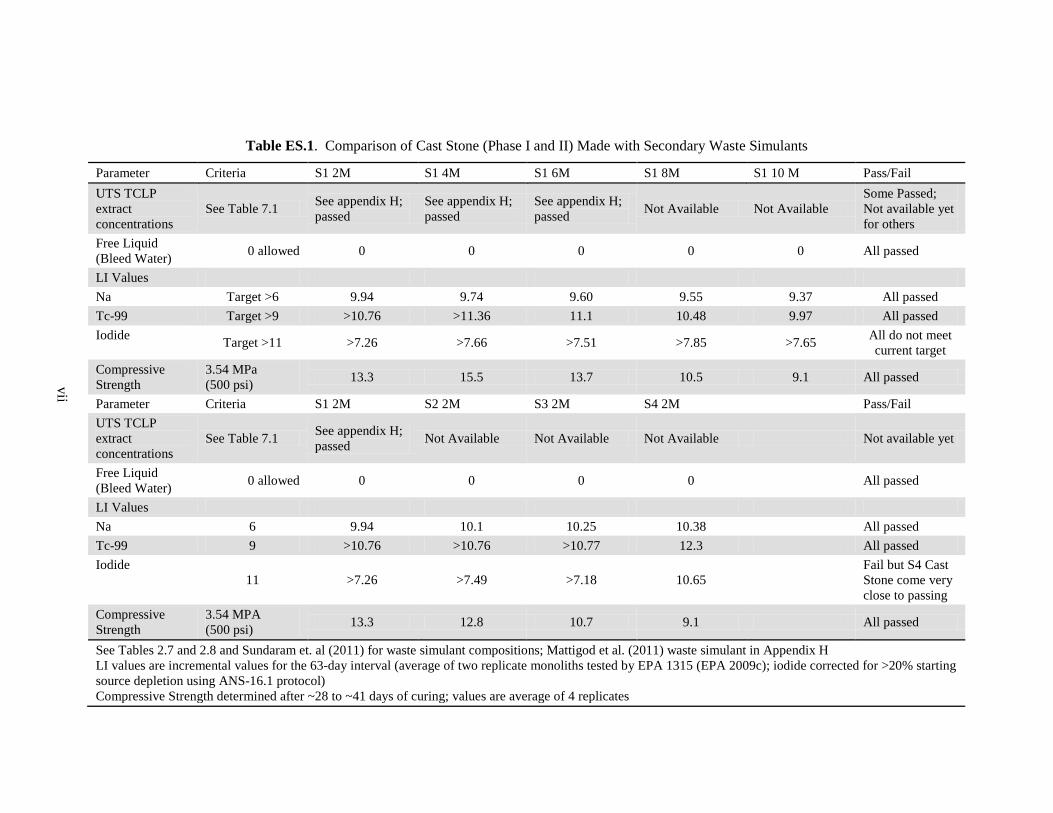
After the critical review of the Cast Stone/Saltstone literature, we conclude that Cast Stone is a good candidate waste form for further consideration. Table ES.1 at the end of this executive summary provides a comparison of Cast Stone performance versus the current IDF acceptance criteria.
The cost of starting ingredients and equipment necessary to generate Cast Stone waste forms with secondary waste streams are low and the Cast Stone dry blend formulation can be tailored to accommodate variations in liquid waste stream compositions. Additional favorable attributes include:
• Cast Stone does not require complicated processes or unusually specialized equipment.
• Short-term (63 days) leach rates for 99Tc, Na, and most RCRA-regulated metals are quite low compared to the preliminary target diffusion coefficient criteria (desired minimum value) of 1 × 10⁻⁹ cm2/s for Tc and 1× 10⁻⁶ cm2/s for Na. The preliminary iodide leach data are inconclusive because the initial concentration of iodide estimated to be in most of the future secondary waste streams is low enough that the concentration of iodide in most of the leachates was below detection. However, it appears that iodide does leach out of Cast Stone significantly more rapidly than Tc, Na, and other RCRA metals that were measurable.
• The rate of leaching of all the analytes studied by PNNL in Phase II generally decreased after the first few days throughout the remaining ~60 days of the leach tests. Incremental effective diffusivity coefficients for leach intervals generally decreased by at least two orders of magnitude for Tc and by one order of magnitude for Na and iodide. The trend of decreasing leaching as function of time is found for all past Cast Stone and Saltstone monolith tests using intermittent deionized water exchanges suggesting near-surface wash off.
• The final 63-day short-term effective diffusion coefficients for 99Tc are at least a factor of 10 to a factor of 1000 times lower (better) than the desired target maximum value of 1 × 10⁻⁹ cm2/s for all the Cast Stone-secondary waste simulants tested by PNNL in both Phases. The final 63-day short-term effective diffusion coefficient for Na are at least a factor of 100 times lower (better) than the desired maximum value of 1 × 10⁻⁶ cm2/s for all the Cast Stone/secondary waste simulants tested. The final 63-day short-term effective diffusion coefficient for iodide did not meet the desired target maximum value1 of 1 × 10-11 cm2/s for all the Cast Stone/secondary waste simulants tested; although more testing with higher concentrations of starting iodide or better leachate iodide detection limits would be needed to get a quantitative result. Past studies using iodide getters containing silver-based reagents show they do reduce iodide leaching significantly in short-term leach tests; however, long-term thermodynamic-based constructs raise concerns whether low solubility silver iodide will remain stable. Thus, iodide getters that do not rely on precipitation of low solubility silver iodide will probably be required to meet the currently desired effective diffusion coefficient of 1 × 10-11 cm2/s. The need and basis for the iodine target diffusivity needs to be revisited. Other considerations may allow the desired effective diffusion coefficient value to be increased.
• The compressive strengths of all the Cast Stone monoliths prepared by PNNL, most all Cast Stone and Saltstone monoliths prepared with other highly caustic and saline liquid wastes exceeds the compressive strength criteria of 500 psi, generally by at least a factor of two.
1 The desired effective diffusion coefficients for 129I and 99Tc come from preliminary performance assessment groundwater risk predictions performed by Mann et al. (2003) and are subject to change as updated modeling is performed.
v
• The database for Cast Stone short-term performance is quite extensive compared to the other three candidate waste solidification processes. The solidification of liquid wastes in Cast Stone is a mature process in comparison to the other three candidates. When one considers the extensive literature on the use of cementitious material in the construction industry, the available database is very large, and the understanding on how to tailor cementitious material formulations to yield desired physical and to some extent chemical properties is robust.
• Successful production of Cast Stone or Saltstone has been demonstrated from lab-scale monoliths with volumes of cm3 through m3 sized blocks, to 210-liter sized drums, and all the way to the large pours into vaults at Savannah River. To date, over 9 million gallons of low-activity liquid waste has been solidified and disposed in concrete vaults at Savannah River.
Two issues were identified after reviewing all the potential performance criteria that Cast Stone might have to meet:
1. The pore water held within freshly manufactured Cast Stone has a pH that generally exceeds the U.S. Environmental Protection Agency definition of corrosivity, but with time and exposure to air (especially carbon dioxide) and infiltrating water, the pore water pH will drop below 12.5, the value of concern.
2. TCLP leachates of freshly manufactured Cast Stone that include elevated concentrations of RCRA metals (to facilitate measurement in water leach performance testing) often do not meet the Universal Treatment Standards-desired concentrations for many RCRA metals; however, the TCLP leachates do generally meet the less-stringent 20X drinking water standards for RCRA metals. Further, the most recent TCLP tests on S1 simulant-based Cast Stone with realistic concentrations of RCRA metals (see Mattigod et al. 2011) readily met the Universal Treatment Standards.
Further, we question the relevance of the TCLP test protocol, which uses an acidic leachant of pH 2.88 acetic acid at a 20 parts leachant to 1 part crushed waste form. After burial in the IDF subsurface, there are no credible scenarios for the Cast Stone to be subjected to exposure to such an acidic environment and the monoliths likely will not become disaggregated to the same degree as used in the TCLP test methodology.
Areas that require more attention should Cast Stone (or for that matter any of the other low-temperature waste forms) be chosen as preferred waste form candidate include:
• Effects of the high ammonium and dissolved aluminum concentrations in projected secondary-waste streams. The ammonium in the liquid waste streams is turned to ammonia gas during the mixing of the liquid waste with the Cast Stone dry ingredients. Worker safety issues and the possible effects of the gas volatilization causing over-pressurization in the waste containers and/or internal waste monolith cracking during curing need to be addressed. Dissolved aluminum (AlO2
-
) increases the heat evolved during the hydration reactions and can cause thermally induced cracking in the curing Cast Stone.
• Protocols are needed to control heat of hydration in the waste containers. BFS, Portland cement, and fly ash pozzolanic reactions are exothermic. Waste form containers create conditions comparable to a mass pour as compared to a thin slab which can dissipate heat. Waste composition also affects the hydration reactions and resulting phases. Elevated temperatures can

vi
cause evaporation of water (resulting in dehydration cracking and salt precipitation) and cracking due to thermal stresses. Fortunately, there is a lot of empirical data and physico-chemical understanding of the hydration process that can be brought to bear on optimizing the Cast Stone formulation to handle a range of dissolved aluminum concentrations.
• Increased waste loading (dry salt waste basis and liquid waste loading). We discovered during the critical review of the literature that the PNNL Phase I and early Phase II work on Cast Stone was formulated with liquid waste loadings of only ~8 to 9 wt% with dry waste salt loadings of only 1 to 4.6 wt% while to other Hanford and Savannah River workers successfully created Cast Stone/Saltstone waste forms that contained 37 to 56 wt% liquid waste loadings or 10 to 22 wt% dry salt loadings. The higher loadings attained by others suggest that Cast Stone optimization can significantly increase the amount of secondary liquid waste that can be placed in the final product. In fact, in the most recent Phase II work Mattigod et al. (2011) successfully made Cast Stone waste forms with simulant S1 with a dry salt loading as high as 13.5 wt%. This higher waste loading and future optimization testing should lower the cost of secondary waste immobilization if Cast Stone is chosen.
• Measuring engineering parameters required to satisfy reactive transport modeling for performance assessment predictions and finalizing the needed IDF waste disposal acceptance requirements as soon as possible should be given high priority. The needed parameters are waste-form and disposal-system specific, such as saturated and unsaturated hydraulic and gas conductivities, porosities (bulk and transmissive), bulk and particle densities, diffusivities, sorption coefficients (Kds), tortuosity, pore solution compositions, solubility constants for contaminants that are precipitated, etc. Although they are typically measured in bench-scale laboratory tests, some longer-term larger-scale tests such as field lysimeter tests should be considered and started as soon as possible to maximize the time frame allowed for data collection.
• Long-term waste form leaching and durability studies and modeling need to be performed for environmental conditions relevant to the IDF disposal environment. Without such long-term waste form leaching and durability studies and complementary predictive modeling efforts using IDF disposal environment conditions, it will be difficult to create a credible performance assessment.
• Some thought, discussion and plans must be generated soon after the down-selection that address how the Waste Acceptance Criteria will interface with a full performance assessment and how the performance assessment’s potentially greater data needs will be met.
• The overall Cast Stone process needs to be thoroughly vetted prior to locking in the full-scale flow sheet and equipment specifications. In-container processing or ex-container processing decisions are one of the first decisions that need to be made prior to finalizing the design of modifications to the Effluent Treatment Facility (ETF) should Cast Stone be down-selected.
Once down-selection is complete, these technical details will need to be resolved for the selected waste form.
vii
Table ES.1. Comparison of Cast Stone (Phase I and II) Made with Secondary Waste Simulants
Parameter Criteria S1 2M S1 4M S1 6M S1 8M S1 10 M Pass/Fail UTS TCLP extract concentrations
See Table 7.1 See appendix H; passed
See appendix H; passed
See appendix H; passed Not Available Not Available
Some Passed; Not available yet for others
Free Liquid (Bleed Water) 0 allowed 0 0 0 0 0 All passed
LI Values Na Target >6 9.94 9.74 9.60 9.55 9.37 All passed Tc-99 Target >9 >10.76 >11.36 11.1 10.48 9.97 All passed Iodide Target >11 >7.26 >7.66 >7.51 >7.85 >7.65 All do not meet
current target Compressive Strength
3.54 MPa (500 psi) 13.3 15.5 13.7 10.5 9.1 All passed
Parameter Criteria S1 2M S2 2M S3 2M S4 2M Pass/Fail UTS TCLP extract concentrations
See Table 7.1 See appendix H; passed Not Available Not Available Not Available Not available yet
Free Liquid (Bleed Water) 0 allowed 0 0 0 0 All passed
LI Values Na 6 9.94 10.1 10.25 10.38 All passed Tc-99 9 >10.76 >10.76 >10.77 12.3 All passed Iodide
11 >7.26 >7.49 >7.18 10.65 Fail but S4 Cast Stone come very close to passing
Compressive Strength
3.54 MPA (500 psi) 13.3 12.8 10.7 9.1 All passed
See Tables 2.7 and 2.8 and Sundaram et. al (2011) for waste simulant compositions; Mattigod et al. (2011) waste simulant in Appendix H LI values are incremental values for the 63-day interval (average of two replicate monoliths tested by EPA 1315 (EPA 2009c); iodide corrected for >20% starting source depletion using ANS-16.1 protocol) Compressive Strength determined after ~28 to ~41 days of curing; values are average of 4 replicates


ix
Acknowledgments
The authors are grateful to K. Smith, K. Colosi, T. May, and M. Melvin at Washington River Protection Solutions, LLC, Richland, Washington, for the project funding and programmatic guidance. We also acknowledge the technical discussions, literature sharing, and cooperation of Gary Josephson, Kirk Cantrell, Nic Qafoku, and Shas Mattigod during the data package activities leading up to this final report. We are especially grateful to Dr. Christine Langton (Savannah River National Laboratory) and Dr. Jim Krumhansl (Sandia National Laboratory) for performing a thorough review of the draft data package and supplying many additional reports and insights into the Saltstone and getter and waste form durability literature, respectively. Dr. John Wiley also prepared written comments on the draft data package that led to improvements in this final document. The authors also acknowledge that the discussions during the August 15–18, 2011 Panel meeting on waste forms for Hanford Waste Treatment Plant Secondary Waste (HSW) provided other valuable information that improved this final Cast Stone data package. The efforts of Wayne Cosby, Maura Zimmerschied, Kathy Neiderhiser and Barbara Wilson within the PNNL document editing and production group are greatly appreciated. PNNL is a multi-program national laboratory operated for the U.S. Department of Energy by Battelle under Contract DE-AC05-76RL01830.


xi
Acronyms and Abbreviations
AFm calcium monosulfoaluminate AFt ettringite ANS American Nuclear Society ANSI American National Standards Institute ART Advanced Remediation Technologies ASTM ASTM International (formerly the American Society for Testing and Materials) BFS blast furnace slag C3A tricalcium aluminate C4AF tetracalcium aluminoferrite CBP Cementitious Barriers Partnership CCBT Clean Cap Batch Tank CCS containerized cast stone CFR Code of Federal Regulations COC constituent(s) of concern C2S dicalcium silicate C3S tricalcium silicate C-S-H calcium silicate hydrate CS-HA cast stone-hydroxy apatite getter CY calendar year DDA deliquification, dissolution and adjustment DIW deionized water DL detection limit DOE U.S. Department of Energy DWPF Defense Waste Processing Facility EC electrical conductivity Ecology Washington State Department of Ecology Eh oxidation-reduction potential EPA U.S. Environmental Protection Agency EQL estimated quantitation limit ETF Effluent Treatment Facility FBSR fluidized-bed steam reformer GW groundwater HEPA high-efficiency particulate air (filter) HLW high-level waste HMS heavy metals sludge ICP inductively coupled plasma
xii
IDF Integrated Disposal Facility IEX ione exchange resin IHLW immobilized high-level waste ILAW immobilized low-activity waste LAW low-activity waste LDR Land Disposal Restriction LERF Liquid Effluent Retention Facility LI leachability index LLW low-level waste MCU Modular Caustic Side Solvent Extraction Unit NRC U.S. Nuclear Regulatory Commission OLI-ESP a computer code; steady-state electrolyte process simulator used to predict solids
and dissolved species present in Hanford SSTs OPC ordinary Portland cement ORP U. S. Department of Energy Office of River Protection PA performance assessment PCT Product Consistency Test PNNL Pacific Northwest National Laboratory PSD particle-size distribution PUF pressurized unsaturated flow apparatus QL quantitation limit RCRA Resource Conservation and Recovery Act SALDS State Approved Land Disposal Site SBS submerged bed scrubber SFT Salt Feed Tank SCDHEC South Carolina Department of Health and Environmental Control SDU Saltstone disposal unit SPFT single pass flow through (test) SRNL Savannah River National Laboratory SRS Savannah River Site SST single-shell tank SSW solidified secondary wastes STU solidification treatment unit SWPF Salt Waste Processing Facility TCLP Toxicity Characteristic Leach Procedure TDS total dissolved solids TOC total organic carbon TRU transuranic

xiii
UHC underlying hazardous constituent UTS Universal Treatment Standards WAC Washington Administrative Code WDOE Washington State Department of Ecology WESP wet electrostatic precipitator WRPS Washington River Protection Solutions WTP Hanford Tank Waste Treatment and Immobilization Plant XRD X-ray diffraction
The main oxides present in cement are abbreviated in the following way:
Symbol Actual Formula Name C CaO Calcium oxide, or lime S SiO2 Silicon dioxide, or silica A Al2O3 Aluminum oxide, or alumina F Fe2O3 Iron oxide T TiO2 Titanium dioxide M MgO Magnesium oxide K K2O Potassium oxide N Na2O Sodium oxide H H2O Water C CO2 Carbon dioxide
S SO3 Sulfur trioxide
P P2O5 Phosphorus hemi-pentoxide


xv
Units of Measure
θ angle of incidence (Bragg angle) Å angstrom (10-10
m or 10-1 nm) °C temperature in degrees Celsius [T(°C) = T(K) – 273.15] cm centimeter g gram J/K joules per Kelvin μ micro (prefix, 10-6) μm micrometer mS/cm millisiemens per centimeter (electrical conductance) M molarity, mol/L mL milliliter rpm revolutions per minute λ wavelength wt% weight percent


xvii
Contents
Executive Summary .......................................................................................................................... iii Acknowledgments .............................................................................................................................. ix Acronyms and Abbreviations ............................................................................................................ xi Units of Measure ............................................................................................................................... xv 1.0 Introduction ............................................................................................................................. 1.1
1.1 Origin and Disposition of WTP Liquid Secondary Wastes ............................................ 1.2 1.2 Identification of Waste Forms ......................................................................................... 1.4 1.3 Secondary Waste Form Down-Selection Decision Process Content............................... 1.5 1.4 IDF Waste Acceptance Criteria ....................................................................................... 1.6 1.5 Data Package Content ..................................................................................................... 1.8
2.0 Waste Form Description .......................................................................................................... 2.1 2.1 Cast Stone Ingredients ..................................................................................................... 2.2 2.2 Cast Stone Reagent Phase Composition and Mineralogy ............................................... 2.4 2.3 Particle Size of Dry Blend ............................................................................................... 2.6 2.4 Getters/Reductants .......................................................................................................... 2.8
2.4.1 Silver-Based, Phosphate-Based and Ion Exchange Resin Getters ....................... 2.8 2.4.2 Slag (BFS) as a Reductant .................................................................................. 2.10
2.5 2.5 Range of Wastes/Compositions Tested ................................................................... 2.11 2.6 Waste Loading............................................................................................................... 2.16 2.7 Identification of Waste Constituents that Adversely Impact Waste Form
Processing/Properties/Waste Loading/Waste Form Setting .......................................... 2.18 2.8 Actual Wastes ................................................................................................................ 2.20 2.9 Waste Form Container/Package .................................................................................... 2.20
3.0 Waste Form Process Description ............................................................................................. 3.1 3.1 Starting Materials ............................................................................................................ 3.1 3.2 Process Steps ................................................................................................................... 3.2
4.0 Waste Form Production Description ....................................................................................... 4.1 4.1 Flowsheet ........................................................................................................................ 4.1 4.2 Equipment ....................................................................................................................... 4.1 4.3 Process Control ............................................................................................................... 4.1 4.4 Off-Gas Treatment .......................................................................................................... 4.3 4.5 Process Effluents, Secondary Wastes .............................................................................. 4.4 4.6 Existing Facilities ............................................................................................................ 4.5 4.7 Cost Data ......................................................................................................................... 4.6
5.0 Physical Properties .................................................................................................................. 5.1 5.1 Heat of Hydration, Heat Capacity, and Thermal Conductivity ....................................... 5.1 5.2 Expansion and Cracking .................................................................................................. 5.7
xviii
5.3 Other Physical Properties (Porosity, Tortuosity, Density, Hydraulic Conductivity) ...... 5.9 6.0 Waste Form Performance ........................................................................................................ 6.1
6.1 Leach Data ...................................................................................................................... 6.1 6.1.1 ANSI/ANS-16.1 ................................................................................................... 6.1 6.1.2 EPA 1315 ............................................................................................................. 6.4 6.1.3 ASTM 1308 .......................................................................................................... 6.5 6.1.4 Diffusion Coefficients/LI for Other Waste Form Components, Nitrates as
Appropriate to Understand Waste Form Performance ......................................... 6.6 6.1.5 DIW and Other Leachants .................................................................................... 6.6
6.2 Waste Form Performance Test Data (with Emphasis on Long-Term Performance Aspects) ........................................................................................................................... 6.6 6.2.1 Product Consistency Test ................................................................................... 6.11 6.2.2 Single-Pass Flow-Through Test ......................................................................... 6.11 6.2.3 Pressurized Unsaturated Flow Test .................................................................... 6.11 6.2.4 6.2.4 EPA 1313 .................................................................................................. 6.11 6.2.5 EPA 1316 ........................................................................................................... 6.14 6.2.6 EPA 1314 ........................................................................................................... 6.15 6.2.7 Vapor Hydration Test ......................................................................................... 6.15 6.2.8 Larger Scale Field Tests ..................................................................................... 6.15
6.3 Structural Location or Speciation Information of Contaminants Within Waste Form Phases ............................................................................................................................ 6.16 6.3.1 Mechanisms of Containment .............................................................................. 6.16 6.3.2 Impact of Getters ................................................................................................ 6.17 6.3.3 Impacts of Waste Processing Conditions—Curing Temperature ....................... 6.19 6.3.4 Waste Loading .................................................................................................... 6.20
7.0 Waste Acceptance Criteria ...................................................................................................... 7.1 7.1 Void Space ...................................................................................................................... 7.1 7.2 Surface Dose Rate ........................................................................................................... 7.1 7.3 Free Liquids .................................................................................................................... 7.1 7.4 Dangerous Waste Limitations ......................................................................................... 7.2 7.5 Compressive Strength ................................................................................................... 7.10 7.6 Effective Diffusion Coefficients and LI ........................................................................ 7.16
7.6.1 Monoliths Made with Liquid Waste Simulants .................................................. 7.16 7.6.2 Monoliths Made with Actual Radioactive Wastes ............................................. 7.29
8.0 Summary of Key Waste Form Attributes ................................................................................ 8.1 9.0 References ............................................................................................................................... 9.1 Appendix A Supplemental Treatment Technology Selection Decision Goals, Criteria, Measures,
Technology Issues, and Testing Objectives ........................................................... A.1 Appendix B Initial Draft Waste Form Selection/Waste Acceptance Criteria for Hanford WTP
Secondary Waste Form ............................................................................................ B.1
xix
Appendix C Details on Simulants, Actual Wastes, and Cementitious Waste Form Formulations Used at Hanford and Savannah River..................................................................... C.1
Appendix D Figures Depicting the Text Matrix for Cast Stone Getter Testing for Iodide-Rich Secondary Waste Simulant ...................................................................................... D.1
Appendix E Specification Sheets from Vendors for Cast Stone Dry Blend Ingredients ............... E.1 Appendix F Flow Schematics and Description of Savannah River (Z Plant) Saltstone Facility .....F.1 Appendix G Incremental Effective Diffusion Coefficients for Na and Iodide Calculated for
Secondary Waste Simulant Cast Stone Monoliths .................................................. G.1 Appendix H TCLP Results for Cast Stone Waste Forms ............................................................... H.1
xx
Figures
1.1 Schematic of Secondary Waste Sources ..................................................................................... 1.3 2.1 X-Ray Diffraction Patterns of Unhydrated Type II Portland Cement ........................................ 2.4 2.2 XRD Pattern of Class F Fly Ash ................................................................................................. 2.5 2.3 XRD Pattern of Blast Furnace Slag ............................................................................................ 2.5 2.4 Vol% of Particles Versus Size for the Cast Stone Dry Blend Ingredients .................................. 2.7 4.1 Portable Cement Mixer Used to Create the Cubic Meter Cast Stone Waste Form ..................... 4.2 4.2 Cracked Cast Stone Molds for Waste Forms Made with Simulant 4—High
Ammonia Content ....................................................................................................................... 4.4 4.3 Cast Stone m3 Monolith from Cooke et al. (2006a) .................................................................... 4.5 4.4 Cast Stone m3 Monolith from Cooke et al. (2006a) .................................................................... 4.6 5.1 Heat of Hydration of Type I Portland Cement Slurry as a Function of Time for
Curing at a Constant Temperature of 21°C ................................................................................. 5.3 5.2 Temperature Evolution from the Middle of 5-Gallon-Sized Cast Stone Waste Forms .............. 5.4 5.3 Temperature Evolution in the Middle of Cubic-Meter-Sized Cast Stone Monolith ................... 5.5 6.1 Leachability Indices for 99Tc from Cast Stone Monoliths Containing Various Getters .............. 6.2 6.2 Cement Waste Forms after 39 Years of Shallow Burial ............................................................. 6.7 6.3 An Example of the Type of Static Container Used to Conduct the EPA 1313 and
1316 Test Methods ...................................................................................................................... 6.12 6.4 99Tc Release from Crushed Cast Stone Waste Forms Made with Various Secondary
Waste Simulants as a Function of Slurry pH .............................................................................. 6.13 6.5 Release of 99Tc into DIW Leachates as a Function of Liquid-to-Solids Ratio ........................... 6.15 6.6 AgI Solubility at 25°C and in a pH 7 Solution as a Function of Oxygen Fugacity .................... 6.18 7.1 Evolution of Cement Pore Water pH as Cement Weathers from Contact with
Infiltrating Water and Air ........................................................................................................... 7.9 7.2 Changes in Compressive Strength for Cast Stone Made with Simulants S1 to S4,
all at a Nominal 2 M Na Starting Concentration ......................................................................... 7.11 7.3 Changes in Compressive Strength for Cast Stone Made with Simulants S1 at
Various Na Starting Concentrations............................................................................................ 7.11 7.4 Compressive Strength Increase Versus Curing/Aging Time ...................................................... 7.16 7.5 Incremental Effective Diffusion Coeffients for 99Tc for Various Secondary Waste
Simulants ..................................................................................................................................... 7.25 7.6 Technetium LI Values for Each Leach Interval for the Four Secondary Waste
Simulants Used by Sundaram et al. (2011) ................................................................................. 7.25 7.7 Incremental Effective Diffusion Coeffients for 99Tc in Secondary Waste Simulant S1
at Various Starting Concentrations of Na-based Waste .............................................................. 7.26 7.8 Technetium LI Values for Each Leach Interval for the S1 Secondary Waste Simulant
at Various Na Starting Concentrations Used by Sundaram et al. (2011) .................................... 7.26 7.9 LI Values for Nitrate as a Function of Waste Loading for LAW Waste Simulant that
Was Either Diluted with Water or Concentrated by Evaporation ............................................... 7.29

xxi
Tables
ES.1 Comparison of Cast Stone Made with Secondary Waste Simulants ........................................... vii 1.1 Supplemental Treatment Technology Selection Decision Goals, Criteria, and Measures .......... 1.6 1.2 Summary of Testing Recommendations for Containerized Grout Technology—Waste
Form Performance....................................................................................................................... 1.7 2.1 Oxide Composition of Cast Stone Dry Blend Ingredients Used by PNNL in Phase II
Studies ......................................................................................................................................... 2.3 2.2 Abbreviations and Description of the Minerals in Portland Cement .......................................... 2.4 2.3 Estimated Size of Particles in Selected Percentile Values for Measurements Taken
After 1-Minute Stirring and After 1-Minute more Vigorous Sonication .................................... 2.7 2.4 Waste Simulant Used for Iodine Rich Secondary Waste ............................................................ 2.8 2.5 Chemical Composition of Basin 43 Groundwater Brine Simulant to Test Tc Getters ............... 2.9 2.6 Tc-Getters and Reductants Used by Duncan et al. (2009) with Cast Stone Waste
Form Variant ............................................................................................................................... 2.10 2.7 The Chemical Composition of WTP Liquid Secondary Waste Streams used by PNNL ............ 2.12 2.8 Simulant Matrix for Cast Stone Phase II Testing ........................................................................ 2.13 2.9 Basin 42 Waste Simulant ............................................................................................................ 2.13 2.10 Concentrations of Trace Metals and Radionuclides in Actual Basin 42 Brine ........................... 2.14 2.11 Basin 42 Simulated Brine Cast Stone Formulation ..................................................................... 2.15 2.12 Real Basin 42 Brine Cast Stone Formulation ............................................................................. 2.15 2.13 Cast Stone Formulations for 5-Gallon Bucket Testing of 40% TDS Basin 42 Simulant ........... 2.15 2.14 Waste Loading of Various Secondary Waste Simulants in Cast Stone Waste Forms ................ 2.18 2.15 Waste and Dry Salt Loading for Cast Stone, Saltstone and Variants for Salt Wastes ................ 2.19 5.1 Summary of Temperature Evolution of 5-Gallon-Bucket Sized Cast Stone Waste
Forms Containing Basin 42 40% TDS Waste Simulant ............................................................. 5.4 5.2 Description of Condition of the 5-Gallon Sized Cast Stone Monoliths after 7 Days
Curing ......................................................................................................................................... 5.7 5.3 Saltstone Physical Properties ...................................................................................................... 5.8 6.1 Details on Cement Waste Forms Buried for 39 Years ................................................................ 6.7 6.2 Reference Oxygen Fugacities for Useful Buffer Systems .......................................................... 6.19 7.1 UTS Maximum Permissible Concentrations for TCLP Leachates ............................................. 7.3 7.2 TCLP Results for Basin 42 Brine Simulants ............................................................................... 7.3 7.3 TCLP Results for Cast Stone Waste Forms Made with Actual Basin 42 Brines ........................ 7.4 7.4 TCLP Results for Early Hanford Cast Stone .............................................................................. 7.5 7.5 Preparation of TCLP Samples ..................................................................................................... 7.8 7.6 TCLP Results for Saltstone Waste Forms made with Actual Tank Waste CY 2007 .................. 7.8 7.7 Comparison of CY 2007 TCLP Results to South Carolina and Federal Regulations ................. 7.9 7.8 Compressive Strength Data for Cast Stone and Saltstone........................................................... 7.13

xxii
7.9 Cast Stone/Saltstone Diffusivity and LI Data ............................................................................. 7.17 7.10 LI Values for Nitrate, 99Tc, and 129I for Cast Stone Monoliths Made with Actual LAW
Waste ........................................................................................................................................... 7.30

1.1
1.0 Introduction
The Hanford Site in southeastern Washington State has 56 million gallons of radioactive and chemically hazardous wastes stored in 177 underground tanks (DOE 2010). The U.S. Department of Energy (DOE), Office of River Protection (ORP), through its contractors, is constructing the Hanford Tank Waste Treatment and Immobilization Plant (WTP) to convert the radioactive and hazardous wastes into stable glass waste forms for disposal. Within the WTP, the pretreatment facility will receive the retrieved waste from the tank farms and separate it into two treated process streams. The pretreated high-level waste (HLW) mixture will be sent to the HLW Vitrification Facility, and the pretreated low-activity waste (LAW) stream will be sent to the LAW Vitrification Facility. The two WTP vitrification facilities will convert these process streams into glass, which will be poured directly into stainless steel canisters. The immobilized HLW (IHLW) canisters will ultimately be disposed of at an offsite federal repository. The immobilized LAW (ILAW) canisters will be disposed of onsite in the Integrated Disposal Facility (IDF). As part of the pretreatment and ILAW processing, liquid secondary wastes will be generated that will be transferred to the Effluent Treatment Facility (ETF) on the Hanford Site for further treatment. These liquid secondary wastes will be converted to stable solid waste forms that will be disposed of in the IDF. Liquid effluents from the ETF will be discharged through the State Approved Land Disposal Site (SALDS).
The ETF is an existing operating facility on the Hanford Site. It is a Resource Conservation and Recovery Act (RCRA)-permitted multi-waste treatment and storage facility that can accept Washington State-regulated dangerous, low-level, and mixed wastewaters for treatment. The ETF receives, treats, and disposes of liquid effluents from cleanup projects on the Hanford Site. The ETF handles treated effluent under the ETF State Wastewater Discharge Permit and solidified liquid effluents under the Washington State Department of Ecology (Ecology) Dangerous Waste Permit. The ETF lacks the capacity to treat the liquid process effluents from the WTP once it comes on line for operations.
Milestone M-047-00 of the Hanford Federal Facility Agreement and Consent Order (Ecology et al. 1989) requires that DOE “complete all work necessary to provide facilities for management of secondary liquid waste from the WTP” by “the date that the WTP achieves initial plant operations.” Interim milestones are to be negotiated by June 30, 2012. DOE is considering a non-major system acquisition project for a Secondary Liquid Waste Treatment Project to add the needed capacity to the ETF (DOE 2011). Among the alternatives to be evaluated for providing the needed capacity for handling the WTP liquid secondary wastes are
• Upgrade ETF, plus construct a Solidification Treatment Unit
• Upgrade ETF, with new ion exchange facilities, plus construct a Solidification Treatment Unit
• Upgrade ETF, plus recycle evaporator concentrates back to tank farms by truck or pipeline
• Provide additional evaporative capacity, plus use fluidized bed steam reforming.
Washington River Protection Solutions (WRPS), a prime contractor to DOE, is responsible for the ETF upgrades needed to receive secondary liquid wastes from the WTP at Hanford. In planning for the Secondary Liquid Waste Treatment Project, WRPS anticipates two down-selections. The first down-selection will evaluate the alternatives and options for providing the necessary capacity for treating the secondary liquid wastes from WTP and other Hanford Site liquid waste generators. Then, should the

1.2
preferred alternative include adding a Solidification Treatment Unit, a second down-selection would evaluate alternative waste forms for solidifying treated wastes from the ETF.
To support the selection of a waste form for the liquid secondary wastes from WTP, WRPS has initiated secondary waste form testing work at Pacific Northwest National Laboratory (PNNL). In 2009, preliminary screening of waste forms was conducted to assess the viability of alternative waste forms for the solidification of the liquid secondary wastes (Pierce et al. 2010a; Pierce et al. 2010b). A testing program was initiated to further develop, optimize, and characterize the Cast Stone, Ceramicrete, and DuraLith waste forms to stabilize/solidify the anticipated liquid secondary wastes. Testing was also conducted on a previously prepared fluidized bed steam reformer (FBSR) waste form to develop a suite of comparable test results such that the performance of all four candidate waste forms could be evaluated.
In anticipation of a down-selection process for a waste form for the Solidification Treatment Unit, PNNL is developing data packages to support that down-selection. The objective of the data packages is to identify, evaluate, and summarize the existing information on the four waste forms being considered for stabilizing and solidifying the liquid secondary wastes. The information included will be based on information available in the open literature and from data obtained from testing currently underway.
1.1 Origin and Disposition of WTP Liquid Secondary Wastes
The WTP includes three major treatment facilities, including a pretreatment building, an HLW vitrification building, and a LAW vitrification building. Liquid wastes, sludges, and saltcake retrieved from the underground storage tanks will be piped to the pretreatment building. There, the wastes will be separated into a low-volume, HLW stream containing most of the actinides, cesium, and strontium as well as a large-volume, LAW stream with most of the sodium and aluminum. From an environmental protection perspective, the largest fractions of the technetium-99 (99Tc) and iodine-129 (129I) inventory in the tanks, both long-lived radionuclides, are expected to reside in the LAW stream. The HLW stream will be transferred to the HLW vitrification building where it will be combined with glass forming chemicals and melted in a high-temperature melter. The resulting molten glass will be poured into stainless steel canisters to cool and sit in storage until it can be shipped to a federal repository. Similarly, the LAW stream will be piped to the LAW vitrification building where it will be melted with glass formers in a high-temperature melter and poured into steel canisters for disposal in IDF.
Secondary liquid wastes will be generated in the pretreatment and vitrification buildings. Figure 1.1 shows a schematic of the sources for the secondary wastes. In the pretreatment building, a front-end evaporator will be used to concentrate liquid wastes received from the underground storage tanks as well as liquid process effluents from the HLW vitrification building. A back-end evaporator will be used to concentrate the LAW from the pretreatment process plus condensates from the LAW melter primary off-gas treatment stream. Condensates from the front-end and back-end evaporators will be collected in process condensate collection tanks.
Both the HLW and the LAW vitrification facilities include off-gas treatment systems to treat the gaseous effluents from their respective glass melters. These effluents include water vapor, chemicals that are volatile at the elevated melter temperatures, and particulates. In each vitrification process, the melter off-gas passes through primary off-gas treatment systems that include submerged-bed scrubbers (SBSs) and wet-electrostatic precipitators (WESPs). Condensates from the HLW SBSs and WESPs are recycled

1.3
to the pretreatment front end evaporator. Condensates from the LAW SBSs and WESPs are recycled to the pretreatment back-end evaporator. In addition, the LAW vitrification system includes a secondary off-gas treatment system that includes a final caustic scrubber. A small fraction of the total 99Tc and 129I inventory to the LAW vitrification facility is expected to be captured in the caustic scrubber solution. That caustic scrubber solution is recycled back to the condensate collection tanks. Collectively, the pretreatment evaporator condensates and the LAW melter off-gas caustic scrubber solution form the secondary waste stream that is transferred from WTP to ETF for disposition.
Figure 1.1. Schematic of Secondary Waste Sources
The LAW melter off-gas SBS and WESP condensates are recycled back to the pretreatment facility
and ultimately back to the LAW melter. Under some operational scenarios, some or all of the condensate from the LAW melter off-gas SBS and WESP would go directly to a secondary waste stream exiting the WTP. For example, in an “early LAW” scenario, the LAW melter would begin operations using selected tank wastes before the pretreatment facility came on line. In this case, the SBS and WESP condensates would be combined with the caustic scrubber as a single liquid secondary waste stream from the WTP. In another scenario, a fraction of the SBS/WESP condensate would be bled from the recycle stream that is sent back to the pretreatment facility to limit the buildup of constituents in the LAW melter feed that would reduce the waste in the LAW glass. In some recent secondary waste form testing, a 10% fraction of the SBS/WESP condensate was assumed to be bled off and combined with caustic scrubber in the secondary waste stream to ETF.
1.4
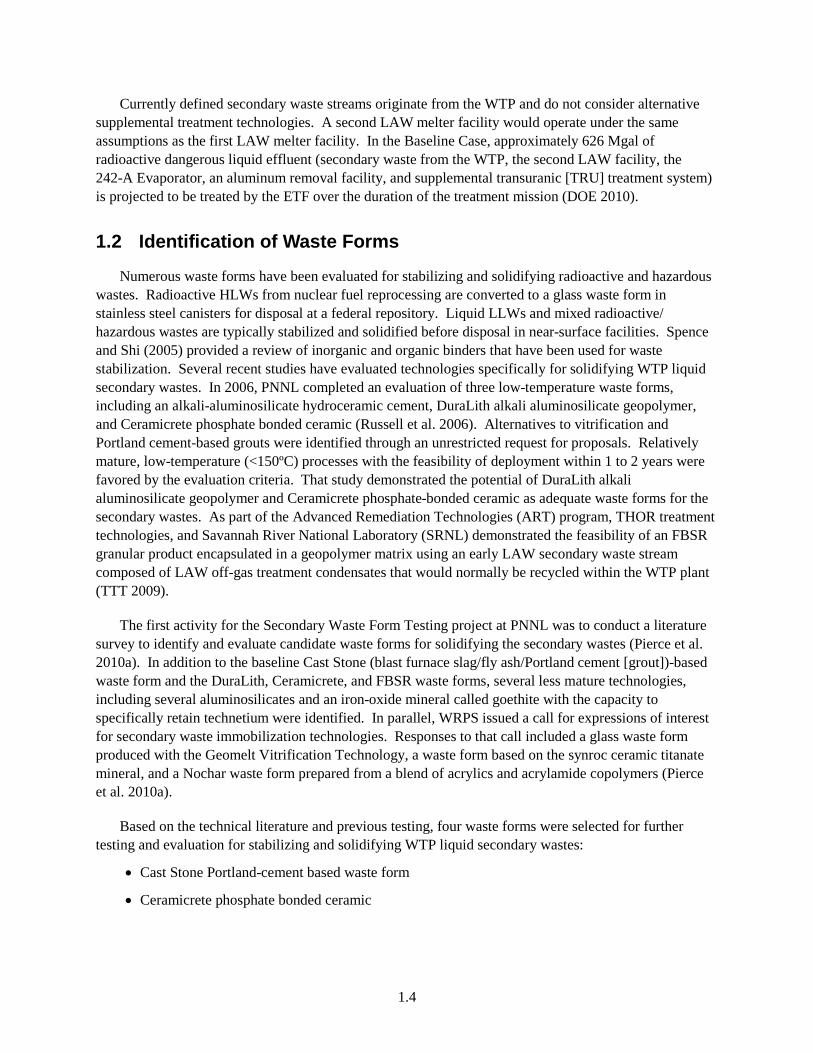
Currently defined secondary waste streams originate from the WTP and do not consider alternative supplemental treatment technologies. A second LAW melter facility would operate under the same assumptions as the first LAW melter facility. In the Baseline Case, approximately 626 Mgal of radioactive dangerous liquid effluent (secondary waste from the WTP, the second LAW facility, the 242-A Evaporator, an aluminum removal facility, and supplemental transuranic [TRU] treatment system) is projected to be treated by the ETF over the duration of the treatment mission (DOE 2010).
1.2 Identification of Waste Forms
Numerous waste forms have been evaluated for stabilizing and solidifying radioactive and hazardous wastes. Radioactive HLWs from nuclear fuel reprocessing are converted to a glass waste form in stainless steel canisters for disposal at a federal repository. Liquid LLWs and mixed radioactive/ hazardous wastes are typically stabilized and solidified before disposal in near-surface facilities. Spence and Shi (2005) provided a review of inorganic and organic binders that have been used for waste stabilization. Several recent studies have evaluated technologies specifically for solidifying WTP liquid secondary wastes. In 2006, PNNL completed an evaluation of three low-temperature waste forms, including an alkali-aluminosilicate hydroceramic cement, DuraLith alkali aluminosilicate geopolymer, and Ceramicrete phosphate bonded ceramic (Russell et al. 2006). Alternatives to vitrification and Portland cement-based grouts were identified through an unrestricted request for proposals. Relatively mature, low-temperature (<150ºC) processes with the feasibility of deployment within 1 to 2 years were favored by the evaluation criteria. That study demonstrated the potential of DuraLith alkali aluminosilicate geopolymer and Ceramicrete phosphate-bonded ceramic as adequate waste forms for the secondary wastes. As part of the Advanced Remediation Technologies (ART) program, THOR treatment technologies, and Savannah River National Laboratory (SRNL) demonstrated the feasibility of an FBSR granular product encapsulated in a geopolymer matrix using an early LAW secondary waste stream composed of LAW off-gas treatment condensates that would normally be recycled within the WTP plant (TTT 2009).
The first activity for the Secondary Waste Form Testing project at PNNL was to conduct a literature survey to identify and evaluate candidate waste forms for solidifying the secondary wastes (Pierce et al. 2010a). In addition to the baseline Cast Stone (blast furnace slag/fly ash/Portland cement [grout])-based waste form and the DuraLith, Ceramicrete, and FBSR waste forms, several less mature technologies, including several aluminosilicates and an iron-oxide mineral called goethite with the capacity to specifically retain technetium were identified. In parallel, WRPS issued a call for expressions of interest for secondary waste immobilization technologies. Responses to that call included a glass waste form produced with the Geomelt Vitrification Technology, a waste form based on the synroc ceramic titanate mineral, and a Nochar waste form prepared from a blend of acrylics and acrylamide copolymers (Pierce et al. 2010a).
Based on the technical literature and previous testing, four waste forms were selected for further testing and evaluation for stabilizing and solidifying WTP liquid secondary wastes:
• Cast Stone Portland-cement based waste form
• Ceramicrete phosphate bonded ceramic
1.5
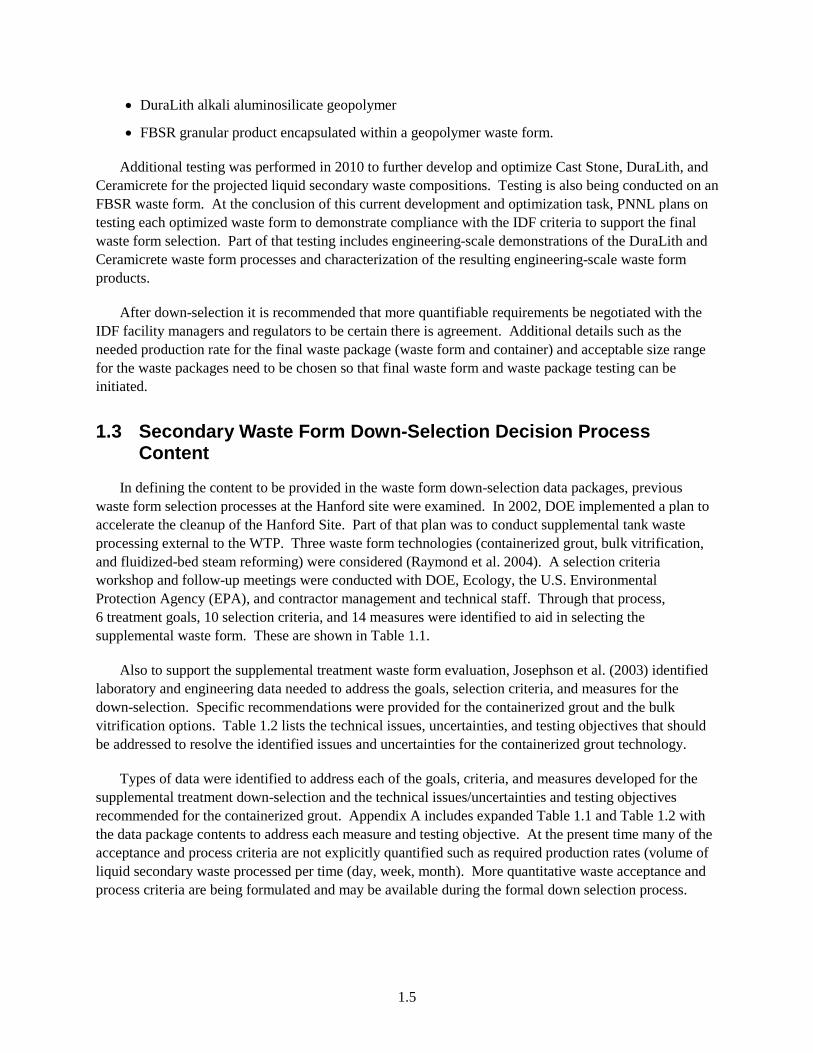
• DuraLith alkali aluminosilicate geopolymer
• FBSR granular product encapsulated within a geopolymer waste form.
Additional testing was performed in 2010 to further develop and optimize Cast Stone, DuraLith, and Ceramicrete for the projected liquid secondary waste compositions. Testing is also being conducted on an FBSR waste form. At the conclusion of this current development and optimization task, PNNL plans on testing each optimized waste form to demonstrate compliance with the IDF criteria to support the final waste form selection. Part of that testing includes engineering-scale demonstrations of the DuraLith and Ceramicrete waste form processes and characterization of the resulting engineering-scale waste form products.
After down-selection it is recommended that more quantifiable requirements be negotiated with the IDF facility managers and regulators to be certain there is agreement. Additional details such as the needed production rate for the final waste package (waste form and container) and acceptable size range for the waste packages need to be chosen so that final waste form and waste package testing can be initiated.
1.3 Secondary Waste Form Down-Selection Decision Process Content
In defining the content to be provided in the waste form down-selection data packages, previous waste form selection processes at the Hanford site were examined. In 2002, DOE implemented a plan to accelerate the cleanup of the Hanford Site. Part of that plan was to conduct supplemental tank waste processing external to the WTP. Three waste form technologies (containerized grout, bulk vitrification, and fluidized-bed steam reforming) were considered (Raymond et al. 2004). A selection criteria workshop and follow-up meetings were conducted with DOE, Ecology, the U.S. Environmental Protection Agency (EPA), and contractor management and technical staff. Through that process, 6 treatment goals, 10 selection criteria, and 14 measures were identified to aid in selecting the supplemental waste form. These are shown in Table 1.1.
Also to support the supplemental treatment waste form evaluation, Josephson et al. (2003) identified laboratory and engineering data needed to address the goals, selection criteria, and measures for the down-selection. Specific recommendations were provided for the containerized grout and the bulk vitrification options. Table 1.2 lists the technical issues, uncertainties, and testing objectives that should be addressed to resolve the identified issues and uncertainties for the containerized grout technology.
Types of data were identified to address each of the goals, criteria, and measures developed for the supplemental treatment down-selection and the technical issues/uncertainties and testing objectives recommended for the containerized grout. Appendix A includes expanded Table 1.1 and Table 1.2 with the data package contents to address each measure and testing objective. At the present time many of the acceptance and process criteria are not explicitly quantified such as required production rates (volume of liquid secondary waste processed per time (day, week, month). More quantitative waste acceptance and process criteria are being formulated and may be available during the formal down selection process.
1.6
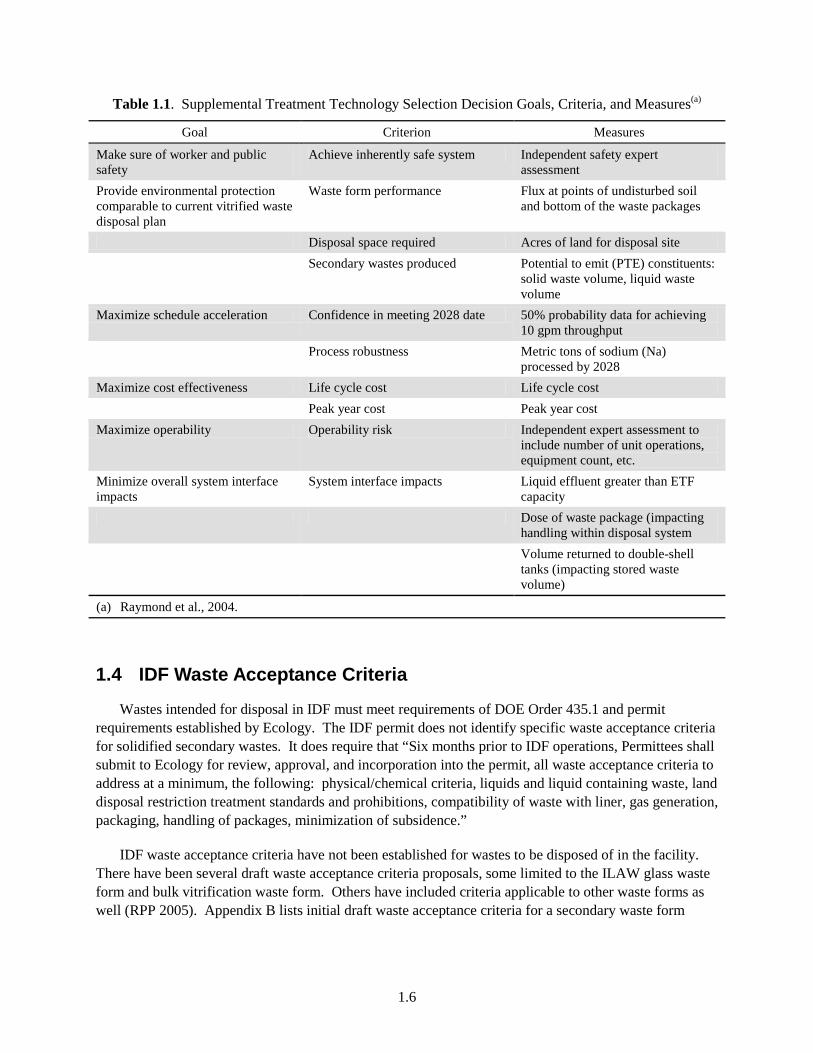
Table 1.1. Supplemental Treatment Technology Selection Decision Goals, Criteria, and Measures(a)
Goal Criterion Measures
Make sure of worker and public safety
Achieve inherently safe system Independent safety expert assessment
Provide environmental protection comparable to current vitrified waste disposal plan
Waste form performance Flux at points of undisturbed soil and bottom of the waste packages
Disposal space required Acres of land for disposal site Secondary wastes produced Potential to emit (PTE) constituents:
solid waste volume, liquid waste volume
Maximize schedule acceleration Confidence in meeting 2028 date 50% probability data for achieving 10 gpm throughput
Process robustness Metric tons of sodium (Na) processed by 2028
Maximize cost effectiveness Life cycle cost Life cycle cost Peak year cost Peak year cost Maximize operability Operability risk Independent expert assessment to
include number of unit operations, equipment count, etc.
Minimize overall system interface impacts
System interface impacts Liquid effluent greater than ETF capacity
Dose of waste package (impacting handling within disposal system
Volume returned to double-shell tanks (impacting stored waste volume)
(a) Raymond et al., 2004.
1.4 IDF Waste Acceptance Criteria
Wastes intended for disposal in IDF must meet requirements of DOE Order 435.1 and permit requirements established by Ecology. The IDF permit does not identify specific waste acceptance criteria for solidified secondary wastes. It does require that “Six months prior to IDF operations, Permittees shall submit to Ecology for review, approval, and incorporation into the permit, all waste acceptance criteria to address at a minimum, the following: physical/chemical criteria, liquids and liquid containing waste, land disposal restriction treatment standards and prohibitions, compatibility of waste with liner, gas generation, packaging, handling of packages, minimization of subsidence.”
IDF waste acceptance criteria have not been established for wastes to be disposed of in the facility. There have been several draft waste acceptance criteria proposals, some limited to the ILAW glass waste form and bulk vitrification waste form. Others have included criteria applicable to other waste forms as well (RPP 2005). Appendix B lists initial draft waste acceptance criteria for a secondary waste form
1.7
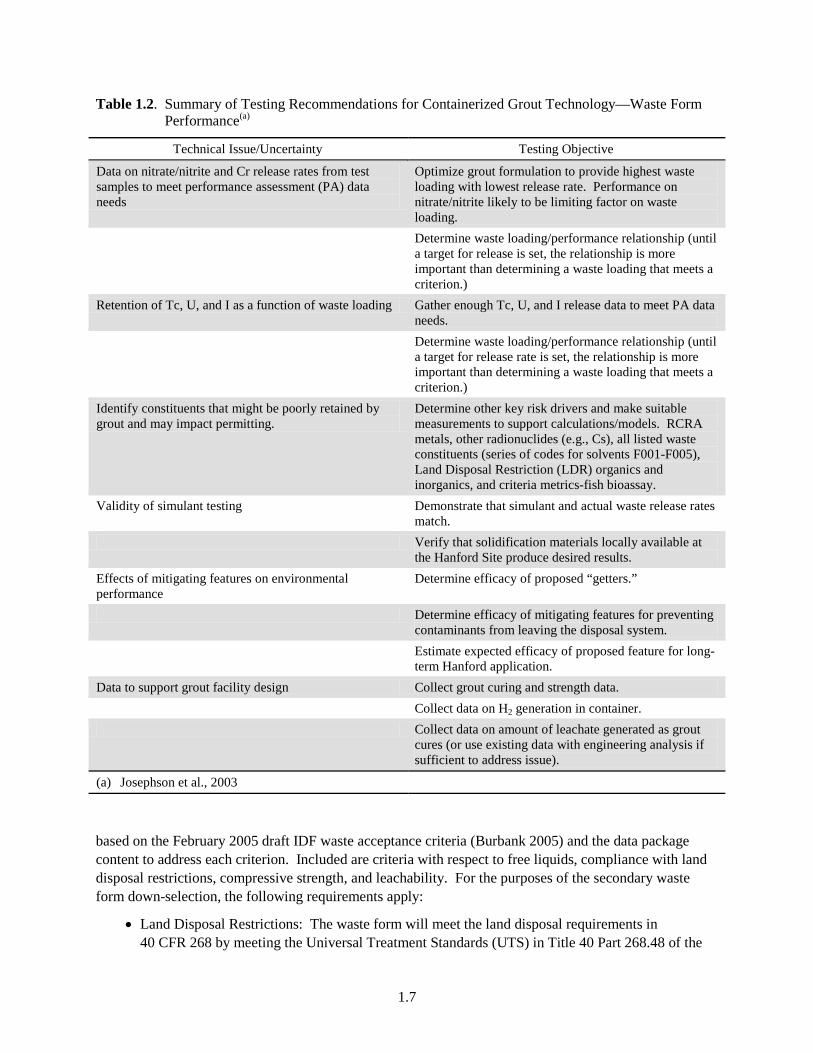
Table 1.2. Summary of Testing Recommendations for Containerized Grout Technology—Waste Form Performance(a)
Technical Issue/Uncertainty Testing Objective
Data on nitrate/nitrite and Cr release rates from test samples to meet performance assessment (PA) data needs
Optimize grout formulation to provide highest waste loading with lowest release rate. Performance on nitrate/nitrite likely to be limiting factor on waste loading.
Determine waste loading/performance relationship (until a target for release is set, the relationship is more important than determining a waste loading that meets a criterion.)
Retention of Tc, U, and I as a function of waste loading Gather enough Tc, U, and I release data to meet PA data needs.
Determine waste loading/performance relationship (until a target for release rate is set, the relationship is more important than determining a waste loading that meets a criterion.)
Identify constituents that might be poorly retained by grout and may impact permitting.
Determine other key risk drivers and make suitable measurements to support calculations/models. RCRA metals, other radionuclides (e.g., Cs), all listed waste constituents (series of codes for solvents F001-F005), Land Disposal Restriction (LDR) organics and inorganics, and criteria metrics-fish bioassay.
Validity of simulant testing Demonstrate that simulant and actual waste release rates match.
Verify that solidification materials locally available at the Hanford Site produce desired results.
Effects of mitigating features on environmental performance
Determine efficacy of proposed “getters.”
Determine efficacy of mitigating features for preventing contaminants from leaving the disposal system.
Estimate expected efficacy of proposed feature for long-term Hanford application.
Data to support grout facility design Collect grout curing and strength data. Collect data on H2 generation in container. Collect data on amount of leachate generated as grout
cures (or use existing data with engineering analysis if sufficient to address issue).
(a) Josephson et al., 2003
based on the February 2005 draft IDF waste acceptance criteria (Burbank 2005) and the data package content to address each criterion. Included are criteria with respect to free liquids, compliance with land disposal restrictions, compressive strength, and leachability. For the purposes of the secondary waste form down-selection, the following requirements apply:
• Land Disposal Restrictions: The waste form will meet the land disposal requirements in 40 CFR 268 by meeting the Universal Treatment Standards (UTS) in Title 40 Part 268.48 of the

1.8
Code of Federal Regulations (CFR) via the Toxicity Characteristic Leach Procedure (TCLP) test (EPA 2000)
• Free Liquids: The waste form shall contain no detectable free liquids as defined in SW-846 Method 9095.
• Leachability Index (LI): The waste form shall have a sodium LI greater than 6.0 when tested in deionized water (DIW) using the American National Standards Institute/American Nuclear Society (ANSI/ANS)-16.1 method or EPA Method 1315 (EPA 2009c). The waste form shall have a rhenium or technetium LI greater than 9.0. These requirements are based on the Nuclear Regulatory Commission’s Technical Position on Waste Form (NRC 1991) and on early waste disposal risk assessments and performance assessment (PA) analyses. The stated values need to be validated and verified based on future risk assessments and PA analyses. It is anticipated that future PA analyses will address and bound long-term durability issues for the stabilized secondary waste from, package and overall IDF disposal system.
• Compressive Strength: The compressive strength of the waste form shall be at least 3.54E6 Pa (500 psi) when tested in accordance with ASTM International (formerly the American Society for Testing and Materials) (ASTM) C39/C39M. This is based on NRC’s Technical Position on Waste Form (NRC 1991), which is more restrictive for cement-based waste forms. The NRC (1991) also recommends testing compressive strength of monoliths after they have been exposed to several cycles of water immersion, thermal (freeze-thaw) cycling, biodegradation and radiation. Some of these exposure cycling tests are being performed but others such as the biodegradation and radiation testing may not be performed based on available literature that found either no or limited impact.
Langton (2003) compares the Saltstone waste form and Saltstone Vault disposal system performance versus the requirements enforced by the South Carolina Department of Health and Environmental Control (SCDHEC) and EPA regulatory limits. At Hanford we caution that other IDF waste acceptance criteria or state and Federal regulatory requirements may be established in the area of waste form/waste package long-term durability and component property evolution once more detailed long-term performance assessment activities are performed. Therefore the members of the down-selection team should consider other possible requirements besides those mentioned in this subsection.
1.5 Data Package Content
Each of the four data packages begins with a description of the waste form in Section 2. This includes the primary waste form, any encapsulating materials used to make the waste form monolithic, and the types of liquid wastes tested. Section 3 describes the waste form preparation process, including starting materials and generalized processing steps needed to form a solid waste form. At the present time, decisions have not been made on containerization requirements for secondary waste forms so this topic is not included. Further, in the Cast Stone/Saltstone waste form literature evaluated there were no studies on the entire waste package (grout inside a container). There have been some studies and modeling for the entire Saltstone disposal system (Saltstone contained in concrete vaults) but these studies are not considered relevant for the secondary waste packages likely to be sent to the IDF. Section 4 expands upon the information in Section 3 to include flowsheet and equipment descriptions, process control, off-gas treatment and process effluents, and identification of existing test and production facilities. Physical properties of the waste form are presented in Section 5. Section 6 focuses on waste

1.9
form performance, including leach test results and mechanisms of radionuclide and hazardous chemical containment and release. In Section 6, several subsections discuss long-term assessment of grout waste form durability and performance issues. Data that address specific IDF waste acceptance criteria are provided in Section 7. Section 8 concludes with a summary of the strengths and weaknesses of the waste form.

2.1
2.0 Waste Form Description
Cast Stone (also called “Containerized Cast Stone”) is a cementitious waste form that is a mixture of Class F fly ash, Grade 100 or 120 ground blast furnace slag,1 and Type I/II Portland cement. CH2M HILL Hanford Group, Inc., developed this waste form to solidify numerous waste streams, including secondary waste generated at the Hanford Site. The Cast Stone cementitious waste form is the current baseline for solidifying the liquid secondary wastes from WTP. A very similar waste form was developed earlier at SRNL and is still actively used to solidify low-activity defense waste liquids at the Savannah River Site. The term Saltstone is used at SRNL for this cementitious waste form.
Both of these waste forms rely on the same three major ingredients to form a final hardened product when mixed with liquid wastes currently stored in underground storage tanks at these two DOE defense site. Other minor ingredients, such as lime (calcium hydroxide), clays, zeolites, and “getter” materials are sometimes added to the Cast Stone or Saltstone dry blend mix to improve either physical stability or chemical properties (e.g., improve retention of contaminants). For some formulations, either the fly ash or blast furnace slag (BFS) is omitted from the dry blend or replaced by another material.
The key properties desired and accomplished by using Cast Stone or Saltstone are 1) creation of a solid waste form that has adequate physical strength to withstand handling and transportation to a final disposal facility, 2) contaminants of concern present in the liquid waste that was stabilized are retained by a combination of physical and chemical processes, and 3) resistance to dissolution/disintegration by recharge water or atmospheric gases percolating through the disposal facility. The basic process that occurs when the Cast Stone dry ingredients are mixed with liquid wastes is called hydration; this refers to chemical reactions between the compounds in the dry blend with water from the liquid waste that form new minerals and solids that bind together to form a cohesive but porous mass that both physically and chemically entraps waste species. By tailoring the dry blend proportions, the hardened cohesive solid contains mostly very small pores (nano- and micro-meter-sized) that are tortuously connected, which results in a solid with very low permeability or hydraulic conductivity. Thus, the flow of water through the Cast Stone solid is very slow or non-existent and forces diffusion to be the main mechanism for dissolved species to migrate through the solid. In a similar fashion, atmospheric gases, such as oxygen and carbon dioxide, also migrate through the Cast Stone, predominantly controlled by diffusion.
The key attributes of especially the Portland and slag cements that make Cast Stone a good waste form candidate are 1) the high pH environment of the cement matrix, which lowers the solubility of most metallic constituents, 2) good chemical and physical stabilization properties for most contaminants of concern present in the liquid waste, 3) the relatively low hydraulic conductivity (permeability) of the hardened paste to both water and gas transport, and 4) relatively long-term physical and chemical durability under near-surface environmental conditions. Although some contaminants can be incorporated into the structure of the hydrated calcium silicate phases, the precipitation of low-solubility metal hydroxides in the high-pH internal pore-water environment is the primary stabilization mechanism.
One key attribute of the Portland cement that make Cast Stone a good waste form candidate is the high pH environment initially formed during hydration that chemically stabilizes certain constituents of concern (COCs) as low solubility phases. However, the early pore solution pH is in the range of 12 to 13,
1 Ground blast furnace slag is now commonly referred to as slag cement rather than ground BFS.

2.2
well above the minimum solubility for most of the potentially hazardous RCRA metals and many metallic radionuclides. Consequently, to moderate the extremely high pH, pozzolans such as fly ash, which reacts with the calcium hydroxide to form insoluble matrix phases, is usually added along with the dry Portland cement. The pozzolans lower the internal pore water pH to 9 to 11, an optimum range for precipitation of many metals and radionuclides. At SRNL, a good review article on the function of each of the three dry blend ingredients was published in 2007 (Langton 2007). Succinctly, the slag cement, when ground finer than Portland cement is used to increase the rate and amount of hydration reactions during the early stages. In addition sulfide (S2-) present in the glassy phases of slag acts as a reductant of species such as Tc(VII), Cr(VI), and U(VI) in the waste liquids which promotes their stabilization as more insoluble species than their oxidized species. Finally, because most vendors mix in some calcium sulfate (gypsum) during the grinding of the slag cement, the gypsum also reacts with alumina contents in the slag to form expansive aluminosulfate phases early in the hydration process before the waste form becomes too “stiff” to accommodate expansion without crack formation. Slag hydration products result in better physical stabilization than those obtained by Portland cement hydration. Thus slag has been substituted for a large percentage of Portland cement in mixes to solidify highly caustic liquid waste streams. Fly ash is added to the dry blend because it reacts (hydrates) slower than slag and Portland cement and thus generates less heat and aids in keeping the wet slurry from setting too quickly and causing water loss from excess heating. The Portland cement is the major contributor of the Ca required to form the desired C-S-H gel in the final waste form. The value of 10% was chosen for Saltstone because of difficulties metering in lesser percentages to the entire dry blend using the equipment chosen at the Saltstone facility. Another key requirement is that all three dry blend materials be ground to particle sizes between 1 and 30 µm to keep the wet slurry “stable” from becoming stratified and to reduce particle settling during the transport and final disposal in the concrete vaults. Similar considerations are recommended during final optimization of the Cast Stone recipe should it be down-selected.
Several review articles (Mattus and Gilliam 1994; Langton et al. 2001; Milestone et al. 2006), books (Neville 1996; Taylor 1990), and Section 3.0 in the Cast Stone Phase II report (Sundaram et al. 2011) provide more details on cement hydration processes and the underlying chemical and physical processes that give Cast Stone and Saltstone their desired properties. These resources can be read to gain a deeper understanding. Bear in mind that “cement” has been used in construction to bind materials together for over 2000 years. The Romans used lime and pumice to create a hydraulic mixture to “cement” the building materials used for such famous structures (still standing or functional today) as the Pantheon, Baths of Caracalla, and Roman aqueducts (Hill 1984). In the 1700s, the British and French formalized recipes for hydraulic cements and used them to make forts, harbors, and other buildings. Modern Portland cement was patented in 1824 by a British person named Joseph Aspdin (Francis 1977).
2.1 Cast Stone Ingredients
The oxide composition and some of the physical properties for the three major Cast Stone dry ingredients that were used by PNNL to solidify/stabilize secondary liquid waste during the Phase II activities (see Sundaram et al. 2011) are shown in Table 2.1. The Portland cement and BFS were obtained from LaFarge North America, Inc. (closest office Pasco, Washington). The Cement Test Report that accompanied the cement is found in Appendix E. The fly ash, ASTM C-618 Class F from a power plant in Centralia, Washington, was obtained from Lonestar (Seattle, Washington) and some specification information from Lonestar is found in Appendix E.

2.3
Table 2.1. Oxide Composition of Cast Stone Dry Blend Ingredients Used by PNNL in Phase II Studies (Sundaram et al. 2011)
Chemical Analysis (wt%) Cement Fly ash Slag SiO2 20.2 49.0 32.4
Al2O3 4.8 16.1 12.2 Fe2O3 3.4 6.2 0.9 CaO 64.0 14.1 43.4
Na2O(a) 0.5 4.24 0.88 K2O (b) - - - MgO 0.8 4.6 4.9
CaCO3 3.2 - - SO3 2.7 0.8 4.9
Unaccounted minor compounds 0.4 4.96 0.42 C3S 62.22 - - C2S 10.98 - - C3A 6.97 - -
C4AF 10.35 - - Specific Gravity (g/cm3) 3.15 2.58 2.89
Specific Surface area (m2/g) 1.05 - 0.515 Average Particle Size (μm) 19
Color Grey Light brown White (a) Usually an equivalent content of Na2O is used to represent the
alkali contents in cement. An equivalent content of Na2O can be calculated with the Na2O content + 0.658 × K2O content.
(b) The K2O content is not specified from the manufacturer because it is already included in the equivalent Na2O content.
Oxide compositions for the cementitious reagents used by the original Cast Stone developers back in the 1990s are listed in Table C.1 and are similar to the analyses shown in Table 2.1. The range of oxide compositions of the Portland cement, grade 100 slag and Class F fly ash used to produce Saltstone at Savannah River are shown in Appendix F, Table F.6. The Savannah River slag has a lower alumina content (6.6 to 8.4 vs. 12.2%, lower calcium oxide (35 to 38.5 vs. 43.4%), lower SO3 content (0.3 to 2.08 vs. 4.9%) but higher magnesium oxide content (12.9 to 13.1 vs. 4.9%) than the PNNL slag. The Savannah River fly ash has as much lower calcium oxide content (0.6 to 0.7 vs. 14.1% and much higher alumina content (28.6 vs. 16.1%) than the PNNL fly ash. Differences in alumina and calcium oxide contents can be important in the rate of hydration and final properties of the grout as mentioned several times in this data package.
Cement chemists use a shorthand notation to describe the oxides in cement as shown in the Abbreviations section at the beginning of this report. Using these abbreviations, cement chemists then create another shorthand notation for the calcium alumina-silicate (and other oxides) compounds in the dry powder. The four main phases present in Portland cement powder (clinker) are defined in Table 2.2.
The phase composition of the hydrated end products of a particular dry cement mix can be quantified through a complex set of calculations known as the Bogue calculation as discussed in Criscenti and Serne (1990), Berner (1986), and Bogue (1929).

2.4
Table 2.2. Abbreviations and Description of the Minerals in Portland Cement
Abbreviation Actual Formula Name Mineral Phase C3S 3 CaO • SiO2 Tricalcium silicate Alite C2S 2 CaO • SiO2 Dicalcium silicate Belite C3A 3 CaO • Al2O3 Tricalcium aluminate Aluminate or Celite
C4AF 4 CaO • Al2O3 • Fe2O3 Tetracalcium alumino ferrite Brownmillerite
2.2 Cast Stone Reagent Phase Composition and Mineralogy
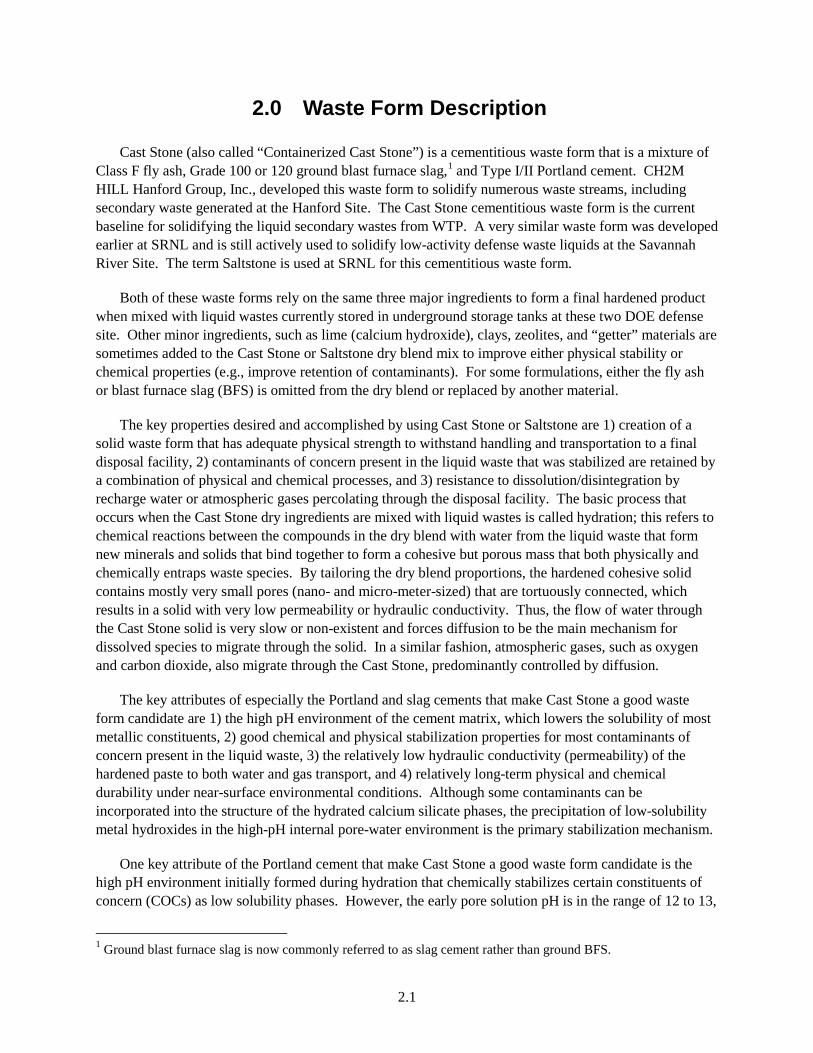
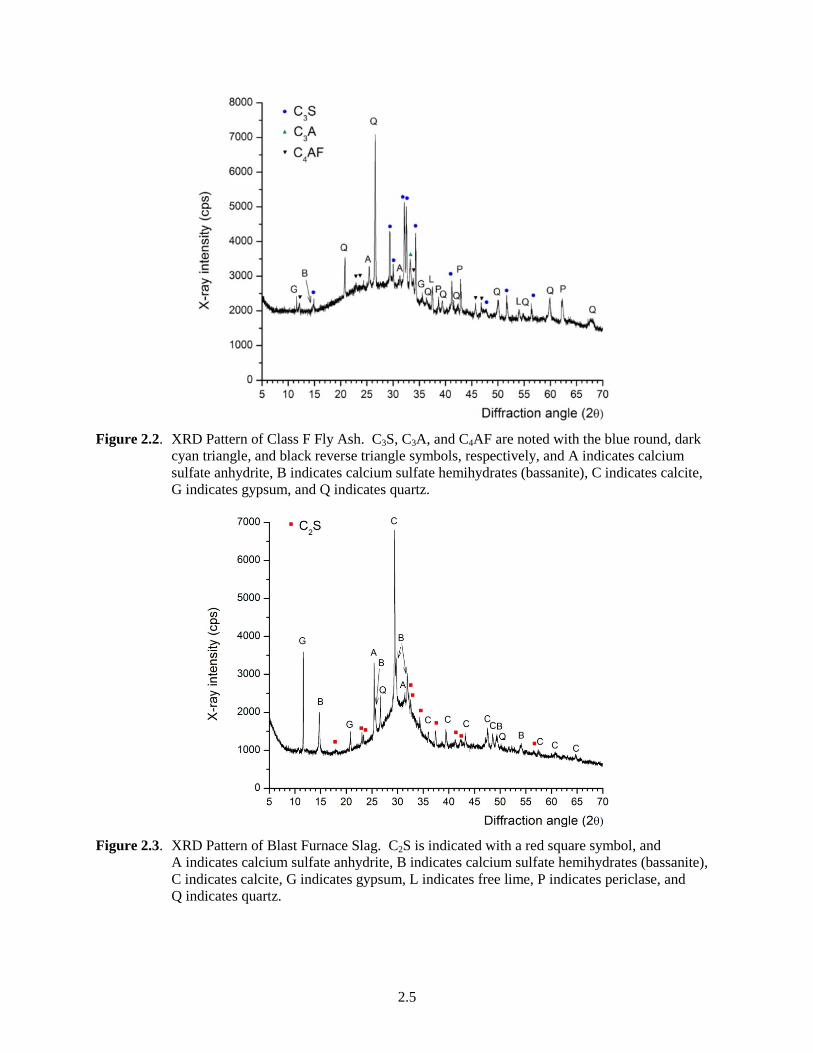
The mineralogy of the crystalline portions of the three dry blend ingredients used to make the Cast Stone formulation are shown in Figure 2.1 (cement), Figure 2.2 (fly ash), and Figure 2.3 (BFS). The abbreviations CXS, CXA, etc. used in the figures (to reduce clutter) reflect the presence of the minerals shown in the right hand column of Table 2.2.
Figure 2.1. X-Ray Diffraction (XRD) Patterns of Unhydrated Type II Portland Cement. C3S, C2S, C3A,
and C4AF are noted with blue round, red square, dark cyan, and black reverse triangle symbols, respectively, and B indicates calcium sulfate hemihydrates (bassanite), C indicates calcite, and G indicates gypsum.
2.5
Figure 2.2. XRD Pattern of Class F Fly Ash. C3S, C3A, and C4AF are noted with the blue round, dark cyan triangle, and black reverse triangle symbols, respectively, and A indicates calcium sulfate anhydrite, B indicates calcium sulfate hemihydrates (bassanite), C indicates calcite, G indicates gypsum, and Q indicates quartz.
Figure 2.3. XRD Pattern of Blast Furnace Slag. C2S is indicated with a red square symbol, and A indicates calcium sulfate anhydrite, B indicates calcium sulfate hemihydrates (bassanite), C indicates calcite, G indicates gypsum, L indicates free lime, P indicates periclase, and Q indicates quartz.

2.6
The mineralogy of the cement dry powder contains the four common phases in proportions typical for Type I or II Portland cement. In addition, two forms of calcium sulfate, gypsum and calcium sulfate hemihydrate (bassanite), were observed from the XRD pattern. Calcium sulfate hemihydrates is sometimes incorporated on purpose to control the reactivity of C3A, the presence of two different sulfate polymorphs indicates that the clinker grinding process elevated the temperature of the material within the mill so that some of the gypsum was dehydrated to form the hemihydrate. Calcite was also observed in the XRD pattern. ASTM C-150 allows up to 5 wt% pulverized limestone to be interground and mixed with common Portland cement to enhance early strength gain. Most Portland cement manufacturers add ~3 wt% limestone flour to their Portland cement to safely stay under the 5% maximum limit.
The fly ash XRD pattern shows a broad amorphous band with many crystalline peaks. The cooling process at the coal power plant from which this material was obtained appears to have been slow enough that it did not prevent aluminosilicate phases from crystallizing. An interesting finding is that three of the four main phases in cement, C3S, C3A, and C4AF, were also observed in this fly ash. Although the phase composition of fly ash can vary quite a bit, it is not common to see these phases in class F fly ash. The fly ash material could have been contaminated with a small amount of cement prior to shipment to PNNL but there was no intermixing at PNNL prior to the mineralogical characterization.
Free lime, periclase, gypsum, anhydrite, and quartz were also observed in this fly ash. The presence of periclase is expected, considering the amount of MgO shown in Table 2.1. However, the presence of gypsum, hemihydrates, and anhydrite is surprising because the SO3 content in the fly ash is only 0.8%. As shown in Table 2.1, the calcium oxide content of this fly ash is 14.1%, which falls into the category of high-calcium fly ash. When calculating the total oxide contents, excluding CaO, which is 71.4%, this fly ash barely passes the requirement of class F fly ash (ASTM 2008a, C-618), which is >70% non-calcium oxides. Most class F fly ash normally contains around 3~5% the CaO content. The fly ash that was used in making the Phase II Cast Stone waste forms, which has a relatively greater CaO content, would exhibit hydration reactions by itself unlike most fly ashes used in the Saltstone grout mixes.
The XRD patterns for the BFS used in the Cast Stone dry mix shows a quite sharp amorphous band, centered at about 31°. The amorphous band is not as broad as that of fly ash, indicating that the slag is relatively more crystalline than the fly ash. The BFS also shows many crystalline phases, such as C2S, calcite, quartz, gypsum, hemihydrates (bassanite), and anhydrite. With the presence of C2S, the slag will hydrate in a similar manner to cement but at a slower rate. The calcite, gypsum, bassanite, and anhydrite are not commonly observed phases in slag at the levels observed, which indicates that this slag was likely mixed and milled with limestone and gypsum at the time of production.1 A recommendation has been made to investigate other sources of slag (with lower alumina and sulfur oxide) in the future should Cast Stone be chosen in the down-selection process
2.3 Particle Size of Dry Blend
Particle-size characterization of the dry blend materials used to form the Phase II Cast Stone was measured with a Mastersizer 2000 (Malvern Instruments, Inc., Southborough, MA 01772 USA), which has a Hydro G wet dispersion accessory (equipped with a continuously variable and independent pump, 1 Calcium sulfates are added to slags that have high aluminate contents to control expansion. A lot of high Al2O3 slag comes from Mexico and Japan and is not the type of slag used at the Savannah River Site (personal communication Dr. Christine Langton, SRNL, June 6, 2011).
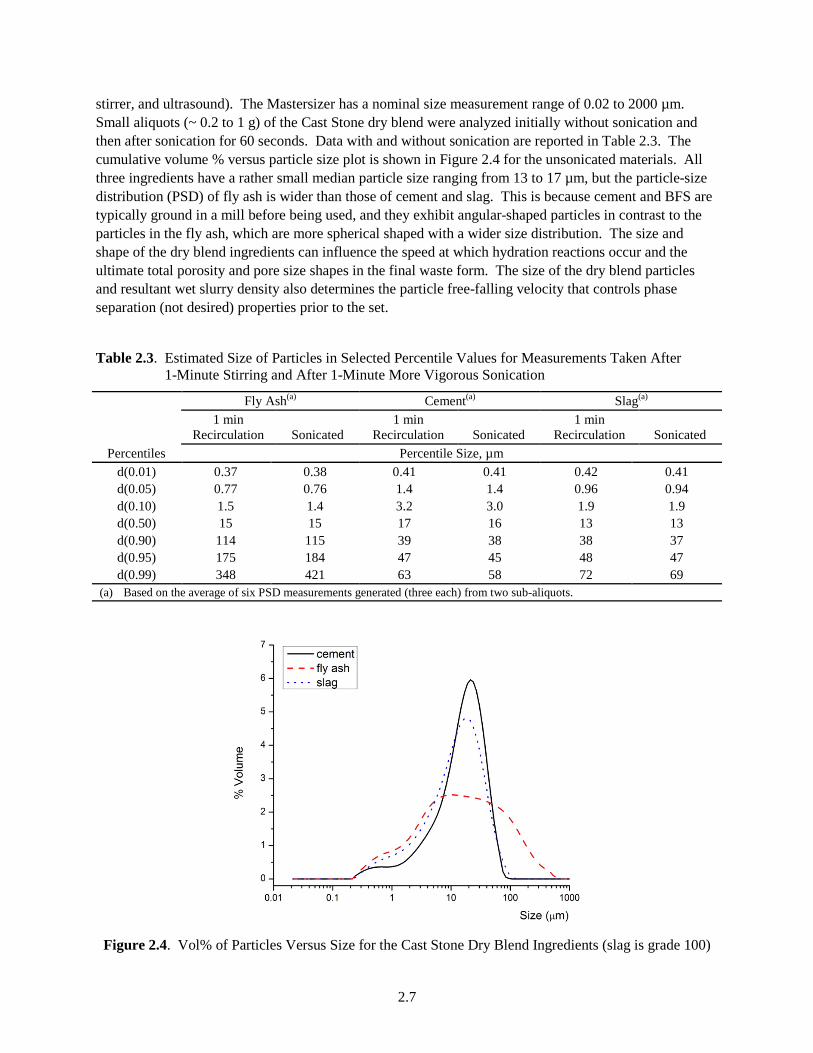
2.7
stirrer, and ultrasound). The Mastersizer has a nominal size measurement range of 0.02 to 2000 µm. Small aliquots (~ 0.2 to 1 g) of the Cast Stone dry blend were analyzed initially without sonication and then after sonication for 60 seconds. Data with and without sonication are reported in Table 2.3. The cumulative volume % versus particle size plot is shown in Figure 2.4 for the unsonicated materials. All three ingredients have a rather small median particle size ranging from 13 to 17 µm, but the particle-size distribution (PSD) of fly ash is wider than those of cement and slag. This is because cement and BFS are typically ground in a mill before being used, and they exhibit angular-shaped particles in contrast to the particles in the fly ash, which are more spherical shaped with a wider size distribution. The size and shape of the dry blend ingredients can influence the speed at which hydration reactions occur and the ultimate total porosity and pore size shapes in the final waste form. The size of the dry blend particles and resultant wet slurry density also determines the particle free-falling velocity that controls phase separation (not desired) properties prior to the set.
Table 2.3. Estimated Size of Particles in Selected Percentile Values for Measurements Taken After 1-Minute Stirring and After 1-Minute More Vigorous Sonication
Percentiles
Fly Ash(a) Cement(a) Slag(a) 1 min
Recirculation Sonicated 1 min
Recirculation Sonicated 1 min
Recirculation Sonicated Percentile Size, µm
d(0.01) 0.37 0.38 0.41 0.41 0.42 0.41 d(0.05) 0.77 0.76 1.4 1.4 0.96 0.94 d(0.10) 1.5 1.4 3.2 3.0 1.9 1.9 d(0.50) 15 15 17 16 13 13 d(0.90) 114 115 39 38 38 37 d(0.95) 175 184 47 45 48 47 d(0.99) 348 421 63 58 72 69
(a) Based on the average of six PSD measurements generated (three each) from two sub-aliquots.
Figure 2.4. Vol% of Particles Versus Size for the Cast Stone Dry Blend Ingredients (slag is grade 100)

2.8
2.4 Getters/Reductants
The Cast Stone dry blend formulations used to date by PNNL to solidify and stabilize secondary waste simulants have not relied on adding other “getter” ingredients besides the BFS, which is a good reducing agent for several redox-sensitive elements, such as 99Tc. However, as part of waste form data package reviews there was a desire to explicitly identify getter additives that may be effective at reducing the mobility of problematic contaminants such as 99Tc and 129I. Thus, Cast Stone and Saltstone getter literature was reviewed and is summarized in this subsection.
2.4.1 Silver-Based, Phosphate-Based and Ion Exchange Resin Getters
Lockrem et al. (2005) added several getters to the early Hanford Cast Stone dry blend formulations to solidify a secondary waste simulant (Table 2.4) that contained high I concentrations spiked as NaI at starting simulant concentrations of 4.25, 8.50, 17.0, 43.0, and 172 mg NaI/L. In addition, one batch of secondary waste simulant was spiked with 54 mg Hg(NO3)2•2H2O/L. Getters included two silver-bearing additives (silver zeolite and silver mordenite), two calcium phosphate compounds (Will Form; a calcium phosphate product designed to form a hydroxyapatite-like structure within the cement-based matrix), and bone char (Cosmic Black #7; a calcium phosphate animal bone charcoal product). The test matrix where these four getters were added to Cast Stone waste forms created with the secondary waste simulant (shown in Table 2.4) spiked with various concentrations of iodide and Hg(II) are found in Appendix D (Figures D.1 through D.5). As will be discussed later (in Section 6.3.2) the form of silver that is stable in waste forms that include highly reducing agents such as BFS and stannous (Sn[II]) reagents can cause silver to reduce to its metallic form, which does not exhibit iodide sequestering properties. Further, under the relatively oxidizing conditions found in shallow subsurface environments, silver iodate is the thermodynamically stable silver salt instead of silver iodide. Silver iodate is much more soluble than silver iodide.
Table 2.4. Waste Simulant Used for Iodine Rich Secondary Waste (Lockrem et al. 2005)
M g/kg Reagent g/L g/kg Na 2.00 63.44 NH4OH 40.06 35.14
NH4 1.14 18.07 NaOH 49.45 43.38 Acetate 0.09 4.47 NaCH3COO 7.08 6.21
NO3 0.02 0.96 NaNO3 1.50 1.31 CO3 0.90 47.48 Na2CO3 95.63 83.88 OH 1.24 35.50 H2O 946.29(a)
830.08 H20 830.08
Total g 1000.00 Total g 1140 (a) 1000.00 (a) This simulant recipe is a dilution down to 2 M Na based on a 5-M Na based-concentration for the off-gas project from use of the OLI-ESP code Mahoney and Russell (2004). It was found that precipitation occurred with the 5-M recipe described in Mahoney and Russell (2004). Therefore the recipe was adjusted with water until the solution was at 2 M sodium. No 2-M Na specific density was reported in Lockrem et al. (2005), so an estimate was made based on similarity to Simulant 4 in Table 2.8.
A second getter study involving Cast Stone was documented in Harbour et al. (2004). The getter hydroxyapatite [a naturally occurring mineral form of calcium apatite with the formula Ca5(PO4)3(OH)],
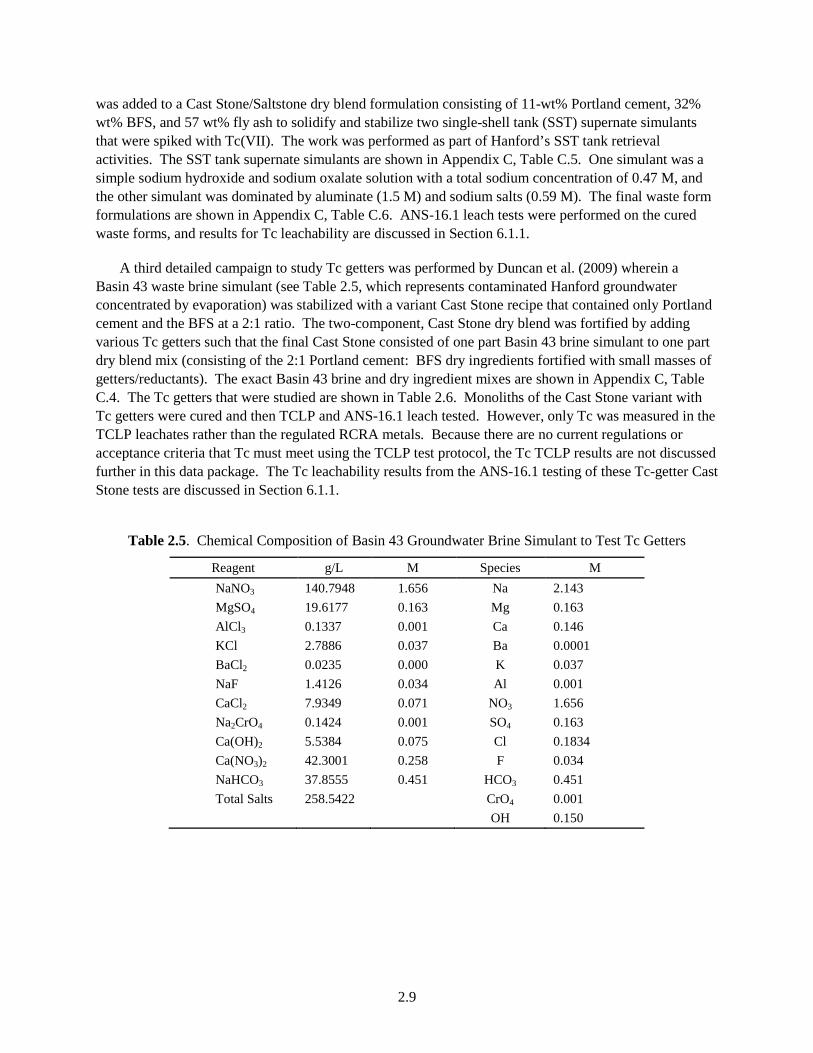
2.9
was added to a Cast Stone/Saltstone dry blend formulation consisting of 11-wt% Portland cement, 32% wt% BFS, and 57 wt% fly ash to solidify and stabilize two single-shell tank (SST) supernate simulants that were spiked with Tc(VII). The work was performed as part of Hanford’s SST tank retrieval activities. The SST tank supernate simulants are shown in Appendix C, Table C.5. One simulant was a simple sodium hydroxide and sodium oxalate solution with a total sodium concentration of 0.47 M, and the other simulant was dominated by aluminate (1.5 M) and sodium salts (0.59 M). The final waste form formulations are shown in Appendix C, Table C.6. ANS-16.1 leach tests were performed on the cured waste forms, and results for Tc leachability are discussed in Section 6.1.1.
A third detailed campaign to study Tc getters was performed by Duncan et al. (2009) wherein a Basin 43 waste brine simulant (see Table 2.5, which represents contaminated Hanford groundwater concentrated by evaporation) was stabilized with a variant Cast Stone recipe that contained only Portland cement and the BFS at a 2:1 ratio. The two-component, Cast Stone dry blend was fortified by adding various Tc getters such that the final Cast Stone consisted of one part Basin 43 brine simulant to one part dry blend mix (consisting of the 2:1 Portland cement: BFS dry ingredients fortified with small masses of getters/reductants). The exact Basin 43 brine and dry ingredient mixes are shown in Appendix C, Table C.4. The Tc getters that were studied are shown in Table 2.6. Monoliths of the Cast Stone variant with Tc getters were cured and then TCLP and ANS-16.1 leach tested. However, only Tc was measured in the TCLP leachates rather than the regulated RCRA metals. Because there are no current regulations or acceptance criteria that Tc must meet using the TCLP test protocol, the Tc TCLP results are not discussed further in this data package. The Tc leachability results from the ANS-16.1 testing of these Tc-getter Cast Stone tests are discussed in Section 6.1.1.
Table 2.5. Chemical Composition of Basin 43 Groundwater Brine Simulant to Test Tc Getters
Reagent g/L M Species M NaNO3 140.7948 1.656 Na 2.143 MgSO4 19.6177 0.163 Mg 0.163 AlCl3 0.1337 0.001 Ca 0.146 KCl 2.7886 0.037 Ba 0.0001 BaCl2 0.0235 0.000 K 0.037 NaF 1.4126 0.034 Al 0.001 CaCl2 7.9349 0.071 NO3 1.656 Na2CrO4 0.1424 0.001 SO4 0.163 Ca(OH)2 5.5384 0.075 Cl 0.1834 Ca(NO3)2 42.3001 0.258 F 0.034 NaHCO3 37.8555 0.451 HCO3 0.451 Total Salts 258.5422 CrO4 0.001 OH 0.150
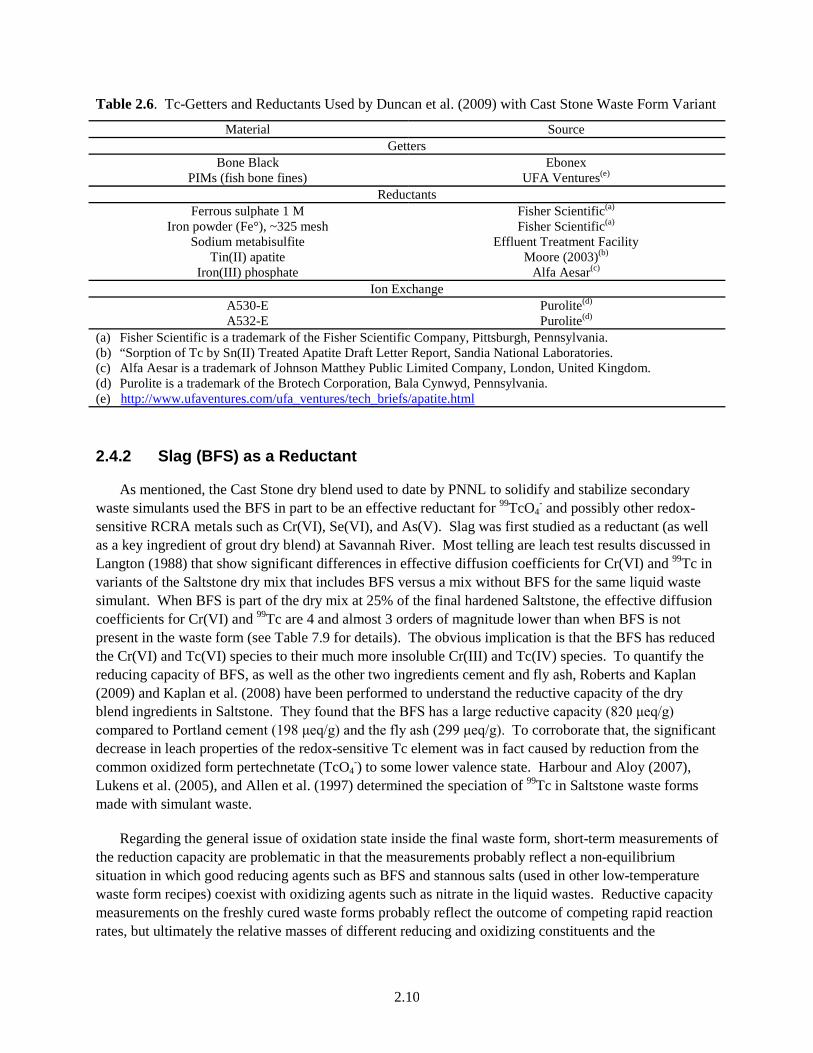
2.10
Table 2.6. Tc-Getters and Reductants Used by Duncan et al. (2009) with Cast Stone Waste Form Variant
Material Source Getters
Bone Black Ebonex PIMs (fish bone fines) UFA Ventures(e)
Reductants Ferrous sulphate 1 M Fisher Scientific(a)
Iron powder (Fe°), ~325 mesh Fisher Scientific(a) Sodium metabisulfite Effluent Treatment Facility
Tin(II) apatite Moore (2003)(b) Iron(III) phosphate Alfa Aesar(c)
Ion Exchange A530-E Purolite(d) A532-E Purolite(d)
(a) Fisher Scientific is a trademark of the Fisher Scientific Company, Pittsburgh, Pennsylvania. (b) “Sorption of Tc by Sn(II) Treated Apatite Draft Letter Report, Sandia National Laboratories. (c) Alfa Aesar is a trademark of Johnson Matthey Public Limited Company, London, United Kingdom. (d) Purolite is a trademark of the Brotech Corporation, Bala Cynwyd, Pennsylvania. (e) http://www.ufaventures.com/ufa_ventures/tech_briefs/apatite.html
2.4.2 Slag (BFS) as a Reductant
As mentioned, the Cast Stone dry blend used to date by PNNL to solidify and stabilize secondary waste simulants used the BFS in part to be an effective reductant for 99TcO4
- and possibly other redox-sensitive RCRA metals such as Cr(VI), Se(VI), and As(V). Slag was first studied as a reductant (as well as a key ingredient of grout dry blend) at Savannah River. Most telling are leach test results discussed in Langton (1988) that show significant differences in effective diffusion coefficients for Cr(VI) and 99Tc in variants of the Saltstone dry mix that includes BFS versus a mix without BFS for the same liquid waste simulant. When BFS is part of the dry mix at 25% of the final hardened Saltstone, the effective diffusion coefficients for Cr(VI) and 99Tc are 4 and almost 3 orders of magnitude lower than when BFS is not present in the waste form (see Table 7.9 for details). The obvious implication is that the BFS has reduced the Cr(VI) and Tc(VI) species to their much more insoluble Cr(III) and Tc(IV) species. To quantify the reducing capacity of BFS, as well as the other two ingredients cement and fly ash, Roberts and Kaplan (2009) and Kaplan et al. (2008) have been performed to understand the reductive capacity of the dry blend ingredients in Saltstone. They found that the BFS has a large reductive capacity (820 μeq/g) compared to Portland cement (198 μeq/g) and the fly ash (299 μeq/g). To corroborate that, the significant decrease in leach properties of the redox-sensitive Tc element was in fact caused by reduction from the common oxidized form pertechnetate (TcO4
-) to some lower valence state. Harbour and Aloy (2007), Lukens et al. (2005), and Allen et al. (1997) determined the speciation of 99Tc in Saltstone waste forms made with simulant waste.
Regarding the general issue of oxidation state inside the final waste form, short-term measurements of the reduction capacity are problematic in that the measurements probably reflect a non-equilibrium situation in which good reducing agents such as BFS and stannous salts (used in other low-temperature waste form recipes) coexist with oxidizing agents such as nitrate in the liquid wastes. Reductive capacity measurements on the freshly cured waste forms probably reflect the outcome of competing rapid reaction rates, but ultimately the relative masses of different reducing and oxidizing constituents and the
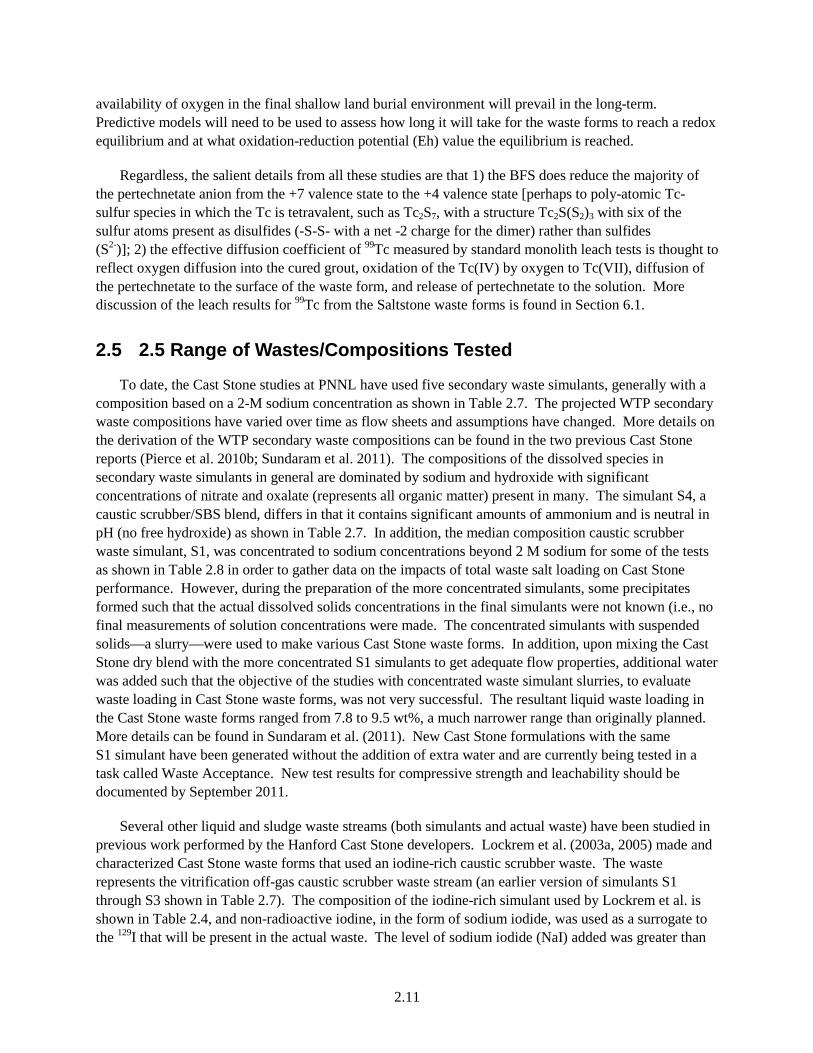
2.11
availability of oxygen in the final shallow land burial environment will prevail in the long-term. Predictive models will need to be used to assess how long it will take for the waste forms to reach a redox equilibrium and at what oxidation-reduction potential (Eh) value the equilibrium is reached.
Regardless, the salient details from all these studies are that 1) the BFS does reduce the majority of the pertechnetate anion from the +7 valence state to the +4 valence state [perhaps to poly-atomic Tc-sulfur species in which the Tc is tetravalent, such as Tc2S7, with a structure Tc2S(S2)3 with six of the sulfur atoms present as disulfides (-S-S- with a net -2 charge for the dimer) rather than sulfides (S2-)]; 2) the effective diffusion coefficient of 99Tc measured by standard monolith leach tests is thought to reflect oxygen diffusion into the cured grout, oxidation of the Tc(IV) by oxygen to Tc(VII), diffusion of the pertechnetate to the surface of the waste form, and release of pertechnetate to the solution. More discussion of the leach results for 99Tc from the Saltstone waste forms is found in Section 6.1.
2.5 2.5 Range of Wastes/Compositions Tested
To date, the Cast Stone studies at PNNL have used five secondary waste simulants, generally with a composition based on a 2-M sodium concentration as shown in Table 2.7. The projected WTP secondary waste compositions have varied over time as flow sheets and assumptions have changed. More details on the derivation of the WTP secondary waste compositions can be found in the two previous Cast Stone reports (Pierce et al. 2010b; Sundaram et al. 2011). The compositions of the dissolved species in secondary waste simulants in general are dominated by sodium and hydroxide with significant concentrations of nitrate and oxalate (represents all organic matter) present in many. The simulant S4, a caustic scrubber/SBS blend, differs in that it contains significant amounts of ammonium and is neutral in pH (no free hydroxide) as shown in Table 2.7. In addition, the median composition caustic scrubber waste simulant, S1, was concentrated to sodium concentrations beyond 2 M sodium for some of the tests as shown in Table 2.8 in order to gather data on the impacts of total waste salt loading on Cast Stone performance. However, during the preparation of the more concentrated simulants, some precipitates formed such that the actual dissolved solids concentrations in the final simulants were not known (i.e., no final measurements of solution concentrations were made. The concentrated simulants with suspended solids—a slurry—were used to make various Cast Stone waste forms. In addition, upon mixing the Cast Stone dry blend with the more concentrated S1 simulants to get adequate flow properties, additional water was added such that the objective of the studies with concentrated waste simulant slurries, to evaluate waste loading in Cast Stone waste forms, was not very successful. The resultant liquid waste loading in the Cast Stone waste forms ranged from 7.8 to 9.5 wt%, a much narrower range than originally planned. More details can be found in Sundaram et al. (2011). New Cast Stone formulations with the same S1 simulant have been generated without the addition of extra water and are currently being tested in a task called Waste Acceptance. New test results for compressive strength and leachability should be documented by September 2011.
Several other liquid and sludge waste streams (both simulants and actual waste) have been studied in previous work performed by the Hanford Cast Stone developers. Lockrem et al. (2003a, 2005) made and characterized Cast Stone waste forms that used an iodine-rich caustic scrubber waste. The waste represents the vitrification off-gas caustic scrubber waste stream (an earlier version of simulants S1 through S3 shown in Table 2.7). The composition of the iodine-rich simulant used by Lockrem et al. is shown in Table 2.4, and non-radioactive iodine, in the form of sodium iodide, was used as a surrogate to the 129I that will be present in the actual waste. The level of sodium iodide (NaI) added was greater than
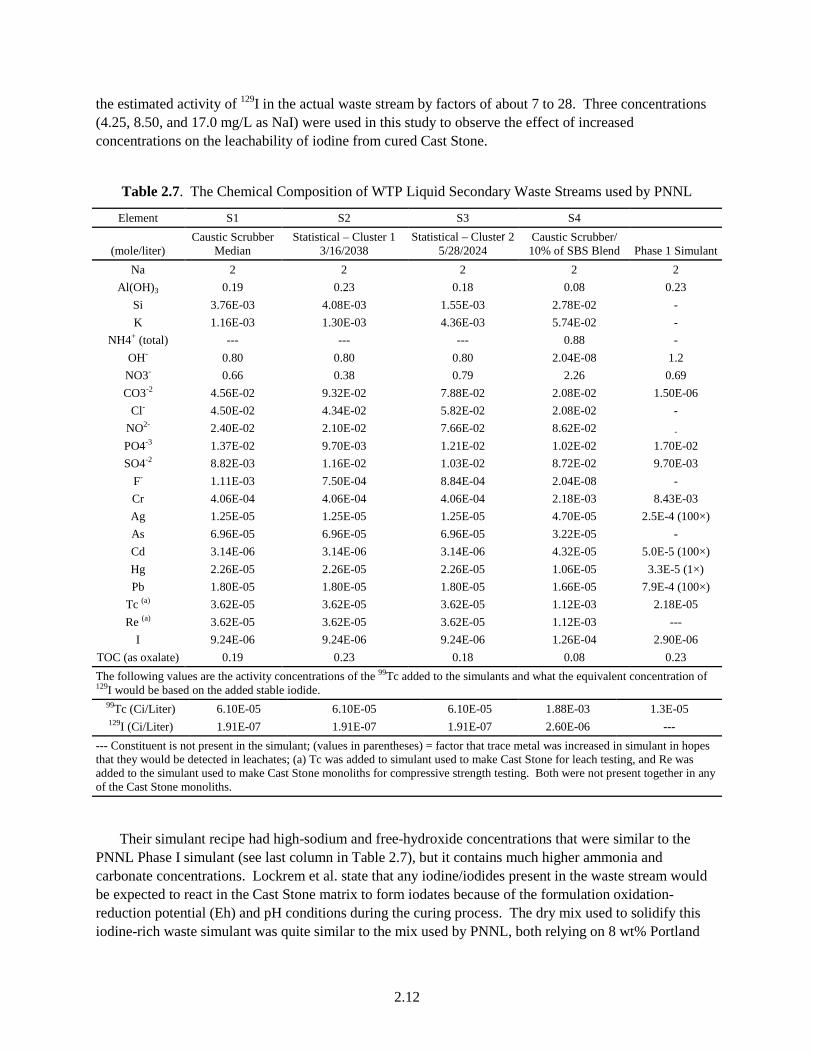
2.12
the estimated activity of 129I in the actual waste stream by factors of about 7 to 28. Three concentrations (4.25, 8.50, and 17.0 mg/L as NaI) were used in this study to observe the effect of increased concentrations on the leachability of iodine from cured Cast Stone.
Table 2.7. The Chemical Composition of WTP Liquid Secondary Waste Streams used by PNNL
Element S1 S2 S3 S4
(mole/liter) Caustic Scrubber
Median Statistical – Cluster 1
3/16/2038 Statistical – Cluster 2
5/28/2024 Caustic Scrubber/ 10% of SBS Blend Phase 1 Simulant
Na 2 2 2 2 2 Al(OH)3 0.19 0.23 0.18 0.08 0.23
Si 3.76E-03 4.08E-03 1.55E-03 2.78E-02 - K 1.16E-03 1.30E-03 4.36E-03 5.74E-02 -
NH4+ (total) --- --- --- 0.88 - OH- 0.80 0.80 0.80 2.04E-08 1.2 NO3- 0.66 0.38 0.79 2.26 0.69
CO3-2 4.56E-02 9.32E-02 7.88E-02 2.08E-02 1.50E-06 Cl- 4.50E-02 4.34E-02 5.82E-02 2.08E-02 -
NO2- 2.40E-02 2.10E-02 7.66E-02 8.62E-02 -
PO4-3 1.37E-02 9.70E-03 1.21E-02 1.02E-02 1.70E-02 SO4-2 8.82E-03 1.16E-02 1.03E-02 8.72E-02 9.70E-03
F- 1.11E-03 7.50E-04 8.84E-04 2.04E-08 - Cr 4.06E-04 4.06E-04 4.06E-04 2.18E-03 8.43E-03 Ag 1.25E-05 1.25E-05 1.25E-05 4.70E-05 2.5E-4 (100×) As 6.96E-05 6.96E-05 6.96E-05 3.22E-05 - Cd 3.14E-06 3.14E-06 3.14E-06 4.32E-05 5.0E-5 (100×) Hg 2.26E-05 2.26E-05 2.26E-05 1.06E-05 3.3E-5 (1×) Pb 1.80E-05 1.80E-05 1.80E-05 1.66E-05 7.9E-4 (100×)
Tc (a) 3.62E-05 3.62E-05 3.62E-05 1.12E-03 2.18E-05 Re (a) 3.62E-05 3.62E-05 3.62E-05 1.12E-03 ---
I 9.24E-06 9.24E-06 9.24E-06 1.26E-04 2.90E-06 TOC (as oxalate) 0.19 0.23 0.18 0.08 0.23 The following values are the activity concentrations of the 99Tc added to the simulants and what the equivalent concentration of 129I would be based on the added stable iodide.
99Tc (Ci/Liter) 6.10E-05 6.10E-05 6.10E-05 1.88E-03 1.3E-05 129I (Ci/Liter) 1.91E-07 1.91E-07 1.91E-07 2.60E-06 ---
--- Constituent is not present in the simulant; (values in parentheses) = factor that trace metal was increased in simulant in hopes that they would be detected in leachates; (a) Tc was added to simulant used to make Cast Stone for leach testing, and Re was added to the simulant used to make Cast Stone monoliths for compressive strength testing. Both were not present together in any of the Cast Stone monoliths.
Their simulant recipe had high-sodium and free-hydroxide concentrations that were similar to the PNNL Phase I simulant (see last column in Table 2.7), but it contains much higher ammonia and carbonate concentrations. Lockrem et al. state that any iodine/iodides present in the waste stream would be expected to react in the Cast Stone matrix to form iodates because of the formulation oxidation-reduction potential (Eh) and pH conditions during the curing process. The dry mix used to solidify this iodine-rich waste simulant was quite similar to the mix used by PNNL, both relying on 8 wt% Portland
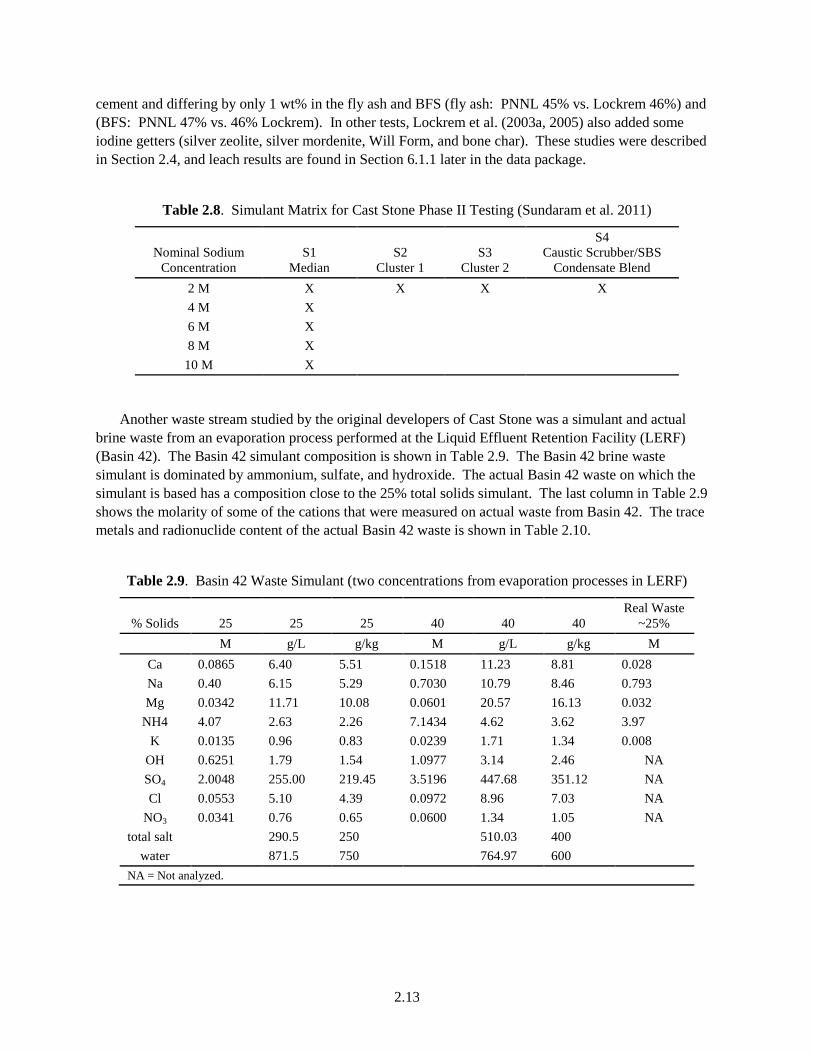
2.13
cement and differing by only 1 wt% in the fly ash and BFS (fly ash: PNNL 45% vs. Lockrem 46%) and (BFS: PNNL 47% vs. 46% Lockrem). In other tests, Lockrem et al. (2003a, 2005) also added some iodine getters (silver zeolite, silver mordenite, Will Form, and bone char). These studies were described in Section 2.4, and leach results are found in Section 6.1.1 later in the data package.
Table 2.8. Simulant Matrix for Cast Stone Phase II Testing (Sundaram et al. 2011)
Nominal Sodium Concentration
S1 Median
S2 Cluster 1
S3 Cluster 2
S4 Caustic Scrubber/SBS
Condensate Blend 2 M X X X X 4 M X 6 M X 8 M X
10 M X
Another waste stream studied by the original developers of Cast Stone was a simulant and actual brine waste from an evaporation process performed at the Liquid Effluent Retention Facility (LERF) (Basin 42). The Basin 42 simulant composition is shown in Table 2.9. The Basin 42 brine waste simulant is dominated by ammonium, sulfate, and hydroxide. The actual Basin 42 waste on which the simulant is based has a composition close to the 25% total solids simulant. The last column in Table 2.9 shows the molarity of some of the cations that were measured on actual waste from Basin 42. The trace metals and radionuclide content of the actual Basin 42 waste is shown in Table 2.10.
Table 2.9. Basin 42 Waste Simulant (two concentrations from evaporation processes in LERF)
% Solids 25 25 25 40 40 40 Real Waste
~25% M g/L g/kg M g/L g/kg M
Ca 0.0865 6.40 5.51 0.1518 11.23 8.81 0.028 Na 0.40 6.15 5.29 0.7030 10.79 8.46 0.793 Mg 0.0342 11.71 10.08 0.0601 20.57 16.13 0.032
NH4 4.07 2.63 2.26 7.1434 4.62 3.62 3.97 K 0.0135 0.96 0.83 0.0239 1.71 1.34 0.008
OH 0.6251 1.79 1.54 1.0977 3.14 2.46 NA SO4 2.0048 255.00 219.45 3.5196 447.68 351.12 NA Cl 0.0553 5.10 4.39 0.0972 8.96 7.03 NA
NO3 0.0341 0.76 0.65 0.0600 1.34 1.05 NA total salt 290.5 250 510.03 400
water 871.5 750 764.97 600 NA = Not analyzed.

2.14
Table 2.10. Concentrations (mg/L) of Trace Metals and Radionuclides in Actual Basin 42 Brine
Element mg/L Element mg/L Ag <0.05 Mn 2.06 Al 1.21 Mo 1.12 As 2.22 Ni 4.42 B 7.28 P 215 Ba 0.51 Pb <0.30 Be <0.04 Sb <0.25 Cd <0.04 Se <0.40 Cr 4.8 Si 78.7 Co 0.16 Sr 6.56 Cs 0.011 99Tc 10,176 pCi/L Cu 1.74 Tl <1.0 Fe 38.5 U 3.51 Hg <0.002 V 2.66 129I 353 pCi/L Zn 3.79 Li 1.22
Inductively coupled plasma (ICP) or ICP-mass spectroscopy (MS) analyses of actual Basin 42 waste.
The two concentrations of Basin 42 simulant were spiked with trace concentrations of arsenic (500 mg/L), barium (10,000 mg/L), cadmium (100 mg/L), chromium (500 mg/L), lead (500 mg/L), mercury (20 mg/L), selenium (100 mg/L), and silver (500 mg/L) so that leach data on these RCRA metals could be obtained. Both solids concentrations of the Basin 42 simulant and the actual Basin 42 brine were solidified in a modified Cast Stone dry blend that consisted of the standard Cast Stone dry mix blend (8% Portland cement, 46% fly ash, and 46% granular BFS) and a calcium aluminosilicate (SECAR 51). The SECAR 51 was used to speed up the formation of ettringite before the slurry hardened to avoid expansion problems caused by the high sulfate concentration in the Basin 42 brine. The actual Basin 42 brine was used to form Cast Stone waste forms from the common lab-scale to 5-gallon-bucket-size. Finally, a meter cubed block of Cast Stone was made with the Basin 42 brine simulant. More details on the performance of Basin 42 brine Cast Stone waste forms will be discussed in sections to follow. As shown in Table 2.9, this waste stream has very large concentrations of ammonia, which has been observed to volatilize while mixing Cast Stone dry blend with this waste, and Simulant 4 in the secondary waste simulant work performed by PNNL (Sundaram et al. 2011). The Basin 42 simulants-Cast Stone formulations that were deemed best after much formulation testing are shown in Table 2.11. The Cast Stone formula used for the actual Basin 42 brine at ~25% total dissolved solids (TDS) and 40% TDS are shown in Table 2.12.
In a second phase of work on the Basin 42 brine, Cooke et al. (2006a,b) studied 54 more formulations that did not contain calcium aluminate (SECAR 51) for the 40% TDS Basin 42 brine using the 40% TDS simulant in Table 2.9. They narrowed formulations down to four that were further tested as 5-gallon-sized monoliths to evaluate bleed water, expansion (the high sulfate content in the liquid waste is a concern), cure temperature rise, and compressive strength. The four formulations chosen are listed in Table 2.13. The new formulations discarded the SECAR 51 in favor of lime [Ca(OH)2] to promote the fast formation of ettringite to minimize expansion and cracking after the waste form hardens. The cost of

2.15
SECAR 51 and the observation that its use leads to greater evolution of ammonia gas and waste form cracking late in the curing/hydration process were reasons that a switch to lime was made in the work conducted in 2006.
Table 2.11. Basin 42 Simulated Brine Cast Stone Formulation
Component wt% wt% DRF(a) 31.34 18.57 SECAR 51 21.29 34.07 Wt% Solids in Brine 25 40 Basin 42 Brine 47.37 47.37 Brine/Solid Blend ratio 0.9 0.9 (a) DRF mix= 8% Portland cement Type I/II + 46% Class F Fly Ash + 46% granular grade 120 BFS.
Table 2.12. Real Basin 42 Brine Cast Stone Formulation
Material Specification
Brine 42 25% TDS
g
Brine 42 40% TDS
g
Brine 42 40% TDS
g Portland cement Type I/II 6.10 3.03 3.03 Fly ash Class F 35.07 17.40 17.40 BFS Grade 120 35.07 17.40 17.40 Bone char Cosmic Black 5.95 5.32 5.32 SECAR 51 42.82 68.49 68.50 Total solids 125.02 111.64 111.65 Brine Waste 99.84 101.39 99.838 Waste to dry solids ratio 0.80 0.91 0.89
Table 2.13. Cast Stone Formulations for 5-Gallon Bucket Testing of 40% TDS Basin 42 Simulant
Formulation ID 6A 18C 19A 21 kg % kg % kg % kg %
DIW 0 0 5.0 25.0 0.0 0 2.6 13.2 Basin 42 Brine 40% 11.1 55.6 5.0 25.0 11.1 56 7.8 39.2 Cement 3.2 16.0 3.6 18.1 3.2 16 3.4 17.2 Fly ash 0 16.0 0.0 0.0 1.6 8 0 0.0 Slag 3.2 12.3 3.6 18.1 1.6 8 3.4 17.2 Lime 2.5 12.3 2.8 13.9 2.5 12 2.6 13.2 100 100 100 100.0 Brine to Solids Ratio 1.25 0.50 1.25 0.82 Liquid to Solids Ratio 1.25 1.00 1.25 1.10
A third waste simulant used by Cooke et al. (2006c, 2008) and Duncan et al. (2009) was a salt concentrate from the evaporation of contaminated groundwater referred as Brine 43. The simulant composition is shown in Table 2.5. Pertechnetate, 92.17 mg/L Tc(VII), was added to many of the formulations to test Tc getters. The dry blend was the binary mixture of Portland cement and BFS at a weight ratio or 2:1. The Brine 43 to dry blend mix used to form waste forms was 1.1 to 1 (110 g of Brine
2.16
43, 66.6 g of Portland cement, and 33.3 g of BFS). When the Tc getters shown in Table 2.6 were used in general, 10 g of a getter were added to the dry mix just described so that the final Brine 43 to dry blend mix ratio became 1 to 1 (110 g Brine 43, 66.6 g Portland cement, 33.3 g BFS, and 10 g Tc getter).
In the future, should the Cast Stone waste form be down selected for additional study it will be necessary perform more systematic studies on the range of waste compositions that can be solidified and that meet performance and durability criteria. At this time all that can be gleaned from the Cast Stone literature is that about a dozen different waste compositions have been successfully solidified and leach and compressive strength (discussion to follow in Section 7.5) tested with the results meeting most acceptance criteria.
2.6 Waste Loading
In the past, some waste form developers have focused on using the sodium content of liquid wastes to quantify the loading in waste forms that are used to solidify and/or stabilize and encapsulate wastes. We believe that a more accurate method of quantifying the loading of future Hanford liquid secondary wastes would be to use the dry mass of total dissolved and suspended solids in the liquid waste stream. We thus have adopted the following definitions of waste loading. Wet waste loading is the ratio of the total mass of liquid waste (but not additional “pure” water added to promote workability) divided by the total mass of all ingredients used. Dry mass loading is defined as the dry mass of dissolved salts plus suspended solids in the liquid waste that are solidified in the final waste form divided by the total mass of the materials used to form the hardened waste form. The total mass of the hardened waste form is assumed to be the sum of the total masses of all the dry blend ingredients (including any getters/set retarders/set accelerators), the liquid waste slurry, and any additional water used in the recipe. This assumes that there is no bleed water removed from the curing waste form and that water or other volatile mass is not lost by evaporation before the waste form is ready for disposal.
The equation for wet waste loading is
% Loading (wet) = 100 * (Mass of liquid waste including suspended solids)/ (Total mass of constituents used in waste form recipe)
The equation for dry waste loading is
% Loading (dry) = 100 * (Mass of dried wastes including suspended solids in the liquid waste)/ (Total mass of constituents used in waste form recipe)
The mass of dry waste can be either directly measured by drying a known mass of the waste slurry in an oven at 105°C or by indirectly by measuring the specific gravity of the waste slurry at a known temperature and knowing the total grams of anhydrous chemical reagents used to make up a liter of simulant. The amount of salt in the mass of liquid waste added to the dry blend is then calculated by dividing the grams of anhydrous chemicals dissolved per liter of simulant by the density of the waste liquid (converted to g/liter) to yield grams of dry salt per gram of waste simulant. One can then take the final recipe for the waste form (mass of simulant or real waste used, mass of each dry ingredient [cement, fly ash, BFS, etc.], and mass of any additional water) and calculate the percentage of dry solids from the liquid waste that has been incorporated into the final waste form.
2.17
The first systematic waste loading studies for Cast Stone are reported in Sundaram et al. (2011) who prepared four secondary waste simulants and also choose one that was used at five different concentrations. The four secondary waste forms and different concentrations for the baseline simulant were shown previously in Table 2.7 and Table 2.8. Simulants S2, S3, and S4 were created to evaluate the robustness of the Cast Stone waste form to waste composition variability. Cast Stone specimens were prepared using each of the eight simulants. After curing, the Cast Stone specimens were characterized for compressive strength, leachability, mineralogy, and pore structure. The workability of the Cast Stone was evaluated through rheology studies to characterize the stiffening and setting of Cast Stone.
S1 simulant composition is the median composition for secondary wastes projected to be generated from the capture of off-gases in caustic scrubbers; Simulant S2 represents a low nitrate plus chloride caustic scrubber variant; Simulant S3 represents a high nitrate plus chloride caustic scrubber variant. The fourth simulant (S4) is a blended secondary baseline simulant plus 10 percent of a simulated LAW melter-SBS effluent from the off-gas treatment process. Simulant S4 does not contain any free sodium hydroxide (i.e., is not a highly caustic solution). The concentrations of many of the regulated RCRA metals were spiked at 10 to 100 times their maximum expected concentrations in actual caustic scrubber secondary waste to facilitate the determination of their leachability. However, the concentrations of two of the regulated metals, Cr and Hg, were not increased over their expected concentrations in actual waste because it was felt they could be adequately measured in leach test solutions. Technetium-99 was also added to all the waste simulants before forming Cast Stone waste monoliths that were subjected to numerous performance tests after curing.
Although the Sundaram et al. (2011) plan was to mix the liquid waste simulants directly with the dry materials, additional DIW had to be added to the mixes to get acceptable workability. The resultant waste sodium concentrations in the liquid mixed with the Cast Stone dry ingredients ranged from 0.52 M to 2.1 M rather than range planned, 2 M to 10 M. Each Cast Stone/waste simulant mix was poured into 2-in. × 4-in. cylinders and cured for 28 days before all the performance testing was commenced. The overall secondary waste loadings in the various Cast Stone waste forms created and characterized by Sundaram et al. (2011) are shown in Table 2.14. In addition, the mass loading of dry solids from the secondary waste contained in the Cast Stone is also found in Table 2.15. As mentioned, new Cast Stone formulations with the same S1 simulant have been generated without the addition of extra water and are currently being tested in a task called Waste Acceptance. New test results for compressive strength and leachability were documented at the same time that this data package was completed (see Mattigod et al. 2011). The compressive strength data for Cast Stone samples made with the S1 simulant at Na concentrations of 2, 4, and 6 M (see Table H.1 in Appendix H of this data package passed the IDF acceptance criteria, and the Tc, Na, and I leach indexes are tabulated below in Table 7.9. The Cast Stone waste forms made for the waste acceptance task using S1 simulant at 2 M, 4 M, and 6 M Na were mixed with no extra water and cured without any problems. Thus the problems reported in Sundaram et al. (2011) were not observed in Mattigod et al. (2011) and loadings of the S1 simulant up to 13.5% wt as shown in Table 2.14.
The similar loading metrics for the Phase I Cast Stone studies using the secondary waste simulant used by Pierce et al. (2010) with the composition shown in the last column in Table 2.7 were 7.25% waste loading and dry solids loading of 0.94%.

2.18
Table 2.14. Waste Loading of Various Secondary Waste Simulants in Cast Stone Waste Forms (Sundaram et al. (2011) and Mattigod et al. (2011))
Sundaram S1 S1 S1 S1 S1 S2 S3 S4 Target Na (M) 2M 4M 6M 8M 10M 2M 2M 2M
Waste Loading (Simulant Wet Mass) 7.85% 8.48% 8.93% 9.47% 9.37% 7.86% 7.98% 8.96% Dry Solids Loading 1.01% 2.01% 2.93% 3.92% 4.65% 0.96% 1.11% 1.89% Mattigod S1 S1 S1 Actual Na (M) 2M 4M 6M Waste Loading (Simulant Wet Mass) 28.5% 32.7% 37.5% Dry Solids Loading 3.4% 7.8% 13.5%
Loading metrics from the original Cast Stone work performed by Cooke, Duncan, Lockrem, and for Saltstone formulations at SRNL as cited in this data package are shown in Table 2.15. As can be seen in Table 2.15, work performed at Hanford and SRNL using different liquid waste simulants and Cast Stone and Saltstone has enabled the loading of significantly larger percentages of liquid waste (and dry salt waste) in waste forms than attempted by PNNL in Phase I and Phase II. All of the Cast Stone, Saltstone, and their variant dry blend waste forms shown in Table 2.15 met the bleed water, compressive strength, short-term leachability, and when tested, TCLP requirements for subsurface burial at their respective sites.
Based on the previous work at Hanford and past and current work at SRNL with the same dry blend ingredients and similar salt brine simulants, even higher waste salt loadings have been achieved (i.e., from 15 to 24% dry salt loading).
In general, as more mass of a given waste is solidified in a given mass of Cast Stone dry blend, the performance properties of the final waste form start to degrade or diminish. Thus, the waste loading needs to be carefully assessed to determine at what percentage the final waste form’s performance properties are not acceptable. Some discussion on the leachability of nitrate as a function of waste loading using both simulant and actual LAW waste solidified in Cast Stone is found in Section 7.4.2.
2.7 Identification of Waste Constituents that Adversely Impact Waste Form Processing/Properties/Waste Loading/Waste Form Setting
One constituent known to impact the heat generated during cementitious waste form production and curing is dissolved aluminum in the liquid waste. Several studies on the impact of increasing the dissolved aluminum (generally aluminate AlO2
-) in the liquid waste have been performed at SRNL (Harbour and Edwards 2009; Harbour et al. 2007b, 2007c, 2008, 2009a, 2009b, 2009c). The results of these studies are discussed in Section 5.1.
Harris and Postles (1991) describe a mathematical model used to optimize the dry blend recipe consisting of Portland cement, calcium hydroxide, fly ash, ground BFS, and a salt solution waste using the effective diffusion coefficient (leach rates) of Cr and nitrate. One of the constraints was that Portland cement and calcium hydroxide cannot both be present in the dry blend mix; that is, one or the other is used, but not both. The mixture model for this five-component system was developed, and 62 mix combinations were tested with rigorous statistical evaluation to come up with the optimum mix. A similar rigorous statistical analysis could be performed for the chosen waste form for stabilizing the Hanford secondary wastes to optimize the loading for each waste liquid composition.
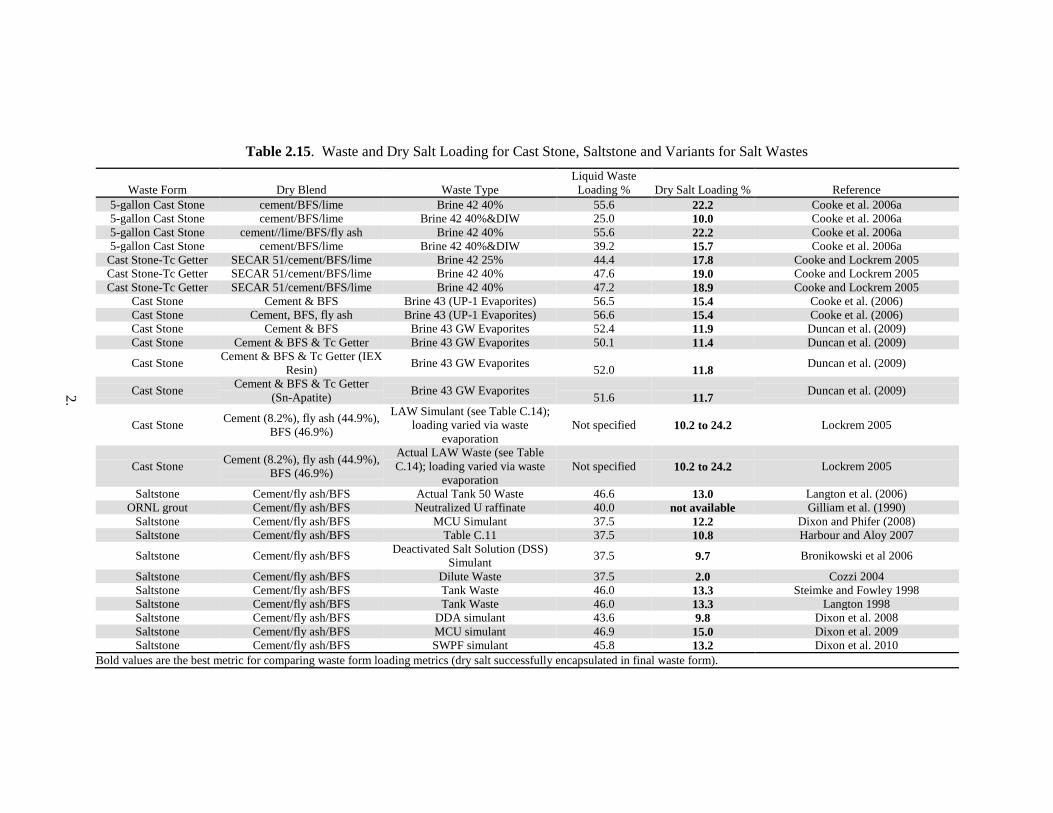
2.
Table 2.15. Waste and Dry Salt Loading for Cast Stone, Saltstone and Variants for Salt Wastes
Waste Form Dry Blend Waste Type Liquid Waste
Loading % Dry Salt Loading % Reference 5-gallon Cast Stone cement/BFS/lime Brine 42 40% 55.6 22.2 Cooke et al. 2006a 5-gallon Cast Stone cement/BFS/lime Brine 42 40%&DIW 25.0 10.0 Cooke et al. 2006a 5-gallon Cast Stone cement//lime/BFS/fly ash Brine 42 40% 55.6 22.2 Cooke et al. 2006a 5-gallon Cast Stone cement/BFS/lime Brine 42 40%&DIW 39.2 15.7 Cooke et al. 2006a
Cast Stone-Tc Getter SECAR 51/cement/BFS/lime Brine 42 25% 44.4 17.8 Cooke and Lockrem 2005 Cast Stone-Tc Getter SECAR 51/cement/BFS/lime Brine 42 40% 47.6 19.0 Cooke and Lockrem 2005 Cast Stone-Tc Getter SECAR 51/cement/BFS/lime Brine 42 40% 47.2 18.9 Cooke and Lockrem 2005
Cast Stone Cement & BFS Brine 43 (UP-1 Evaporites) 56.5 15.4 Cooke et al. (2006) Cast Stone Cement, BFS, fly ash Brine 43 (UP-1 Evaporites) 56.6 15.4 Cooke et al. (2006) Cast Stone Cement & BFS Brine 43 GW Evaporites 52.4 11.9 Duncan et al. (2009) Cast Stone Cement & BFS & Tc Getter Brine 43 GW Evaporites 50.1 11.4 Duncan et al. (2009)
Cast Stone Cement & BFS & Tc Getter (IEX Resin) Brine 43 GW Evaporites 52.0 11.8 Duncan et al. (2009)
Cast Stone Cement & BFS & Tc Getter (Sn-Apatite) Brine 43 GW Evaporites 51.6 11.7 Duncan et al. (2009)
Cast Stone Cement (8.2%), fly ash (44.9%), BFS (46.9%)
LAW Simulant (see Table C.14); loading varied via waste
evaporation Not specified 10.2 to 24.2 Lockrem 2005
Cast Stone Cement (8.2%), fly ash (44.9%), BFS (46.9%)
Actual LAW Waste (see Table C.14); loading varied via waste
evaporation Not specified 10.2 to 24.2 Lockrem 2005
Saltstone Cement/fly ash/BFS Actual Tank 50 Waste 46.6 13.0 Langton et al. (2006) ORNL grout Cement/fly ash/BFS Neutralized U raffinate 40.0 not available Gilliam et al. (1990)
Saltstone Cement/fly ash/BFS MCU Simulant 37.5 12.2 Dixon and Phifer (2008) Saltstone Cement/fly ash/BFS Table C.11 37.5 10.8 Harbour and Aloy 2007
Saltstone Cement/fly ash/BFS Deactivated Salt Solution (DSS) Simulant 37.5 9.7 Bronikowski et al 2006
Saltstone Cement/fly ash/BFS Dilute Waste 37.5 2.0 Cozzi 2004 Saltstone Cement/fly ash/BFS Tank Waste 46.0 13.3 Steimke and Fowley 1998 Saltstone Cement/fly ash/BFS Tank Waste 46.0 13.3 Langton 1998 Saltstone Cement/fly ash/BFS DDA simulant 43.6 9.8 Dixon et al. 2008 Saltstone Cement/fly ash/BFS MCU simulant 46.9 15.0 Dixon et al. 2009 Saltstone Cement/fly ash/BFS SWPF simulant 45.8 13.2 Dixon et al. 2010
Bold values are the best metric for comparing waste form loading metrics (dry salt successfully encapsulated in final waste form).
2.20
2.8 Actual Wastes
A few studies of LAW streams at Hanford used actual waste in Cast Stone waste form testing activities. Cooke and Lockrem (2005) used actual salt brine waste from Basin 42 in Cast Stone studies. The Basin 42 actual brine contained ~25 wt% dissolved solids, which is similar to the simulant composition shown in Table 2.9, and the Cast Stone mix ratios are shown in Table 2.12. Cooke et al. (2003) and Clark et al. (2005) used actual LAW waste made by compositing salt cake archived samples from SSTs S-101, S-109, S-110, S-111, U-106, and U-111. The composite weighed 3.8 kg and was redissolved with 4.7 L of DIW to form a slurry waste of 6.7 L. After mixing for several hours, the slurry was allowed to settle, and 5.7 L of clear yellow supernate (LAW) was decanted and used to make Cast Stone waste forms. There were no significant differences in the physical and leach properties for LAW simulants and this actual LAW supernate after solidification in the same dry-blend Cast Stone formulations and curing.
At SRNL, there have been several Saltstone projects that have solidified actual waste since the mid-1980s. For example, large 300-kg monoliths of Saltstone were created with actual waste at SRNL and placed in shallow lysimeters buried in the ground (see Wilhite 1986; Clark and Wilhite 1990). There was no mention that Cast Stone prepared with actual liquid wastes had any different properties than Cast Stone made with similar Basin 42 waste simulants.
Another example of the use of actual waste in Saltstone solidification is found in Langton et al. (2006). They discuss confirmatory studies on the efficacy of the reference Saltstone dry blend mix (10/45/45 cement:fly ash:BFS) using actual waste from SRNL Tank 50 and found no significant differences in slurry flowability and Saltstone set properties between the actual waste and all the Saltstone waste forms made with a similar liquid waste simulant. Cozzi (2005) prepared Saltstone slurries from salt solutions with a 1:1 ratio of Tank 50H simulant and actual H-Canyon blended waste. This Saltstone waste form had acceptable slurry and set properties. The average compressive strength after 28-day curing was 814 psi; >200 psi is acceptable. Analysis for mercury in TCLP leachate was <0.11 mg/L; any value below 0.2 mg/L is acceptable. The Saltstone itself contained 36.4 ppm mercury. Again, this work (and others not summarized) at SRNL in which Saltstone was made with actual tank wastes did not exhibit any different performance properties than Saltstone made with simulants with similar chemical compositions.
We thus conclude that there should be no differences in the properties of Cast Stone made with actual Hanford secondary wastes from Cast Stone made with waste simulants with similar chemical compositions. The only differences might be worker safety protocols to achieve “as low as reasonably achievable” (ALARA) radiation doses during the handling of the actual liquid wastes, mixing of the wastes with the dry blend, pouring the slurries into the waste packages, and final handling steps before transport to the IDF facility.
2.9 Waste Form Container/Package
The waste form container/package provides both protection and containment for the waste form during production, transportation, and storage before final disposal in a subsurface repository. A waste form container or package has not been selected for the (Cast Stone, DuraLith, Ceramicrete, FBSR) waste form for WTP secondary wastes. The waste form container will need to meet requirements for
2.21
transporting radioactive and hazardous materials as specified in 49 CFR 173. The materials of construction for the package must be compatible with the wastes and with the protective liners included in the IDF design. Generally, the package will be fabricated using one or a combination of the following materials, which are acceptable to the IDF:
• Metal, concrete, masonry
• Fire-retardant-treated or painted wood
• Rigid plastic with a maximum flame-spread rating or coating of 25
• Flexible plastic packaging materials with similar flame-spread characteristics.
The size of the container will be dictated by criticality safety considerations. A criticality safety evaluation for the IDF qualified the following container sizes:
• 55-gallon (208 L, 0.21 m3) drums, 57.15 cm diameter × 88.14 cm high (22.5 inches in diameter × 34.7 inches high)
• 85-gallon (322 L, 0.32 m3) drums, 66 cm diameter × 100.3 cm high (26 inches in diameter × 39.5 inches high)
• MB-V boxes, 1.2 m wide × 1.2 m high × 2.4 m long (4 ft. wide × 4 ft. high × 8 ft. long)
• Medium boxes with a volume between 3.95 m3 (5.17 yd3) and 15 m3 (19.62 yd3). The dimensions are not fixed.
• Small boxes with a volume less than 3.95 m3 (5.17 yd3). The dimensions are not fixed.
Other container configurations may be acceptable, but would require a criticality safety evaluation. The size of the container will also be constrained by waste form processing and curing considerations. Any elevated temperatures of the waste form slurry as it is poured into the container will need to be dissipated as will any heat generated by the curing processes for the waste form. The container will need to be sized and filled such that the heat dissipates without impacting the quality of the waste form.
The container will also be configured for ease of filling to maximize the volume of waste form to meet minimum fill requirements and to minimize void spaces so that landfill subsidence issues are minimized. The flow and curing characteristics of the waste form are important considerations in maximizing the fill volume.
The packages will be configured with the appurtenances necessary for safe handling, lifting, and transporting. Appropriate markings and labels will be permanently attached to each package.

3.1
3.0 Waste Form Process Description
3.1 Starting Materials
In general, there has not been much effort at Hanford in testing different sources of the three main ingredients used in the Cast Stone but there has been some such study at Savannah River. There are detailed specifications, ASTM C 150 and ASTM C 618, for two of the main ingredients (Portland cement and fly ash, respectively). However, despite controls on fly ash composition for different classes, Sundaram et al. (2011) found significant differences in the Class F fly ash obtained for use in the Phase II work compared to the fly ash used in the Phase I work even though both fly ashes came from the same vendor over no more than a year’s time. Vendors are under no obligation to supply fly ash from the same power plant and when power plants burn coal from different sources their resultant fly ash chemical, physical and mineralogical properties can vary. One key conclusion from Sundaram et al. (2011) was to specify that the CaO content of the fly ash must be kept below 5 wt% as a better criterion than simply requesting that the fly ash meets Class F specs, which are more keyed to total Al and Si oxide content.
There are also grades of ground BFS that give one some control over size of the slag particles (a key determinant of the rate of hydration) as well as chemical composition. There was one study performed by Oak Ridge National Laboratory (ORNL) staff that obtained BFS from four sources. The various slags were combined with cement and fly ash and an actual 99Tc-bearing waste to look for any differences in the leachability of 99Tc. The waste was an acidic “raffinate” from uranium recovery and equipment decontamination operations at the Portsmouth Gaseous Diffusion Plant that was neutralized with sodium hydroxide. The neutralized waste sludge that formed was filtered, and the supernate (dominated by 1.5 M sodium nitrate) was then solidified in a blend of cement, fly ash, and each of the BFSs in separate waste forms. The grout had the following composition: 40-wt% Portsmouth filtrate, 20-wt% BFS, 20-wt% ASTM Class F fly ash, and 20-wt% Type I-II-LA Portland cement. The resultant ANS-16.1 leach tests yielded LIs for 99Tc of 10.5 and for nitrate a value of 7.3. The source of the BFS did not measurably change the retention performance (quantified by the LI) that was (10.5 ± 0.5) for technetium and (7.3 ± 0.1) for nitrate. The lower leachability for the 99Tc was attributed to the capability of the BFS to reduce 99Tc to a more immobile species than the nitrate. Their key conclusion was that in the future, the source of BFS should be driven by economics rather than performance (see Gilliam et al. 1990 for additional details). However, Sundaram et al. (2011) found some unexpectedly high quantity of calcium sulfate mineral phases in the BFS used in Phase II testing that may have deleteriously impacted rheological properties, so they recommended obtaining the slag directly from the steel manufacture if possible as opposed to vendors who may add other material, such as the calcium sulfate, for concrete building purposes.
It should be noted that fly ash and BFS are byproducts (“wastes”) from two commercial processes so that there is some chance for variability and quality control issues despite there being categories or grades established by standardization institutions such as ASTM. As mentioned in Section 2.2, detailed characterization of each dry blend ingredient used in the Phase II Cast Stone secondary waste solidification project did identify minerals or concentrations of minerals that were not expected in both the fly ash and BFS. However, there is no indication that these unexpected minerals or slightly “off expected” concentrations significantly affected the solidification process and performance of the Cast Stone waste forms. In general, most grout formulators feel confident that the small variations in the mix ratio of dry blend reagents typically used and the water (portion of liquid waste excluding the dissolved
3.2
and suspended salts) to dry mix ratio can be tolerated (and in fact optimized) to obtain the required performance (both physical and chemical) out of the final waste form. One also has the option of adding small quantities of other dry blend materials or liquids “superplasticizers,” set enhancers, set retarders, etc. to tweak the properties of the wet slurry or final hardened solid to get the desired performance.
Blast furnace slag and especially fly ash can contain measurable concentrations of some RCRA metals. In Phase I work (see Pierce et al. 2010), some effort was expended to measure the concentrations of RCRA metals in the individual dry blend materials and to determine the leachability of said RCRA metals with the EPA 1315 monolith leach methodology. In general, the leach indices for the RCRA metals were very low; in many cases, no detectable concentrations were measured in the TCLP leachates or deionized water monolith leach tests (see Table 7.3 and Table 7.9, respectively for details). Fly ash and BFS can contain residual organic carbon but neither should contain enough organic matter to have any deleterious effects on the Cast Stone or other grout hydration reactions and final set properties. However, for precautionary reasons Savannah River does set a maximum allowable specification on residual carbon on the class F fly ash that it uses in the Saltstone dry blend.1
3.2 Process Steps
The typical steps to create the laboratory and intermediate-scale Cast Stone slurry (or any other grout-like blend) which is then poured into waste containers to hydrate and solidify follows. This example process is the step-by-step procedure found in Lockrem et al. (2003):
1. Place liquid waste and any additional DIW in a container.
2. Mix dry blend ingredients in a separate container.
3. Pour dry blend into the liquid waste/water.
4. Mix the slurry well until homogeneous.
5. Pour the slurry into molds to make specimens.
6. Cap the molds and let them stand for 24 hrs.
7. Measure bleed water; and either monitor as a function of curing or remove.
8. Cure the molds in a 100% relative humidity chamber.
A more detailed description of the entire full-scale Saltstone liquid waste processing system is described in Section 4. If Cast Stone is chosen as a viable waste form in the down-selection process the experience available at Savannah River on this full-scale grout production facility should be sought, even though the final stages wherein the Saltstone slurry is piped to the disposal vaults may not be relevant to the Cast Stone processing at the ETF.
In general, the mix ratio for the liquid wastes with dry blend ingredients is approximately 4 parts solution to 10 parts dry materials on a weight basis. For lab-scale waste form work, the size of the molds is often 2-inch diameter by 4-inch right cylinders that are “required” for compressive strength testing and are also preferred for typical monolith leach testing, such as ANS-16.1, ASTM-1308, and EPA Method 1315(still in draft form) (EPA 2009c). For some liquid waste streams, there is some gas
1 Personal communication from Dr. Christine Langton, SRNL, June 6, 2011.
3.3
evolution during the mixing of the dry blend and the liquid waste, such as is found for 1) simulant #4 in the Phase II PNNL secondary waste project (Sundaram et al. 2011), 2) the iodine-rich caustic waste simulant and actual Basin 42 waste Cast Stone waste forms created by CH2M HILL Hanford Group (see Cooke and Lockrem 2005; Lockrem et al. 2005), and 3) certain wastes solidified at SRNL (Zamecnik Cozzi 2009; Cozzi et al. 2006; Bronikowski et al. 2006). In general, the key gas evolved is ammonia, and the lab-scale production of Cast Stone or Saltstone for these types of liquid wastes is done in a fume hood to collect the ammonia off-gas for exhaust away from the workers. Zamecnik and Cozzi (2009) studied the release of ammonia from Saltstone, made with MCU-type Tank 50H salt simulant containing 0, 50, and 200 mg/L ammonia, during curing at 95°C. The ammonia concentration above Saltstone made from the 200 mg/L ammonia simulant was found to be about 2.7 mg/L at 95°C. Ammonia release from Saltstone appears to be lower than predicted by simple liquid-vapor equilibrium. Likely causes for the low release could be decreased volatility due to increased ionic strength in the Saltstone pore liquid and/or decreased diffusivity or permeation due to the development of the pore structure as the Saltstone gels. The amount of ammonia found in the headspace peaked at 4 days, suggesting that the chemical generation rate of ammonia may have peaked or that the release rate decreased because of decreased diffusivity from the development of the pore structure.
However, at both facilities (Hanford and SRNL), safety calculations have shown that the amount of ammonia released by larger scale pours is still not a safety concern (Cooke and Lockrem 2005; Cooke et al. 2006a).
Besides the Portland cement, fly ash, and BFS, in general, any additional additives to Cast Stone, Saltstone, or grout formulations are fractions of a percent to at most a few per cent of the total dry blend mix. The other additives are used to absorb bleed water, to improve slurry flowability, or to retard the set (hardening process) long enough to fill the waste containers, or, in the case of Saltstone, to be piped up to 2000 ft. to large concrete cells (100 ft. × 100 ft. × 25 ft.).
In most laboratory and intermediate-scale processes, the mixing times for pouring the homogeneous dry blend into the liquid waste are kept short; a few minutes to maybe 10 minutes as a maximum. The key is to make sure that the dry blend is completely dispersed and well mixed within the waste liquid (and any additional water if added). Then the entire slurry is mixed with some paddle or stirring equipment until the slurry reaches a homogeneous consistency. Generally at the lab and intermediate scale, there is no temperature control during the mixing of the homogeneous dry blend with the waste liquid, but temperatures above freezing should be used. In the other extreme, some actual waste streams exist at elevated temperatures, and the mixing process has been performed on actual waste streams at temperatures approaching 40°C. For the Saltstone process, temperature control is used for the dry blend and liquid waste mixing process.
The key goal is to accomplish the mixing of the homogeneous dry blend with the liquid waste in a short enough time that the slurry does not start to gel/set/harden before it can be poured into the waste containers. The temperature at which this mixing process is accomplished can impact the time before the resultant slurry gets too hardened to readily pour into the waste containers. In general, the higher the temperature inside the process building and the inherent temperature of the liquid waste stream, the less time is available for the proper mixing and pouring into the waste containers. If necessary, small amounts of set retarder can be added to the dry blend or the liquid waste stream, or additional water could be added to the slurry to acquire more time before the hydration reactions cause too much hardening/setting to occur before the slurry is poured into the waste containers. There is a wealth of practical knowledge

3.4
available from the construction industry to make certain that adequate time is available to mix the dry blend and liquid waste and pour the homogenous slurry into the waste container. However, the solutes in the liquid waste stream can in general speed up the hydration reactions so that additional empirical studies are needed to assess waste solute impacts on the Cast Stone “processability.” Langton et al. (2002) provides a systematic study at the laboratory scale to evaluate Saltstone process variability. It has been found that the Saltstone created in the large-scale Z-Area system is quite sensitive to the gelation time.1 Langton et al. (2002) performed a set of 24 tests where the variables 1) amount and type of set retarder, 2) volume of actual waste solution, 3) age of dry blend mix (batch of Portland cement, fly ash and BFS were from two dates to assess subtle impacts on using material, which met stringent specifications, but was received at two different times), and 4) length of time that the set retarder was allowed to equilibrate with the waste solution were varied. The gel time, set time and bleed water were the measurements taken to assess the impacts of variations in the four variables noted. Improved Saltstone processability was found with the use of Daratard 17® (W. R. Grace, Inc.; corporate headquarters Columbia, MD) set retarder at a dose rate of 1.75 lb/1000 lb of dry blend (called premix at SRS) with the standard mix ratio of 55.2 wt% premix to 44.8 wt% waste solution. The set retarder is added to the waste solution no sooner than 4 days before producing the Saltstone slurry. These recommendations lead to a Saltstone product that had a gel time of one hour and a set time between 1 and 2 days and resulted in no bleed water. The key point to this discussion is that processability must be thoroughly evaluated prior to locking in the full-scale flow sheet and equipment specifications for production of Cast Stone or Saltstone.
Once in the waste container, the Cast Stone slurry is allowed to set or harden, preferably in a 100% relative humidity environment (as simple as placing a moisture proof lid on the container). The hydration reactions consume water in the process of forming the “cement” phases that bind everything into the solid gel. Thus, the curing conditions must not allow water evaporation to such an extent that the hydration reactions cannot go to completion. The hydration reactions generate heat from the exothermal reactions that form the cementing minerals. Depending on the size of the waste container pour, the temperature rise may need to be controlled so that more water is not driven out of the Cast Stone waste form before final hardening can be accomplished. Dehydration and mass loss during the hydration process can lead to cracking as does thermal differentials, which lead to stresses on the waste form and waste package. More discussion on heat evolution in Cast Stone and Saltstone waste forms is found in Section 5.1.
1 The time for the grout slurry to transform from a pourable, pumpable, self-leveling fluid to a soft, non flowable, (diggable) solid under static conditions is referred to as the gel time. (Gelation occurs prior to setting. Set time refers to the time at which the material begins to perform as a rigid solid.)
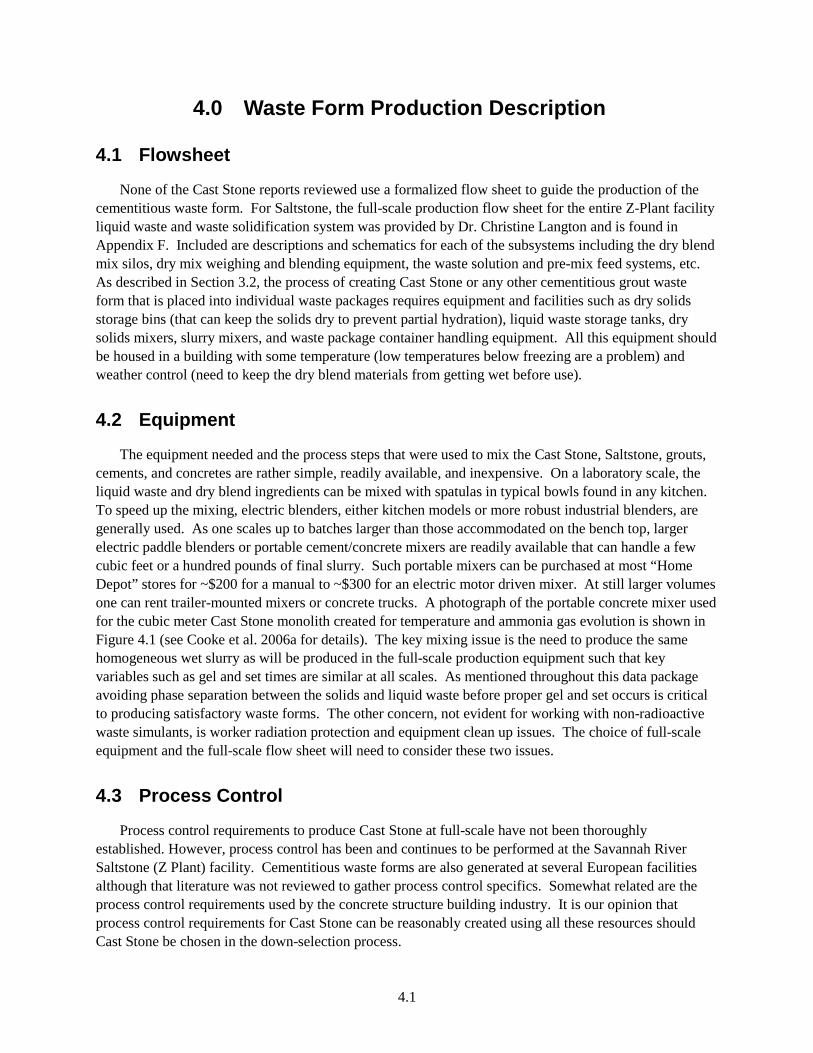
4.1
4.0 Waste Form Production Description
4.1 Flowsheet
None of the Cast Stone reports reviewed use a formalized flow sheet to guide the production of the cementitious waste form. For Saltstone, the full-scale production flow sheet for the entire Z-Plant facility liquid waste and waste solidification system was provided by Dr. Christine Langton and is found in Appendix F. Included are descriptions and schematics for each of the subsystems including the dry blend mix silos, dry mix weighing and blending equipment, the waste solution and pre-mix feed systems, etc. As described in Section 3.2, the process of creating Cast Stone or any other cementitious grout waste form that is placed into individual waste packages requires equipment and facilities such as dry solids storage bins (that can keep the solids dry to prevent partial hydration), liquid waste storage tanks, dry solids mixers, slurry mixers, and waste package container handling equipment. All this equipment should be housed in a building with some temperature (low temperatures below freezing are a problem) and weather control (need to keep the dry blend materials from getting wet before use).
4.2 Equipment
The equipment needed and the process steps that were used to mix the Cast Stone, Saltstone, grouts, cements, and concretes are rather simple, readily available, and inexpensive. On a laboratory scale, the liquid waste and dry blend ingredients can be mixed with spatulas in typical bowls found in any kitchen. To speed up the mixing, electric blenders, either kitchen models or more robust industrial blenders, are generally used. As one scales up to batches larger than those accommodated on the bench top, larger electric paddle blenders or portable cement/concrete mixers are readily available that can handle a few cubic feet or a hundred pounds of final slurry. Such portable mixers can be purchased at most “Home Depot” stores for ~$200 for a manual to ~$300 for an electric motor driven mixer. At still larger volumes one can rent trailer-mounted mixers or concrete trucks. A photograph of the portable concrete mixer used for the cubic meter Cast Stone monolith created for temperature and ammonia gas evolution is shown in Figure 4.1 (see Cooke et al. 2006a for details). The key mixing issue is the need to produce the same homogeneous wet slurry as will be produced in the full-scale production equipment such that key variables such as gel and set times are similar at all scales. As mentioned throughout this data package avoiding phase separation between the solids and liquid waste before proper gel and set occurs is critical to producing satisfactory waste forms. The other concern, not evident for working with non-radioactive waste simulants, is worker radiation protection and equipment clean up issues. The choice of full-scale equipment and the full-scale flow sheet will need to consider these two issues.
4.3 Process Control
Process control requirements to produce Cast Stone at full-scale have not been thoroughly established. However, process control has been and continues to be performed at the Savannah River Saltstone (Z Plant) facility. Cementitious waste forms are also generated at several European facilities although that literature was not reviewed to gather process control specifics. Somewhat related are the process control requirements used by the concrete structure building industry. It is our opinion that process control requirements for Cast Stone can be reasonably created using all these resources should Cast Stone be chosen in the down-selection process.
4.2
Figure 4.1. Portable Cement Mixer Used to Create the Cubic Meter Cast Stone Waste Form. See
Figure 4.4 for photograph of Cast Stone Block (covered by ammonia gas-collection system).
The key processing steps that need control include keeping the dry blend ingredients dry before use,
then adequately weighing them, and properly mixing them prior to being poured into the liquid waste. The liquid waste stream needs to be accurately stirred (if it contains suspended solids) and weighed into a slurry mixing container. It is conceivable that the final waste package container can be used as the slurry mixing container as long as the waste package container allows the slurry to be mixed properly. A thorough review of the pros and cons and equipment needed for in-drum versus large batch production of the wet slurry waste forms was published in Langton (2008). Advantages of the various types of in-drum mixing identified in this report (lost-paddle, lost-paddle with pre-loaded cement reagents, tumble mixing, roller mixing) included:
• Limited amount of waste handling.
• Drums are easily shielded.
• In-drum processing is compatible with remote operations.
• Little or no equipment clean up and associated secondary waste generation (no wash water generation or management).
Disadvantages that in-drum processing exhibit with respect to batch mixing include:
• A lower level of confidence in achieving a uniform product in each drum. (In-drum processing is sensitive to variation within a batch of waste containing insoluble material (salt, ion exchange resin, sludges with concentrated radio isotopes, and supersaturated salt solutions.)
• Less flexibility and efficiency for highly variable and troublesome waste streams.
• Higher probability of lower container fill-ratios (vortex issues in the drum can limit the volume percent filled). Although if in-drum mixing results in too much void space at the top of the drum to meet the disposal requirements, fill grout can be added in a separate operation.
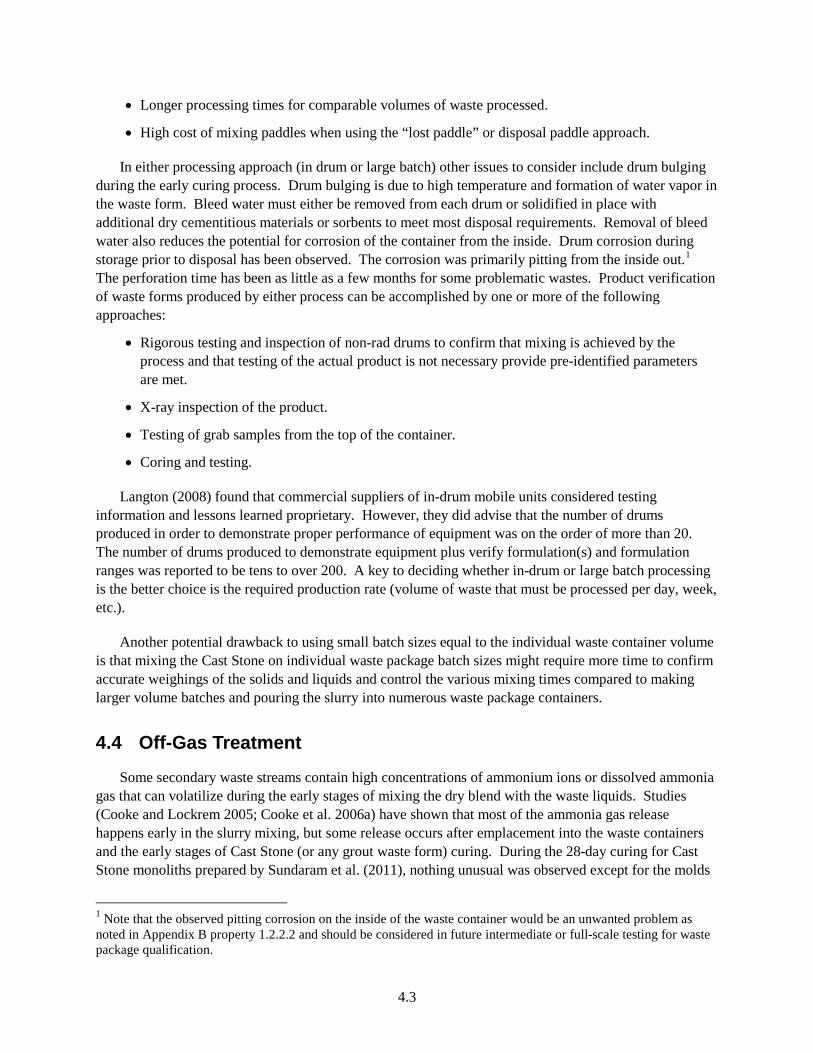
4.3
• Longer processing times for comparable volumes of waste processed.
• High cost of mixing paddles when using the “lost paddle” or disposal paddle approach.
In either processing approach (in drum or large batch) other issues to consider include drum bulging during the early curing process. Drum bulging is due to high temperature and formation of water vapor in the waste form. Bleed water must either be removed from each drum or solidified in place with additional dry cementitious materials or sorbents to meet most disposal requirements. Removal of bleed water also reduces the potential for corrosion of the container from the inside. Drum corrosion during storage prior to disposal has been observed. The corrosion was primarily pitting from the inside out.1 The perforation time has been as little as a few months for some problematic wastes. Product verification of waste forms produced by either process can be accomplished by one or more of the following approaches:
• Rigorous testing and inspection of non-rad drums to confirm that mixing is achieved by the process and that testing of the actual product is not necessary provide pre-identified parameters are met.
• X-ray inspection of the product.
• Testing of grab samples from the top of the container.
• Coring and testing.
Langton (2008) found that commercial suppliers of in-drum mobile units considered testing information and lessons learned proprietary. However, they did advise that the number of drums produced in order to demonstrate proper performance of equipment was on the order of more than 20. The number of drums produced to demonstrate equipment plus verify formulation(s) and formulation ranges was reported to be tens to over 200. A key to deciding whether in-drum or large batch processing is the better choice is the required production rate (volume of waste that must be processed per day, week, etc.).
Another potential drawback to using small batch sizes equal to the individual waste container volume is that mixing the Cast Stone on individual waste package batch sizes might require more time to confirm accurate weighings of the solids and liquids and control the various mixing times compared to making larger volume batches and pouring the slurry into numerous waste package containers.
4.4 Off-Gas Treatment
Some secondary waste streams contain high concentrations of ammonium ions or dissolved ammonia gas that can volatilize during the early stages of mixing the dry blend with the waste liquids. Studies (Cooke and Lockrem 2005; Cooke et al. 2006a) have shown that most of the ammonia gas release happens early in the slurry mixing, but some release occurs after emplacement into the waste containers and the early stages of Cast Stone (or any grout waste form) curing. During the 28-day curing for Cast Stone monoliths prepared by Sundaram et al. (2011), nothing unusual was observed except for the molds
1 Note that the observed pitting corrosion on the inside of the waste container would be an unwanted problem as noted in Appendix B property 1.2.2.2 and should be considered in future intermediate or full-scale testing for waste package qualification.

4.4
containing monoliths made from the S4 simulant, which contains high concentrations of ammonium. Sometime during the first 24 to 48 hours, the molds for both the radioactive and non-radioactive monoliths made with S4 simulant cracked as shown in Figure 4.2. Whether the mold cracking was caused by ammonia gas trying to escape or grout expansion or both was not investigated.
Figure 4.2. Cracked Cast Stone Molds for Waste Forms Made with Simulant 4—High Ammonia Content
Calculations described in Zamecnik and Cozzi (2009) suggest that the ammonia release during the
slurry mixing at full-scale and especially after Saltstone set in the vaults is not a health concern. However, it would appear that adding a loose fitting exhaust manifold over the top surface of the slurry mixing container to capture most of the ammonia gas for dispersal to the outside atmosphere would be a prudent addition to the proposed Solidification Treatment Unit STU at the ETF facility.
4.5 Process Effluents, Secondary Wastes
The process of making Cast Stone waste forms will not produce any significant process effluents or secondary wastes. There will be some waste liquids and solids created when the slurry mixing equipment (if batch processing or in-drum with reusable paddles is used) are washed off between batches. It is possible that there will be some settled solids from the liquid waste storage tanks and inadvertent dripping of Cast Stone wet slurry during the slurry mixing and pouring into the final waste package containers. It is assumed that such incidental wastes will be of no larger a volume or more difficult to handle or dispose of than any other incidental wastes from a different solidification process or even the incidental wastes from ion exchange or evaporative treatment of liquid wastes already being performed at the ETF.
4.5
4.6 Existing Facilities
Laboratory- and bench-scale “facilities” for preparing and testing non-radioactive and radioactive simulated cementitious waste forms are available at PNNL, WRPS, and SRNL that can handle actual radioactive as well as simulant waste streams. Because of the “low tech” nature of the grout waste form process and the fact that there will be no need for specialized equipment, most laboratory facilities that can do routine wet chemistry activities are capable of making Cast Stone with simulants. Many universities and commercial analytical and industrial companies have comparable facilities for producing and studying waste forms, albeit more commonly using non-radioactive simulant waste streams.
All DOE national laboratories and DOE defense contractors have the necessary radiological licenses and facilities to work with actual LAW streams at the bench scale. Engineering and pilot test facilities exist at PNNL, SRNL, and WRPS to produce Cast Stone, Saltstone, or any other grout-based waste forms using actual low-activity radioactive or simulated liquid waste streams. Most recently, staff at facilities now managed by WRPS prepared a cubic-meter-sized Cast Stone waste form with a simulated salt brine (30% TDS dominated by ammonium, sulfate, and hydroxide) with a Cast Stone formulation shown as Formulation 21 in Table 2.13. The test block was outfitted with thermocouples to record the temperature during curing and the release of ammonia gas during curing. A photograph of the meter cubed box and ammonia gas collection system are shown in Figure 4.3 and Figure 4.4, respectively.
Figure 4.3. Cast Stone m3 Monolith from Cooke et al. (2006a)
At SRNL, several 100 ft. × 100 ft. × 25 ft. concrete cells have been filled with Saltstone made with
actual low activity liquid wastes retrieved from SSTs. The cells are arranged side by side into vaults with the first two vaults containing 6 and 12 cells, respectively. The saltstone vault design was changed from rectangular cells to a cylindrical water tank design in the mid-2000s. Two 2.7-million-gallon cylindrical tanks are ready to receive Saltstone. Currently, base mats are being poured for two more

4.6
2.7-million-gallon cylindrical tanks. Additional modifications of the water tank design are currently being considered for the next set of Saltstone disposal units (SDUs).1
Full-scale Saltstone production activity started in 1986 and continues today (Langton and Wong 1991). From 1990 to 1993 full-scale Saltstone production was fairly steady and then because of a lack of low-activity waste feed the production was discontinued for a period in the late 1990s to mid-2000s. Steady production of Saltstone restarted in 2007 and continues today. About 9 million gallons of low activity salt waste has been solidified to date using the Saltstone dry blend mix discussed in this data package; about half this quantity was solidified prior to 2007 and the other half since 2007. The current rate of Saltstone production consumes 33 to 35 metric tons of dry blend per hour and it is projected that 2 to 3 million gallons of low activity salt waste will be processed per year starting in 2011.2 More description of the Saltstone full-scale processing equipment and vaults is found in Appendix F.
Figure 4.4. Cast Stone m3 Monolith (wooden box used to support mold and with ammonia gas collection system emplaced right above the monolith) from Cooke et al. (2006a)
4.7 Cost Data
None of the Cast Stone, Saltstone, or generic grout nuclear waste form literature reviewed discussed the costs for producing waste forms. However, there is a wealth of cost information available from the construction and building industry for concrete and cement that should be applicable. A cursory internet
1 Personal communication (email) with Dr. Christine Langton (SRNL) on August 16, 2011. 2 Personal communication (email) with Dr. Christine Langton (SRNL) on August 16, 2011.
4.7
search revealed many articles that show that the use of fly ash and ground BFS as a substitution for Portland cement in producing concrete can lead to great cost savings over using only cement. In addition, the substitution of BFS and fly ash can improve physical properties, such as total porosity of the hardened product, and can facilitate longer workability or flowability times for the wet slurry. However, as discussed in Sundaram et al. (2011), one needs to make judicious choices on the type of slag and fly ash as well as their proportions to confirm that the final grout waste form is optimized.
Based on internet searches, an average price for Portland cement is $100 per ton, $15 per ton for fly ash, and ~$50 to $100 per ton for granulated BFS.1 The fact that fly ash is a waste product from producing electricity from coal burning makes the price of fly ash inexpensive. One fact found on the Internet states
“As of 2006, about 125 million tons of coal-combustion byproducts, including fly ash, were being produced in the U.S. each year, with about 43 percent of that amount used in commercial applications, according to the American Coal Ash Association Web site. As of early 2008, the Environmental Protection Agency hoped that the reuse percentage would increase to 50 percent by 2011.”2
It would thus seem like the cost of fly ash will remain low in the future, even though the demand for Portland cement is causing price increases as well as pressure to cut down on the carbon dioxide releases during its production by burning limestone and other alumina- and silica-bearing rocks to produce the cement. One recent article found on the EPA web site suggests that all the ground BFS produced in the United States is being reused in commercial activities, and thus its cost is more expensive than fly ash.3
1 At Savannah River the current cost of slag is $95 per ton; about the same as cement. Personal communication with Dr. Christine Langton June 6, 2011. 2 Robert McCabe (March 30, 2008). “Above ground, a golf course. Just beneath it, potential health risks.” The Virginian-Pilot. http://hamptonroads.com/2008/03/above-ground-golf-course-just-beneath-it-potential-health-risks. 3 www.epa.gov/osw/nonhaz/define/pdfs/blast-furn-slag.pdf for details.

5.1
5.0 Physical Properties
Langton et al. (2001) reviewed various topics for DOE tank closure that include useful material on cement/grout physical properties and contaminant leach properties, which are also applicable for cementitious waste form production. The down-selection team should use this valuable reference as another resource for the following topics:
• Mixability/Pumpability
• Flowable/Self-Leveling
• Bleed Water
• Set Time
• Density of the slurry
• Cohesiveness/Segregation—Segregation and generation of bleed water are the consequence of gravity settling of the solids from the aqueous suspension.
• Heat of Hydration
• Compressive Strength
• Hydraulic Conductivity (Permeability)
• Radionuclide Stabilization—Leaching Properties
• Durability—Long-Term Properties.
The key factors that control the performance of the Cast Stone and Saltstone waste forms have been identified by Harbour and Edwards (2009) as follows: 1) the time/temperature profile for curing, 2) water-to-cementitious materials ratio, 3) aluminate concentration in the waste stream, and 4) wt% slag in the dry blend premix.
Several of the reports authored by Harbour and cited in this data package discuss simple empirical methods that have been developed at SRNL to predict general trends in the permeability and microstructure of cured Saltstone samples as a function of curing temperature. The empirical equations reveal that curing at higher temperatures (e.g., 60°C) results in a higher permeability as well as a different microstructure than the microstructure observed for the same mixes cured at 22°C. Measurements of the heat of hydration at 50°C reveal that in mixes with aluminate concentrations >0.2 M, the degree of hydration is also reduced by curing at higher temperatures. There is more detailed discussion on waste aluminate concentrations and curing temperature impacts on waste form cracking in the following sub-sections.
5.1 Heat of Hydration, Heat Capacity, and Thermal Conductivity
The amount of heat generated when Cast Stone hydrates is most impacted by the size of the waste forms created, but the mix (type and amount of dry ingredients) that is used and the chemical composition of the liquid waste also impact the amount and timing of the evolved heat. Maximum allowable temperature limits for concrete used in construction have been specified as low as 57°C with a maximum

5.2
allowable temperature difference between the interior and exterior of 19°C.1 A second rule of thumb endorsed in the United Kingdom for concrete construction to avoid crack development is to limit the maximum temperature differential between the interior and exterior of the concrete to 20°C.2
Portland cement evolves heat for a long time. Figure 5.1 shows heat of hydration data out to 13 years.3 The figure clearly shows that the rate of heat generation is greatest at early ages. Usually, the greatest rate of heat liberation occurs within the first 24 hours, and a large amount of heat evolves within the first 3 days. For most concrete structures, such as pavements, basement floors, and walls, long-term heat generation is not a concern because this heat is dissipated into the environment. The various types of Portland cement have different heats of hydration per gram. The Type I and II Portland cement that is generally used in Cast Stone and Saltstone has a 7-d heat of hydration of 82 to 84 cal/g (343 to 352 J/g) and a 28-d heat of hydration of 95 to 96 cal/g (398 to 402 J/g).3 If heat generation is a problem, Type IV Portland cement with a 7-d heat of hydration of 55.7 cal/g (233 J/g) can be substituted. The fly ash used in the Saltstone and Cast Stone dry blend generally has a lower heat of hydration than Portland cement, and the BFS’s heat of hydration is also slightly lower than Portland cement Type I/II.
Several researchers at SRNL had measured the heat of hydration for the Saltstone dry blend when mixed with various waste simulants. The first heat of hydration work that was identified was performed by Steimke and Fowley (1998), and the value was 105 J/g of Saltstone premix. Harbour et al. (2007c) measured the heat of hydration for a Saltstone waste simulant that is very similar to the Cast Stone mix and secondary waste simulants used at Hanford. After 7 days, the heat of hydration for the Saltstone was 110 J/g, which eventually leveled off at ~ 135 J/g after further curing. If the waste simulant contains greater than 0.1 M dissolved aluminum, the 7-day heat of hydration for Saltstone can increase from 110 J/g to between 130 and 180 J/g, dependent on the aluminum and free hydroxide concentrations (Harbour et al. 2007b).
The heat capacity (also called specific heat) of a material is the capability of a material to store heat. The heat capacity is generally measured in units of joules per Kelvin (J/K). Concrete, soil, and sand have very similar heat capacities of about 0.88, 0.80, and 0.835 J/gK, respectively. Steimke and Fowley (1998) and Harbour and Williams (2008a) measured the heat capacity for Saltstone made with the baseline mix (10% cement, 45% fly ash, and 45% BFS) with a waste simulant at a 0.60 water-to-dry blend ratio. Steimke and Fowley measured the heat capacity as 0.304 ± 0.01 cal/g·°C or 1.27 J/g·oC. Harbour and Williams’ measured heat capacity value was 1.95 J/g·oC. Heat capacities were measured immediately after initial mixing and then periodically up to times greater than 100 days. Within experimental error, the heat capacity did not change with time. We did not investigate the reason for the difference in the two heat capacity results.
Harbour and Williams (2008a) state that the heat capacity, coupled with the heat of hydration data, can be used to predict the maximum temperature increase. Knowing the maximum temperature is also important to the performance properties of the Saltstone. It is important to prevent or limit the cracking
1 Controlling Temperatures in Mass Concrete, J. Gajda and M. Vangeem, Concrete International, page 59, January, 2002. 2 FitzGibbon ME. “Large Pours for Reinforced Concrete Structures,” Current Practice Sheets No. 28, 35, and 36, Concrete, Cement and Concrete Association, Wexham Springs, Slough, England, March and December 1976 and February 1977. 3 Portland Cement Association newsletter Concrete Technology Today vol. 18, no. 2, July 1997; www.portcement.org.
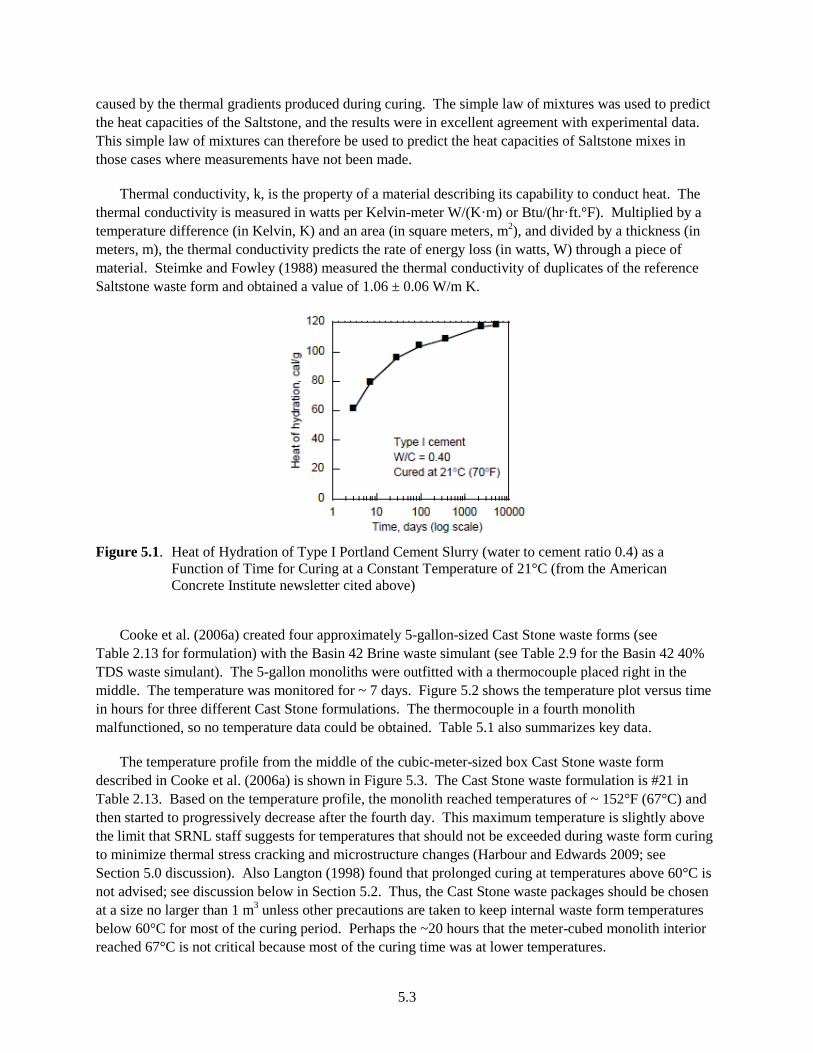
5.3
caused by the thermal gradients produced during curing. The simple law of mixtures was used to predict the heat capacities of the Saltstone, and the results were in excellent agreement with experimental data. This simple law of mixtures can therefore be used to predict the heat capacities of Saltstone mixes in those cases where measurements have not been made.
Thermal conductivity, k, is the property of a material describing its capability to conduct heat. The thermal conductivity is measured in watts per Kelvin-meter W/(K·m) or Btu/(hr·ft.°F). Multiplied by a temperature difference (in Kelvin, K) and an area (in square meters, m2), and divided by a thickness (in meters, m), the thermal conductivity predicts the rate of energy loss (in watts, W) through a piece of material. Steimke and Fowley (1988) measured the thermal conductivity of duplicates of the reference Saltstone waste form and obtained a value of 1.06 ± 0.06 W/m K.
Figure 5.1. Heat of Hydration of Type I Portland Cement Slurry (water to cement ratio 0.4) as a
Function of Time for Curing at a Constant Temperature of 21°C (from the American Concrete Institute newsletter cited above)
Cooke et al. (2006a) created four approximately 5-gallon-sized Cast Stone waste forms (see
Table 2.13 for formulation) with the Basin 42 Brine waste simulant (see Table 2.9 for the Basin 42 40% TDS waste simulant). The 5-gallon monoliths were outfitted with a thermocouple placed right in the middle. The temperature was monitored for ~ 7 days. Figure 5.2 shows the temperature plot versus time in hours for three different Cast Stone formulations. The thermocouple in a fourth monolith malfunctioned, so no temperature data could be obtained. Table 5.1 also summarizes key data.
The temperature profile from the middle of the cubic-meter-sized box Cast Stone waste form described in Cooke et al. (2006a) is shown in Figure 5.3. The Cast Stone waste formulation is #21 in Table 2.13. Based on the temperature profile, the monolith reached temperatures of ~ 152°F (67°C) and then started to progressively decrease after the fourth day. This maximum temperature is slightly above the limit that SRNL staff suggests for temperatures that should not be exceeded during waste form curing to minimize thermal stress cracking and microstructure changes (Harbour and Edwards 2009; see Section 5.0 discussion). Also Langton (1998) found that prolonged curing at temperatures above 60°C is not advised; see discussion below in Section 5.2. Thus, the Cast Stone waste packages should be chosen at a size no larger than 1 m3 unless other precautions are taken to keep internal waste form temperatures below 60°C for most of the curing period. Perhaps the ~20 hours that the meter-cubed monolith interior reached 67°C is not critical because most of the curing time was at lower temperatures.

5.4
Figure 5.2. Temperature Evolution from the Middle of 5-Gallon-Sized Cast Stone Waste Forms. Details
on the Cast Stone formulations can be found in Table 2.13 and for the Simulant Waste in Table 2.9.
Table 5.1. Summary of Temperature Evolution of 5-Gallon-Bucket Sized Cast Stone Waste Forms Containing Basin 42 40% TDS Waste Simulant
Bucket Formulation Maximum Curing
(°F) Time to Reach
Maximum Time Held at
Maximum Time to Reach
Room Temperature 6A 125.5 3 hr 10 min 4 days
19A Datalogger malfunction, no data to report. 18C 133.5 24 hr 20 hr 4 days 21 133.5 24 hr 7 hr 4 days
The heat of hydration also reflects the extent of the cement hydraulic reactions that transform the fluid mixture into a “stone like” solid and consequently impacts performance properties, such as permeability.
During the Hanford Grout Project, it was shown that aluminate in the liquid waste salt solutions increases the amount of heat generated during the fabrication and curing of cementitious waste forms. At Savannah River, some tank waste process changes being considered would significantly increase the amount of dissolved Al in the waste; therefore, numerous studies (Harbour et al. 2008; Harbour et al. 2007b, c; Harbour and Edwards 2009; Harbour et al. 2009a, b, c) have been performed to quantify the effects of Al concentrations (and in some studies other variables such as percentage of BFS and Portland cement used at the expense of removing fly ash) used in the dry blend mix on Saltstone waste form production and subsequent performance.

5.5
Figure 5.3. Temperature Evolution in the Middle of Cubic-Meter-Sized Cast Stone Monolith
A summary of the findings follows. In general, the studies before 2009 found that aluminate
concentrations above 0.2 M in liquid waste solutions significantly increased the set times from 1 day for low aluminum wastes to 4 days for various waste simulant-Saltstone mixes (note that the Hanford secondary waste compositions shown in Table 2.7 are right at this 0.2 M Al “break point” concentration, except the S4 simulant, which is considerably below 0.2 M). Heat of hydration measurements were consistent with the increased set times in that the induction periods1 were extended to several days as the aluminate concentration increased in the salt solution from 0.05 through 0.11 and up to 0.45 M. The overall heat generation was greater in the mixes containing higher concentrations of aluminate. It also appears that the increase in total heat evolution for a mix is dependent on the free hydroxide ion concentration. In particular, alkali activation of slag does increase with increasing hydroxide ion concentration. Aluminum dissolution may also increase the free hydroxide ion concentration because of the use of sodium hydroxide to dissolve the aluminum. It was shown that fly ash does not react significantly during the first 7 days of curing, but then undergoes an accelerated burst for 15 days before beginning to level off. The most recent study (2009 to 2010) found that aluminate ions in the solution act first to retard the set time of the mix, but then enhance the hydration reactions following the induction period. In fact, the aluminate ions increase the degree of hydration by ~35% over the degree of hydration for the same dry mix wetted with liquid waste with a lower aluminate concentration.
The induction period at higher aluminate concentrations is evidently associated with hydration reactions of the BFS since ordinary Portland cement (OPC) alone speeds up only the rate of heat generation, but not the induction period. On the other hand, the BFS mixes exhibited an increased 1 The induction period is quantified as the peak time for heat flow (the amount of time, starting with mixing, until the heat generation rate from the hydration reactions is a maximum).
5.6
induction period at higher aluminate concentrations similar to that observed with mixes prepared using the standard Saltstone 3-component premix (cement, fly ash, and BFS). An increase in the wt% slag from the baseline value (45%) to 60 wt% increased Young’s modulus and reduced total porosity. This is consistent with previous findings and leads to the conclusion that water to dry blend cement and slag content are important factors that drive the performance properties. That is, the performance properties of the Saltstone (by similarity Cast Stone) are improved by increasing the wt% of BFS. Increasing the slag % produces waste forms that have lower permeabilities and porosities. For Portland cement contents between 15 and 30 wt% in the dry blend mix, a decrease in the water/dry blend mix ratio increased Young’s modulus and decreased total porosity.
As the aluminate concentration increased from 0.05 to 0.11 M through the 0.45 M gel time, bleed volume and yield stress for the Saltstone slurry decreased. The plastic viscosity was essentially unchanged as a function of aluminate ion concentration. It turns out that the increase in heat production for the mixes containing higher levels of aluminate is approximately 30% greater than for the baseline SRNL mix at two weeks. The peak time for heat flow correlates with the set times measured for these grouts. That is, the set time increased as the peak time for heat flow increased. This is explained by the fact that a threshold for the degree of hydration (the fraction of cementitious material that reacts or hydrates) must be exceeded before a proper set of the grout. The increased heat generated and the increased time for set needs to be carefully considered at SRNL for determining the amount of Saltstone to pour in each lift placed in the large cells in the vaults. Aside from the increased heat generated by having high concentrations of aluminate in the Hanford secondary waste streams, the other variables, such as final set time, Young’s modulus etc., may be of less importance once the slurry is placed in the waste containers. However, heterogeneous settling of the suspended particles and neo-forming hydration phases could lead to non-uniform hardened solids that could have deleterious ramifications to long-term performance. Thus, some study of phase segregation before the final set in the waste package would be prudent.
Linear models were developed by Harbour et al. in their various technical reports that relate the amount of heat release, the peak time for heat release, the heat of hydration, and the total porosity for the various caustic salt brine simulants at Savannah River to certain variables. Examples are shown below from specific reports. The main point that should be taken from these examples is that similar empirical equations could be generated from optimization studies for Cast Stone should this be the waste form that is selected for Phase III studies. The amount of heat released was a function of the aluminate and Portland cement concentrations as well as the temperature of mixing. The peak time for heat release was a function of aluminate, Portland cement, and total nitrate plus nitrite concentrations in the liquid waste simulant. The total porosity is a function of the water-to-dry blend mix and total nitrate plus nitrite concentrations. The heat of hydration is a function of the water to dry blend mix, the wt% BFS used in the dry blend, and the liquid waste aluminate concentration.
Total heat release (J/g dry blend mix) = 142.5 – 0.34T - 1.8 [OPC] + 174.0 [Al(OH)4-]
Peak time (minutes) = - 210.3 – 8.5 [wt% OPC] + 7894.1 [Al(OH)4-] + 272.5
[NO3- + NO2
-] Total porosity (Φ) = 0.25 + 0.39 • w/cm + 0.035 • [NO3
- + NO2-]
Heat of hydration (J/g of cm) = - 72.86 + 185.69 • w/cm + 3.07 • wt% BFS+ 159.99 • [Al(OH)4
-] T = temperature in Centigrade
Al(OH)4- = aluminate in M

5.7
NO3- and NO2
- = nitrate and nitrite in M OPC = ordinary Portland cement wt% BFS = blast furnace slag wt%
w/cm = water to dry blend ratio (free or “pure” water in g (not brine g) and dry blend g).
5.2 Expansion and Cracking
The four 5-gallon Cast Stone monoliths discussed in Cooke et al. (2006a) were removed from the buckets after the waste forms had returned to room temperature, and all temperature measurements had been assimilated (~7 days after they were prepared). Table 5.2 gives some observations on expansion and cracking for the 5-gallon-sized Cast Stone monoliths. In general, there was little expansion or cracking observed in most of these large-sized monoliths with only one of the four monoliths exhibiting some expansion.
Table 5.2. Description of Condition of the 5-Gallon Sized Cast Stone Monoliths after 7 Days Curing
Bucket Formulation
Relative Ease of Removal Expansion Noted Visible Cracking Other Notes
6A Very easy No major expansion No Uniform coloration, 0.25-in. crumbly crust of gypsum on top
19A Little effort needed No major expansion No Uniform coloration, 0.25-in. crumbly crust of gypsum on top
18C Needed box cutter Visible expansion No Uniform coloration 21 Very easy None No Uniform coloration
Denham (2008) assessed the potential for future precipitation of expansive phases that could cause fracturing in Saltstone using The Geochemist’s Workbench® reaction path code. The scenarios simulated examined the effects of different possible infiltrating fluids, different Saltstone formulations, and different amounts of minerals available for reaction. The results suggest that fracturing that would be caused by expansive phase precipitation is unlikely to occur in Saltstone because the maximum amount of Saltstone porosity that might be filled by expansive minerals is 34%. Given that fact that most Saltstone formulations exhibit 50 to 60% total porosity (see Table 5.3), infilling of a maximum of 34% can be accommodated. Further, it is not likely that 100% of the Saltstone minerals would become available for reaction that causes expansion and thus, even less porosity will be lost to expansive phases.
Langton (1998) studied the impacts of curing Saltstone waste forms at various temperatures (45, 70, and 90°C ±5°C and 100% relative humidity. Langton concluded that long-term curing at 90°C appears to be unacceptable because of cracking that will affect the structural integrity as evaluated in water immersion tests (ANS-16.1). No cracking of four reference Saltstone waste forms was observed for samples cured at 70°C. Thus, Langton concluded that the temperature threshold for cracking is between 70°C and 90°C. Most of the cracking observed in samples cured at 90°C is attributed to drying shrinkage due to water evaporation. However, at least one other mechanism may be operative because Saltstone waste forms cured at 90°C in sealed containers that could not allow water to escape also cracked (to a

5.8
lesser degree). XRD analyses of specimens cured over the entire temperature range indicated the presence of poorly crystalline hydrotalcite, a hydrated magnesium silicate phase characteristic of hydrated slag systems. Gypsum, a hydrated calcium sulfate phase, was also detected in all of the Saltstone samples. The current analysis did not indicate any phase differences over the temperature range studied.
Table 5.3. Saltstone Physical Properties (should be similar to Hanford secondary waste forms)
Saltstone
Saturated Hydraulic Conductivity(a,b)
(cm/s) Particle Density
(g/cm3) Dry Bulk Density(c)
(g/cm3) Porosity(d) DDA 9.6 × 10⁻¹¹ 2.37 1.06 0.55
ARP/MCU 8.5 × 10⁻¹⁰ 2.38 0.97 0.59 SWPF(e) 6.0 × 10-09
(1.5 × 10-09) 2.42 1.01 0.58
(a) Saturated hydraulic conductivity measured using simulated Saltstone pore water as permeant. (b) Saturated hydraulic conductivity values are the logarithmically averaged values for several replicates of 90-d
cured Saltstones. (c) The particle density was a calculation from the measured dry bulk density and porosity measured on 90-d cured
Saltstone monoliths. (d) Dry bulk density and porosity measured on 90-d cured Saltstone monoliths. (e) The SWPF saturated hydraulic conductivity value provided in parenthesis is the recommended value, excluding
a potential outlying value.
Orebaugh (1992) performed two types of curing studies on the reference Saltstone. In the first suite of curing tests, Saltstones were cured under isothermal conditions in sealed glass ampoules at temperatures of 25°C, 55°C, 75°C, and 95°C. After periods of 1, 2, 3, 6, and 12 months, samples cured at each temperature were removed, cooled, removed from the molds, and visually inspected. Those that were not severely cracked were leach tested using the ANS-16.1 methodology. In the second series, Saltstone samples were cured at varying temperatures that followed a cooling curve that is twice as steep as model predictions for Saltstone lifts placed in the large disposal cells. The second suite of Saltstone samples cured using the variable cooling curve versus time was treated in a similar fashion. Orebaugh found an unexpected generation of nitrous oxide within Saltstone cured at elevated temperatures, and that created internal stresses that caused fracturing when the waste forms were exposed to leaching conditions.
Saltstone samples cured at 95°C spontaneously fractured into ever smaller shards over the first day of contact with DIW for leaching. Saltstones cured at 75°C for 1 month were unfractured when removed from the glass moisture-proof molds, but developed radial cracks during the first day of leaching. Additional cracking did not develop, and these Saltstone samples survived the entire leach test duration of 90 days. This observation of unexpected generation of nitrous oxide within Saltstone (promoted by the combination of higher temperature curing and long enclosed cure times at such temperatures) created internal stresses that caused the constrained waste form to fracture when exposed to leaching conditions. Orebaugh opined “that such fracturing is not considered significant for Saltstone emplaced in vaults. The internal generation of nitrous oxide undoubtedly results from the reduction of sodium nitrite in the Defense Waste Processing Facility (DWPF) salt solution by species present in the BFS used in the formulation of DWPF Saltstone.”
We find that the conclusion that nitrates were reduced to nitrous oxide gas worthy of consideration because no other studies have found this phenomenon occurring, although it is true that few other studies
5.9
cured waste forms at such high temperatures for such long time periods in sealed glass containers. Lukens et al. (2005) also did not find any indication of nitrate being reduced by BFS in small Saltstone coupons cured at room temperature. This possibility of nitrous oxide formation at higher temperatures in Cast Stone merits some study if the Cast Stone is selected for further study and if the waste packages are large enough that the heat generated during curing is elevated above 50°C.
Shadday (1993 and 2008) developed and improved a thermal model to predict the evolution of temperature in Saltstone lifts and the entire disposal cell that is used to contain the large volumes disposed of. Because Saltstone has a low thermal conductivity, the central region of the poured Saltstone will essentially heat up adiabatically. Most of the energy is released over a short period of several hours, and the balance is released slowly over a period of time that can be in excess of a month. As just discussed, temperatures during prolonged curing must be kept below or equal to 60°C to 70°C to avoid thermal cracking. Should the Cast Stone be chosen for further study and if the waste packages are larger than 210-liter-sized drums, it would be prudent to explore the use of similar thermal models to evaluate whether internal waste package temperatures would rise to levels that could cause thermal cracking to occur before the waste packages returned to ambient conditions.
5.3 Other Physical Properties (Porosity, Tortuosity, Density, Hydraulic Conductivity)
Harbour et al. (2007d) discuss some “theoretical” facts about the relationship between pure cement porosity and the extent of hydration. The total porosity for pure cement or grout is generally defined as the percentage of total volume of cured solid that is not occupied by either the starting cementitious materials (in this case, Portland cement, BFS, and Class F fly ash) and the solid phases that result from reaction of these cementitious materials with water (calcium silicate hydrate [C-S-H] and calcium hydroxide crystals). For Saltstone and Cast Stone waste forms, the pore volume is occupied by a concentrated salt solution. The total porosity can be divided into capillary pores and gel pores with much smaller dimensions (Taylor 1997). For example, the Powers and Brownyard model (Powers and Brownyard 1947) predicts a gel porosity of 23% and a capillary porosity of 24% for a fully reacted Portland cement in water mixed at a water-to-cement ratio of 0.60. The total porosity is predicted therefore to be 47%, which is equivalent to saying that 47% of the cured Portland cement paste is occupied by water for the saturated case. Stated differently, complete hydration of OPC in water results in a porosity of 47% and an uptake of water through hydration reactions equivalent to a water/cement consumption ratio of 0.18.
For Saltstone or Cast Stone waste forms containing the typical high salt liquid wastes, the extent of hydration reactions is further reduced. The resulting porosities for such waste forms are much higher and approach a theoretical maximum porosity (about 62%) with an uptake of water through hydration reactions equivalent to a water/cement consumption ratio of only 0.04. This is the amount of water from the liquid waste brine that is consumed to form the C-S-H minerals. As seen in Table 5.3, the measured porosity for various Saltstone and Cast Stone waste forms is slightly lower than the theoretical maximum. Measured waste form porosities range from 50% to 60% with a consumption of water through hydration reactions equivalent to a w/cm ratio of 0.07.
Dixon et al. (2008) measured several physical properties for Saltstone waste forms made with three high-sodium caustic brines (see Appendix C, Tables C.6 to C.8) that are similar to the Hanford secondary

5.10
waste simulants. The Saltstone dry blend and mix ratio (see Appendix C, Table C.9) is also similar to those used for Cast Stone. Thus, the physical properties reported in Dixon et al. (2008) should be representative of the values for Cast Stone. The physical properties measured include saturated hydraulic conductivity, moisture retention, compressive strength, porosity, particle density, and dry bulk density. Table 5.3 contains the averaged values for the various Saltstone-waste simulant waste forms. Dixon and Phifer (2008) measured physical properties on another Saltstone waste form with the same dry blend and waste-to-dry blend solids ratio that was prepared with a different liquid waste simulant. They measured the saturated hydraulic conductivity for this specific formulation at 5.3 × 10⁻⁹ cm/sec, and the average dry bulk density and porosity were 0.99 g/cm3 and 0.596. This hydraulic conductivity value is a bit higher than the values for other Saltstone/waste simulant combinations shown in Table 5.3.
The high water (excludes the weight of dissolved salts in the waste simulant)-to-premix ratio used for Saltstone along with the relatively low degree of hydration for most waste simulants leads to high total and capillary porosities. These two conditions generally lead to higher permeabilities than the permeabilities for typical cementitious pastes in water. Therefore, it is not unexpected that the hydraulic conductivities of Saltstone mixes are relatively high compared to construction concretes/cements.

6.1
6.0 Waste Form Performance
6.1 Leach Data
Short-term laboratory leach testing for the various Cast Stone and Saltstone waste forms containing liquid waste simulants directly related to secondary waste streams or similar high concentration brines is discussed in this subsection. Most of the studies reviewed focused on 99Tc leaching.
6.1.1 ANSI/ANS-16.1
Numerous leach tests using the ANS-16.1 intermittent solution exchange protocol have been performed on Cast Stone and Saltstone containing simulated liquid wastes germane to Hanford’s secondary waste streams. Lockrem et al. (2005) performed ANS-16.1 leach tests on Cast Stone waste forms made with the secondary waste simulant (shown in Table 2.4) that had been spiked with iodide or Hg(II) at various concentrations (see Appendix D, Figure D.1 for details). The Cast Stone waste forms were cured for 28 days before being leached. The monoliths were quite small in size (1.5 cm diameter by 1.5 cm long with a monolith volume of only 2.6 cm3). For Cast Stone waste forms made with no getters present (aside from the BFS), the leach indices after 19 days of leaching for iodide and nitrate are shown in Table 7.9. In addition, the leach indices for iodide in Cast Stone waste forms that included four getters (silver zeolites, silver mordenite, Will Form, and bone char) at three different getter concentrations with one iodide loading and the four getters at one concentration with iodide at three loadings are also shown in Table 7.9. The waste forms with Hg spiked into the secondary waste simulant did not lead to consistent leach results. However, it can be stated that mercury release from Cast Stone waste forms containing any of the four getters yielded LI values > 9 to > 10.5 for Hg loadings that ranged from 0.16 to 0.62 µg Hg/g of waste form. The two silver-containing getters also did not leach appreciable silver into solution. The Cast Stone waste forms with the silver-bearing getters contained from 1.34E+03 to 1.88E+04 µg Ag/g of waste form, depending on the mass of silver-bearing getter added. The observed LIs for Ag after 19 days of leaching of the Cast Stone with silver getters ranged from 14 to 16.5. Simply stated, the silver in these getters is so insoluble that only minute quantities leach out of the waste forms. The use of the silver zeolite and silver mordenite did lower the leachability of iodide from the Cast Stone waste forms made with the iodide-spiked secondary waste simulant (from ~9 to 10, depending on iodide loading down to 10 to >11). The Will Form and bone char getters, which form apatite-like compounds within the Cast Stone, do not lower the iodide leachability and actually increased the leachability of iodide by a factor of 10 (LIs with no getter range from 9 to 10), but with these two getters dropping to 7.8 to 9.3. The increased leachability of iodide from Cast Stone waste forms containing calcium phosphate-based getters is likely caused by increased porosity in the hardened solids. Therefore, using the two calcium phosphate-based getters to sequester iodide is not recommended.
Duncan et al. (2009) and Guthrie et al. (2009) discuss ANS-16.1 leach tests on a Cast Stone variant (only includes Portland cement and BFS) that contained various Tc getters (see Table 2.6). The liquid waste simulant was a brine created by evaporation of Hanford groundwater (see Table 2.5). The monoliths with average dimensions of 2.9 cm diameter by 3.5 cm length were cured at 54°C for 3 to 4 days and then at room temperature in their moisture-proof molds for the remaining time period to reach 28 days. The monoliths were removed from the molds after 28 days and subjected to the abbreviated ANS-16.1 leach test, which concludes after 5 days of leaching. The various waste forms contained approximately 0.65 ppm (11,000 pCi/g) 99Tc in the final cured waste forms (range 0.58 to 0.71 ppm 99Tc).

6.2
The Tc release results, presented as LIs, on this Cast Stone (variant) waste form with no Tc getters and with the various getters are shown in Figure 6.1. The actual numerical data were not presented in tables in either reference. From estimating the LI values from the figure and text in the citations, it can be concluded that the Tc LI for the Cast Stone variant with no getters was 11.25. As shown in Figure 6.1, the getter Fishbone actually had a deleterious impact on the leachability of Tc, and the zero-valent iron reductant also had a slightly negative impact on the release of Tc from the Cast Stone variant monoliths. The hydrotalcite getter had no impact of Tc leachability, but all the other Tc getters/reductants improved the retention of Tc in the Cast Stone variant waste form. The tin(II) treated apatite and anion exchange resins lowered the Tc release (diffusivity) by over a factor of 10 compared to the waste form with no Tc getters. The LI for the best getter, the tin(II) treated apatite, was 12.7.
Figure 6.1. Leachability Indices for 99Tc from Cast Stone Monoliths Containing Various Getters
Harbour et al. (2004) found the getter hydroxyapatite added to the Cast Stone dry blend shown in
Appendix C, Table C.6 at 75 g to a total dry blend solids mass of 1080 g did not appreciably improve the retention of 99Tc in DIW or two SST supernate simulants over a 26-day leach period in comparison to the 99Tc retention afforded by the BFS itself. No Cast Stone waste forms without BFS were generated to see if using hydroxyapatite getter in mixes without the BFS would improve Tc retention. Calculations of the leach indices for each monolith using measured values of the 99Tc concentrations resulted in LIs ranging from 10.5 to 11.4. Duplicate results of each waste form are shown in Table 7.9. This LI range is equivalent to a range of effective diffusivities (Deff) of 1.9E-09 to 2.1 E-10 cm2/s. One interesting observation in Harbour et al. (2004) was that upon crushing cured Cast Stone waste forms containing BFS or slag plus hydroxyapatite, the crushed waste forms adsorbed 99Tc from DIW, Tank C-106 supernate simulant, and C-200 series tank supernate simulants. The sorption tests using crushed waste forms were intended to simulate the case where rainwater infiltrates into the tank, dissolves 99Tc from the walls of the tank, and then contacts the cured stabilization grout that will be used to fill the empty tanks. For the long-term PA of secondary waste forms in the IDF disposal facility, the potential adsorption properties of the weathered/disaggregated waste forms should be considered. It appears that Cast Stone may be capable of adsorbing leached contaminants as well as being a source of leached contaminants.
6.3
Harbour et al. (2006c) and Aloy et al. (2007) measured the leachability of 99Tc from a variant of the Saltstone reference dry blend mix that replaced the fly ash with greater proportions of cement and BFS (final dry mix was cement 25%, BFS slag 70%, iron powder 5%). An effective diffusion coefficient for Tc of 4.75 × 10⁻¹² (LI of 11.4) was measured using the ANSI/ANS-16.1 protocol. The leaching results show that, even in the presence of a concentrated salt solution, BFS can effectively reduce pertechnetate to the immobile +4 oxidation state.
Oblath (1984) created cementitious waste forms with a binary component dry blend of Class C fly ash and Class H cement (sulfate resistant and low heat of hydration) mixed with a simulated Savannah River tank salt brine solution. The mix was 40 wt% salt solution, 40% fly ash, and 20% cement. The simulated salt solution (32 wt% dissolved solids) was used after being spiked with tracer amounts of 95mTc, 85Sr, and 137Cs. The waste forms were 250-g samples (125 cm3 cylinders, geometric surface area 144 cm2). The waste forms were cured at either 18 days (open to air) or 28 days (in closed containers). The leach test was similar to ANS-16.1, but the DIW (500 mL) exchanges were performed at 1, 2, 3, 4, 5, 7,14, 21, 35, 42, 56, 63, 70, 77, 84, and 98 cumulative days. When cured in air, the surfaces dried out, and salt rind developed that leached into the first water contact. The samples cured in closed containers did not exhibit the “high blast” or wash-off of contaminants in the first leach solution. For this Saltstone variant with no BFS, nitrate and technetium were equally leachable. In this Saltstone variant, cesium was released at 70%, and strontium was released at 4% of the nitrate release rate. Because there was no BFS used in this Saltstone mix, the 99Tc leached at the same rate as the nitrate. Appendix C, Table C.12 shows raw leach data from an appendix in Oblath (1984), but the cumulative leach time and intervals between solution exchange differ from the text. The raw data do show comparable fractions of 99Tc and nitrate leached from this Saltstone variant with no BFS.
Gilliam et al. (1990) solidified a filtrate liquid waste from “raffinate” from uranium recovery and equipment decontamination operations at the Portsmouth Gaseous Diffusion Plant in Portsmouth, Ohio. The acidic raffinate was diluted and the pH adjusted with sodium hydroxide to a value of 8.2 to 8.5. The pH adjustment resulted in the precipitation of metal hydroxides, which were further concentrated by filtration to yield a filter cake designated as heavy metals sludge (HMS) and an HMS filtrate. This liquid waste contains high sodium and nitrate (94 g/L [1.5 M]) and 13.7 mg/L 99Tc. This HMS filtrate was solidified in a grout dry blend consisting of 1) Type I-II-LA Portland cement obtained from the Dixie Cement Company in Knoxville, Tennessee; 2) ASTM Class F fly ash from Centralia, Washington, obtained from Pozzolanic International in Mercer Island, Washington; and 3) granulated BFS. Four sources of BFS were evaluated:
1. Material originating from Japan and obtained from Ash Grove Cement West Inc., in Kennewick, Washington
2. Material originating from Cleveland Republic Furnace No. 6 and obtained from Standard Slag Company in Canfield, Ohio
3. The Cleveland slag with gypsum added at 3 wt%
4. Material originating from Sparrow's Point, Maryland, obtained from Blue Circle Atlantic, Inc., in Atlanta, Georgia.
The dry-solids blend for each grout formula was placed in a V-blender and tumbled for 4 h. The resulting homogenized dry blend was added to the HMS filtrate waste over a 30-s period in a Model N-50 Hobart mixer, which was set at a low stirring rate (~139 rpm). The stirring speed was then increased to a
6.4
medium setting (~285 rpm) and allowed to mix for an additional 30 s. The resulting freshly prepared grouts were then poured into cylindrical Teflon molds (2.55-cm diameter by 4.80-cm length) and allowed to cure at 100% humidity for 28 days. The grout had the following composition: 40-wt% HMS filtrate, 20-wt% BFS, 20-wt% ASTM Class F fly ash, and 20-wt% Type I-II-LA Portland cement. Each of the four BFSs was used in separate mixes.
The resultant ANS-16.1 leach tests yielded LIs for 99Tc of 10.5 and for NO3 a value of 7.3. The source of the BFS does not measurably change the retention performance for technetium (LI = 10.5 ±0.5) or nitrate (LI = 7.3 ± 0.1). Gilliam et al.’s conclusion was that in the future, the source of BFS should be driven by economics rather than concerns about performance because any BFS seemed to lower 99Tc release similarly.
Gilliam et al. (1990) also investigated adding technical-grade sodium sulfide (Na2S•9H2O ~ 80% pure) to a grout dry-solids blend that consisted only of cement and fly ash. The added sodium sulfide significantly improved the retention of 99Tc as evidenced by the increase in 99Tc LI from 6.8 to 9.4. It can be hypothesized that porosity reduction and tortuosity increase in the grout matrix can be qualitatively observed by the LI for nitrate. As nitrates are readily soluble in grout pore water, any significant improvement in its retention may be attributed to these factors. The use of granulated BFS improved nitrate retention but by a relatively small amount compared with technetium. Thus, it can be concluded that the principal mechanism of improved retention is a result of the reducing capacity of the BFS and not the resulting improved physical properties of the grout.
6.1.2 EPA 1315
The EPA 1315 leach test (EPA 2009c) is very similar to the ANS-16.1 intermittent solution exchange test. There are minor differences in the times for the solution exchanges, but all other parameters are the same. Sundaram et al. (2011) performed leach tests on Cast Stone monoliths that had been cured for 32 days at room temperature in a 100% relative humidity condition. The waste compositions solidified are those described in Table 2.7 and Table 2.5. Effective diffusivities for 99Tc typically decreased several orders of magnitude over the first 2 weeks of testing and then stabilized for the duration of the 63-d testing. From 14 to 63 days, the 99Tc diffusivities were less than 6 × 10-11 cm2/s for the Cast Stone prepared with the 2-M, Na–based, S1, S2 and S3 simulants and for the 4-M, 6-M and 8-M Na-based, S1 simulants. Many of the leachate 99Tc concentrations were below analytical detection limits, so the calculated interval diffusivities were less-than values. For Cast Stone prepared with the 10 M Na based the concentration of S1, the 99Tc diffusivity was significantly larger and ranged from 1 × 10⁻¹⁰ to 2 × 10⁻¹⁰ cm2/s. The Cast Stone monoliths made with 2-M, Na-based, S4 simulant had the lowest Tc diffusivity of all ranging from 0.5 × 10⁻¹² to 1.1 × 10⁻¹² cm2/s. We currently do not have mechanistic-based explanations for the much better Tc leach performance for the S4-2M based monoliths or the poorer performance of the S1-10M-Na based monoliths. All of these diffusivity values compare favorably with the target 99Tc effective diffusivity of less than 1 × 10⁻⁹ cm2/s. From a 99Tc leachability perspective, the Cast Stone performance observed by Sundaram et al. (2011) was very good over the entire range of simulant concentrations and composition studied. All these values are found in Table 7.3.
Because the 99Tc effective diffusivities for the Cast Stone monoliths were well below 2 × 10⁻¹⁰ cm2/s at the actual sodium concentrations (0.52 to 2.1 M Na) used, which were equivalent to salt waste loadings of 7.8 to 9.5% of the hardened solid, there is the potential to increase the waste salt and sodium

6.5
concentration above the currently demonstrated range. Increasing Na or total waste salt loading above these values will need to address both the leaching performance and the stiffening and setting behavior of the Cast Stone. These studies may include steps such as adding super plasticizers or set retarders to improve the workability and reduce the pH of the waste stream to slow the hydration reactions. The EPA 1315 leach test results for Na (figures shown in Appendix G) were all much better than the desired value of 1× 10⁻⁶ cm2/s based on including the total sodium present in the liquid waste simulants and the three dry blend solids. The EPA 1315 leach results for iodide present in the liquid waste simulants were analyzed using the ANS-16.1 protocol wherein corrections are made to the incremental effective diffusion coefficients when the cumulative mass leached exceeds 20% of the monolith’s starting inventory. We made such corrections and also note that many of the leachates did not have detectable concentrations of iodide. Thus the fractions leached were estimated using realistic detection limits for iodide in leachates when no iodide was detected. Figures showing the resultant iodide diffusion coefficients are shown in Appendix G. As observed for 99Tc the incremental effective diffusion coefficients for iodide in the S4-2M simulant were significantly lower than for the other three 2M-Na based simulants. There was no clear trend in the iodide incremental effective diffusion coefficients as a function of S1 simulant sodium concentrations. Only the Cast Stone made with the S4 simulant might come close to meeting the desired 1 × 10-11 cm2/s leach criteria at long leach times; although as mentioned the leach tests suffered from not having high enough starting inventories of iodide to get quantitative leach data or conversely the detection limit for iodide in leachates needs to be improved. Despite the lack of adequate starting inventories of stable iodide in the waste forms made with simulants S1 through S3, based on other Cast Stone test results performed by Lockrem et al. (2005) without getters and the general literature on leaching of iodine species from cementitious waste forms, we believe that iodide leaching will not meet the desired leach index of 11 without the use of some type of effective iodide getter unless the short-term leach data in which wash-off is apparent are ignored.
6.1.3 ASTM 1308
This monolith leach test is very similar to the ANS-16.1 and EPA 1315 methods with only slight variations in the intervals chosen to exchange the water leachants. This ASTM method also describes and encourages the use of other leachants, such as site vadose zone pore water, groundwater, and sea water, and the leach tests are performed at elevated temperatures to accelerate diffusion processes. Several conceptual leach models and equations to process the raw data are also described and made available in companion support documents. The conceptual models include 1) the semi-infinite source diffusion model (assumed by both ANS-16.1 and EPA 1315), 2) the finite source diffusion model (where mass of COCs gets significantly depleted during the leach test so that the diffusion gradient is not constant), 3) a diffusion model where a percentage of the COC is not leachable and thus remains inert to leaching, and 4) a solubility controlled leach model where diffusion stops once the leachate concentration of the COC reaches its solubility limit.
Although the ASTM 1308 leach test has been used by some investigators for cement waste forms and is highly recommended as being more versatile and robust in its data analysis capabilities, none of the Cast Stone or Saltstone literature reviewed used this leach methodology.
6.6
6.1.4 Diffusion Coefficients/LI for Other Waste Form Components, Nitrates as Appropriate to Understand Waste Form Performance
The effective diffusion coefficient or LI values for other constituents besides 99Tc, I, and Re are discussed along with the companion data on the main COCs of interest, and the specific values are found in Table 7.9 and in figures found Appendix G for the Na and iodide leach results from Sundaram et al. (2011). Nitrate effective diffusion coefficients were not discussed in Sundaram et al. (2011) but the individual leach interval nitrate values were measured. The starting mass of nitrate in each Cast Stone waste form can be calculated from the masses of chemicals used to make each simulant, each simulant’s specific gravity, and the mass of each simulant used in the formulation of the various Cast Stone waste forms. Then the effective diffusion coefficients for nitrate and the leach index can be calculated using the same equations and process as reported in Sundaram et al. (2011). Nitrate leachability is often used to evaluate the physical performance of cementitious (grout) waste forms because nitrate does not chemically react significantly with the solid phases that form the hardened waste form.
6.1.5 DIW and Other Leachants
All of the Cast Stone and Saltstone leach tests in the reviewed literature used DIW or distilled water as the leachant. Should Cast Stone be the (or one of the) few waste forms chosen in the down-selection process, other more site-specific leachants, such as Hanford formation vadose zone sediment pore water and IDF glass leachate, should be used in future leach tests to assess the long-term performance of the Cast Stone in the IDF burial environment. As was noted during the Hanford grout project and the study of other cementitious waste forms, the leachability can be significantly different when conducted in leachants other than DIW or distilled water. In general, the effective diffusion coefficients for COCs as well as major components of the cementitious waste form are lower when leached in solutions with dissolved solids such as calcium, sodium, and bicarbonate/carbonate. Studies suggest that leachants similar to groundwater slow down cementitious waste form dissolution by participating in the reduction of diffusion gradients for various solutes as well as promoting back reactions, such as carbonate mineral coating of the waste form surfaces and micro-crack plugging.
6.2 Waste Form Performance Test Data (with Emphasis on Long-Term Performance Aspects)
To date, little experimentally based literature was found that discusses the long-term performance of Cast Stone or Saltstone waste forms. However, there has been discussion of natural analogs, such as a description of centuries-old buildings and aqueducts and a few decades-long lysimeter or subsurface disposal of cementitious specimens. A brief summary of selected information on analogs and longer term performance of buried cementitious monoliths follows.
Sobolev et al. (2006) prepared 30 × 30 × 30-cm cubes using various sodium nitrate salt wastes that ranged in concentration from 0.07 to 0.33 M solidified in ordinary Portland cement. Strontium-90 and 137Cs spikes were added to the sodium nitrate liquid waste simulants. The liquid waste-to-dry cement mix ratio was 0.66. After 7 days of curing, the cubes were buried (in 1965) in a simple mound-type surface repository. The cubes were covered by a sequence of earthen material, first with a 0.2-m-thick layer of sand and gravel and then a 0.5 to 0.7-m-thick layer of loam and then 0.1 to 0.3-m-thick layer of sod. The atmospheric precipitates, which contacted radioactive cement blocks, were collected and analyzed for the
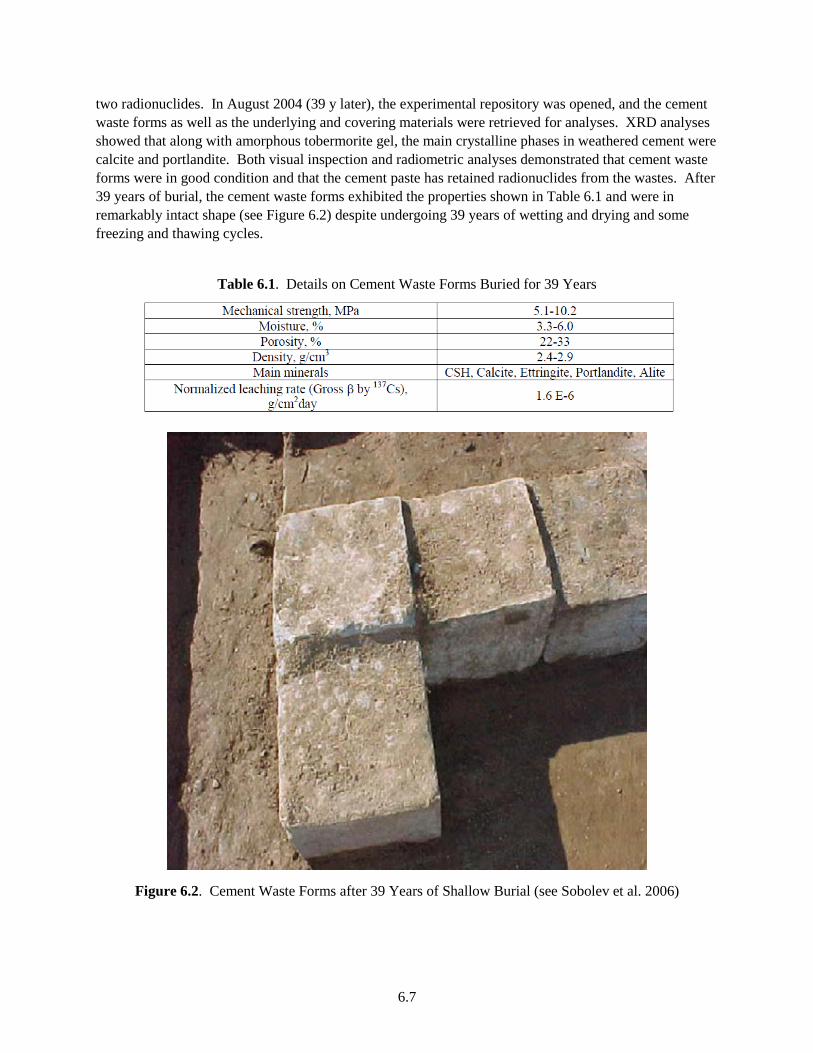
6.7
two radionuclides. In August 2004 (39 y later), the experimental repository was opened, and the cement waste forms as well as the underlying and covering materials were retrieved for analyses. XRD analyses showed that along with amorphous tobermorite gel, the main crystalline phases in weathered cement were calcite and portlandite. Both visual inspection and radiometric analyses demonstrated that cement waste forms were in good condition and that the cement paste has retained radionuclides from the wastes. After 39 years of burial, the cement waste forms exhibited the properties shown in Table 6.1 and were in remarkably intact shape (see Figure 6.2) despite undergoing 39 years of wetting and drying and some freezing and thawing cycles.
Table 6.1. Details on Cement Waste Forms Buried for 39 Years
Figure 6.2. Cement Waste Forms after 39 Years of Shallow Burial (see Sobolev et al. 2006)

6.8
Aloy et al. (2008) reviewed the durability of ancient mortars and concrete structures in St. Petersburg, Russia. Some of the structures were built in the 5th to 8th century AD. Chemical analysis of the ancient materials showed that significant quantities of carbonates and compounds such as calcium silicate hydrates were formed upon weathering. The weathered interface layer was on average 50% stronger than unweathered material. The quantity and size of the reaction fringes are proportional to the age of the mortars, the amount of soluble silica, and the activity of the silicon-containing filler. Calcium silicate hydrates react with carbonic acid and form calcite and amorphous silica, which is also relatively stable. The mineralogical composition of historical lime mortars is similar to modern pozzolanic cements. This important observation makes it possible to draw a parallel between ancient lime mortars and modern cements. In the course of centuries, these new formations improve the micro-hardness of the interface by 50% above average, with the tendency to increase with time. The size and quantity of layers are proportional to the age of the mortar and the amount of active silicon dioxide in the fillers. Regarding modern cement-based waste forms, the processes inside the cement during a long-lasting hardening are similar to those that occurred during the weathering of the ancient mortars. The weathering processes make the ancient and modern cement materials more durable and impermeable because of pozzolanic reactions. The decrease in permeability with weathering is explained by the generation of a protective carbonate layer.
Two other good reference documents, which discuss cementitious and pozzolanic natural analogs and that were prepared many years ago for the deep-geologic repository program, are Langton (1980) and Roy and Langton (1989).
Borges et al. (2008) studied the impacts of the carbonation process on the porosity and mineralogical structure of grouts made with various proportions of fly ash, OPC, BFS, and OPC (binary dry blend mixes instead of all three materials as used in Cast Stone). The process of accelerating the carbonation was to use air at 5% CO2, 60% relative humidity, and 25±5°C. The waste form samples used were small cylinders of 22 mm dia. by 45 mm length. The carbonation rate at 5% CO2 was measured with the phenolphthalein method. The depth of carbonation was measured spraying the phenolphthalein solution onto the freshly broken surfaces. The depths of carbonation were measured with a ruler with a precision of 0.5 mm. The mean of five readings was reported as the depth of carbonation at the specific age in conjunction with the standard deviation. The carbonation rate was calculated after linear regression of the curve of depth of carbonation plotted against the square root of time. They found that BFS/OPC grouts are much more resistant to carbonation than fly ash/OPC grouts. But most importantly, they caution that accelerated tests, wherein there was an increased temperature of curing or wetting/drying and accelerated carbonation, can lead to unrealistic results. Accelerating the exposure conditions, either by increasing the temperature or through wetting/drying, has the effect of changing the hydration pattern of the cementitious waste forms by generating more hydration in the BFS and fly ash mixed grouts than would normally occur. The large amount of porosity that occurs because of limited hydration allows the intrusion of gases and a ready movement of water, so the samples subjected to accelerated testing do not appear as durable as waste forms weathered under ambient conditions. It is not clear if this warning about accelerated weathering studies yielding erroneous results is borne out for waste forms weathered at ambient conditions for hundreds of years.
There is a considerable number of researchers in the United States and Europe that are attempting to build system-performance assessment models and computer codes that can predict the weathering of cementitious waste forms, concrete vaults, and other subsurface cement-based structures that may be incorporated into waste disposal facilities. These conceptual models and computer codes use as much

6.9
physical and chemically based mechanisms as are currently understood. The following citations and brief descriptions of their findings are offered as examples that would be valuable to review should Cast Stone be chosen as the final waste form or one of the final waste forms. These citations and activities should be valuable resources on how to conduct long-term testing and long-term modeling of cementitious waste form performance after burial in the IDF.
Wieland et al. (2006) have provided a synopsis of the activities being performed in Europe to create mechanistically based conceptual and computer models of cement and cementitious waste form weathering. Three basic trace-contaminant uptake mechanisms can be discerned: surface precipitation, adsorption to the surfaces of cement minerals either by specific binding or electrostatically by ion exchange, and, lastly, incorporation in cement minerals. The hydrate assemblage (C-S-H gels) of hardened cement paste provides a unique diversity of structurally different coordination sites on the surface or within the structure of the cement minerals capable of binding a wide variety of metal cations and anions in the cement matrix. There is a general consensus that C-S-H phases show a pH-dependent surface charge density caused by equilibrium between C-S-H and the alkaline pore solution, and the adsorption of contaminants on the surfaces are best modeled using surface complexation models. For the incorporation of contaminants within the structure of cement minerals, the solid-solution aqueous-solution (SSAS) approach is currently preferred. However, molecular dynamics approaches to modeling the structure and dynamics of aqueous species at the interface between cement minerals and solution has steadily been growing.
The release of constituents from cement-stabilized waste is governed by a combination of chemical (sorption, complexation, and precipitation) and physical (advection, diffusion) processes. It was demonstrated that repeated wetting and drying cycles, which are expected to take place under environmental conditions, significantly increase carbonation, hence reducing the porosity of the cementitious materials and consequently reducing the release of contaminants from cement-stabilized waste matrices.
In the United States, several conceptual and computer model activities germane to cementitious waste form, long-term performance should be reviewed should Cast Stone be chosen during the down-select process. Walton et al. (1990), Walton and Seitz (1991), Walton (1992), and Seitz and Walton (1993) present conceptual and mathematical models/computer codes to predict the long-term performance of concrete barriers. Models for concrete degradation, water flow, and transport through cracked concrete barriers are discussed. The models for flow and transport assume that cracks have occurred, and thus these models should only be used for later simulation times after fully penetrating cracks are formed. Most of the models have been implemented in a computer code, CEMENT. Langton (2009a,b, 2010) and SIMCO Technologies, Inc. (2009) have recently described experiments that evaluate the durability of the Saltstone waste form and the concrete vault material and measure Saltstone transport properties to parameterize the STADIUM® service life code. This is a one-dimensional diffusion transport code that predicts the rate of penetration of corrosive chemical fronts such as sulfate, which causes expansive ettringite mineral formation, into concrete. Currently the code uses kinetic and thermodynamic relationships (aqueous speciation and solubility-precipitation) for eight ionic species: OH-, Na+, K+, SO4
2-, Ca2+, Al(OH)4-, NO2
-, and NO3- and their solid phases commonly identified in cementitious and soil
environments. A goal of this SRNL-SIMCO Technologies cooperative effort is to predict the leach rate (degradation rate) for the Saltstone matrix over 10,000 years using the STADIUM® concrete service life code, and to validate the modeled results by conducting leaching (water immersion) tests. Using existing cementitious waste form expertise, the STADIUM concrete service life prediction code, and cementitious

6.10
material solid phase characterization techniques SRNL strives to predict the evolution of the Saltstone matrix as a function of curing time and to predict the durability of Saltstone. It is noted that presently the STADIUM code does not model the impacts of cracking on durability. The STADIUM code and data contained in the cited reports have relevancy to the long-term performance of cementitious waste forms as should be a good example of the strategy needed at the Hanford Site should Cast Stone be down-selected.
Most recently, a consortium called The Cementitious Barriers Partnership (CBP) has been formed to co-ordinate work on estimating the long-term performance of cement and increasing the general scientific understanding of the mechanisms of cement/concrete weathering in subsurface environments. The CBP is a multi-disciplinary, multi-institutional collaboration sponsored by the DOE Office of Waste Processing. The objective of the CBP project is to develop a set of tools to improve understanding and prediction of the long-term structural, hydraulic, and chemical performance of cementitious materials used in nuclear applications. A key goal of the CBP is to develop a set of simulation tools and data to be used to evaluate and predict the behavior of cementitious materials used in near-surface engineered waste-disposal systems, e.g., cementitious waste forms, containment structures, and entombments. Several recent documents published by the CBP (and available on their web site <www.cementbarriers.org> are Cementitious Barriers Partnership (2009a,b), Langton et al. (2010), and Meeussen et al. (2010).
In addition, several predictive model studies on the longevity of reducing conditions in Saltstone monoliths have been performed to show that oxygen diffusion into the very large Saltstone blocks is slow such that most of the reduced technetium will not be re-oxidized and thus made more readily leachable for time periods up to several tens of thousands of years. The relevancy of these re-oxidation projections to much smaller secondary waste forms destined for burial in IDF will need to be critically reviewed should Cast Stone, which uses nearly the same proportions of BFS as does Saltstone, be a waste form chosen for continued study. Details on the oxygen diffusion and reoxidation of Tc(IV) in the Saltstone disposal environment are found in Kaplan (2003), Kaplan et al. (2005), and Roberts and Kaplan (2009) and for a general conceptual model in Smith and Walton (1993).
Concrete degradation due to microbial activity is thought to occur when microorganisms present in the environment produce mineral or organic acids that dissolve or disintegrate the concrete matrix (Rogers et al. 1993, 1994, 1995). While the mechanism of attack is the same as that described for acid attack, some evidence exists that the presence of microorganisms greatly magnifies the intensity of attack. Three groups of bacteria are known to deleteriously impact concrete integrity (Rogers et al. 1993, 1994, 1995). Thiobacillus, sulfur-oxidizing bacteria, are most often associated with microbial deterioration of concrete structures (most often sewers). They metabolize reduced sulfur compounds and produce sulfuric acid as a waste product. Nitrobacillus, nitrifying bacteria, obtain energy required for cell synthesis by oxidizing inorganic nitrogen compounds such as ammonium/ammonia and nitrogen gas to nitrite and nitrate. The formation of nitrite and nitrate is accompanied by the release of hydrogen ions, forming nitrous and nitric acids. Heterotrophs include a variety of fungi as well as anaerobic and aerobic bacteria that obtain energy by assimilating organic carbon sources. Many species of heterotrophs generate organic acids as metabolic byproducts, including lactic, citric, gluconic, and malic acids. Since the work of Rogers et al. there has not been much discussion or additional laboratory study on the effects of microbial attack on cementitious waste forms. Therefore, the issue of the importance of microbial attack on grout remains open.
Radiation can impact cement/concrete durability by two mechanisms: 1) breaking bonds in the solid paste and or aggregate that results in embrittlement and 2) localized heating of the concrete caused by

6.11
absorption of radiation energy. Low doses of radiation, <1010 neutron/cm2 or 1010 Gy gamma, over periods of less than 50 years have no significant effect on concrete. Larger doses or doses imparted for longer than 50 years have not been studied. At Savannah River, the effect of radiation from the liquid wastes solidified in the Saltstone are expected to be negligible (Langton 2009a) because the anticipated radiation dose in the Saltstone and Vault concrete is expected to be less than 1010 neutron/cm2 and less than 1010 Gy gamma over the 10,000 year performance period. The radiation dose for secondary waste in Cast Stone should be less than the doses measured/calculated for Savannah River Saltstone and thus radiation impacts from Cast Stone should be minimal.
Of the following waste form laboratory tests, which all use disaggregated or crushed waste forms to quickly obtain data to investigate COC retention and overall waste form release/dissolution properties, only tests using the recently proposed EPA 1313 and EPA 1316 have been reported in Cast Stone literature.
6.2.1 Product Consistency Test
We did not find any literature where cementitious waste forms have been subjected to the Product Consistency Test (PCT) methodology.
6.2.2 Single-Pass Flow-Through Test
We did not find any literature where cementitious waste forms have been subjected to the single pass flow through (SPFT) test methodology.
6.2.3 Pressurized Unsaturated Flow Test
We did not find any literature where cementitious waste forms have been subjected to the pressurized unsaturated flow apparatus (PUF) test methodology.
6.2.4 6.2.4 EPA 1313
Both Pierce et al. (2010) and Sundaram et al. (2011) have performed EPA 1313 tests on Cast Stone waste forms made with the secondary waste simulants described in Table 2.7. EPA method 1313 is a static test where a set of parallel extraction experiments is conducted in dilute nitric acid or sodium hydroxide base at a fixed pH (pH range from 4 to 12) and a liquid-to-solid ratio (10 mL/g) (EPA 2009a). Because the natural pH of the DIW leachate for Cast Stone powdered samples is always high (pH ~12 to 13) only nitric acid is added to Cast Stone/DIW slurries (10 mL/g) to obtain the desired pH suite after 24 hours of equilibration. Analytical grade HNO3 was used to prepare a solution of 2 N HNO3 for these experiments. Based upon the pre-titration results, 10 g of <0.3-mm sized Cast Stone is mixed with predetermined amounts of 2 N HNO3 (Optima-trace metal free), and the samples are brought to volume (100 mL) with DIW. All samples were placed on a platform shaker and allowed to mix at room temperature (23 ±2°C) for 24 hours. After the 24-hour contact time was complete, the slurry samples were centrifuged and filtered with a syringe filter (0.45-μm size polypropylene membrane). The filtrate was used to measure the solution pH, electrical conductivity (EC), and redox potential and then was submitted for additional chemical analyses of the filtrates. An example of the container used in EPA 1313 and 1316 tests is shown in Figure 6.3.

6.12
Figure 6.3. An Example of the Type of Static Container Used to Conduct the EPA 1313 and 1316 Test
Methods
Figure 6.4 shows the EPA 1313 results for the release of 99Tc from the Cast Stone waste forms made
with the four different secondary waste simulants at 2-M starting sodium concentrations and the waste forms made with S1 simulant at varying sodium starting concentrations. Details were extracted from Sundaram et al. (2011). As pH of the slurry dropped below 7 to 9, the mass of 99Tc released per gram of Cast Stone also dropped. The apparent decrease in the mass of technetium leaching at lower pH conditions is possibly caused by technetium re-adsorption onto the Cast Stone solids at low pH conditions. At a lower pH, some of the surface adsorption sites on Cast Stone minerals have a net positive charge that can attract anions. A second possibility with less probability is the precipitation of some low-solubility compound that coprecipitates Tc or the direct precipitation of Tc compound. No geochemical modeling analysis was performed by Sundaram et al. (2011) to explore whether any minerals or solid compounds would be over-saturated at acid to near neutral pH conditions or whether there would be changes in Tc speciation or valence state at these pH conditions that might explain the decrease in Tc in the supernatant solution from the EPA 1313 testing. The apparent larger release of 99Tc for the Cast Stone waste form made with the S4 simulant is mainly caused by a the high loading µg Tc/g of Cast Stone waste form compared to the other Cast Stone waste forms made with other simulants. Cast Stone made with simulant S4-2M sodium contained 8.2 µg Tc/g compared to 0.016µg Tc/g for the three other simulants with 2M Na.

6.13
0.001
0.01
0.1
1
10
3 4 5 6 7 8 9 10 11 12 13pH
Rel
ease
d Tc
(ug
of T
c/g
of s
olid
) S1 with 2M
S1 with 4M
S1 with 6M
S1 with 8M
S1 with 10M
S2 with 2M
S3 with 2M
S4 with 2M
EQL (0.008)
Figure 6.4. 99Tc Release from Crushed Cast Stone Waste Forms Made with Various Secondary Waste
Simulants as a Function of Slurry pH
At pH values higher than 10.0, the mass of technetium per gram of Cast Stone dropped or became
constant, which is similar to the EPA Method 1313 results for Cast Stone results found in Phase 1 (see Pierce et al. 2010). The trend of decreasing or constant technetium leaching has been attributed to carbonation processes that result in calcite precipitates forming onto and perhaps inside the pore spaces of the Cast Stone at a high pH above 10.0.
Figure 6.4 also shows an increase in the mass of leachable technetium per gram of Cast Stone in the Method 1313 leachates as the simulant molarity that was solidified was increased. The starting mass of 99Tc in each Cast Stone made with S1 simulant also increased as the sodium concentration was increased. This trend may simply being following the trend of increasing starting mass in the Cast Stone or alternatively may suggest that the higher salt content of the simulant that has also leached into the solution is competing with the technetium molecules for adsorption or co-precipitation sites within the crushed Cast Stone pieces in the slurry. Thus, it is difficult to form conclusions on the release of Tc (from the data in Figure 6.4) from the crushed Cast Stone waste forms made with the various concentrations of S1 simulant. Sundaram et al. (2011) present the EPA method 1313 Tc leach data as a percent of total Tc in their Table 6.5 (not in this report) that is better suited for making comparisons. The data in Sundaram’s Table 6.5 does suggest that the percentage of the 99Tc released for any given pH value as a function of S1 concentration is lower for the Na concentrations based on 2 M and 4 M than for the Na concentrations based on 6 M, 8 M, and 10 M. If a Tc solid compound was controlling the solubility, one would expect that the smaller percentages of the total Tc in the Cast Stone waste forms made with the higher concentrations of S1 simulant would be found in the leachate. So the Sundaram et al. (2011) hypothesis that the differences in Tc release as a function of pH are controlled by “back” adsorption onto the Cast Stone minerals themselves may be correct. Kaplan et al. (2008) has studied 99Tc as well as other contaminants’ adsorption tendencies onto Saltstone chunks exposed to spiked waters and found
6.14
significant adsorption potential for many contaminants. Therefore, re-adsorption of previously released 99Tc may be a correct interpretation of the Method 1313 leachate results.
6.2.5 EPA 1316
EPA Method 1316 (Liquid-Solid Partitioning as a Function of Liquid-to-Solid Ratio) is a static test method that uses DIW as the leachant at a variety of liquid-to-solid ratios (EPA 2009b). The purpose of this test method is to evaluate the effect of differing liquid-to-solid ratios on the release of contaminants. These experiments were conducted on Cast Stone waste forms by both Pierce et al. (2010) and Sundaram et al. (2011) by adding DIW to test vessels containing a predetermined amount of Cast Stone crushed waste form (<0.3 mm). These experiments were conducted at three different liquid-to-solid ratios (10, 5, and 2 mL/g). After preparation, all the samples were placed on a platform shaker and allowed to mix for 24 hours. After the 24-hour contact time was complete, the slurry samples were centrifuged and filtered using a syringe filter (0.45-μm size polypropylene membrane). The filtrate was then used to measure the solution pH, EC, and redox potential and was submitted for additional chemical analyses to determine the concentration of most macro solutes and trace contaminants of interest.
Sundaram et al. (2011) and Pierce et al. (2010) observed decreases in EC, alkalinity, and most of the major cations and anions with an increase in the liquid-to-solid ratio. This decrease is probably the result of a dilution effect at higher liquid-to-solid ratio conditions, suggesting that over the 24-hour time period allotted, most of the solutes do not reach a solubility limit (a constant concentration value irrespective of the liquid-to-solids ratio).
The leached technetium concentration slightly decreased in the leachates as the liquid-to-solids ratio increased (see Figure 6.5), indicating that the highest liquid-to-solids ratio might be diluting the technetium concentration in the leachates. However, in Sundaram et al. (2011), both the absolute Tc masses and the leachable amount of technetium normalized by the Cast Stone waste form mass used (µg/g) are not significantly different as a function of the liquid-to-solids ratio, indicating that the percentage of leachable technetium found in the Cast Stone was not dependent on the different liquid-to-solids ratios. The highest leachable technetium concentration was found in leachates from Cast Stone produced using simulant S4, which contained significant concentrations of NH4
+, and the percentage of leachable technetium ranged from 25 to 32 wt%. However, this particular Cast Stone-simulant combination was loaded with a significantly larger mass (>100 times more) of 99Tc than all the other Cast Stone-simulant combinations studied. Therefore, it is not clear that one should attribute the increased 99Tc release to the S4 simulant’s macro constituent, (e.g., ammonium), the total waste (salt) loading, or the much larger 99Tc loading. Experiments where the 99Tc loading versus waste simulant type is kept constant and where the 99Tc loading for a fixed waste simulant composition is varied, would be necessary to elucidate what parameter is controlling the 99Tc release.
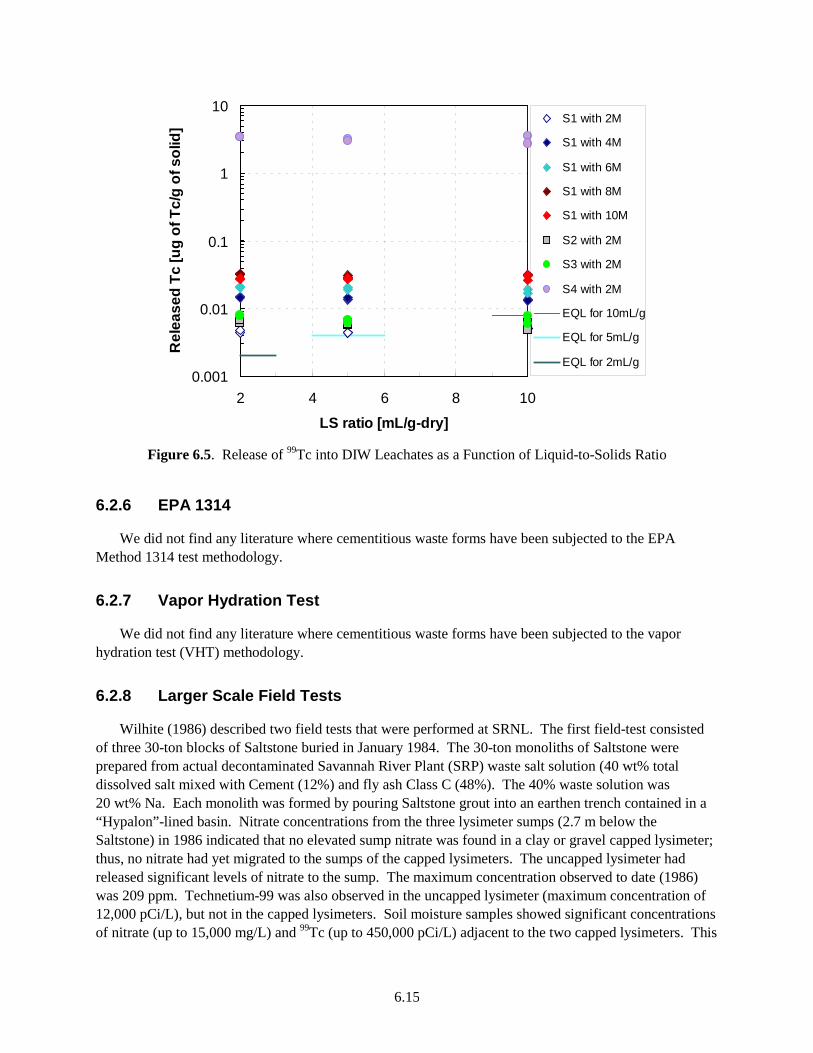
6.15
0.001
0.01
0.1
1
10
2 4 6 8 10
LS ratio [mL/g-dry]
Rel
ease
d Tc
[ug
of T
c/g
of s
olid
]
S1 with 2M
S1 with 4M
S1 with 6M
S1 with 8M
S1 with 10M
S2 with 2M
S3 with 2M
S4 with 2M
EQL for 10mL/g
EQL for 5mL/g
EQL for 2mL/g
Figure 6.5. Release of 99Tc into DIW Leachates as a Function of Liquid-to-Solids Ratio
6.2.6 EPA 1314
We did not find any literature where cementitious waste forms have been subjected to the EPA Method 1314 test methodology.
6.2.7 Vapor Hydration Test
We did not find any literature where cementitious waste forms have been subjected to the vapor hydration test (VHT) methodology.
6.2.8 Larger Scale Field Tests
Wilhite (1986) described two field tests that were performed at SRNL. The first field-test consisted of three 30-ton blocks of Saltstone buried in January 1984. The 30-ton monoliths of Saltstone were prepared from actual decontaminated Savannah River Plant (SRP) waste salt solution (40 wt% total dissolved salt mixed with Cement (12%) and fly ash Class C (48%). The 40% waste solution was 20 wt% Na. Each monolith was formed by pouring Saltstone grout into an earthen trench contained in a “Hypalon”-lined basin. Nitrate concentrations from the three lysimeter sumps (2.7 m below the Saltstone) in 1986 indicated that no elevated sump nitrate was found in a clay or gravel capped lysimeter; thus, no nitrate had yet migrated to the sumps of the capped lysimeters. The uncapped lysimeter had released significant levels of nitrate to the sump. The maximum concentration observed to date (1986) was 209 ppm. Technetium-99 was also observed in the uncapped lysimeter (maximum concentration of 12,000 pCi/L), but not in the capped lysimeters. Soil moisture samples showed significant concentrations of nitrate (up to 15,000 mg/L) and 99Tc (up to 450,000 pCi/L) adjacent to the two capped lysimeters. This
6.16
demonstrates that soluble components were released from the Saltstone, but the cap is effective in reducing the amount of water flowing next to the monolith, which could carry the materials to the sump. This delay that the caps provide is one measure of their effectiveness.
Later in February 1985, another lysimeter study using a Saltstone with BFS as part of the dry blend was started. The newer lysimeter with the BFS-containing Saltstone was a fiberglass cylindrical tank installed on end on top of a concrete pad. Gravel with a sump pump and then a thin layer of native sediment was placed below the waste form cylinder. The pre-casted (240 kg) cylindrical Saltstone [46% waste solution, 26% BFS slag, 27% Class F fly ash, and 1% Ca(OH)2] was then lowered in place. The sump was 0.9 m below the bottom of the slag Saltstone monolith. Samples of the percolate water as well as rainwater were collected twice a week. There was a drought from July 1988 to February 1989, and no sump water was generated or recovered during this period. When rains again occurred, a large slug of nitrate came out. Technetium-99 in the sump water from the slag Saltstone was 100 times less than the original no-slag Saltstone lysimeters, again suggesting that the BFS is reducing the Tc in the waste to the less-leachable Tc(IV) form.
6.3 Structural Location or Speciation Information of Contaminants Within Waste Form Phases
Sundaram et al. (2011) characterized the final cured Cast Stone waste forms made with the various secondary waste simulants and found ettringite as the main crystalline phase formed in the hydrated Cast Stone. Another notable phase observed in the XRD pattern was carbonated calcium monosulfoaluminate (AFm) phases. Hemicarbonate AFm (AFm0.5C) and monocarbonate AFm (AFMC) were observed in the hydrated Cast Stone waste forms made with all secondary waste simulants shown in Table 2.7. The XRD peak intensity of AFMC was very small, but the XRD peak intensity of the AFm0.5C was quite noticeable in the Cast Stone solids made with simulants S1, S2, and S3. The Cast Stone made with simulant S4 exhibited a significantly decreased XRD intensity peak for AFm0.5C and showed a more prominent nitrate-based AFm (AFmN) XRD peak instead. The change in proportions of AFmC and AFmN observed in the S4 simulant could correlate with the observed differences in leachability of the trace anions (pertechnetate and iodide) observed between the S1- through S3- simulant-based Cast Stone and the S4-based Cast Stone. Atkins and Glasser (1992) note that calcium monosulfate aluminate may provide a host phase for sequestering anionic radionuclides such as iodide (and presumably iodate). Differences in the type of calcium monosulfate aluminate (nitrate vs. carbonate) may account for the better performance of the S4 simulant-based Cast Stone. This possibility should be investigated if Cast Stone is chosen as the preferred candidate after the down selection.
6.3.1 Mechanisms of Containment
All the literature reviewed that explicitly addresses the mechanism for keeping 99Tc sequestered in Cast Stone and Saltstone suggests that diffusion processes are the major controlling process. The cementitious waste forms are porous, but the pore sizes are quite small, and the connectivity of the pores is very tortuous. Both of these physical properties impede the movement of solutes in the cementitious waste forms’ trapped pore water to the surface and subsequent release. A few of the reviewed articles that discuss the physical aspects of diffusion that limit contaminant release include Wilhite (1986), Langton (1988), and Clark and Wilhite (1990).
6.17
Further, for cementitious waste forms with BFS, it is universally claimed and empirically demonstrated with comparative leach tests that the BFS reduces Tc(VII) to Tc(IV). This is the case where BFS is either present or not and to some extent is verified by detailed solid-phase, oxidation-state measurements using the synchrotron-based X-ray absorption spectroscopic technique known as X-ray Absorption Near Edge Structure (XANES). Tc(IV) is much less soluble in pore fluids and also exhibits much greater adsorption properties at the pH conditions of cementitious waste forms. Thus, the reduced Tc(IV) species is likely controlled by both solubility and adsorption chemical mechanisms. The key issue for long-term performance is how long can the reducing environment promoted by the presence of the BFS be maintained within and just at the surface of the buried Cast Stone waste forms. As mentioned above in the introduction to Section 6.2, SRNL staff have developed a conceptual and mathematical model to determine the rate of oxygen influx into Saltstone monoliths that causes rapid re-oxidation of the Tc(IV) to Tc(VII) that can then diffuse out of the waste form at rates controlled by the physical diffusion processes.
ANS-16.1 and EPA 1315 leaching curves for 99Tc generally show a rapid decrease in leach rate between the first few leach intervals and later leach intervals. This rapid decrease in leach rate has been attributed to dissolution of salts from the monolith surface. Wilhite (1986) described ANS-16.1 leach tests where after the second day when the wash-off salts were completely dissolved, the leach rate for nitrate, technetium, and cesium decreased in proportion to the square root of time—the classic indication of diffusion control. Further, Wilhite (1986) discussed nitrate leach results for Saltstone samples, prepared in the laboratory and for some buried in a large-scale field test. The various nitrate leach results were analyzed using diffusion equations to quantify the effective diffusion coefficient. The effective diffusion coefficient was calculated to be 1.04 ± 0.09 × 10⁻⁸ cm2/sec.
As mentioned earlier, detailed solid phase characterization of Saltstone waste forms containing 99Tc has shown significant reduction of the Tc(VII) pertechnetate species added to the liquid waste simulants within the hardened Saltstone waste forms. However, the Tc(IV) is readily re-oxidized back to Tc(VII) near the surfaces of pieces of waste form when they are exposed to air. Details can be found in Allen et al. (1997), Lukens et al. (2005), and Shuh et al. (2010).
6.3.2 Impact of Getters
As mentioned earlier, there have been several getter studies performed to ascertain the benefit of adding such materials to the standard Cast Stone or Saltstone dry blend to immobilize two key contaminants, iodide and 99Tc. The details are found in Sections 2.3 and 6.1.1, and the specific iodide and 99Tc leachability data are found in Table 7.9. Our assessment of the data is that silver-containing getters did improve the immobilization of iodide with the Cast Stone recipes studied (including some with BFS). However, if the iodide sequestering mechanism is formation of highly insoluble silver iodide, its long-term stability can be questioned in the IDF disposal environment. The following analysis of silver iodide stability was provided by Dr. Jim Krumhansl of Sandia National Laboratory as part of his review of the draft version of this data package.1
The AgI solubility is lowest at intermediate fugacities of oxygen (fO2) that lie between conditions likely to be encountered at the earth’s surface and those likely to be established during the corrosion of various metallic waste package materials as shown in Figure 6.6. At the Earth’s surface the calculations 1 Personal communication, Dr. Jim Krumhansl, July 29, 2011.
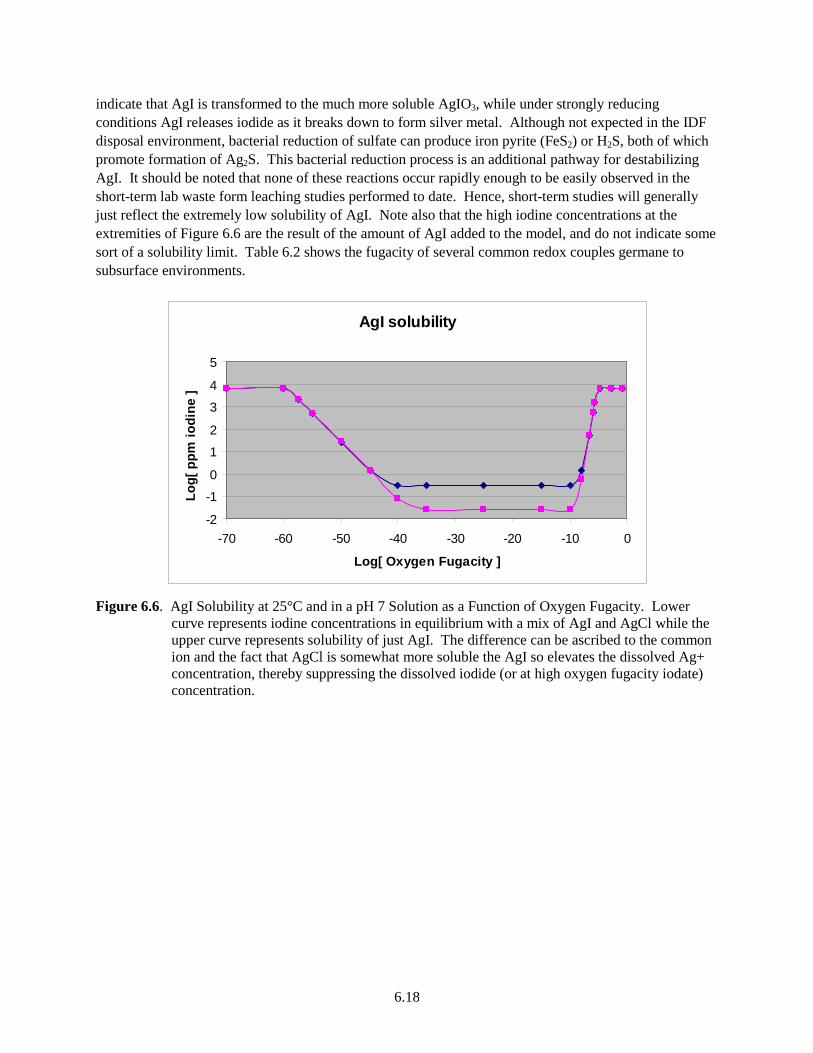
6.18
indicate that AgI is transformed to the much more soluble AgIO3, while under strongly reducing conditions AgI releases iodide as it breaks down to form silver metal. Although not expected in the IDF disposal environment, bacterial reduction of sulfate can produce iron pyrite (FeS2) or H2S, both of which promote formation of Ag2S. This bacterial reduction process is an additional pathway for destabilizing AgI. It should be noted that none of these reactions occur rapidly enough to be easily observed in the short-term lab waste form leaching studies performed to date. Hence, short-term studies will generally just reflect the extremely low solubility of AgI. Note also that the high iodine concentrations at the extremities of Figure 6.6 are the result of the amount of AgI added to the model, and do not indicate some sort of a solubility limit. Table 6.2 shows the fugacity of several common redox couples germane to subsurface environments.
AgI solubility
-2
-1
0
1
2
3
4
5
-70 -60 -50 -40 -30 -20 -10 0
Log[ Oxygen Fugacity ]
Log[
ppm
iodi
ne ]
.
Figure 6.6. AgI Solubility at 25°C and in a pH 7 Solution as a Function of Oxygen Fugacity. Lower
curve represents iodine concentrations in equilibrium with a mix of AgI and AgCl while the upper curve represents solubility of just AgI. The difference can be ascribed to the common ion and the fact that AgCl is somewhat more soluble the AgI so elevates the dissolved Ag+ concentration, thereby suppressing the dissolved iodide (or at high oxygen fugacity iodate) concentration.
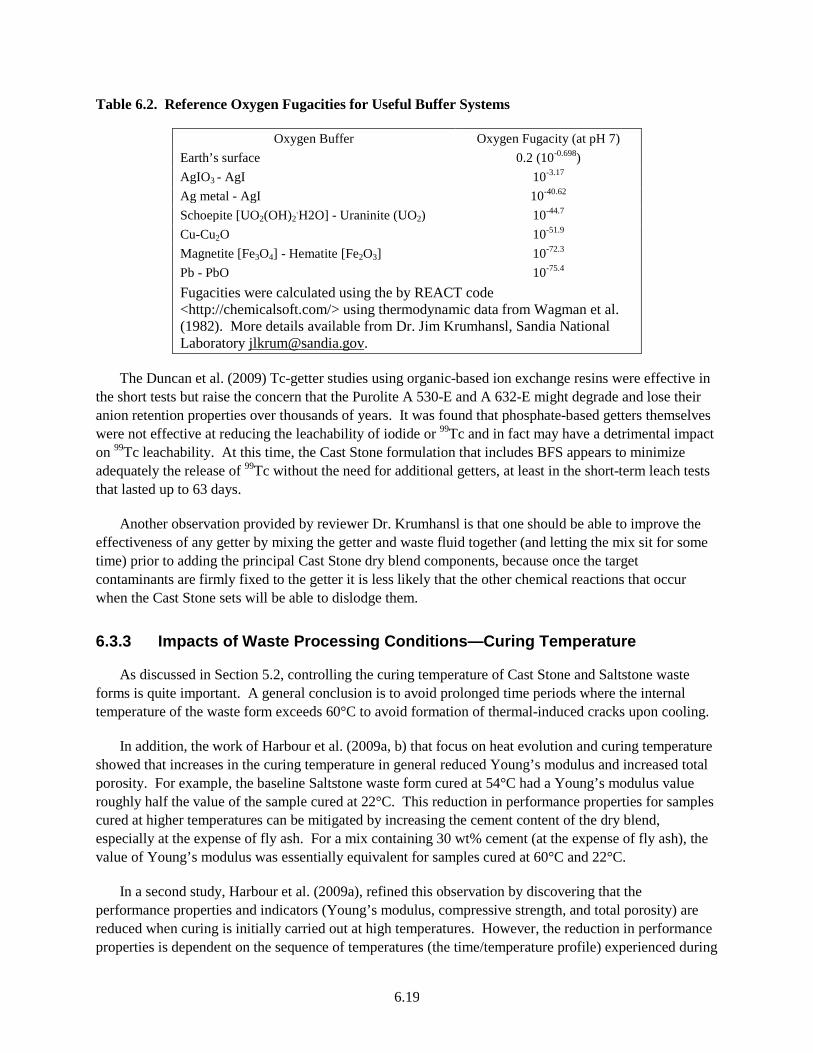
6.19
Table 6.2. Reference Oxygen Fugacities for Useful Buffer Systems
Oxygen Buffer Oxygen Fugacity (at pH 7) Earth’s surface 0.2 (10-0.698) AgIO3 - AgI 10-3.17 Ag metal - AgI 10-40.62 Schoepite [UO2(OH)2
.H2O] - Uraninite (UO2) 10-44.7 Cu-Cu2O 10-51.9 Magnetite [Fe3O4] - Hematite [Fe2O3] 10-72.3 Pb - PbO 10-75.4 Fugacities were calculated using the by REACT code <http://chemicalsoft.com/> using thermodynamic data from Wagman et al. (1982). More details available from Dr. Jim Krumhansl, Sandia National Laboratory [email protected].
The Duncan et al. (2009) Tc-getter studies using organic-based ion exchange resins were effective in the short tests but raise the concern that the Purolite A 530-E and A 632-E might degrade and lose their anion retention properties over thousands of years. It was found that phosphate-based getters themselves were not effective at reducing the leachability of iodide or 99Tc and in fact may have a detrimental impact on 99Tc leachability. At this time, the Cast Stone formulation that includes BFS appears to minimize adequately the release of 99Tc without the need for additional getters, at least in the short-term leach tests that lasted up to 63 days.
Another observation provided by reviewer Dr. Krumhansl is that one should be able to improve the effectiveness of any getter by mixing the getter and waste fluid together (and letting the mix sit for some time) prior to adding the principal Cast Stone dry blend components, because once the target contaminants are firmly fixed to the getter it is less likely that the other chemical reactions that occur when the Cast Stone sets will be able to dislodge them.
6.3.3 Impacts of Waste Processing Conditions—Curing Temperature
As discussed in Section 5.2, controlling the curing temperature of Cast Stone and Saltstone waste forms is quite important. A general conclusion is to avoid prolonged time periods where the internal temperature of the waste form exceeds 60°C to avoid formation of thermal-induced cracks upon cooling.
In addition, the work of Harbour et al. (2009a, b) that focus on heat evolution and curing temperature showed that increases in the curing temperature in general reduced Young’s modulus and increased total porosity. For example, the baseline Saltstone waste form cured at 54°C had a Young’s modulus value roughly half the value of the sample cured at 22°C. This reduction in performance properties for samples cured at higher temperatures can be mitigated by increasing the cement content of the dry blend, especially at the expense of fly ash. For a mix containing 30 wt% cement (at the expense of fly ash), the value of Young’s modulus was essentially equivalent for samples cured at 60°C and 22°C.
In a second study, Harbour et al. (2009a), refined this observation by discovering that the performance properties and indicators (Young’s modulus, compressive strength, and total porosity) are reduced when curing is initially carried out at high temperatures. However, the reduction in performance properties is dependent on the sequence of temperatures (the time/temperature profile) experienced during

6.20
the curing process. That is, Saltstone monoliths that are subjected to a 1, 2, 3, or 4-day curing time at 60°C followed by final curing at 22°C lead to performance properties that are significantly different than the properties of Saltstone that is allowed to cure for 1, 2, 3, or 4 days at 22°C followed by a treatment at 60°C. The performance properties of Saltstone cured in the sequence of higher temperatures first are generally less (and in some cases significantly less) than performance properties of Saltstone cured only at 22°C. This loss in performance was shown to be mitigated by the increased slag content or cement content in the dry blend at the expense of fly ash. The results in these reports indicate that to meaningfully measure and report the performance properties of Saltstone, one has to know the time/temperature profile conditions under which the Saltstone was cured. To predict the performance of any new formulation will require that thermal modeling and actual time/temperature profiles be measured on all formulations.
At this point in time, we recommend that the curing temperature for Cast Stone waste forms be kept as close to room temperature as possible until more detailed empirical studies can be performed. A key consideration will be the size of the Cast Stone waste package and whether any effort will be made to remove the heat generated during the hydration reactions that occur during the curing or hardening process. With proper consideration of internal waste form temperature versus time conditions, a suitable Cast Stone waste form should be achievable.
6.3.4 Waste Loading
In Section 2.6 and Table 2.14 and Table 2.15, we provide a discussion on waste loading. Sundaram et al. (2011) concluded that Cast Stone has a workability range from less than 1 hour for the most concentrated baseline simulant at an adjusted sodium concentration of 2.1 M (10 M unadjusted) to 5 to 6 hours for the more dilute simulants. They hypothesized that the optimum waste loading lies around 6-M sodium concentration (target), corresponding to 1.42-M corrected sodium concentration after adding DIW to the slurry. This is based on the workability range in addition to the general performance of Cast Stone. However, the salt waste loadings used in Sundaram et al. (2011) and Pierce et al. (2010) are about a factor of 10 lower (compare Table 2.14 and Table 2.15) than those attained by previous Cast Stone work at Hanford and those typically attained at Savannah River for Saltstone. The recent PNNL Cast Stone work described in Mattigod et al. (2011) shows that simulant S1 up to 6M Na was readily solidified, resulting in a waste loading of 13.5 wt% dry salt. These Cast Stone waste forms met the IDF desired compressive strength and leachability performance criteria. Thus, the Cast Stone workability problems encountered by Sundaram et al. (2011) have been rectified in the more recent testing.
CH2M HILL Hanford Group, Inc., produced Cast Stone waste forms using essentially the same dry blend mix of cement, fly ash, and BFS with an LAW simulant at waste loadings (total dissolved salts) of 8.2 to 24.2% by weight (see Lockrem et al. 2008). Duncan et al. (2008) and Cooke et al. (2009) achieved a waste loading (total weight of dry solids from the brine) of 28.9 wt% for a Basin 43 concentrated brine representative of a waste stream from the LERF. These details are shown in Table 2.15.
At Savannah River, the Saltstone dry blend has been successful at solidifying actual as well as various tank wastes with brine concentrations similar to the wastes at Hanford. Also included are projected secondary waste streams at loadings that range from 37.5 to 46.9 wt% or a dry salt basis of 9.8 to 13.3 wt% as shown in Table 2.15. Appendix C contains several tables with the chemical composition of the various waste simulants that have been successfully solidified at SRNL at the stated loadings.
6.21
We suggest that the total dissolved salt content of the liquid wastes is the key metric to describe waste loading and that the concentration of most individual cations and anions, excepting dissolved aluminum, ammonium, and sulfate, should not make a significant difference in the properties of the Cast Stone slurry and final hardened waste form. As mentioned, aluminum concentrations affect the time of set and the amount and timing of heat generation. Ammonium ions in the various liquid wastes are converted to ammonia gas that can volatilize off early in the Cast Stone set process, and this becomes a worker safety issue. The S4 simulant, which is a combination of caustic scrubber secondary waste and with the SBS waste, contains significant concentrations of ammonia. As discussed, the Cast Stone monoliths made with this waste simulant did evolve noticeable amounts of ammonia gas during the early stages of mixing and curing and may have been the cause of the cracked molds shown in Figure 4.2. There is sulfate in all of the projected Hanford secondary waste simulants, but the concentrations are much lower (0.01 to 0.09 M at 2 M Na based) than the Basin 42 evaporator wastes (1.4 to 3 M) that were successfully solidified by Cooke and Lockrem (2005) and Cooke et al. (2006a) with a combination of Portland cement, lime, and BFS. High concentrations of sulfate can lead to Cast Stone waste form expansion via the formation of ettringite and calcium monosulfate. The key issue is trying to get their formation to go to near completion before the final hardening of the Cast Stone so that expansion is accommodated while the waste form is still pliable. Based on the concentration of sulfate in simulants studied by past Hanford Cast Stone producers and in simulants used at Savannah River, the secondary waste simulants used by PNNL at 2-M Na loadings should not be an issue.
The aluminum contents in the Hanford secondary waste simulants may be causing more rapid set issues that could be producing some of the workability issues discussed in Sundaram et al. (2011). Past work at Hanford by Cooke, Lockrem, and others used simulants that did not contain any dissolved aluminum, and then once actual waste used, Basin 42 brine had very low dissolved aluminum concentrations. Thus, they may not have experienced any deleterious problems of excess heat generation and more rapid set problems. However, Harbour and colleagues have performed extensive studies of the impact of dissolved aluminum on Saltstone curing and set properties as discussed in Sections 5.1 and 6.3.3. The cited references should be consulted to understand how to deal with solidifying liquid wastes with high concentrations of dissolved aluminum in Cast Stone waste forms.
There is a limit to the mass of liquid waste that can be solidified with a set mass of Cast Stone dry blend ingredients. As mentioned in Section 2.6.1, at some point, the performance properties of the hardened Cast Stone start to degrade as more waste mass is solidified. Both physical and chemical properties of the hardened Cast Stone are negatively impacted as the masses of liquid wastes are increased beyond some point. If the liquid waste mass is processed by evaporation, the salt content increases, and at some point, the total dissolved solids that can be accommodated in the pore water trapped within the hardened grout negatively impacts the hydration reactions that form the C-S-H-gel structure of the Cast Stone. Besides changing the types of minerals that form, the salt impacts the physical sizes of pores, pore throats, and connectivity of the pores.
The impact of increased salt content, caused by evaporating LAW waste to ever increasing degrees, on the leachability of nitrate in Cast Stone was determined by Lockrem (2005). The results are discussed in Section 7.4.
Sugaya et al. (2008) also studied the loading impacts of sodium nitrate salts on cementitious waste forms. Both small and large-scale (up to 200 liters) grouts were prepared at different salt loadings to investigate the optimum waste form formulation. One-hundred percent OPC and a BFS/OPC mixture in a

6.22
ratio 70:30 were studied. In each case, a water-to-dry blend ratio was chosen. For each waste form, a series of different nitrate loadings were prepared: 30, 40, 50, 60, and 70 wt% NaNO3 (given as the percentage weight of sodium nitrate in the final product). In the cases of OPC and 70:30 BFS/OPC, bleed was present in all trials, with this bleed remaining after 4 or 5 days of curing. There was also a decrease in compressive strength observed with increasing nitrate salt loadings. In the case of OPC and BFS/OPC 70:30 cements, with a nitrate loading of 70 wt%, the compressive strength fell below the acceptance criterion of 10 MPa. The results from these studies demonstrate that nitrate waste that has been concentrated by evaporation of the water to a predetermined level can be successfully encapsulated up to a waste loading corresponding to 50 wt% sodium nitrate. It was also identified that high concentrations of bicarbonate ions in the liquid waste can have a detrimental effect on the strength of the cement encapsulated waste; however, provided this concentration is controlled, successful encapsulation of the effluent is still achieved. As the sodium bicarbonate concentration is increased, there is a significant reduction in the fluidity and compressive strength and an undesirable increase in the setting time for the cement. These results suggest that the NaHCO3 concentration within the sodium nitrate waste stream must be below 10 g/L (before evaporation) to achieve the required strength, fluidity, and setting time.
Harbour and Williams (2008b) define waste loading differently than proposed in this data package. They define waste loading as the volume of liquid waste divided by the volume of final hardened waste form. Their definition was used to calculate how many vaults would have to be built at Savannah River to accommodate the known volume of waste in single-shell tanks that needed to be grouted. In their report, they also discuss methods to optimize waste loading of various liquid wastes into the standard Saltstone dry blend mix.
7.1
7.0 Waste Acceptance Criteria
7.1 Void Space
None of the literature that was reviewed mentioned any problems with voids or heterogeneous layering in the laboratory or larger scale Cast Stone and Saltstone waste forms. Most likely all but disconnected small regions of trapped air can be avoided by complete mixing of the waste and dry ingredients until a very homogeneous and flowable slurry is attained before filling the waste containers.
7.2 Surface Dose Rate
Proposed dose-rate limits for wastes to be accepted into the IDF include a constraint that containers have surface dose rates less than or equal to 2 millisievert per hour (200 millirem per hour) at contact and less than 1 millisievert per hour (100 millirem per hour) at 30 centimeters (11.8 inches).1 As part of a conceptual design report for a Supplemental Treatment Unit to be added to ETF, a dose calculation was performed as input to the design of the facility (Koci 2005). The dose rate calculation considered liquid waste streams from WTP, supplemental treatment using bulk vitrification, and Basin 42. A 4-ft. × 4-ft. × 4-ft. concrete block with a specific density of 1.5 was assumed as the waste form. The specific density is conservative because more dense materials provide more shielding. There is no indication whether the calculation included a container for the waste form block. The highest dose rate was from radionuclides in the DB3 waste stream.
A dose rate of 1.25 millirem per hour (0.0125 millisievert per hour) was calculated at 1 inch from the block side, and 0.75 millirem per hour (7.5 microsievert per hour) was calculated at 1 foot from the side of the waste form block for the DB3 solidified waste. The ETF will not accept wastes for treatment with radionuclide concentrations above its design basis per administrative controls. Once treated and solidified in ETF, each final waste container cannot exceed the IDF dose rate limits constraints (see above).
7.3 Free Liquids
Lockrem et al. (2005) used a 2-M, sodium-based, secondary waste simulant solidified in the Cast Stone dry blends that varied in composition (12 formulations documented in Appendix B in Lockrem et al. 2005). None of the 12 formulations showed bleed water after 24 hours of curing. In most all the previous studies at Hanford and the recent Phase I and Phase II Cast Stone studies at PNNL, the laboratory scales have shown that bleed water is completely reabsorbed and used in the hydration reactions amongst the grout ingredients as curing surpasses a few days. At the end of the typical 28-d cure period, no bleed water has been noted in any of the studies cited in this data package.
Although most of the recipes used to fabricate Cast Stone and Saltstone waste forms have been easily modified to avoid free liquids (bleed water) after a few days of curing, there have been a few studies that show that bleed water formation can be an issue that is not readily predicted a priori or avoided without some study. Harbour et al. (2006b) studied the effects of curing Saltstone waste forms at elevated temperatures. The gel time for Saltstone made with a liquid waste simulant named Deliquification, 1 Burbank DA. 2005. Waste Acceptance Criteria for the Immobilized Low-Activity Waste Disposal Facility. RPP-8402 Rev. 1, CH2M HILL Hanford Group, Inc., Richland, Washington.

7.2
Dissolution and Adjustment (DDA) increased from 15 minutes at 10°C to 90 minutes at 35°C with most of the change occurring between 20°C and 30°C. The volume percent bleed water for these mixes increased from ~ 1% at 10°C curing to 13% curing at 35°C. However, for a different liquid waste simulant called Modular Caustic Side Solvent Extraction Unit (MCU), gel times decreased with increasing cure temperatures for mixes made using a different liquid waste simulant. In this case, the gel time decreased from 150 minutes at curing at 10°C to 20 minutes at curing at 38°C. Harbour et al. (2006b) concluded that gel times and volume percent bleed water are correlated such that the longer the gel time, the greater the amount of bleed water. If bleed water is observed in any future Cast Stone formulations, Harbour et al.’s relationship between gel time and bleed water can be tested, and modifications in slurry rheology can be made to correct the problem. As stated, aside from this one citation, the other Cast Stone and Saltstone literature did not note bleed water problems.
Angus et al. (2008) discuss various ways to control bleed water in waste forms, such as controlling the particle size of the dry blend ingredients, using superplasticizers, and using alternative cements, such as magnesium phosphate and calcium sulfoaluminate, that combine higher water binding capabilities with pore water chemistries likely to be more compatible than OPC with some waste streams. They also describe using 1H nuclear magnetic resonance (NMR) relaxometry to follow the changing distribution of water between capillary pores, gel pores, and hydrate phases during ageing of OPC-based cements. The technique has many advantages, including being non-invasive and non-destructive, so the same sample can be examined with time, unlike mercury porosimetry, which damages the microstructure being probed. In addition, NMR relaxometry can interrogate pore diameters below 5 nm.
7.4 Dangerous Waste Limitations
Lockrem et al. (2005) performed TCLP tests on Cast Stone waste forms made with the secondary waste simulant shown in Table 2.4, including simulant spiked with additional iodide and mercury. The report does not specify what concentrations of RCRA metals (aside from Hg that was added at 36.6 mg/L) were present in the secondary waste simulant used to prepare the Cast Stone waste forms. A total of 41 Cast Stone waste formulations many including three different concentrations of the four getters (silver zeolite, silver mordenite, Will Form, and bone char) were tested. The 41 Cast Stone waste forms were cured for 28 days before TCLP testing. In addition, 41 other Cast Stone waste forms that had first been subjected to 19-days of ANS-16.1 DIW leach testing were also subjected to TCLP testing. All of the Cast Stone waste form’s TCLP leachates were below one of the acceptance levels for inorganic elements being used at the time of this work and attributed to WACs (see third columns in Table 7.2 and Table 7.3). However, it appears that the current IDF waste acceptance criteria uses the more stringent UTS found in 40 CFR 268.48, which for inorganic metals are shown in Table 7.1 and also listed in the second column in Table 7.2 and Table 7.3. More details on the TCLP leach results for the 82 different Cast Stone specimens are presented in Appendix F in Lockrem et al. (2005).
Most all of the Lockrem et al. (2005) Cast Stone waste forms made with the iodide-rich secondary waste simulant with and without getters failed the UTS criteria for Sb, Ba, Cd, Cr, Hg, Ni, Ag, and Zn leachates. Seven of 41 failed As and 17 of 41 failed Se leachate UTS criteria. The Cast Stone TCLP leachates for Be, Pb, and Tl passed the UTS criteria. Interestingly, after 19-days of water leach testing, Cast Stone monoliths that were crushed and TCLP leach tested did show some lowered concentrations for several metals. After water leaching for 19 days, there was no change in the Sb, Be, Cd, Cr, Pb, Hg, Ag, and Tl leachates. However, after 19 days of water leaching, the As concentrations dropped from 7 to

7.3
15 mg/L to all below <0.4 mg/L so that they now passed UTS criteria for As. After 19 days leaching, the Ba TCLP leachate concentrations dropped from 250 to 460 mg/L to <10 mg/L and also passed the UTS criteria. After water leaching, the Se and Ag TCLP leachate concentrations dropped in comparison to leachates from waste forms directly tested after curing, but they still failed UTS. After water leaching, Zn concentrations in TCLP dropped, and some of the waste forms now passed the UTS criteria. These results are tabulated in Table 7.4 along with many other TCLP results from the early Hanford Cast Stone work, and the specific leachate concentrations are shown in Appendix F of Lockrem et al. (2005).
Table 7.1. UTS Maximum Permissible Concentrations for TCLP Leachates
Element Toxicity Characteristic Leaching
Procedure Level (mg/L) Antimony 1.15 Arsenic 5.0 Barium 21 Beryllium 1.22 Cadmium 0.11 Chromium 0.60 Lead 0.75 Mercury 0.025 Nickel 11.0 Selenium 5.7 Silver 0.14 Thallium 0.20 Vanadium 1.6 Zinc 4.3
Table 7.2. TCLP Results for Basin 42 Brine Simulants (spiked with trace metals)
Concentration (mg/L)
40 CFR 268.48, EPA (mg/L)
WAC DW (mg/L)
Basin 42 (mg/L) 25 wt% Total Solids
Concentration 40 wt% Total Solids
Concentration Beryllium <1.22 0.000459 0.00113 Chromium <0.60 5.0 0.632 0.725 Nickel <11.0 0.0989 0.206 Zinc <4.3 0.0525 0.0755 Arsenic <5.0 5.0 0.247 1.17 Selenium <5.7 1.0 0.0402 0.119 Silver <0.14 5.0 0.00322 0.000756 Cadmium <0.11 1.0 0.191 0.113 Antimony <1.15 0.001571 0.000132 Barium <21.0 100.0 0.119 0.0887 Mercury <0.025 0.2 0.0034 0.00284 Thallium <0.20 0.000414 0.000137 Lead <0.75 5.0 0.0471 0.32 Uranium 0.00165 0.0119 Cesium 0.0408 0.00764 Taken from Cooke and Lockrem (2005) Appendix A, Table 13.
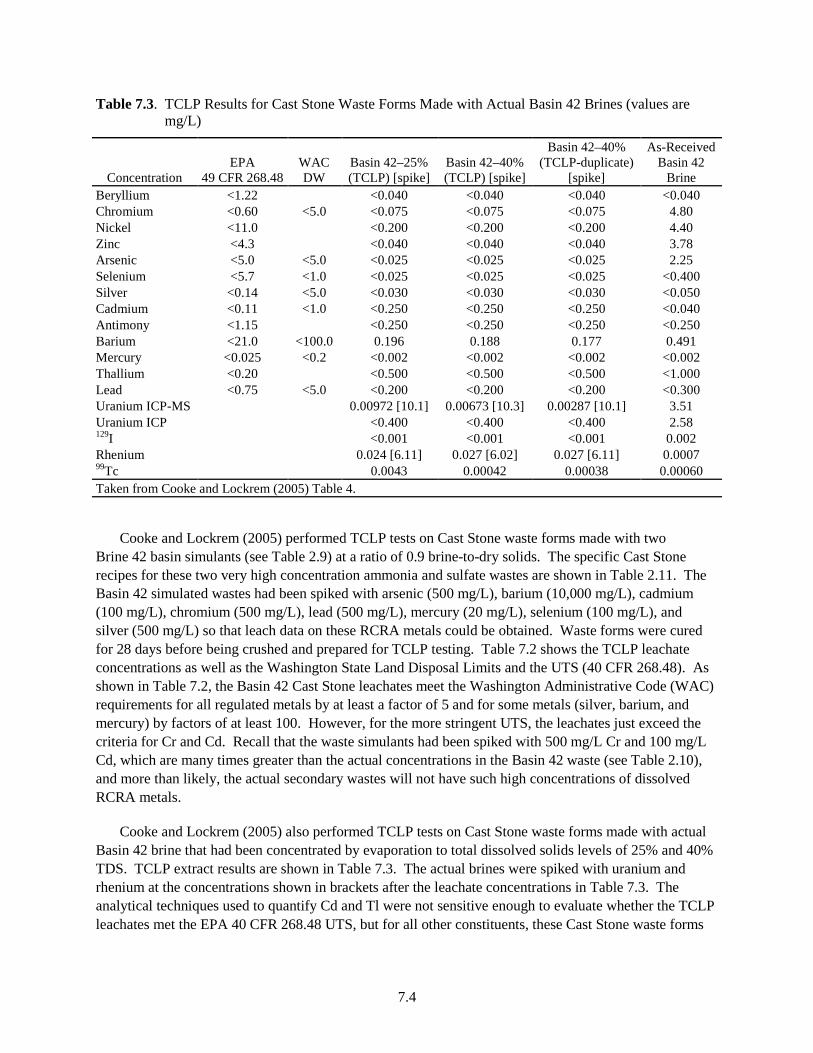
7.4
Table 7.3. TCLP Results for Cast Stone Waste Forms Made with Actual Basin 42 Brines (values are mg/L)
Concentration EPA
49 CFR 268.48 WAC DW
Basin 42–25% (TCLP) [spike]
Basin 42–40% (TCLP) [spike]
Basin 42–40% (TCLP-duplicate)
[spike]
As-Received Basin 42
Brine Beryllium <1.22 <0.040 <0.040 <0.040 <0.040 Chromium <0.60 <5.0 <0.075 <0.075 <0.075 4.80 Nickel <11.0 <0.200 <0.200 <0.200 4.40 Zinc <4.3 <0.040 <0.040 <0.040 3.78 Arsenic <5.0 <5.0 <0.025 <0.025 <0.025 2.25 Selenium <5.7 <1.0 <0.025 <0.025 <0.025 <0.400 Silver <0.14 <5.0 <0.030 <0.030 <0.030 <0.050 Cadmium <0.11 <1.0 <0.250 <0.250 <0.250 <0.040 Antimony <1.15 <0.250 <0.250 <0.250 <0.250 Barium <21.0 <100.0 0.196 0.188 0.177 0.491 Mercury <0.025 <0.2 <0.002 <0.002 <0.002 <0.002 Thallium <0.20 <0.500 <0.500 <0.500 <1.000 Lead <0.75 <5.0 <0.200 <0.200 <0.200 <0.300 Uranium ICP-MS 0.00972 [10.1] 0.00673 [10.3] 0.00287 [10.1] 3.51 Uranium ICP <0.400 <0.400 <0.400 2.58 129I <0.001 <0.001 <0.001 0.002 Rhenium 0.024 [6.11] 0.027 [6.02] 0.027 [6.11] 0.0007 99Tc 0.0043 0.00042 0.00038 0.00060 Taken from Cooke and Lockrem (2005) Table 4.
Cooke and Lockrem (2005) performed TCLP tests on Cast Stone waste forms made with two Brine 42 basin simulants (see Table 2.9) at a ratio of 0.9 brine-to-dry solids. The specific Cast Stone recipes for these two very high concentration ammonia and sulfate wastes are shown in Table 2.11. The Basin 42 simulated wastes had been spiked with arsenic (500 mg/L), barium (10,000 mg/L), cadmium (100 mg/L), chromium (500 mg/L), lead (500 mg/L), mercury (20 mg/L), selenium (100 mg/L), and silver (500 mg/L) so that leach data on these RCRA metals could be obtained. Waste forms were cured for 28 days before being crushed and prepared for TCLP testing. Table 7.2 shows the TCLP leachate concentrations as well as the Washington State Land Disposal Limits and the UTS (40 CFR 268.48). As shown in Table 7.2, the Basin 42 Cast Stone leachates meet the Washington Administrative Code (WAC) requirements for all regulated metals by at least a factor of 5 and for some metals (silver, barium, and mercury) by factors of at least 100. However, for the more stringent UTS, the leachates just exceed the criteria for Cr and Cd. Recall that the waste simulants had been spiked with 500 mg/L Cr and 100 mg/L Cd, which are many times greater than the actual concentrations in the Basin 42 waste (see Table 2.10), and more than likely, the actual secondary wastes will not have such high concentrations of dissolved RCRA metals.
Cooke and Lockrem (2005) also performed TCLP tests on Cast Stone waste forms made with actual Basin 42 brine that had been concentrated by evaporation to total dissolved solids levels of 25% and 40% TDS. TCLP extract results are shown in Table 7.3. The actual brines were spiked with uranium and rhenium at the concentrations shown in brackets after the leachate concentrations in Table 7.3. The analytical techniques used to quantify Cd and Tl were not sensitive enough to evaluate whether the TCLP leachates met the EPA 40 CFR 268.48 UTS, but for all other constituents, these Cast Stone waste forms

7.
Table 7.4. TCLP Results for Early Hanford Cast Stone
Waste Form
Waste Type/ Loading
Actual waste/ Simulant/Spikes Test Method Component
Leachate Concentration
(µg/L) UTS Limit
(µg/L) Reference Cast Stone (with and without 4 getters)
Secondary Waste Simulant (see Table 2.4)
Simulant/I, Hg TCLP (extractant #2; highest conc acetic acid)
All mixes (41) and all I and Hg loadings with and without I getters passed WDOE acceptance values
See Appendix F of Lockrem et al. (2005) for specific concentrations
Most all waste forms failed Sb, Ba, Cd, Cr, Hg, Ni, Ag, and Zn. 7 of 41 failed As and 17 of 41 failed Se. Appendix F of reference has details. Be, Pb, and Tl passed.
Lockrem et al. (2005)
Cast Stone (with and without 4 getters) After 19 days of water leaching in ANS-16.1 tests.
Secondary Waste Simulant (see Table 2.4)
Simulant/I, Hg TCLP (extractant #2; highest conc acetic acid)
All mixes (41) and all I and Hg loadings with and without I getters passed WDOE acceptance values
See Appendix F of Lockrem et al. (2005) For specific concentrations
After water leaching for 19 days: No change in Sb, Be, Cd, Cr, Pb, Hg, Ag, Tl. After 19 days water leaching, As concentrations dropped from 7 to 15 mg/L to all below <0.4 mg/L so passed UTS. After 19 days leaching Ba TCLP leachate concentrations dropped from 250–460 mg/L to <10 mg/L so passed UTS. After water leaching, Se and Ag concentrations dropped but still failed UTS. After water leaching, Zn concentrations in TCLP dropped and some passed UTS.
Lockrem et al. (2005)
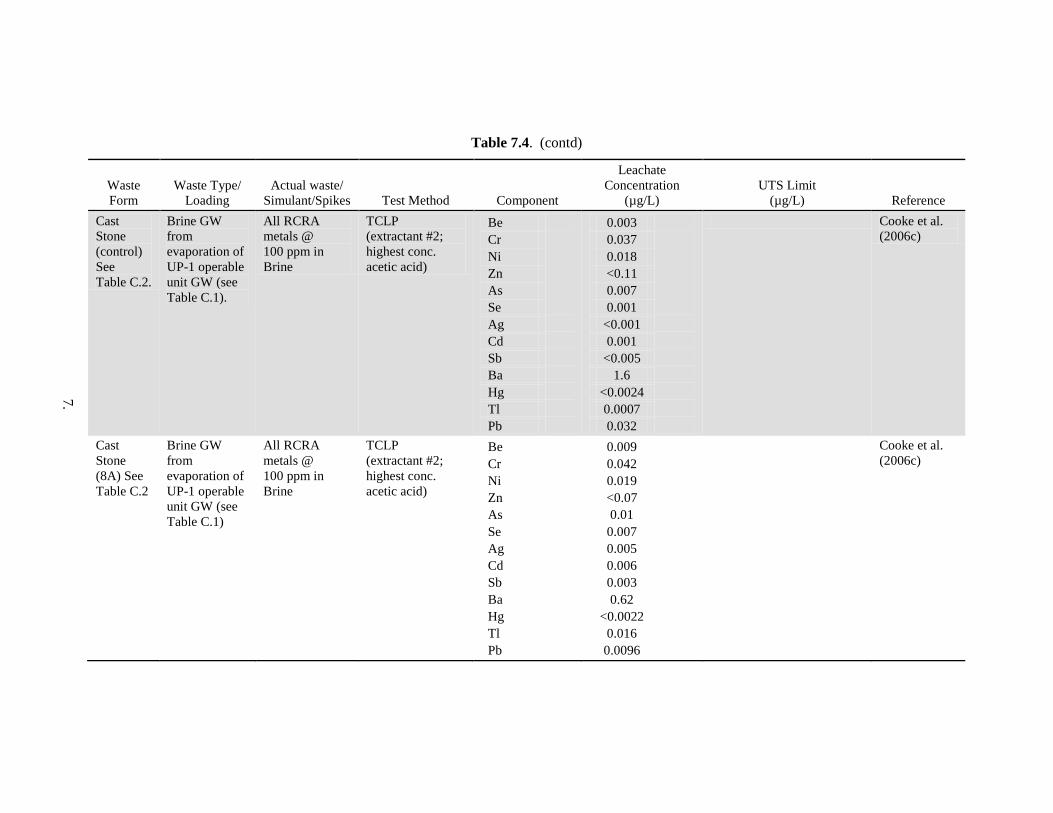
7.
Table 7.4. (contd)
Waste Form
Waste Type/ Loading
Actual waste/ Simulant/Spikes Test Method Component
Leachate Concentration
(µg/L) UTS Limit
(µg/L) Reference Cast Stone (control) See Table C.2.
Brine GW from evaporation of UP-1 operable unit GW (see Table C.1).
All RCRA metals @ 100 ppm in Brine
TCLP (extractant #2; highest conc. acetic acid)
Be Cr Ni Zn As Se Ag Cd Sb Ba Hg Tl Pb
0.003 0.037 0.018 <0.11 0.007 0.001
<0.001 0.001
<0.005 1.6
<0.0024 0.0007 0.032
Cooke et al. (2006c)
Cast Stone (8A) See Table C.2
Brine GW from evaporation of UP-1 operable unit GW (see Table C.1)
All RCRA metals @ 100 ppm in Brine
TCLP (extractant #2; highest conc. acetic acid)
Be Cr Ni Zn As Se Ag Cd Sb Ba Hg Tl Pb
0.009 0.042 0.019 <0.07 0.01
0.007 0.005 0.006 0.003 0.62
<0.0022 0.016 0.0096
Cooke et al. (2006c)
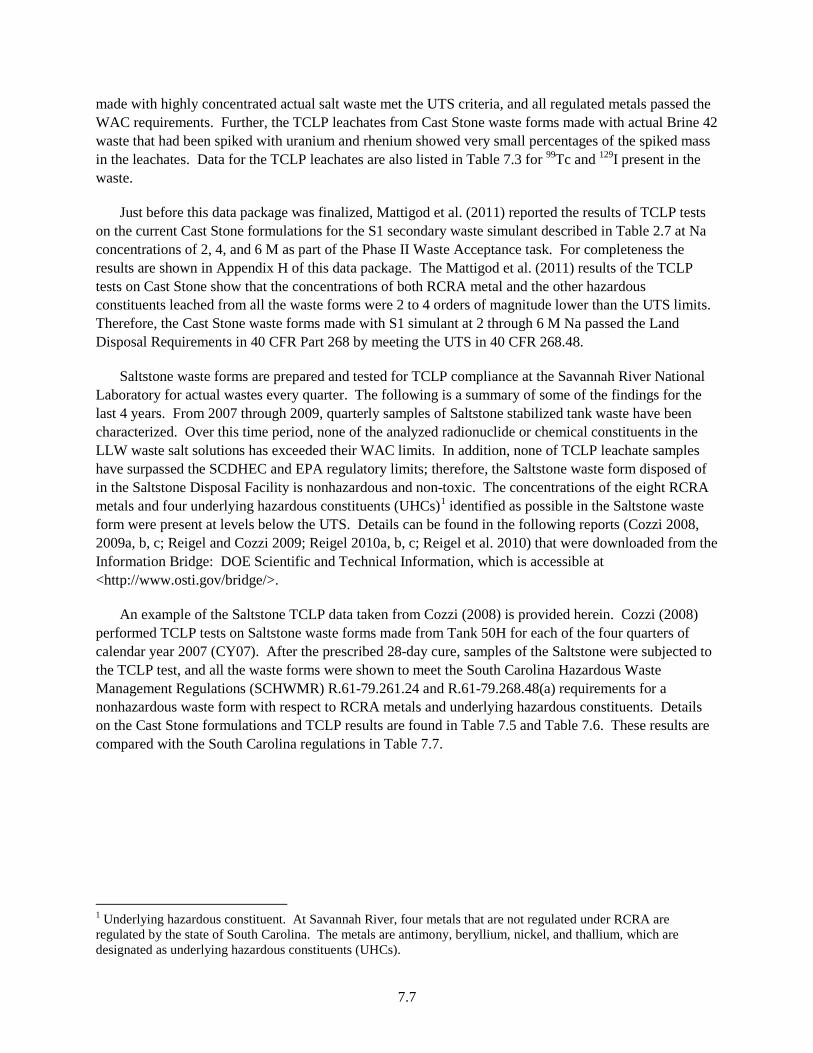
7.7
made with highly concentrated actual salt waste met the UTS criteria, and all regulated metals passed the WAC requirements. Further, the TCLP leachates from Cast Stone waste forms made with actual Brine 42 waste that had been spiked with uranium and rhenium showed very small percentages of the spiked mass in the leachates. Data for the TCLP leachates are also listed in Table 7.3 for 99Tc and 129I present in the waste.
Just before this data package was finalized, Mattigod et al. (2011) reported the results of TCLP tests on the current Cast Stone formulations for the S1 secondary waste simulant described in Table 2.7 at Na concentrations of 2, 4, and 6 M as part of the Phase II Waste Acceptance task. For completeness the results are shown in Appendix H of this data package. The Mattigod et al. (2011) results of the TCLP tests on Cast Stone show that the concentrations of both RCRA metal and the other hazardous constituents leached from all the waste forms were 2 to 4 orders of magnitude lower than the UTS limits. Therefore, the Cast Stone waste forms made with S1 simulant at 2 through 6 M Na passed the Land Disposal Requirements in 40 CFR Part 268 by meeting the UTS in 40 CFR 268.48.
Saltstone waste forms are prepared and tested for TCLP compliance at the Savannah River National Laboratory for actual wastes every quarter. The following is a summary of some of the findings for the last 4 years. From 2007 through 2009, quarterly samples of Saltstone stabilized tank waste have been characterized. Over this time period, none of the analyzed radionuclide or chemical constituents in the LLW waste salt solutions has exceeded their WAC limits. In addition, none of TCLP leachate samples have surpassed the SCDHEC and EPA regulatory limits; therefore, the Saltstone waste form disposed of in the Saltstone Disposal Facility is nonhazardous and non-toxic. The concentrations of the eight RCRA metals and four underlying hazardous constituents (UHCs)1 identified as possible in the Saltstone waste form were present at levels below the UTS. Details can be found in the following reports (Cozzi 2008, 2009a, b, c; Reigel and Cozzi 2009; Reigel 2010a, b, c; Reigel et al. 2010) that were downloaded from the Information Bridge: DOE Scientific and Technical Information, which is accessible at <http://www.osti.gov/bridge/>.
An example of the Saltstone TCLP data taken from Cozzi (2008) is provided herein. Cozzi (2008) performed TCLP tests on Saltstone waste forms made from Tank 50H for each of the four quarters of calendar year 2007 (CY07). After the prescribed 28-day cure, samples of the Saltstone were subjected to the TCLP test, and all the waste forms were shown to meet the South Carolina Hazardous Waste Management Regulations (SCHWMR) R.61-79.261.24 and R.61-79.268.48(a) requirements for a nonhazardous waste form with respect to RCRA metals and underlying hazardous constituents. Details on the Cast Stone formulations and TCLP results are found in Table 7.5 and Table 7.6. These results are compared with the South Carolina regulations in Table 7.7.
1 Underlying hazardous constituent. At Savannah River, four metals that are not regulated under RCRA are regulated by the state of South Carolina. The metals are antimony, beryllium, nickel, and thallium, which are designated as underlying hazardous constituents (UHCs).

7.8
Table 7.5. Preparation of TCLP Samples (Water = Tank liquids; Pre-mix = Saltstone dry blend)
Parameter 1Q07 2Q07 3Q07 4Q07 Water-to-premix ratio 0.63 0.63 0.62 0.62 Set retarder g/g premix (Daratard 17) gal/ton premix
0.27 0.53
0.27 0.53
0.27 0.53
0.19 0.37
Defoamer g/g premix (Clean Air 100) gal/ton premix
0.14 1.35
0.14 0.35
0.066 0.16
0.066 0.16
Table 7.6. TCLP Results for Saltstone Waste Forms made with Actual Tank Waste CY 2007
Methods
Sample Limits (mg/L)
Sample Limits (mg/L) Sample Results (mg/L)
SRS ID — — — 1Q07 2Q07 3Q07 4Q07 B7W ID — DL QL 0803011-01 0803011-02 0803011-03 0803011-04
As 3015.A, 6020A 0.100 5.556 16.8 15.0 18.1 16.5 Ba 3015.A, 6020A 0.439 55.556 168 186 177 187 Cd 3015.A, 6020A 0.111 5.556 U0.111 U0.111 U0.111 U0.111 Cr 3015.A, 6020A 0.306 11.111 6.8 4.9 5.6 5.5 Pb 3015.A, 6020A 0.483 5.556 2.6 U0.483 U0.483 U0.483 Hg 7470A 0.068 0.200 2.510 6.740 3.920 5.000 Se 3015.A, 6020A 0.244 27.778 8.9 8.6 10.3 7.9 Ag 3015.A, 6020A 0.061 5.556 U0.061 U0.061 U0.061 U0.061 Be 3015.A, 6020A 0.156 5.556 U0.156 U0.156 U0.156 U0.156 Ni 3015.A, 6020A 1.6 5.556 3.7 3.9 3.0 3.3 Tl 3015.A, 6020A 0.206 5.556 B0.483 3.4 B1.4 B0.817
U Final concentration of the analyte was found to be below the DL. B Analyte is present at a concentration above the DL but less than the QL. DL The limit of detection is the smallest amount that can be measured by a specific instrument. A figure of merit
when discussing eh limit of detection is the signal-to-noise ratio (SNR), which is the amount of signal detected by that instrument at the detection limit, compared to what it would detect from the “blank.”
QL The analyte quantification limit and is defined as is the limit at which we can reasonably tell the difference between two different values. It appears that SRNL is showing that matrix issues have forced rather high dilutions of the TCLP leachate such that the QL is much larger than one common practice of settling the QL to equal 5*DL.
The pH and corrosivity of Cast Stone, Saltstone, or any cementitious grout were seldom discussed in any of the reports reviewed, but it is well known from the water leach testing that the pore waters and leachates from freshly cured waste forms are highly caustic with pH values greater than 12 to as high as 13 when highly caustic liquid wastes have been solidified. As the cementitious waste forms age and weather, the pore water pH slowly drops and after thousands of years approaches a slightly alkaline value consistent with being in equilibrium with either calcite (pH = 8.3) or quartz with pH values near neutral (7 to 7.5). Figure 7.1 shows a schematic of the evolution of the pore water pH of cementitious waste forms taken from Krupka and Serne (1996). The slow neutralization process has been well documented in cement literature (see also Taylor 1997 and Wang et al. 2009).
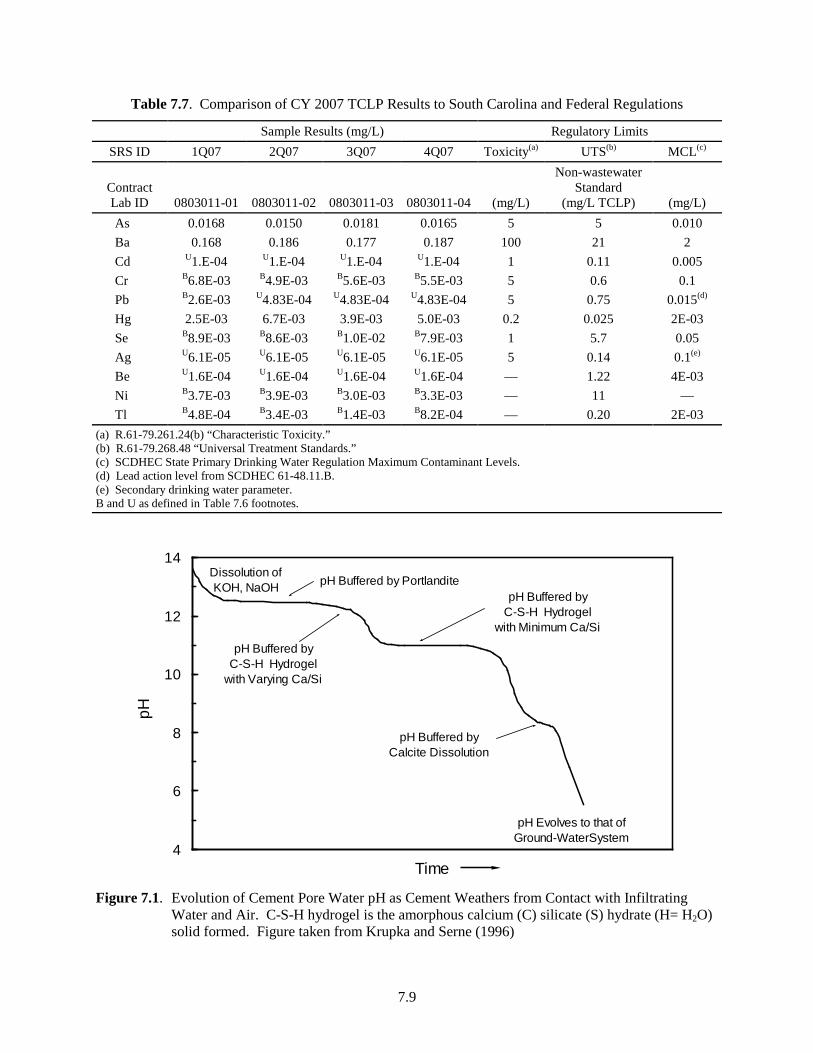
7.9
Table 7.7. Comparison of CY 2007 TCLP Results to South Carolina and Federal Regulations
Sample Results (mg/L) Regulatory Limits SRS ID 1Q07 2Q07 3Q07 4Q07 Toxicity(a) UTS(b) MCL(c)
Contract Lab ID 0803011-01 0803011-02 0803011-03 0803011-04 (mg/L)
Non-wastewater Standard
(mg/L TCLP) (mg/L) As 0.0168 0.0150 0.0181 0.0165 5 5 0.010 Ba 0.168 0.186 0.177 0.187 100 21 2 Cd U1.E-04 U1.E-04 U1.E-04 U1.E-04 1 0.11 0.005 Cr B6.8E-03 B4.9E-03 B5.6E-03 B5.5E-03 5 0.6 0.1 Pb B2.6E-03 U4.83E-04 U4.83E-04 U4.83E-04 5 0.75 0.015(d) Hg 2.5E-03 6.7E-03 3.9E-03 5.0E-03 0.2 0.025 2E-03 Se B8.9E-03 B8.6E-03 B1.0E-02 B7.9E-03 1 5.7 0.05 Ag U6.1E-05 U6.1E-05 U6.1E-05 U6.1E-05 5 0.14 0.1(e) Be U1.6E-04 U1.6E-04 U1.6E-04 U1.6E-04 — 1.22 4E-03 Ni B3.7E-03 B3.9E-03 B3.0E-03 B3.3E-03 — 11 — Tl B4.8E-04 B3.4E-03 B1.4E-03 B8.2E-04 — 0.20 2E-03
(a) R.61-79.261.24(b) “Characteristic Toxicity.” (b) R.61-79.268.48 “Universal Treatment Standards.” (c) SCDHEC State Primary Drinking Water Regulation Maximum Contaminant Levels. (d) Lead action level from SCDHEC 61-48.11.B. (e) Secondary drinking water parameter. B and U as defined in Table 7.6 footnotes.
4
6
8
10
12
14
Time
pH
Dissolution ofKOH, NaOH pH Buffered by Portlandite
pH Buffered byC-S-H Hydrogel
with Varying Ca/Si
pH Buffered byCalcite Dissolution
pH Evolves to that of Ground-WaterSystem
pH Buffered byC-S-H Hydrogel
with Minimum Ca/Si
Figure 7.1. Evolution of Cement Pore Water pH as Cement Weathers from Contact with Infiltrating
Water and Air. C-S-H hydrogel is the amorphous calcium (C) silicate (S) hydrate (H= H2O) solid formed. Figure taken from Krupka and Serne (1996)

7.10
The pH of the various water leach tests for the Cast Stone in both Phase I and II were reported in Pierce et al. (2010) and Sundaram et al. (2011). Upon crushing the Cast Stone waste forms and subjecting pieces to DIW for 24 h in the EPA Method 1316 test, the pH values ranged from 12.1 to 12.9. The DIW leachates from the Cast Stone monoliths in the EPA Method 1315, intermittent-solution, exchange tests had pH values that ranged from 10.6 to 10.8 in the first few leachates that were in contact with the monoliths for a few hours to 1 day. The leachate pH values peaked at values between 11.6 and 11.8 for leachates between 7 and 14 cumulative days of contact and then dropped to between 11.0 and 11.6 for leachates that were in contact with the monoliths after 63 cumulative days. One potential issue arises from these observed high pH values for crushed Cast Stone in the Method 1316 tests. Based on the EPA definition of a corrosive waste: “corrosive hazardous wastes are either liquids that corrode steel greater than a quarter inch per year or aqueous wastes with a pH of 2.0 or less or 12.5 or more.” Some might question whether the Cast Stone waste form would be labeled a corrosive hazardous waste. However, only the leachates from crushed, freshly cured Cast Stone exhibit pH values near or greater than 12.5. If the Cast Stone waste forms remain intact and weather slowly, especially in the presence of carbon dioxide present in the vadose zone air, the leachates released by the Cast Stone will be below pH 12.5.
7.5 Compressive Strength
Sundaram et al. (2011) determined the compressive strength of Cast Stone monoliths that were 2 in. diameter × 4 in. long made with the 8 waste simulants shown in Table 2.7 and Table 2.8. Average compressive strengths of the cured (41 days) Cast Stone waste form monoliths were in the range of 1330 to 2240 psi (9.17 to 15.44 MPa), well above the 500 psi (3.45 MPa) minimum expected for cement-based waste forms (see Figure 7.2). There were no significant trends in the compressive strength with changes in simulant composition S1, S2, S3, and S4 all used at 2 M Na. Therefore, the difference in compressive strength between Cast Stone monoliths made with the various secondary waste simulants at their overall 2-M sodium concentrations are not great enough to be used as a criterion to rank the performance of the Cast Stone specimens. Further, the compressive strengths of the Cast Stone monoliths prepared with simulant S1 at various Na molarities are shown in Figure 7.3. The compressive strength for S1 monoliths was maximized at the 4-M-Na solution, and the compressive strength started to decrease as the simulant solution concentration increased above 4 M Na. However, it should be noted that a lower compressive strength of Cast Stone monoliths made with the S1-6-M, 8-M, and 10-M solutions is mainly attributed to the excess water added to make the slurries workable and not to the salt content which actually did not vary over a very large range (see Table 2.14). Mattigod et al. (2011) present compressive strength data for Cast Stone waste forms made with S1 simulant at Na concentrations of 2, 4, and 6 M with no added water that all meet the minimum compressive strength of 3.45 Mpa.
The 41 different Cast Stone waste forms generated with the secondary waste simulant in Table 2.4 were tested for compressive strength by Lockrem et al. (2005). They estimated the compressive strengths at better than 100 psi, as exemplified by “scratch” testing. These waste forms also did not show any signs of deterioration after 19 days of immersion in DIW during the ANS-16.1 testing.

7.11
Figure 7.2. Changes in Compressive Strength for Cast Stone Made with Simulants S1 to S4, all at a
Nominal 2 M Na Starting Concentration
Figure 7.3. Changes in Compressive Strength for Cast Stone Made with Simulants S1 at Various Na Starting Concentrations
The high ammonium-sulfate-hydroxide Basin 42 simulant (at both 25 and 40% solids [see Table 2.4])
was solidified into a mixture of Cast Stone dry reagents (cement, fly ash, granulated BFS) and SECAR

7.12
511 (calcium aluminate). The mix of dry solids to Basin 42 waste simulant was varied over a range of ratios (10 recipes for the 25% solids simulant and 17 recipes for the 40% solids simulant). The waste forms that showed the best workability, low bleed water, and adequate compressive strengths had a waste brine-to-dry blend ratio of 0.9. The compressive strength of the standard 2-in.-diameter × 4-in.-length monoliths cured for 28 days are shown in Table 7.8. The compressive strength values shown in Table 7.8 for the Cast Stone waste forms made with Brine 42 at 25% waste solids did not have compressive strengths above 500 psi. Interestingly, the Basin 42 brine simulant with the larger amount of dissolved salts (40%) created Cast Stone waste monoliths with appreciably higher compressive strengths than the Basin 42 brine simulant with lower dissolved salts (25%). This would imply that Basin 42 waste could be concentrated by evaporation from its natural condition of about 25 wt% dissolved salts up to 40% dissolved salts before solidification with an improvement in physical strength.
The compressive strength of LAW simulant Cast Stone waste forms showed a complicated relationship with liquid waste salt loading. The compressive strength of waste forms increased (from 2000 to 4760 psi) as the loading increased from 6.5 to 13.2 wt% and then decreased (from 4760 to 3220 psi) as the waste loading increased from 13.2 to 24.2 wt%. Thus, at some point, the dry salt waste loading also starts to decrease the compressive strength of Cast Stone. However, the compressive strengths for the LAW waste forms very easily meet the IDF compressive strength criteria of 500 psi at all loadings tested (Lockrem 2005).
Compressive strength measurements on Saltstone waste forms made with various liquid waste simulants also show compressive strengths well above the 500 psi minimum criteria set for waste form disposal in the IDF. Representative compressive strength data for the Savannah River Saltstone waste forms are shown at the bottom of Table 7.8. For example, Dixon et al. (2008) created Saltstone cubes with the Savannah River three-component dry blend (see Table C.9) and three different liquid waste simulants (see Tables C.6 through C.8), and after curing/aging, the cubes were subjected to compressive strength testing. The liquid waste simulants contain high concentrations of sodium (3.5 to 5.7 M), aluminum (0.05 to 0.1 M) and various anions (hydroxide, nitrate, nitrite, carbonate, sulfate, and phosphate). In general, these liquid wastes are similar to the Hanford secondary waste stream simulants, excepting the aluminum concentrations. Thus, we feel that the compressive strength and other physical properties that were measured (saturated hydraulic conductivity, moisture retention, porosity, particle density, and dry bulk density) should be similar to the Cast Stone waste forms created with Hanford secondary waste simulants. The compressive strength data measured by Dixon et al. (2008) are shown in Table 7.8. The values range between 800 and 1450 psi. There is an increase in compressive strength as the cube-shaped monolith curing extended from 14 days to 56 days or for one waste simulant to 90 days. It is quite common to observe increasing compressive strength in Cast Stone/Saltstone as curing or aging is extended for tens to a few hundred days (see, for example, the compressive strength curve shown in Figure 7.4 taken form Harbour et al. (2007a). The cause is the continued slow hydration reactions forming more interconnected gel minerals. Stated differently for emphasis, the time dependence of the compressive strength and other physical properties correlates well with the heat of hydration, demonstrating the role of hydration reactions in determining the properties (physical as well as contaminant leachability) of Saltstone/Cast Stone.
1 SECAR 51 is a calcium aluminate hydraulic binder that is used to speed up the initial set of Portland cement from hours to minutes. It has an oxide composition of ≥50% Al2O3, ≤39.5% CaO and ≤6.0% SiO2 and mineralogically is dominated by monocalcium aluminate (CA), with minor amounts of C12A7, C2AS, and CT. Vendor is LaFarge Aluminates, Inc., Chesapeake, Virginia.
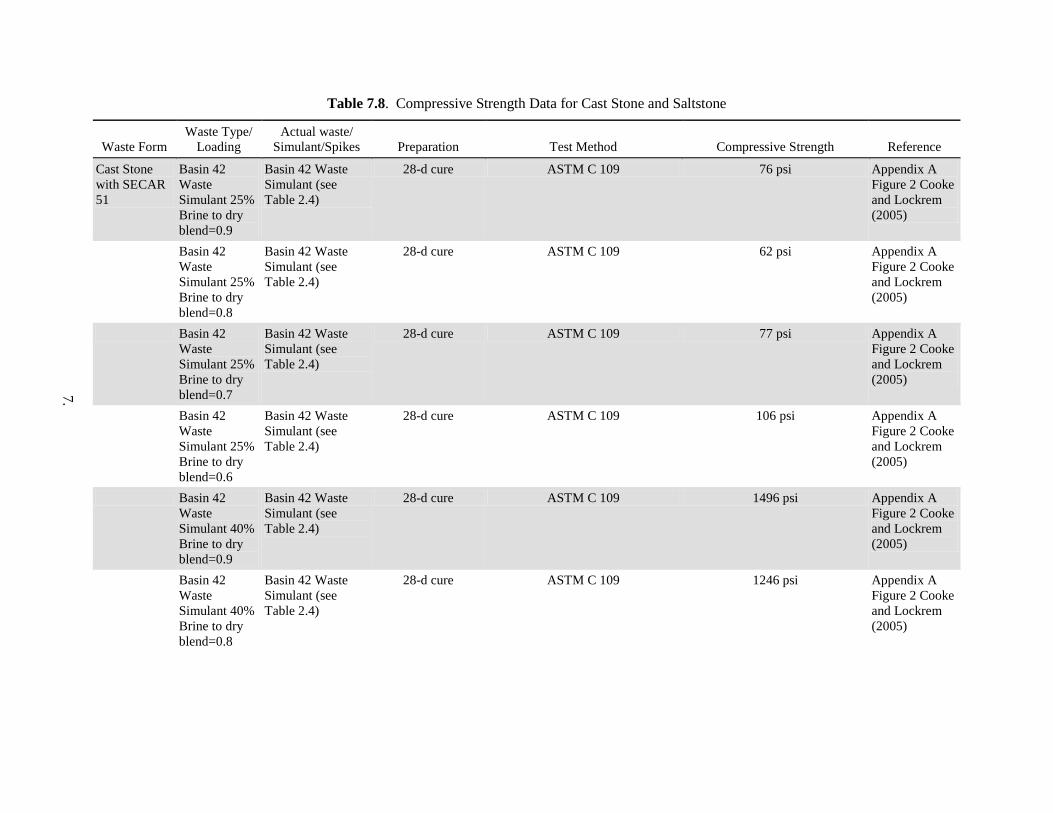
7.
Table 7.8. Compressive Strength Data for Cast Stone and Saltstone
Waste Form Waste Type/
Loading Actual waste/
Simulant/Spikes Preparation Test Method Compressive Strength Reference
Cast Stone with SECAR 51
Basin 42 Waste Simulant 25% Brine to dry blend=0.9
Basin 42 Waste Simulant (see Table 2.4)
28-d cure ASTM C 109 76 psi Appendix A Figure 2 Cooke and Lockrem (2005)
Basin 42 Waste Simulant 25% Brine to dry blend=0.8
Basin 42 Waste Simulant (see Table 2.4)
28-d cure ASTM C 109 62 psi Appendix A Figure 2 Cooke and Lockrem (2005)
Basin 42 Waste Simulant 25% Brine to dry blend=0.7
Basin 42 Waste Simulant (see Table 2.4)
28-d cure ASTM C 109 77 psi Appendix A Figure 2 Cooke and Lockrem (2005)
Basin 42 Waste Simulant 25% Brine to dry blend=0.6
Basin 42 Waste Simulant (see Table 2.4)
28-d cure ASTM C 109 106 psi Appendix A Figure 2 Cooke and Lockrem (2005)
Basin 42 Waste Simulant 40% Brine to dry blend=0.9
Basin 42 Waste Simulant (see Table 2.4)
28-d cure ASTM C 109 1496 psi Appendix A Figure 2 Cooke and Lockrem (2005)
Basin 42 Waste Simulant 40% Brine to dry blend=0.8
Basin 42 Waste Simulant (see Table 2.4)
28-d cure ASTM C 109 1246 psi Appendix A Figure 2 Cooke and Lockrem (2005)
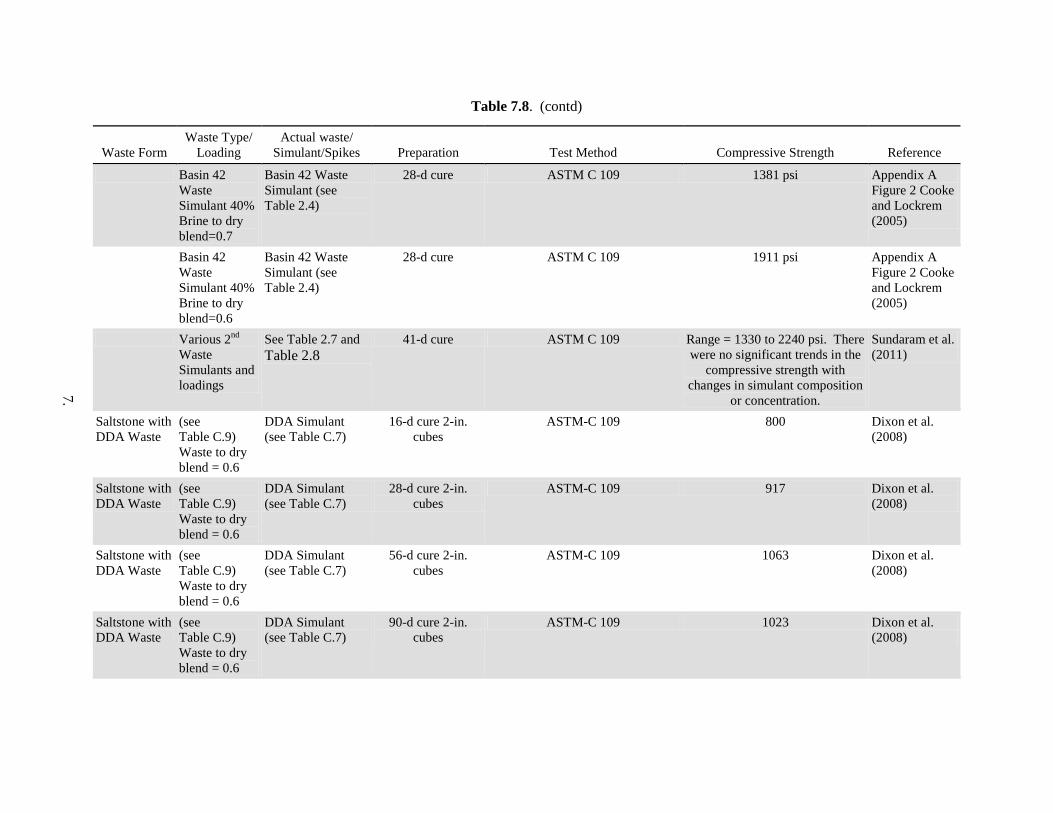
7.
Table 7.8. (contd)
Waste Form Waste Type/
Loading Actual waste/
Simulant/Spikes Preparation Test Method Compressive Strength Reference
Basin 42 Waste Simulant 40% Brine to dry blend=0.7
Basin 42 Waste Simulant (see Table 2.4)
28-d cure ASTM C 109 1381 psi Appendix A Figure 2 Cooke and Lockrem (2005)
Basin 42 Waste Simulant 40% Brine to dry blend=0.6
Basin 42 Waste Simulant (see Table 2.4)
28-d cure ASTM C 109 1911 psi Appendix A Figure 2 Cooke and Lockrem (2005)
Various 2nd Waste Simulants and loadings
See Table 2.7 and Table 2.8
41-d cure ASTM C 109 Range = 1330 to 2240 psi. There were no significant trends in the
compressive strength with changes in simulant composition
or concentration.
Sundaram et al. (2011)
Saltstone with DDA Waste
(see Table C.9) Waste to dry blend = 0.6
DDA Simulant (see Table C.7)
16-d cure 2-in. cubes
ASTM-C 109 800 Dixon et al. (2008)
Saltstone with DDA Waste
(see Table C.9) Waste to dry blend = 0.6
DDA Simulant (see Table C.7)
28-d cure 2-in. cubes
ASTM-C 109 917 Dixon et al. (2008)
Saltstone with DDA Waste
(see Table C.9) Waste to dry blend = 0.6
DDA Simulant (see Table C.7)
56-d cure 2-in. cubes
ASTM-C 109 1063 Dixon et al. (2008)
Saltstone with DDA Waste
(see Table C.9) Waste to dry blend = 0.6
DDA Simulant (see Table C.7)
90-d cure 2-in. cubes
ASTM-C 109 1023 Dixon et al. (2008)
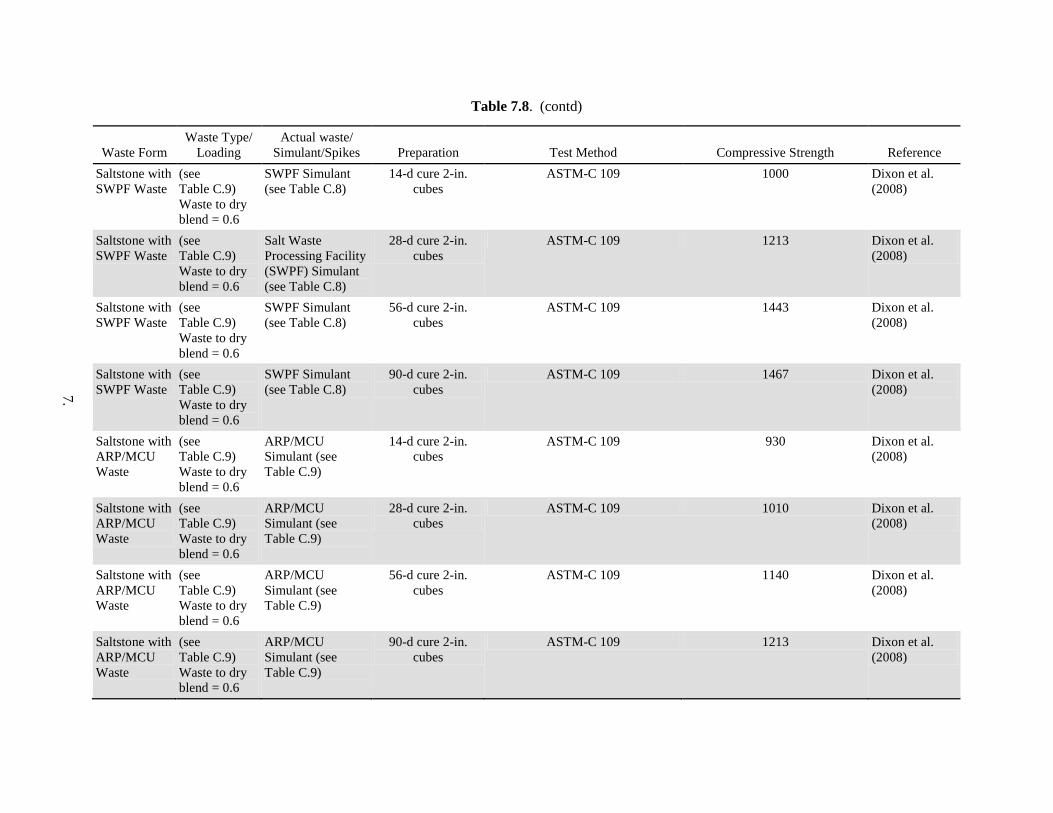
7.
Table 7.8. (contd)
Waste Form Waste Type/
Loading Actual waste/
Simulant/Spikes Preparation Test Method Compressive Strength Reference Saltstone with SWPF Waste
(see Table C.9) Waste to dry blend = 0.6
SWPF Simulant (see Table C.8)
14-d cure 2-in. cubes
ASTM-C 109 1000 Dixon et al. (2008)
Saltstone with SWPF Waste
(see Table C.9) Waste to dry blend = 0.6
Salt Waste Processing Facility (SWPF) Simulant (see Table C.8)
28-d cure 2-in. cubes
ASTM-C 109 1213 Dixon et al. (2008)
Saltstone with SWPF Waste
(see Table C.9) Waste to dry blend = 0.6
SWPF Simulant (see Table C.8)
56-d cure 2-in. cubes
ASTM-C 109 1443 Dixon et al. (2008)
Saltstone with SWPF Waste
(see Table C.9) Waste to dry blend = 0.6
SWPF Simulant (see Table C.8)
90-d cure 2-in. cubes
ASTM-C 109 1467 Dixon et al. (2008)
Saltstone with ARP/MCU Waste
(see Table C.9) Waste to dry blend = 0.6
ARP/MCU Simulant (see Table C.9)
14-d cure 2-in. cubes
ASTM-C 109 930 Dixon et al. (2008)
Saltstone with ARP/MCU Waste
(see Table C.9) Waste to dry blend = 0.6
ARP/MCU Simulant (see Table C.9)
28-d cure 2-in. cubes
ASTM-C 109 1010 Dixon et al. (2008)
Saltstone with ARP/MCU Waste
(see Table C.9) Waste to dry blend = 0.6
ARP/MCU Simulant (see Table C.9)
56-d cure 2-in. cubes
ASTM-C 109 1140 Dixon et al. (2008)
Saltstone with ARP/MCU Waste
(see Table C.9) Waste to dry blend = 0.6
ARP/MCU Simulant (see Table C.9)
90-d cure 2-in. cubes
ASTM-C 109 1213 Dixon et al. (2008)
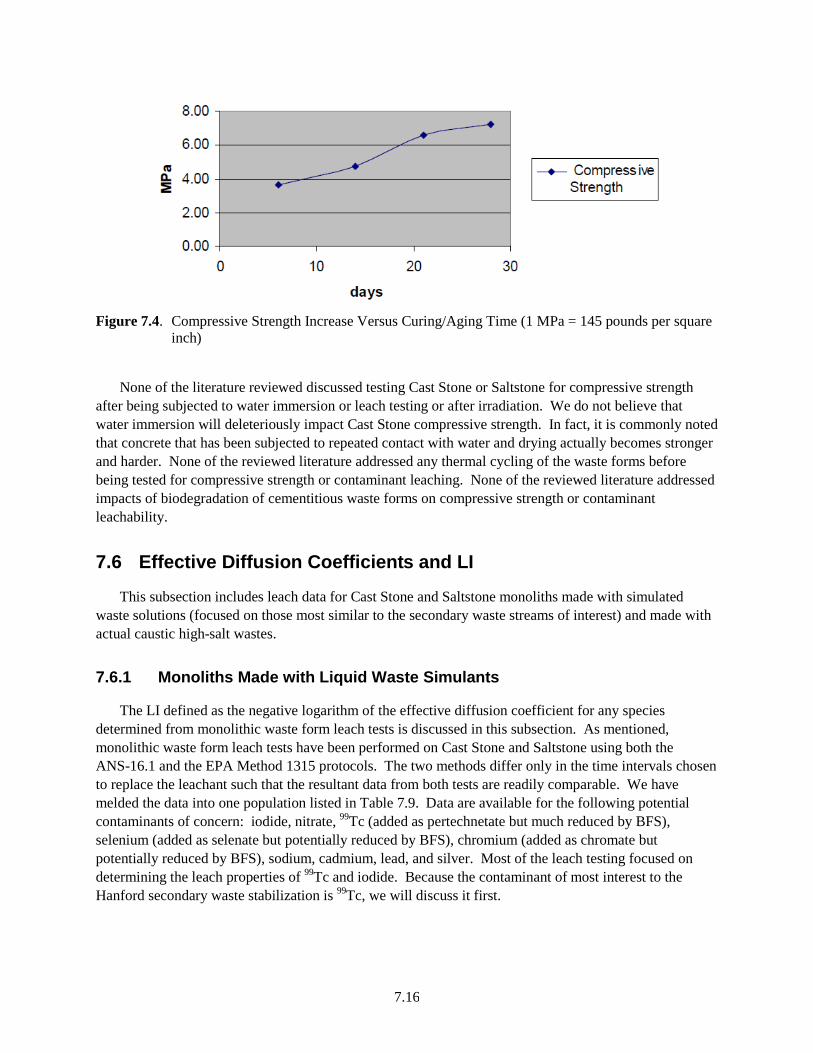
7.16
Figure 7.4. Compressive Strength Increase Versus Curing/Aging Time (1 MPa = 145 pounds per square
inch)
None of the literature reviewed discussed testing Cast Stone or Saltstone for compressive strength
after being subjected to water immersion or leach testing or after irradiation. We do not believe that water immersion will deleteriously impact Cast Stone compressive strength. In fact, it is commonly noted that concrete that has been subjected to repeated contact with water and drying actually becomes stronger and harder. None of the reviewed literature addressed any thermal cycling of the waste forms before being tested for compressive strength or contaminant leaching. None of the reviewed literature addressed impacts of biodegradation of cementitious waste forms on compressive strength or contaminant leachability.
7.6 Effective Diffusion Coefficients and LI
This subsection includes leach data for Cast Stone and Saltstone monoliths made with simulated waste solutions (focused on those most similar to the secondary waste streams of interest) and made with actual caustic high-salt wastes.
7.6.1 Monoliths Made with Liquid Waste Simulants
The LI defined as the negative logarithm of the effective diffusion coefficient for any species determined from monolithic waste form leach tests is discussed in this subsection. As mentioned, monolithic waste form leach tests have been performed on Cast Stone and Saltstone using both the ANS-16.1 and the EPA Method 1315 protocols. The two methods differ only in the time intervals chosen to replace the leachant such that the resultant data from both tests are readily comparable. We have melded the data into one population listed in Table 7.9. Data are available for the following potential contaminants of concern: iodide, nitrate, 99Tc (added as pertechnetate but much reduced by BFS), selenium (added as selenate but potentially reduced by BFS), chromium (added as chromate but potentially reduced by BFS), sodium, cadmium, lead, and silver. Most of the leach testing focused on determining the leach properties of 99Tc and iodide. Because the contaminant of most interest to the Hanford secondary waste stabilization is 99Tc, we will discuss it first.
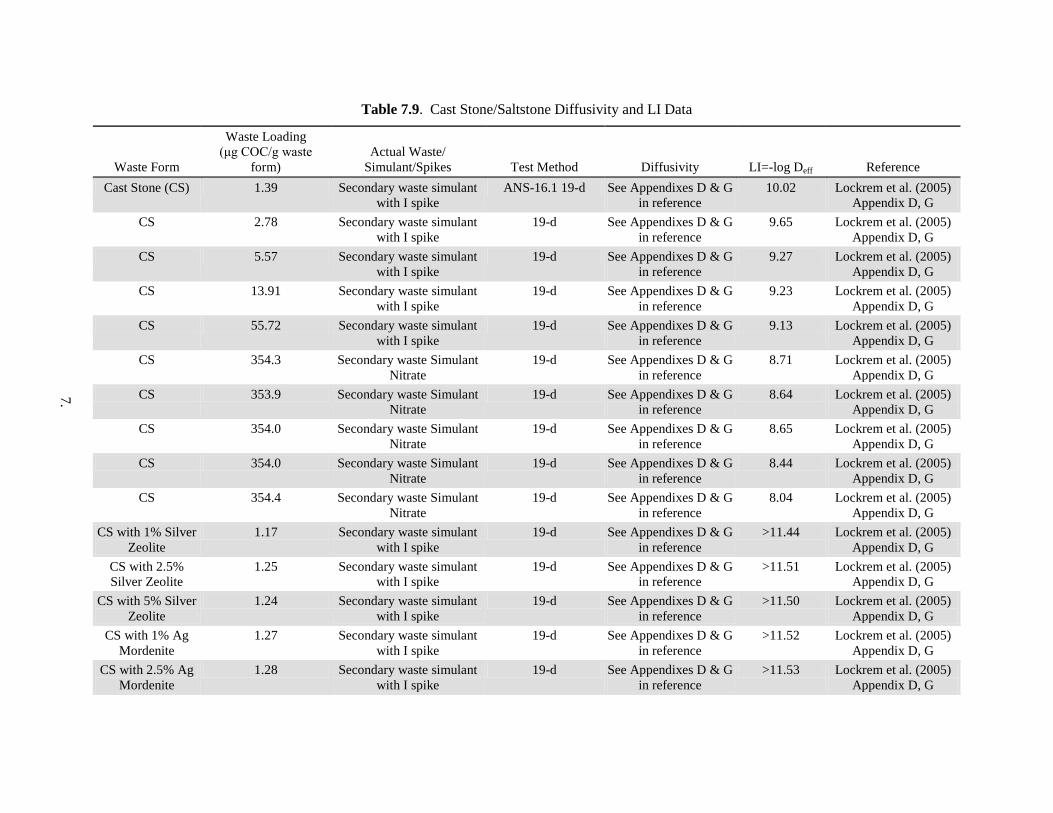
7.
Table 7.9. Cast Stone/Saltstone Diffusivity and LI Data
Waste Form
Waste Loading (μg COC/g waste
form) Actual Waste/
Simulant/Spikes Test Method Diffusivity LI=-log Deff Reference Cast Stone (CS) 1.39 Secondary waste simulant
with I spike ANS-16.1 19-d See Appendixes D & G
in reference 10.02 Lockrem et al. (2005)
Appendix D, G CS 2.78 Secondary waste simulant
with I spike 19-d See Appendixes D & G
in reference 9.65 Lockrem et al. (2005)
Appendix D, G CS 5.57 Secondary waste simulant
with I spike 19-d See Appendixes D & G
in reference 9.27 Lockrem et al. (2005)
Appendix D, G CS 13.91 Secondary waste simulant
with I spike 19-d See Appendixes D & G
in reference 9.23 Lockrem et al. (2005)
Appendix D, G CS 55.72 Secondary waste simulant
with I spike 19-d See Appendixes D & G
in reference 9.13 Lockrem et al. (2005)
Appendix D, G CS 354.3 Secondary waste Simulant
Nitrate 19-d See Appendixes D & G
in reference 8.71 Lockrem et al. (2005)
Appendix D, G CS 353.9 Secondary waste Simulant
Nitrate 19-d See Appendixes D & G
in reference 8.64 Lockrem et al. (2005)
Appendix D, G CS 354.0 Secondary waste Simulant
Nitrate 19-d See Appendixes D & G
in reference 8.65 Lockrem et al. (2005)
Appendix D, G CS 354.0 Secondary waste Simulant
Nitrate 19-d See Appendixes D & G
in reference 8.44 Lockrem et al. (2005)
Appendix D, G CS 354.4 Secondary waste Simulant
Nitrate 19-d See Appendixes D & G
in reference 8.04 Lockrem et al. (2005)
Appendix D, G CS with 1% Silver
Zeolite 1.17 Secondary waste simulant
with I spike 19-d See Appendixes D & G
in reference >11.44 Lockrem et al. (2005)
Appendix D, G CS with 2.5% Silver Zeolite
1.25 Secondary waste simulant with I spike
19-d See Appendixes D & G in reference
>11.51 Lockrem et al. (2005) Appendix D, G
CS with 5% Silver Zeolite
1.24 Secondary waste simulant with I spike
19-d See Appendixes D & G in reference
>11.50 Lockrem et al. (2005) Appendix D, G
CS with 1% Ag Mordenite
1.27 Secondary waste simulant with I spike
19-d See Appendixes D & G in reference
>11.52 Lockrem et al. (2005) Appendix D, G
CS with 2.5% Ag Mordenite
1.28 Secondary waste simulant with I spike
19-d See Appendixes D & G in reference
>11.53 Lockrem et al. (2005) Appendix D, G

7.
Table 7.9. (contd)
Waste Form
Waste Loading (μg COC/g waste
form) Actual Waste/
Simulant/Spikes Test Method Diffusivity LI=-log Deff Reference CS with 5% Ag
Mordenite 1.31 Secondary waste simulant
with I spike 19-d See Appendixes D &
G in reference >11.10 Lockrem et al. (2005)
Appendix D, G CS with 3% Will
Form 1.21 Secondary waste simulant
with I spike 19-d See Appendixes D &
G in reference >11.25 Lockrem et al. (2005)
Appendix D, G CS with 5% Will
Form 1.26 Secondary waste simulant
with I spike 19-d See Appendixes D &
G in reference >11.27 Lockrem et al. (2005)
Appendix D, G CS with 10% Will
Form 1.22 Secondary waste simulant
with I spike 19-d See Appendixes D &
G in reference >11.49 Lockrem et al. (2005)
Appendix D, G CS with 3% Bone
Char 1.26 Secondary waste simulant
with I spike 19-d See Appendixes D &
G in reference >11.51 Lockrem et al. (2005)
Appendix D, G CS with 5% Bone
Char 1.14 Secondary waste simulant
with I spike 19-d See Appendixes D &
G in reference >11.43 Lockrem et al. (2005)
Appendix D, G CS with 10%
Bone Char 1.29 Secondary waste simulant
with I spike 19-d See Appendixes D &
G in reference >11.53 Lockrem et al. (2005)
Appendix D, G CS with 5% Silver
Zeolite 1.26 Secondary waste simulant
with I spike 19-d See Appendixes D &
G in reference >11.51 Lockrem et al. (2005)
Appendix D, G CS with 5% Silver
Zeolite 2.53 Secondary waste simulant
with I spike 19-d See Appendixes D &
G in reference >12.16 Lockrem et al. (2005)
Appendix D, G CS with 5% Silver
Zeolite 4.96 Secondary waste simulant
with I spike 19-d See Appendixes D &
G in reference >12.47 Lockrem et al. (2005)
Appendix D, G CS with 5% Ag
Mordenite 1.22 Secondary waste simulant
with I spike 19-d See Appendixes D &
G in reference >10.96 Lockrem et al. (2005)
Appendix D, G CS with 5% Ag
Mordenite 2.53 Secondary waste simulant
with I spike 19-d See Appendixes D &
G in reference 9.95 Lockrem et al. (2005)
Appendix D, G CS with 5% Ag
Mordenite 5.05 Secondary waste simulant
with I spike 19-d See Appendixes D &
G in reference 9.4 Lockrem et al. (2005)
Appendix D, G CS with 10% Will
Form 1.15 Secondary waste simulant
with I spike 19-d See Appendixes D &
G in reference 8.33 Lockrem et al. (2005)
Appendix D, G CS with 10% Will
Form 2.53 Secondary waste simulant
with I spike 19-d See Appendixes D &
G in reference 8.16 Lockrem et al. (2005)
Appendix D, G

7.
Table 7.9. (contd)
Waste Form
Waste Loading (μg COC/g waste
form) Actual Waste/
Simulant/Spikes Test Method Diffusivity LI=-log Deff Reference CS with 10% Will
Form 4.85 Secondary waste simulant
with I spike 19-d See Appendixes D &
G in reference 8.1 Lockrem et al. (2005)
Appendix D, G CS with 10%
Bone Char 1.21 Secondary waste simulant
with I spike 19-d See Appendixes D &
G in reference 9.33 Lockrem et al. (2005)
Appendix D, G CS with 10%
Bone Char 2.50 Secondary waste simulant
with I spike 19-d See Appendixes D &
G in reference 7.8 Lockrem et al. (2005)
Appendix D, G CS with 10%
Bone Char 4.80 Secondary waste simulant
with I spike 19-d See Appendixes D &
G in reference 9.33 Lockrem et al. (2005)
Appendix D, G CS with any of the
4 getters 0.157 Secondary waste simulant
with Hg(II) spike 19-d See Appendixes D &
G in reference >9.1 to >9.47 Lockrem et al. (2005)
Appendix D, G CS with any of the
4 getters 0.623 Secondary waste Simulant
with Hg(II) spike 19-d See Appendixes D &
G in reference >10.0 to >10.5 Lockrem et al. (2005)
Appendix D, G CS variant -
Control 0.65 (99Tc) Brine 43 simulant (see
Table 2.5) with 99Tc ANS-16.1 (5 days) not reported 11.25 Duncan et al. (2009)
CS-variant with Fishbone
0.65 (99Tc) Brine 43 simulant (see Table 2.5) with 99Tc
ANS-16.1 (5 days) not reported 10.8 Duncan et al. (2009)
CS-variant with Zero Valent Iron
0.65 (99Tc) Brine 43 simulant (see Table 2.5) with 99Tc
ANS-16.1 (5 days) not reported 11.1 Duncan et al. (2009)
CS-variant with Bone Black
0.65 (99Tc) Brine 43 simulant (see Table 2.5) with 99Tc
ANS-16.1 (5 days) not reported 11.2 Duncan et al. (2009)
CS-variant with Fe(III) Phosphate
0.65 (99Tc) Brine 43 simulant (see Table 2.5) with 99Tc
ANS-16.1 (5 days) not reported 11.8 Duncan et al. (2009)
CS-variant with Hydrotalcite
0.65 (99Tc) Brine 43 simulant (see Table 2.5) with 99Tc
ANS-16.1 (5 days) not reported 11.25 Duncan et al. (2009)
CS-variant with Sn(II) Apatite
0.65 (99Tc) Brine 43 simulant (see Table 2.5) with 99Tc
ANS-16.1 (5 days) not reported 12.7 Duncan et al. (2009)
CS-variant with A530E Resin
0.65 (99Tc) Brine 43 simulant (see Table 2.5) with 99Tc
ANS-16.1 (5 days) not reported 12.5 Duncan et al. (2009)
CS-variant with A632 Resin
0.65 (99Tc) Brine 43 simulant (see Table 2.5) with 99Tc
ANS-16.1 (5 days) not reported 12.6 Duncan et al. (2009)
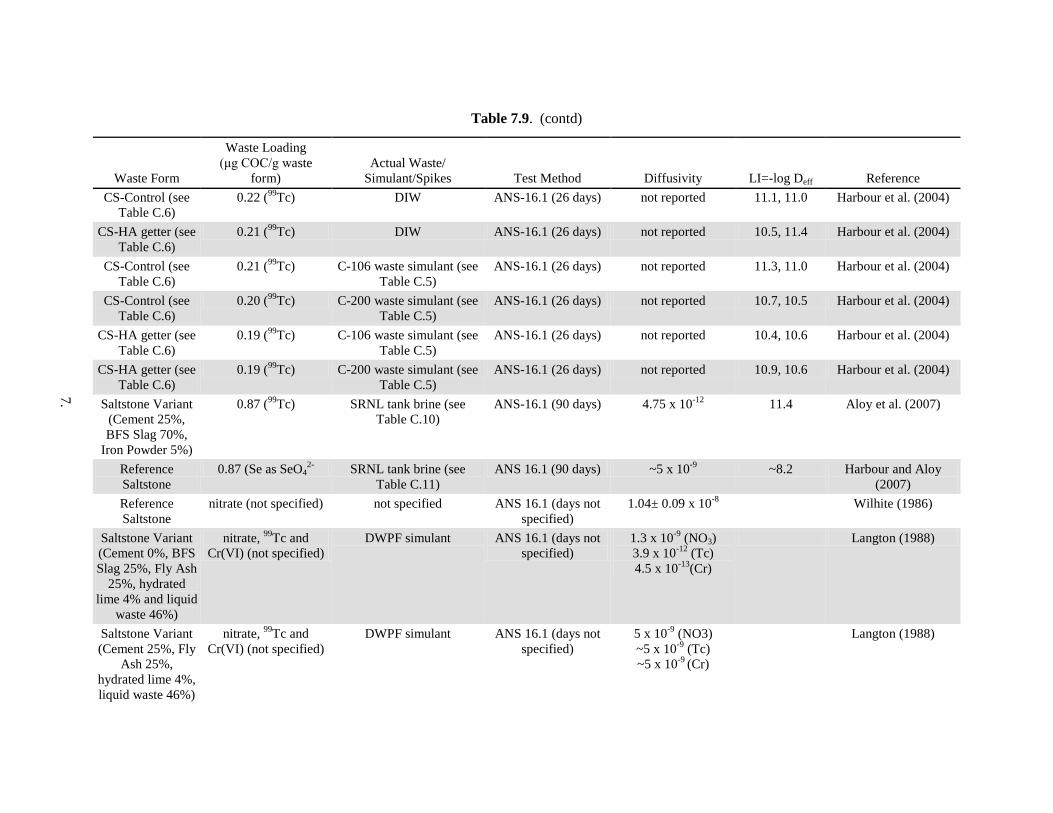
7.
Table 7.9. (contd)
Waste Form
Waste Loading (μg COC/g waste
form) Actual Waste/
Simulant/Spikes Test Method Diffusivity LI=-log Deff Reference CS-Control (see
Table C.6) 0.22 (99Tc) DIW ANS-16.1 (26 days) not reported 11.1, 11.0 Harbour et al. (2004)
CS-HA getter (see Table C.6)
0.21 (99Tc) DIW ANS-16.1 (26 days) not reported 10.5, 11.4 Harbour et al. (2004)
CS-Control (see Table C.6)
0.21 (99Tc) C-106 waste simulant (see Table C.5)
ANS-16.1 (26 days) not reported 11.3, 11.0 Harbour et al. (2004)
CS-Control (see Table C.6)
0.20 (99Tc) C-200 waste simulant (see Table C.5)
ANS-16.1 (26 days) not reported 10.7, 10.5 Harbour et al. (2004)
CS-HA getter (see Table C.6)
0.19 (99Tc) C-106 waste simulant (see Table C.5)
ANS-16.1 (26 days) not reported 10.4, 10.6 Harbour et al. (2004)
CS-HA getter (see Table C.6)
0.19 (99Tc) C-200 waste simulant (see Table C.5)
ANS-16.1 (26 days) not reported 10.9, 10.6 Harbour et al. (2004)
Saltstone Variant (Cement 25%, BFS Slag 70%,
Iron Powder 5%)
0.87 (99Tc) SRNL tank brine (see Table C.10)
ANS-16.1 (90 days) 4.75 x 10⁻¹² 11.4 Aloy et al. (2007)
Reference Saltstone
0.87 (Se as SeO42- SRNL tank brine (see
Table C.11) ANS 16.1 (90 days) ~5 x 10⁻⁹ ~8.2 Harbour and Aloy
(2007) Reference Saltstone
nitrate (not specified) not specified ANS 16.1 (days not specified)
1.04± 0.09 x 10⁻⁸ Wilhite (1986)
Saltstone Variant (Cement 0%, BFS Slag 25%, Fly Ash
25%, hydrated lime 4% and liquid
waste 46%)
nitrate, 99Tc and Cr(VI) (not specified)
DWPF simulant ANS 16.1 (days not specified)
1.3 x 10⁻⁹ (NO3) 3.9 x 10⁻¹² (Tc) 4.5 x 10⁻¹³(Cr)
Langton (1988)
Saltstone Variant (Cement 25%, Fly
Ash 25%, hydrated lime 4%, liquid waste 46%)
nitrate, 99Tc and Cr(VI) (not specified)
DWPF simulant ANS 16.1 (days not specified)
5 x 10⁻⁹ (NO3) ~5 x 10⁻⁹ (Tc) ~5 x 10⁻⁹ (Cr)
Langton (1988)

7.
Table 7.9. (contd)
Waste Form
Waste Loading (μg COC/g waste
form) Actual Waste/
Simulant/Spikes Test Method Diffusivity LI=-log Deff Reference Cast Stone 99Tc (varied from
0.016 to 8.2 µg Tc/g Cast Stone)
S1, S2, S3, S4 secondary waste simulants (see
Table 2.7)
EPA 1315 (63 days) 1.1 × 10⁻¹⁰ to 4.3 × 10⁻¹² cm2/s
10.0 to 12.3 Sundaram et al. (2011)
Cast Stone I as Iodide(0.085) S1, 2M Na EPA 1315 (63 days) <5.6 E-08 >7.26 Sundaram et al. (2011) Cast Stone I as Iodide(0.085) S1, 2M Na EPA 1315 (63 days) Above is average of two reps; corrected for leaching >20% Cast Stone 99Tc (0.0163) S1, 2M Na EPA 1315 (63 days) <1.72 E-11 >10.8 Sundaram et al. (2011) Cast Stone 99Tc (0.016) S1, 2M Na EPA 1315 (63 days) <1.68 E-11 >10.8 Sundaram et al. (2011) Cast Stone Na (14.4 mg/g) S1, 2M Na EPA 1315 (63 days) 1.44 E-10 9.8 Sundaram et al. (2011) Cast Stone Na (14.4 mg/g) S1, 2M Na EPA 1315 (63 days) 1.45 E-10 9.8 Sundaram et al. (2011) Cast Stone I as Iodide (0.168) S1, 4M Na EPA 1315 (63 days) <2.2 E-08 >7.66 Sundaram et al. (2011) Cast Stone I as Iodide (0.168) S1, 4M Na EPA 1315 (63 days) Above is average of two reps; corrected for leaching >20% Cast Stone 99Tc (0.032) S1, 4M Na EPA 1315 (63 days) <4.40 E-12 >11.4 Sundaram et al. (2011) Cast Stone 99Tc (0.032) S1, 4M Na EPA 1315 (63 days) <4.29 E-12 >11.4 Sundaram et al. (2011) Cast Stone Na (17.2 mg/g) S1, 4M Na EPA 1315 (63 days) 2.33 E-10 9.6 Sundaram et al. (2011) Cast Stone Na (17.2 mg/g) S1, 4M Na EPA 1315 (63 days) 2.28 E-10 9.6 Sundaram et al. (2011) Cast Stone I as Iodide (0.24) S1, 6M Na EPA 1315 (63 days) <3.1E-08 >7.51 Sundaram et al. (2011) Cast Stone I as Iodide (0.24) S1, 6M Na EPA 1315 (63 days) Above is average of two reps; corrected for leaching >20% Cast Stone 99Tc (0.047) S1, 6M Na EPA 1315 (63 days) 8.10 E-12 11.1 Sundaram et al. (2011) Cast Stone 99Tc (0.047) S1, 6M Na EPA 1315 (63 days) 6.587E-12 11.2 Sundaram et al. (2011) Cast Stone Na (20.1 mg/g) S1, 6M Na EPA 1315 (63 days) 2.94 E-10 9.5 Sundaram et al. (2011) Cast Stone Na (20.1 mg/g) S1, 6M Na EPA 1315 (63 days) 2.3.19 E-10 9.5 Sundaram et al. (2011) Cast Stone I as Iodide (0.33) S1, 8M Na EPA 1315 (63 days) <1.4 E-08 >7.85 Sundaram et al. (2011) Cast Stone I as Iodide (0.33) S1, 8M Na EPA 1315 (63 days) Above is average of two reps; corrected for leaching >20% Cast Stone 99Tc (0.063) S1, 8M Na EPA 1315 (63 days) 3.37 E-11 10.5 Sundaram et al. (2011) Cast Stone 99Tc (0.063) S1, 8M Na EPA 1315 (63 days) 3.30 E-11 10.5 Sundaram et al. (2011) Cast Stone Na (22.2 mg/g) S1, 8M Na EPA 1315 (63 days) 3.36 E-10 9.5 Sundaram et al. (2011) Cast Stone Na (22.2 mg/g) S1, 8M Na EPA 1315 (63 days) 3.74 E-10 9.4 Sundaram et al. (2011)
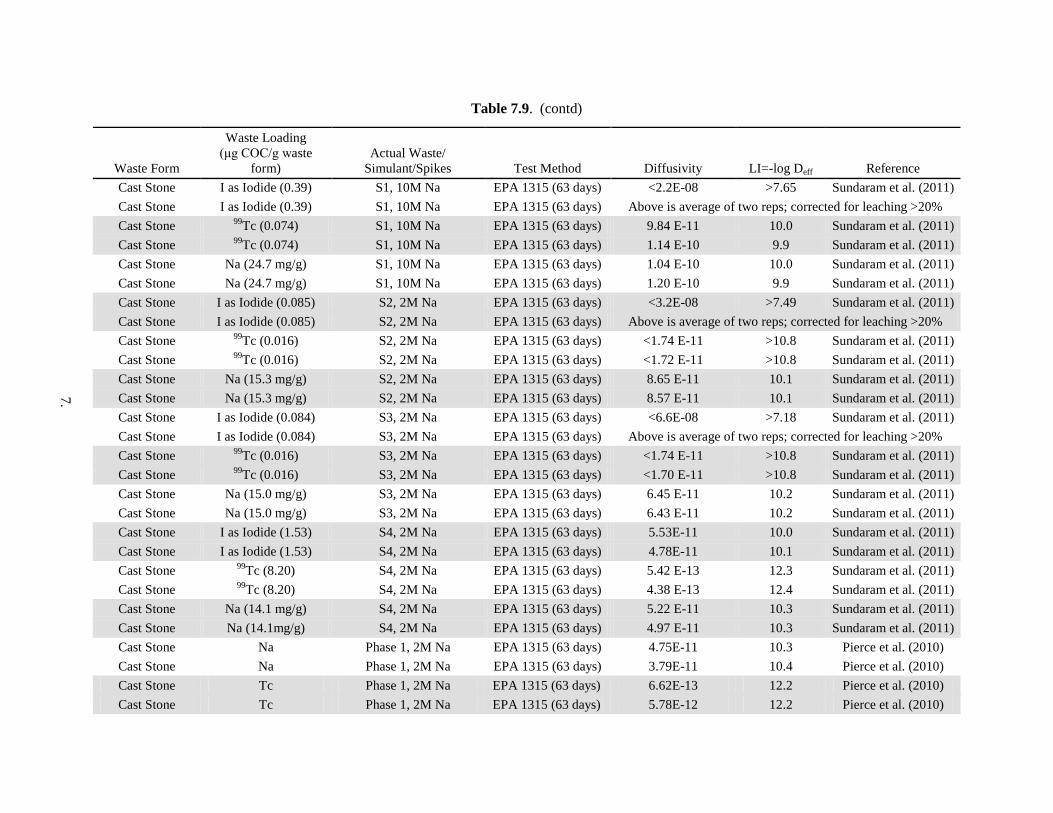
7.
Table 7.9. (contd)
Waste Form
Waste Loading (μg COC/g waste
form) Actual Waste/
Simulant/Spikes Test Method Diffusivity LI=-log Deff Reference Cast Stone I as Iodide (0.39) S1, 10M Na EPA 1315 (63 days) <2.2E-08 >7.65 Sundaram et al. (2011) Cast Stone I as Iodide (0.39) S1, 10M Na EPA 1315 (63 days) Above is average of two reps; corrected for leaching >20% Cast Stone 99Tc (0.074) S1, 10M Na EPA 1315 (63 days) 9.84 E-11 10.0 Sundaram et al. (2011) Cast Stone 99Tc (0.074) S1, 10M Na EPA 1315 (63 days) 1.14 E-10 9.9 Sundaram et al. (2011) Cast Stone Na (24.7 mg/g) S1, 10M Na EPA 1315 (63 days) 1.04 E-10 10.0 Sundaram et al. (2011) Cast Stone Na (24.7 mg/g) S1, 10M Na EPA 1315 (63 days) 1.20 E-10 9.9 Sundaram et al. (2011) Cast Stone I as Iodide (0.085) S2, 2M Na EPA 1315 (63 days) <3.2E-08 >7.49 Sundaram et al. (2011) Cast Stone I as Iodide (0.085) S2, 2M Na EPA 1315 (63 days) Above is average of two reps; corrected for leaching >20% Cast Stone 99Tc (0.016) S2, 2M Na EPA 1315 (63 days) <1.74 E-11 >10.8 Sundaram et al. (2011) Cast Stone 99Tc (0.016) S2, 2M Na EPA 1315 (63 days) <1.72 E-11 >10.8 Sundaram et al. (2011) Cast Stone Na (15.3 mg/g) S2, 2M Na EPA 1315 (63 days) 8.65 E-11 10.1 Sundaram et al. (2011) Cast Stone Na (15.3 mg/g) S2, 2M Na EPA 1315 (63 days) 8.57 E-11 10.1 Sundaram et al. (2011) Cast Stone I as Iodide (0.084) S3, 2M Na EPA 1315 (63 days) <6.6E-08 >7.18 Sundaram et al. (2011) Cast Stone I as Iodide (0.084) S3, 2M Na EPA 1315 (63 days) Above is average of two reps; corrected for leaching >20% Cast Stone 99Tc (0.016) S3, 2M Na EPA 1315 (63 days) <1.74 E-11 >10.8 Sundaram et al. (2011) Cast Stone 99Tc (0.016) S3, 2M Na EPA 1315 (63 days) <1.70 E-11 >10.8 Sundaram et al. (2011) Cast Stone Na (15.0 mg/g) S3, 2M Na EPA 1315 (63 days) 6.45 E-11 10.2 Sundaram et al. (2011) Cast Stone Na (15.0 mg/g) S3, 2M Na EPA 1315 (63 days) 6.43 E-11 10.2 Sundaram et al. (2011) Cast Stone I as Iodide (1.53) S4, 2M Na EPA 1315 (63 days) 5.53E-11 10.0 Sundaram et al. (2011) Cast Stone I as Iodide (1.53) S4, 2M Na EPA 1315 (63 days) 4.78E-11 10.1 Sundaram et al. (2011) Cast Stone 99Tc (8.20) S4, 2M Na EPA 1315 (63 days) 5.42 E-13 12.3 Sundaram et al. (2011) Cast Stone 99Tc (8.20) S4, 2M Na EPA 1315 (63 days) 4.38 E-13 12.4 Sundaram et al. (2011) Cast Stone Na (14.1 mg/g) S4, 2M Na EPA 1315 (63 days) 5.22 E-11 10.3 Sundaram et al. (2011) Cast Stone Na (14.1mg/g) S4, 2M Na EPA 1315 (63 days) 4.97 E-11 10.3 Sundaram et al. (2011) Cast Stone Na Phase 1, 2M Na EPA 1315 (63 days) 4.75E-11 10.3 Pierce et al. (2010) Cast Stone Na Phase 1, 2M Na EPA 1315 (63 days) 3.79E-11 10.4 Pierce et al. (2010) Cast Stone Tc Phase 1, 2M Na EPA 1315 (63 days) 6.62E-13 12.2 Pierce et al. (2010) Cast Stone Tc Phase 1, 2M Na EPA 1315 (63 days) 5.78E-12 12.2 Pierce et al. (2010)
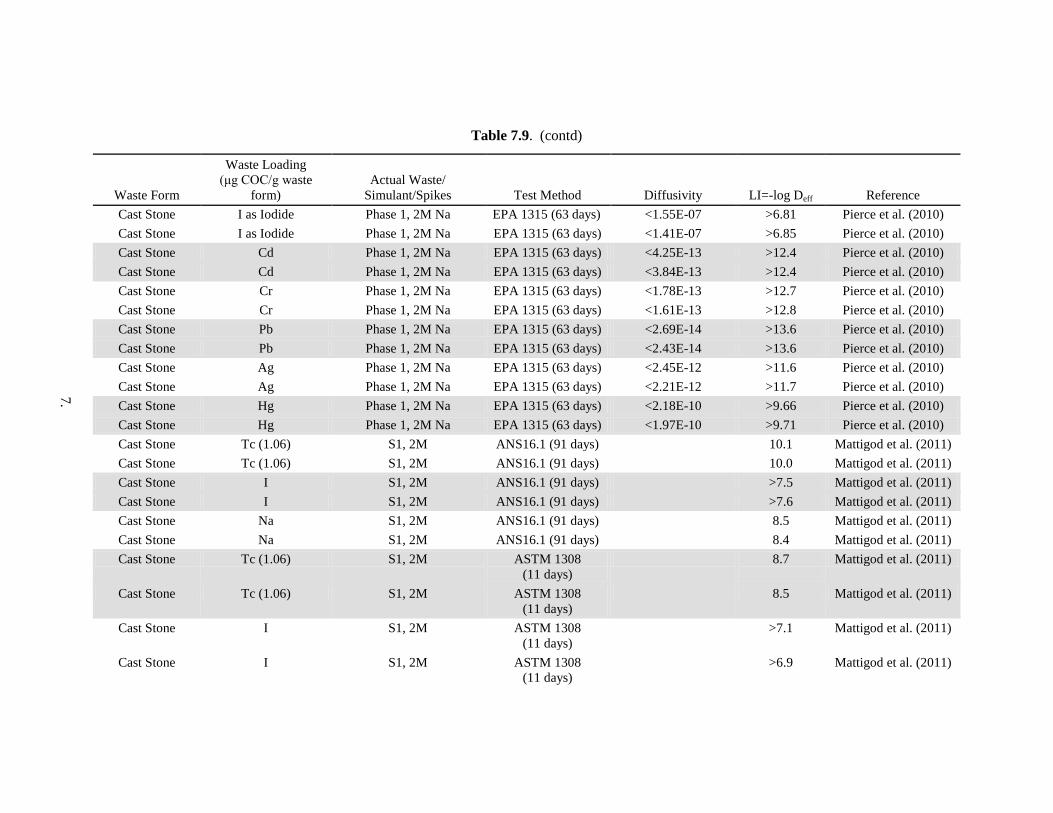
7.
Table 7.9. (contd)
Waste Form
Waste Loading (μg COC/g waste
form) Actual Waste/
Simulant/Spikes Test Method Diffusivity LI=-log Deff Reference Cast Stone I as Iodide Phase 1, 2M Na EPA 1315 (63 days) <1.55E-07 >6.81 Pierce et al. (2010) Cast Stone I as Iodide Phase 1, 2M Na EPA 1315 (63 days) <1.41E-07 >6.85 Pierce et al. (2010) Cast Stone Cd Phase 1, 2M Na EPA 1315 (63 days) <4.25E-13 >12.4 Pierce et al. (2010) Cast Stone Cd Phase 1, 2M Na EPA 1315 (63 days) <3.84E-13 >12.4 Pierce et al. (2010) Cast Stone Cr Phase 1, 2M Na EPA 1315 (63 days) <1.78E-13 >12.7 Pierce et al. (2010) Cast Stone Cr Phase 1, 2M Na EPA 1315 (63 days) <1.61E-13 >12.8 Pierce et al. (2010) Cast Stone Pb Phase 1, 2M Na EPA 1315 (63 days) <2.69E-14 >13.6 Pierce et al. (2010) Cast Stone Pb Phase 1, 2M Na EPA 1315 (63 days) <2.43E-14 >13.6 Pierce et al. (2010) Cast Stone Ag Phase 1, 2M Na EPA 1315 (63 days) <2.45E-12 >11.6 Pierce et al. (2010) Cast Stone Ag Phase 1, 2M Na EPA 1315 (63 days) <2.21E-12 >11.7 Pierce et al. (2010) Cast Stone Hg Phase 1, 2M Na EPA 1315 (63 days) <2.18E-10 >9.66 Pierce et al. (2010) Cast Stone Hg Phase 1, 2M Na EPA 1315 (63 days) <1.97E-10 >9.71 Pierce et al. (2010) Cast Stone Tc (1.06) S1, 2M ANS16.1 (91 days) 10.1 Mattigod et al. (2011) Cast Stone Tc (1.06) S1, 2M ANS16.1 (91 days) 10.0 Mattigod et al. (2011) Cast Stone I S1, 2M ANS16.1 (91 days) >7.5 Mattigod et al. (2011) Cast Stone I S1, 2M ANS16.1 (91 days) >7.6 Mattigod et al. (2011) Cast Stone Na S1, 2M ANS16.1 (91 days) 8.5 Mattigod et al. (2011) Cast Stone Na S1, 2M ANS16.1 (91 days) 8.4 Mattigod et al. (2011) Cast Stone Tc (1.06) S1, 2M ASTM 1308
(11 days) 8.7
Mattigod et al. (2011)
Cast Stone Tc (1.06) S1, 2M ASTM 1308 (11 days)
8.5 Mattigod et al. (2011)
Cast Stone I S1, 2M ASTM 1308 (11 days)
>7.1 Mattigod et al. (2011)
Cast Stone I S1, 2M ASTM 1308 (11 days)
>6.9 Mattigod et al. (2011)
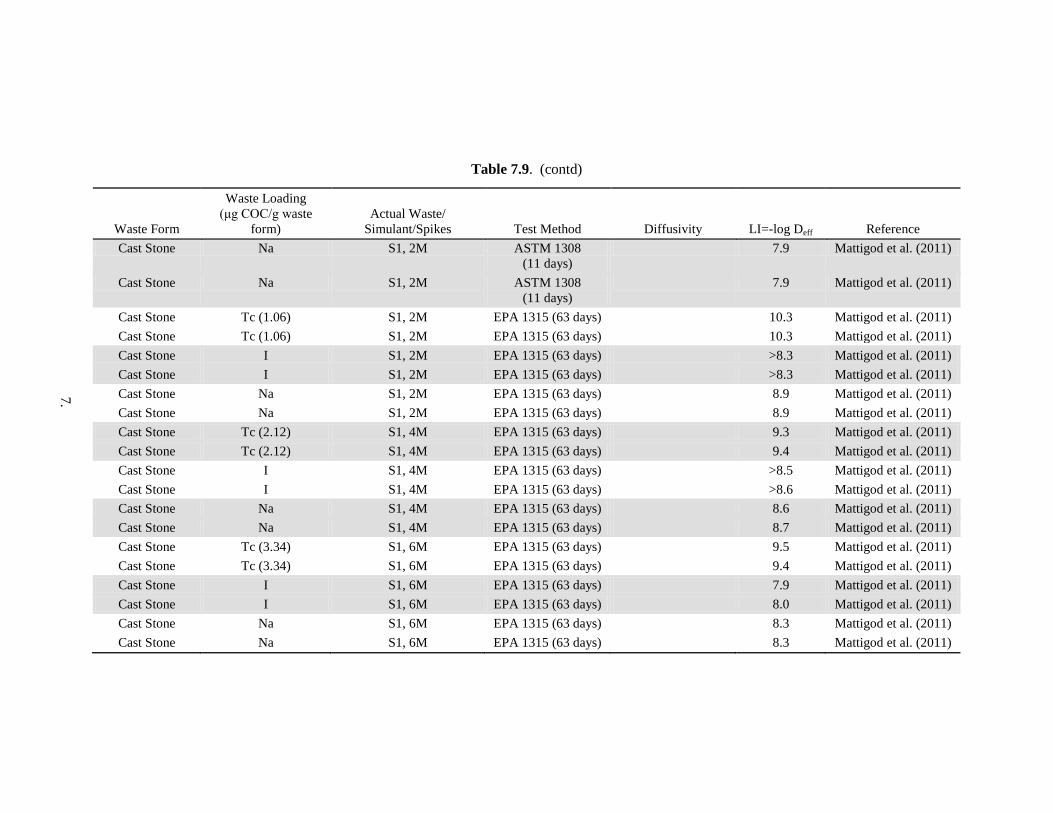
7.
Table 7.9. (contd)
Waste Form
Waste Loading (μg COC/g waste
form) Actual Waste/
Simulant/Spikes Test Method Diffusivity LI=-log Deff Reference Cast Stone Na S1, 2M ASTM 1308
(11 days) 7.9 Mattigod et al. (2011)
Cast Stone Na S1, 2M ASTM 1308 (11 days)
7.9 Mattigod et al. (2011)
Cast Stone Tc (1.06) S1, 2M EPA 1315 (63 days) 10.3 Mattigod et al. (2011) Cast Stone Tc (1.06) S1, 2M EPA 1315 (63 days) 10.3 Mattigod et al. (2011) Cast Stone I S1, 2M EPA 1315 (63 days) >8.3 Mattigod et al. (2011) Cast Stone I S1, 2M EPA 1315 (63 days) >8.3 Mattigod et al. (2011) Cast Stone Na S1, 2M EPA 1315 (63 days) 8.9 Mattigod et al. (2011) Cast Stone Na S1, 2M EPA 1315 (63 days) 8.9 Mattigod et al. (2011) Cast Stone Tc (2.12) S1, 4M EPA 1315 (63 days) 9.3 Mattigod et al. (2011) Cast Stone Tc (2.12) S1, 4M EPA 1315 (63 days) 9.4 Mattigod et al. (2011) Cast Stone I S1, 4M EPA 1315 (63 days) >8.5 Mattigod et al. (2011) Cast Stone I S1, 4M EPA 1315 (63 days) >8.6 Mattigod et al. (2011) Cast Stone Na S1, 4M EPA 1315 (63 days) 8.6 Mattigod et al. (2011) Cast Stone Na S1, 4M EPA 1315 (63 days) 8.7 Mattigod et al. (2011) Cast Stone Tc (3.34) S1, 6M EPA 1315 (63 days) 9.5 Mattigod et al. (2011) Cast Stone Tc (3.34) S1, 6M EPA 1315 (63 days) 9.4 Mattigod et al. (2011) Cast Stone I S1, 6M EPA 1315 (63 days) 7.9 Mattigod et al. (2011) Cast Stone I S1, 6M EPA 1315 (63 days) 8.0 Mattigod et al. (2011) Cast Stone Na S1, 6M EPA 1315 (63 days) 8.3 Mattigod et al. (2011) Cast Stone Na S1, 6M EPA 1315 (63 days) 8.3 Mattigod et al. (2011)
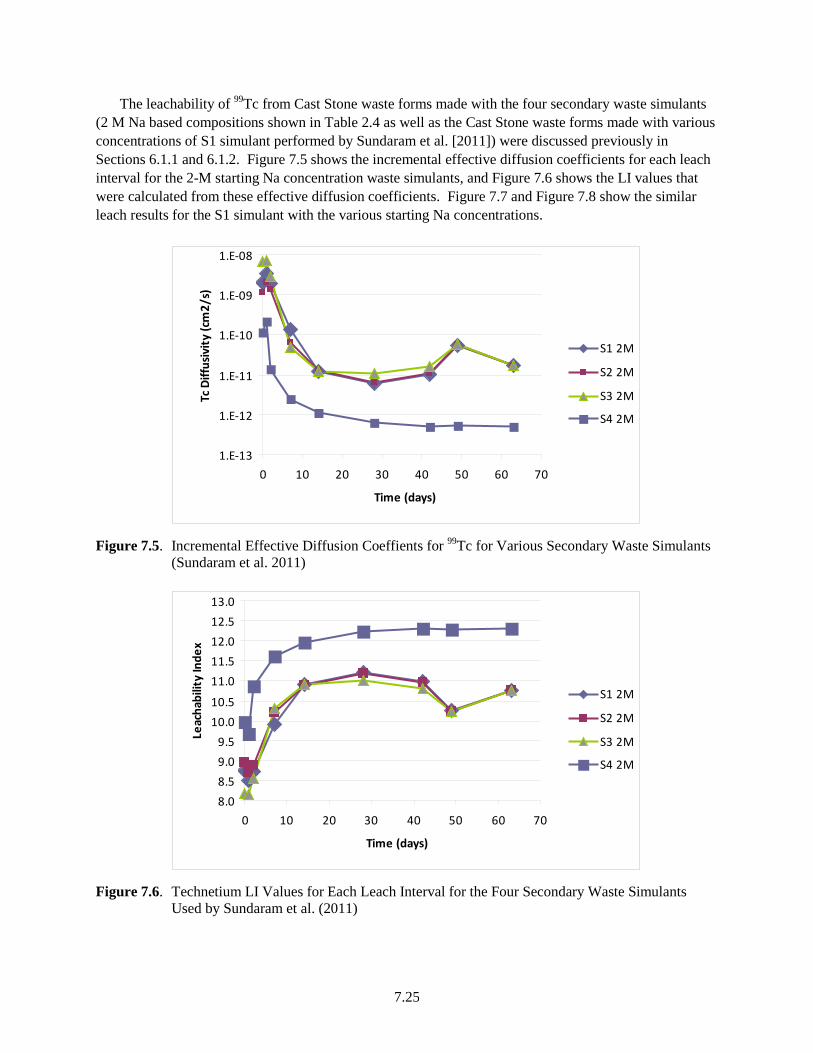
7.25
The leachability of 99Tc from Cast Stone waste forms made with the four secondary waste simulants (2 M Na based compositions shown in Table 2.4 as well as the Cast Stone waste forms made with various concentrations of S1 simulant performed by Sundaram et al. [2011]) were discussed previously in Sections 6.1.1 and 6.1.2. Figure 7.5 shows the incremental effective diffusion coefficients for each leach interval for the 2-M starting Na concentration waste simulants, and Figure 7.6 shows the LI values that were calculated from these effective diffusion coefficients. Figure 7.7 and Figure 7.8 show the similar leach results for the S1 simulant with the various starting Na concentrations.
1.E-13
1.E-12
1.E-11
1.E-10
1.E-09
1.E-08
0 10 20 30 40 50 60 70
Time (days)
Tc D
iffus
ivity
(cm
2/s)
S1 2M
S2 2M
S3 2M
S4 2M
Figure 7.5. Incremental Effective Diffusion Coeffients for 99Tc for Various Secondary Waste Simulants
(Sundaram et al. 2011)
8.08.59.09.5
10.010.5
11.011.512.012.513.0
0 10 20 30 40 50 60 70
Time (days)
Leac
habi
lity
Inde
x
S1 2M
S2 2M
S3 2M
S4 2M
Figure 7.6. Technetium LI Values for Each Leach Interval for the Four Secondary Waste Simulants
Used by Sundaram et al. (2011)

7.26
1.E-12
1.E-11
1.E-10
1.E-09
1.E-08
1.E-07
0 10 20 30 40 50 60 70
Time (days)
Tc D
iffus
ivity
(cm
2/s)
S1 2M
S1 4M
S1 6M
S1 8M
S1 10M
Figure 7.7. Incremental Effective Diffusion Coeffients for 99Tc in Secondary Waste Simulant S1 at
Various Starting Concentrations of Na-based Waste (Sundaram et al. 2011)
7.07.5
8.08.5
9.09.5
10.010.5
11.011.5
12.0
0 10 20 30 40 50 60 70
Time (days)
Leac
habi
lity
Inde
x
S1 2M
S1 4M
S1 6M
S1 8M
S1 10M
Figure 7.8. Technetium LI Values for Each Leach Interval for the S1 Secondary Waste Simulant at
Various Na Starting Concentrations Used by Sundaram et al. (2011)
The leach data all exhibit the largest effective diffusion coefficients and lowest LI values in the first
few leach intervals that covered cumulative time periods of several hours to a few days. Leach rates dropped considerably after the very early time periods, suggesting that there was some evaporated salt on the surface of the waste forms that quickly dissolved. This wash-off effect is observed and has been discussed in most of the cementitious waste form literature. An additional conceptual model for this early wash-off phenomenon relies on categorizing the porosity and pores in the cementitious waste forms into two types. The first type of porosity has the pores intercepting the surface of the waste form and thus allows direct access to the leachant. The second type is pores that are internal and do not have direct

7.27
access to the waste form surface; they must rely on diffusion through interconnected pore throats that follow tortuous pathways to reach the waste form surface.
After about 14 days, most of the Cast Stone waste forms exhibited a fairly constant leach rate out to the end of the testing at 63 days as quantified by the incremental effective diffusion coefficient. The leach rates for 99Tc in all four secondary waste simulants and for the S1 waste simulant studied at various starting concentrations after seven days of leaching and often after two day of leaching were much lower than 10-9 cm2/s, which has been chosen as a desired metric for performance based on preliminary PAs for groundwater protection for wastes disposed of in the IDF (see Mann et al. 2003).
The differences observed in the 99Tc leach rates between the Cast Stone waste forms containing the four waste simulants is likely caused by the different concentrations of the macro constituents in the simulant, different free water-to-dry blend ratios. The Cast Stone waste form made with S4 simulant contained a much higher loading of 99Tc (8.2 µg Tc per g of Cast Stone) than the other three Cast Stone waste forms containing simulants S1, S2, and S3 (0.016 µg Tc per g of Cast Stone). Cementitious waste form literature often describes a relationship where increased loading of a particular contaminant causes the leach rate to increase; however in this work the S4 simulant with the higher Tc loading had the lowest 99Tc leach rate. At this time we do not have an explanation for this trend.
One common explanation for the increased leach rates as contaminant waste loading increases is that there is a finite amount of sites in the C-S-H solid phases formed during cement hydration that can accommodate “foreign” atoms of similar size and charge into lattice sites and finite preferred adsorption sites on the surfaces of cementitious minerals that can chemically bind each contaminant. Once these lattice and preferred adsorption sites are filled with a specific contaminant, the rest of the contaminant is either remains dissolved in the pore waters trapped in the waste form or are more loosely bound to less-preferred adsorption sites. The contaminants dissolved in trapped pore water and loosely bound to adsorption sites are more available to diffusion out of the waste form.
The free water to dry blend mix ratio is a key metric that controls the hydration process in the cement system (formation of secondary minerals that control the final porosity, tortuosity, and compressive strength). The free water-to-dry blend mix ratio differs from the waste liquid to dry mix ratio because it does not include the dissolved salt content present in the waste. It does not appear that to date (excepting the most current studies described in Mattigod et al. (2011) any of the Cast Stone work performed at Hanford has noted this distinction nor have the Hanford reports calculated the free water-to-dry blend ratios and attempted to correlate this ratio with any of the various performance criteria. We suggest that the free water-to-dry blend mix ratio be calculated and used along with the dry salt loading for future Cast Stone optimization work. It is likely that the free water-to-dry blend mix ratio will delineate both the range of acceptable slurry workability and overall Cast Stone waste form leaching performance.
We speculate that the very low 99Tc release rates (average LI ranges from 10.9 to 12.6 after 63 days of leaching) observed in the various Cast Stone observed in the recent work of Sundaram et al. (2011), Pierce et al. (2010), and Duncan et al. (2009), which reported an LI value of 11.5 after 5 days of leaching when no Tc getters were present, are controlled by the presence of the BFS slag that is capable of reducing 99Tc as long as oxygen is not allowed to permeate the waste forms. If the BFS was not present, the 99Tc leach rates would likely be much larger. Langton (1988) showed that the 99Tc LI for Saltstone increased from 8.3 to 11.4 (effective diffusion coefficient decreased from 5 × 10⁻⁹ to 3.9 × 10⁻¹² cm2/s) when BFS was added to the dry blend in place of lime. As discussed previously, the key process that
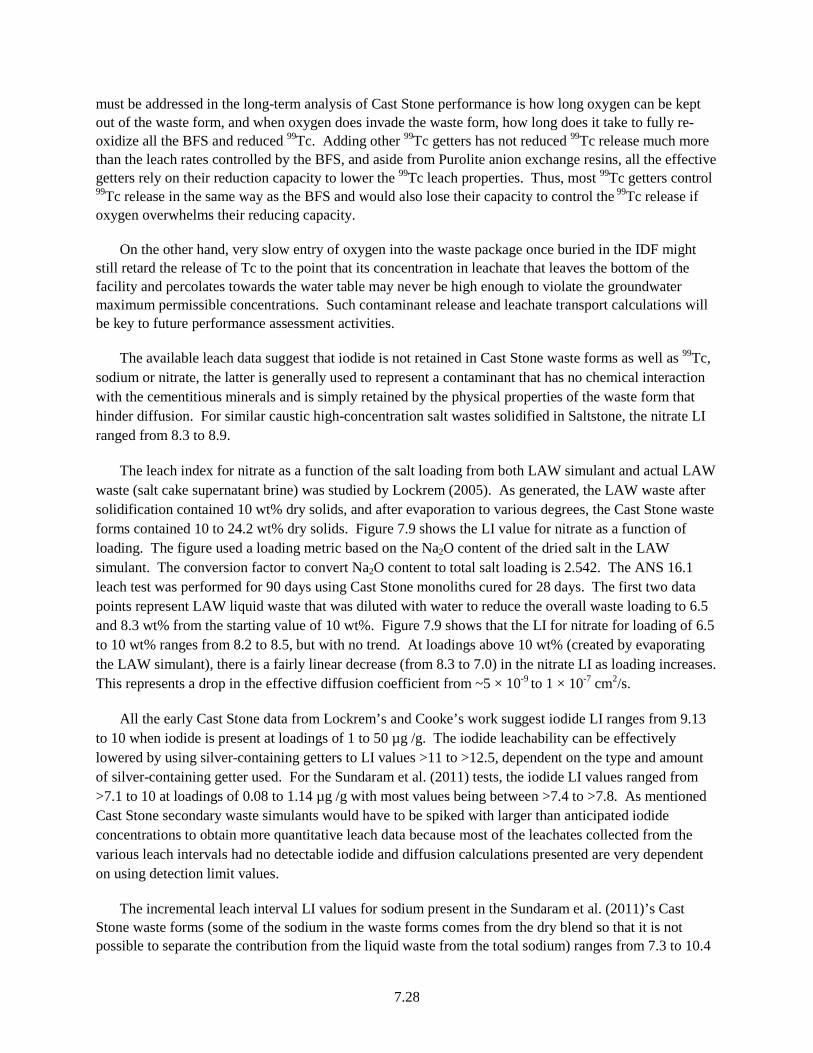
7.28
must be addressed in the long-term analysis of Cast Stone performance is how long oxygen can be kept out of the waste form, and when oxygen does invade the waste form, how long does it take to fully re-oxidize all the BFS and reduced 99Tc. Adding other 99Tc getters has not reduced 99Tc release much more than the leach rates controlled by the BFS, and aside from Purolite anion exchange resins, all the effective getters rely on their reduction capacity to lower the 99Tc leach properties. Thus, most 99Tc getters control 99Tc release in the same way as the BFS and would also lose their capacity to control the 99Tc release if oxygen overwhelms their reducing capacity.
On the other hand, very slow entry of oxygen into the waste package once buried in the IDF might still retard the release of Tc to the point that its concentration in leachate that leaves the bottom of the facility and percolates towards the water table may never be high enough to violate the groundwater maximum permissible concentrations. Such contaminant release and leachate transport calculations will be key to future performance assessment activities.
The available leach data suggest that iodide is not retained in Cast Stone waste forms as well as 99Tc, sodium or nitrate, the latter is generally used to represent a contaminant that has no chemical interaction with the cementitious minerals and is simply retained by the physical properties of the waste form that hinder diffusion. For similar caustic high-concentration salt wastes solidified in Saltstone, the nitrate LI ranged from 8.3 to 8.9.
The leach index for nitrate as a function of the salt loading from both LAW simulant and actual LAW waste (salt cake supernatant brine) was studied by Lockrem (2005). As generated, the LAW waste after solidification contained 10 wt% dry solids, and after evaporation to various degrees, the Cast Stone waste forms contained 10 to 24.2 wt% dry solids. Figure 7.9 shows the LI value for nitrate as a function of loading. The figure used a loading metric based on the Na2O content of the dried salt in the LAW simulant. The conversion factor to convert Na2O content to total salt loading is 2.542. The ANS 16.1 leach test was performed for 90 days using Cast Stone monoliths cured for 28 days. The first two data points represent LAW liquid waste that was diluted with water to reduce the overall waste loading to 6.5 and 8.3 wt% from the starting value of 10 wt%. Figure 7.9 shows that the LI for nitrate for loading of 6.5 to 10 wt% ranges from 8.2 to 8.5, but with no trend. At loadings above 10 wt% (created by evaporating the LAW simulant), there is a fairly linear decrease (from 8.3 to 7.0) in the nitrate LI as loading increases. This represents a drop in the effective diffusion coefficient from ~5 × 10⁻⁹ to 1 × 10⁻⁷ cm2/s.
All the early Cast Stone data from Lockrem’s and Cooke’s work suggest iodide LI ranges from 9.13 to 10 when iodide is present at loadings of 1 to 50 µg /g. The iodide leachability can be effectively lowered by using silver-containing getters to LI values >11 to >12.5, dependent on the type and amount of silver-containing getter used. For the Sundaram et al. (2011) tests, the iodide LI values ranged from >7.1 to 10 at loadings of 0.08 to 1.14 µg /g with most values being between >7.4 to >7.8. As mentioned Cast Stone secondary waste simulants would have to be spiked with larger than anticipated iodide concentrations to obtain more quantitative leach data because most of the leachates collected from the various leach intervals had no detectable iodide and diffusion calculations presented are very dependent on using detection limit values.
The incremental leach interval LI values for sodium present in the Sundaram et al. (2011)’s Cast Stone waste forms (some of the sodium in the waste forms comes from the dry blend so that it is not possible to separate the contribution from the liquid waste from the total sodium) ranges from 7.3 to 10.4
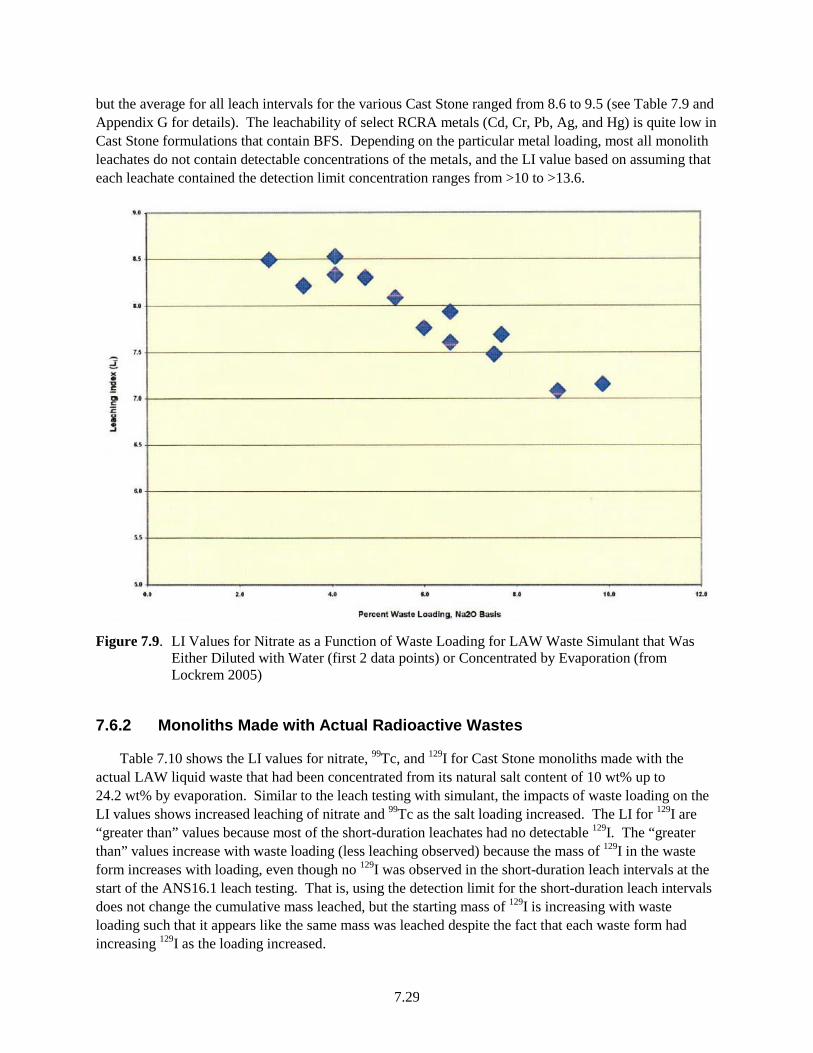
7.29
but the average for all leach intervals for the various Cast Stone ranged from 8.6 to 9.5 (see Table 7.9 and Appendix G for details). The leachability of select RCRA metals (Cd, Cr, Pb, Ag, and Hg) is quite low in Cast Stone formulations that contain BFS. Depending on the particular metal loading, most all monolith leachates do not contain detectable concentrations of the metals, and the LI value based on assuming that each leachate contained the detection limit concentration ranges from >10 to >13.6.
Figure 7.9. LI Values for Nitrate as a Function of Waste Loading for LAW Waste Simulant that Was Either Diluted with Water (first 2 data points) or Concentrated by Evaporation (from Lockrem 2005)
7.6.2 Monoliths Made with Actual Radioactive Wastes
Table 7.10 shows the LI values for nitrate, 99Tc, and 129I for Cast Stone monoliths made with the actual LAW liquid waste that had been concentrated from its natural salt content of 10 wt% up to 24.2 wt% by evaporation. Similar to the leach testing with simulant, the impacts of waste loading on the LI values shows increased leaching of nitrate and 99Tc as the salt loading increased. The LI for 129I are “greater than” values because most of the short-duration leachates had no detectable 129I. The “greater than” values increase with waste loading (less leaching observed) because the mass of 129I in the waste form increases with loading, even though no 129I was observed in the short-duration leach intervals at the start of the ANS16.1 leach testing. That is, using the detection limit for the short-duration leach intervals does not change the cumulative mass leached, but the starting mass of 129I is increasing with waste loading such that it appears like the same mass was leached despite the fact that each waste form had increasing 129I as the loading increased.
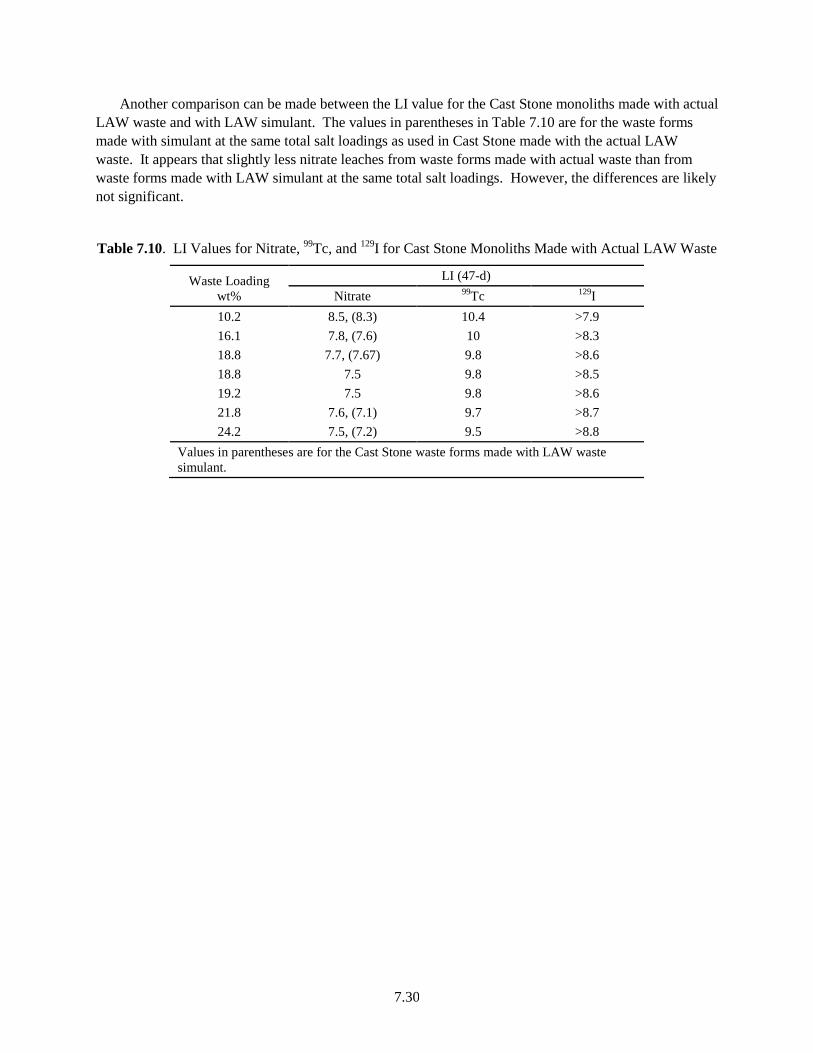
7.30
Another comparison can be made between the LI value for the Cast Stone monoliths made with actual LAW waste and with LAW simulant. The values in parentheses in Table 7.10 are for the waste forms made with simulant at the same total salt loadings as used in Cast Stone made with the actual LAW waste. It appears that slightly less nitrate leaches from waste forms made with actual waste than from waste forms made with LAW simulant at the same total salt loadings. However, the differences are likely not significant.
Table 7.10. LI Values for Nitrate, 99Tc, and 129I for Cast Stone Monoliths Made with Actual LAW Waste
Waste Loading wt%
LI (47-d) Nitrate 99Tc 129I
10.2 8.5, (8.3) 10.4 >7.9 16.1 7.8, (7.6) 10 >8.3 18.8 7.7, (7.67) 9.8 >8.6 18.8 7.5 9.8 >8.5 19.2 7.5 9.8 >8.6 21.8 7.6, (7.1) 9.7 >8.7 24.2 7.5, (7.2) 9.5 >8.8
Values in parentheses are for the Cast Stone waste forms made with LAW waste simulant.

8.1
8.0 Summary of Key Waste Form Attributes
Cast Stone appears to be a viable solidification process for Hanford secondary-waste streams based on a critical analysis of available data. The following are strengths that Cast Stone exhibits. The Cast Stone dry ingredients are relatively inexpensive, and the process of creating Cast Stone does not require complicated processes or uniquely specialized equipment. The Cast Stone waste form performance, based on the literature reviewed, readily meets low bleed-water requirements, exceeds the compressive strength requirements, passes the WAC TCLP requirements, and exhibits short-term leach attributes for sodium lower than IDF acceptance criteria. Further, the leach rates for 99Tc and most RCRA-regulated metals are quite low compared to the preliminary effective diffusion coefficient of 1 × 10⁻⁹ cm2/s. The measured short-term effective coefficients for 99Tc and most RCRA-regulated metals are at least a factor of 10 to a factor of 1000 times lower (better) than desired values. Further, the apparent short-term success that silver-based getters showed in tests performed by Lockrem et al. (2005) need to be carefully considered based on the discussion in Section 6.3.2 on the long-term stability of silver iodide in the IDF burial environment. Simulant S4 did exhibit iodide leach tendencies almost low enough to meet the currently desired LI value of 11. At this time, we do not have a firm explanation for the much better performance of Cast Stone monoliths made with S4 in terms of iodide leach tendencies. However, the presence of greater amounts of a nitrate-based calcium monosulfate aluminate in the S4-based Cast Stone waste forms may be worthy of more study. The S4-based Cast Stone monoliths also showed the lowest release of 99Tc. To date, most of the solid-phase characterization work has focused on the crystalline phases formed after the Cast Stone sets/hardens. However, the crystalline material in Cast Stone represents a small fraction (up to only ~20%) of the total solid (see Mattigod et al. 2011 for details). Thus, future studies should place more emphasis on the amorphous C-S-H phase. The hope would that basic studies directed toward understanding the amorphous gel phase and its association with the key COCs would improve our understanding on the influence that the C-S-H gel has on waste loading and retention of COCs.
The database for Cast Stone performance is quite extensive compared to that for the other three candidate waste solidification processes: Ceramicrete—phosphate bonded ceramic, DuraLith—alkali alumino-silicate geopolymers, and FBSR—granular product encapsulated within geopolymers. The solidification of liquid wastes in Cast Stone is a mature process in comparison with the other three candidates. When one considers the extensive literature on the use of cementitious material in the construction industry, the available database is very large, and the understanding of how to tailor cementitious material formulations to yield desired physical and, to some extent, chemical properties is robust. Based on such studies, especially those cited in this data package, it should be possible to optimize a Cast Stone dry blend formulation for most secondary waste streams within reasonable time and budget constraints. As mentioned, the process of making Cast Stone waste forms is relatively simple, and the equipment needed is available and relatively inexpensive. Successful production of Cast Stone or Saltstone has been demonstrated from lab-scale monoliths with volumes of cm3 through 210-liter sized drums, to m3 sized blocks, and all the way to the large pours into vaults at Savannah River. Over 9 million gallons of low-activity liquid waste has been solidified and disposed at Savannah River.
Areas that require more attention should Cast Stone be chosen as the preferred waste form candidate include studies on the effects of the high ammonium and dissolved aluminum concentrations in projected secondary waste streams. The ammonium cation in the liquid waste streams is converted to ammonia gas during the mixing of the Cast Stone dry ingredients as well as during the hydration process that
8.2
culminates in set. Worker safety issues and the possible effects of the gas volatilization, causing overpressurization in the waste containers during curing, need to be addressed. The dissolved aluminum concentration in the secondary waste streams can cause extra heat to be generated and affect the timing of the hydration reactions that cause the wet, rather fluid slurry to become more viscous and to eventually set up and harden into the final “rock like” waste form. The production of excess heat can cause heat-induced cracking in the final hardened waste form as the temperature returns to ambient. Further, the time of set and hardening and the overall time for completion of the hydration reactions that lead to the calcium aluminosilicate gel formation are influenced by the aluminum concentration in the liquid wastes. Fortunately, there is a lot of empirical data and physico-chemical understanding of the hydration process that can be brought to bear on optimizing the Cast Stone formulation to handle a range of dissolved aluminum concentrations.
The other issue that we discovered during the critical review of the literature is that the PNNL Phase I and early Phase II work was capable of waste loadings of only ~8 to 9 wt% with dry waste salt loadings of only 1 to 4.6 wt% while other Hanford and Savannah River workers successfully created Cast Stone/Saltstone waste forms that contained 37 to 56 wt% liquid waste loadings or 10 to 22 wt% dry salt loadings. Fortunately, the most recent Cast Stone waste forms made with S1 simulant at sodium concentrations from 2 to 6 M improved the dry salt waste loading to values between 3.4 to 13.5 wt%. The higher loadings attained in this last Phase II endeavor and by others suggest that Cast Stone optimization can significantly increase the amount of secondary liquid waste that can be placed in the final product. This will help improve the cost of secondary waste immobilization. However, the optimization activities should always keep in mind the general trends/observations noted in the Mattus and Gilliam (1994) review: “In summary, performance of the grout decreases as the waste loading increases, becoming weaker and more leachable” and that “Cement is a ‘living material’ which reacts to its environment under various circumstances. What is clear from the literature search is that BFS slag-fly ash-based waste forms, sometimes referred to as a “low-tech option,” are anything but simple from the standpoint of waste form chemistry.” The effects of total dry salt loading on the leachability of nitrate and on compressive strength for Cast Stone made with LAW simulant are discussed in Section 7.4.2. In general, increasing the dry salt waste loading from 10 wt% to 24.2 wt% increased nitrate leachability by a factor of 20. However, increasing the dry salt loading from 6.5 to 13.2 wt% improved compressive strength, and only when waste loading was increased above 13.2 wt% did the compressive strength start to diminish. In addition, the compressive strengths of the early Hanford Cast Stone waste form for all waste loadings were at least three times greater than the required 500 psi (3.45 MPa).
Other generalizations gleaned from this critical literature review include the following. First, we want to state that there is a vast amount of data on the “theoretical” aspects of cement hydration in the literature, albeit most of it is for reaction with “pure” water as opposed to “caustic salt brines” that can be used to guide Cast Stone formulations. Observations based on salt brine work include the fact that as the degree of hydration increases, higher values of compressive strength and lower values of total porosity are created. The higher degree of hydration in turn leads to improved performance of other properties, such as decreases in the release of radionuclides into the environment. Cast Stone/Saltstone performance properties may be improved by increasing the wt% of BFS at the expense of fly ash in the blended cementitious mix and by decreasing the free water/dry blend ratio of the paste. However, decreasing the free water-to-dry blend ratio has limitations based on workability issues. The heat capacity coupled with the data on the heat of hydration can be used to predict the maximum temperature increase given empirical thermal models available in the literature. Should the Cast Stone be chosen for further study

8.3
and if the waste packages are larger than 210-liter sized drums, it would be prudent to explore the use of similar thermal models to evaluate whether internal drum temperatures would rise to levels that could cause thermal cracking to occur before the drums returned to ambient conditions. At Savannah River, it was found that the simple law of mixtures could be used successfully to predict the heat capacities of the Saltstone from the individual dry mix ingredients, and the results were in excellent agreement with experimental data. Thus, the simple law of mixtures can be used to predict the heat capacities of Saltstone dry blend mixes in those cases where measurements have not been made.
After review of all the potential performance criteria that Cast Stone might have to meet, the following regulatory issue was identified. The pore water of freshly manufactured Cast Stone has a pH that generally exceeds the EPA definition of “corrosive” (EPA 2008), but with time and exposure to air and infiltrating water, the pore water pH will drop below 12.5, the value of concern.
One word of caution was expressed by Savannah River Saltstone personnel contacted during this data package preparation—“processability” issues are more frequent and time consuming than generally acknowledged. Quality assurance, quality control and product verification efforts for Cast Stone/Saltstone also require years of effort and need to be factored in long before the waste form is required and throughout the ensuing production.

9.1
9.0 References
40 CFR Subpart 268.48 2010. Title 40, Protection of Environment, Subpart 268.48, “Universal Treatment Standards.” Code of Federal Regulations, U.S. Environmental Protection Agency, Washington, D.C.
49 CFR Part 173. 2010. Title 49, Transportation, Part 173, “Shippers—General Requirements for Shipments and Packagings,” Subpart I--Class 7 (Radioactive) Materials.” Code of Federal Regulations, U.S. Environmental Protection Agency, Washington, D.C.
Allen PG, GS Siemering, DK Shuh, JJ Bucher, NM Edelstein, CA Langton, SB Clark, T Reich, and MA Denecke. 1997. “Technetium Speciation in Cement Waste Forms Determined by XANES.” Radiochimica Acta 76:77-86.
Aloy A, EN Kovarskaya, JR Harbour, CA Langton, and E W Holtzscheiter. 2007. “Pretreatment of Tc-Containing Waste and Its Effect on Tc-99 Leaching From Grouts.” In: Materials Research Society Symposium Proceedings Vol. 985, Paper #NN10-02, Materials Research Society, Pittsburgh, Pennsylvania.
Aloy AS, JR Harbour, EW Holtzscheiter, and CA Langton. 2008. “Evaluation of Durability of Mortars and Concretes Used in Ancient Structures.” In: Materials Research Society Symposium Proceedings Vol. 1107, Paper #127, Materials Research Society, Pittsburgh, Pennsylvania.
ANSI—American National Standards Institute. 2003. Measurement of the Leachability of Solidified Low Level Radioactive Waste by a Short-Term Test Procedure. American Nuclear Society, La Grange Park, Illinois.
ASTM International. 2008a. “ASTM Standard Specification for Coal Fly Ash and Raw or Calcined Natural Pozzolan for Use in Concrete (C 618).” In: Annual Book of ASTM Standards, Vol. 04.01, West Conshohocken, Pennsylvania
ASTM— American Society for Testing and Materials. 2008b. Standard Test Method for Accelerated Leach Test for Diffusive Releases from Solidified Waste and a Computer Program to Model Diffusive, Fractional Leaching from Cylindrical Waste Forms. ASTM C 1308, West Conshohocken, Pennsylvania.
ASTM International. 2008c. “ASTM Standard Specification for Coal Fly Ash and Raw or Calcined Natural Pozzolan for Use in Concrete (C 618).” In: Annual Book of ASTM Standards, Vol. 04.01, West Conshohocken, Pennsylvania.
ASTM—American Society for Testing and Materials. 2009a. Standard Test Method for Compressive Strength of Cylindrical Concrete Specimens. ASTM C39/C39M, West Conshohocken, Pennsylvania.
ASTM International. 2009e. “ASTM Standard Specification for Portland Cement (C 150).” In: Annual Book of ASTM Standards. Vol. 04.01, West Conshohocken, Pennsylvania. Atkins M and FP Glasser. 1992. “Application of Portland Cement-based Materials to Radioactive Waste Immobilization.” Waste Management 12(2-3):105-131.

9.2
Berner UR. 1986. “Modeling Porewater Chemistry in Hydrated Portland Cement.” In: Materials Research Society Symposium Proceedings 84:319-330. Materials Research Society, Pittsburgh, Pennsylvania. doi:10.1557/PROC-84-319.
Bogue RH. 1929. “Calculation of the compounds in Portland Cement.” Industrial and Engineering Chemistry Analytical Edition 1:192-196.
Bronikowski MG, AD Cozzi, RE Eibling, CA Nash, AR Marinik, and JR Zamecnik. 2006. Isopar® L Release Rates From Saltstone Using Simulated Salt Solutions. WSRC-TR-2005-00568 Rev. 0, Savannah River National Laboratory, Aiken, South Carolina.
Burbank DA. 2005. Waste Acceptance Criteria for the Immobilized Low-Activity Waste Disposal Facility. RPP-8402 Rev. 1, CH2M HILL Hanford Group, Inc., Richland, Washington.
Cementitious Barriers Partnership. 2009a. Overview of the U.S. Department Of Energy and Nuclear Regulatory Commission Performance Assessment Approaches. CBP-TR-2009-001, Rev.0, electronic copy of this document is available through links on the following website: http://cementbarriers.org.
Cementitious Barriers Partnership. 2009b. Review of Mechanistic Understanding and Modeling and Uncertainty Analysis Methods for Predicting Cementitious Barrier Performance. CBP-TR-2009-002, Rev.0, electronic copy of this document is available through links on the following website: http://cementbarriers.org.
Clark SB and EL Wilhite. 1990. Low-Level Liquid Waste Disposal at the Savannah River Site: A Large Scale Demonstration of Saltstone. WSRC-MS-90- 210, paper presented at Waste Management 91, February 24-28, 1991, Tucson, Arizona.
Clark BA, DG Atteridge, M Avila, VR Baca, KM Bishop, GA Cooke, LL Lockrem, RJ Lee, and MR Silsbee. 2005. “Development of a Cast Stone Formulation for Hanford Tank Wastes.” Presented at the RemTech 2005 Symposium, October 19-21, Banff, Alberta. CH2M Hill Hanford Group, Inc., Richland, Washington. Available at: RPP-RPT-27297-FP (Full Paper).
Cooke GA and LL Lockrem. 2005. Effluent Treatment Facility Waste Stream Stabilization Testing. RPP-RPT-26851, Revision 0, CH2M Hill Hanford Group, Inc., Richland, Washington.
Cooke GA, LL Lockrem, M Avila, and RA Westberg. 2006a. Effluent Treatment Facility Waste Stream Monolith Testing Phase II. RPP-RPT-31077, Revision 0, CH2M Hill Hanford Group, Inc., Richland, Washington.
Cooke G, LL Lockrem, M Avila, R Westberg, MR Silsbee, GL Koci, MD Guthrie, and KJ Lueck. 2006b. “Radionuclide & Heavy Metal Waste Stream Stabilization Testing at the Hanford Site” (Abstract). RPP-31816-A, for presentation at the WM’07 33rd Waste Management Conference, Tucson, Arizona, February 25-March 01, 2007, CH2M Hill Hanford Group, Inc., Richland, Washington.
Cooke GA, LL Lockrem, MD Guthrie, KJ Lueck and M Avila. 2006c. Development and Testing of a Cement-Based Solid Waste Form Using Synthetic UP-1 Groundwater. RPP-RPT-31740, Rev. 0, CH2M Hill Hanford Group, Inc., Richland, Washington.
9.3
Cooke GA, JH Duncan, and LL Lockrem. 2008. Assessment of Technetium Leachability in Cement-Stabilized Basin 43 Groundwater Brine. RPP-RPT-39195, Rev. 0 CH2M Hill Hanford Group, Inc., Richland, Washington.
Cooke GA, JB Duncan, LMD Guthrie, and LL Lockrem. 2009. “Assessment of Pertechnetate Getters, Reductants and Stabilization.” Presented at the DOE Technical Exchange, Denver, Colorado, Washington River Protection Solutions, LLC, Richland, Washington. Available at: RPP-41231-VA.
Cozzi AD. 2004. Formulation development for Processing Tank 48H in Saltstone. WSRC-TR-2004-00477, Revision 0, Savannah River National Laboratory, Aiken, South Carolina.
Cozzi AD. 2005. Properties of Saltstone Prepared Containing H-Canyon Waste. WSRC-TR-005-00149, Revision 0, Savannah River National Laboratory, Aiken, South Carolina.
Cozzi AD, RE Eibling, AR Marinik, and JR Zamecnik. 2006. Evaluation of Organic Vapor Release from Cement-based Waste Forms. WSRC-MS-2006-00139, Savannah River National Laboratory, Aiken, South Carolina.
Cozzi AD. 2008. Saltstone CY07 TCLP Results. WSRC-STI-2008-00260, Savannah River National Laboratory, Aiken, South Carolina.
Cozzi AD. 2009a. Saltstone 1QCY08 TCLP Results. SRNL-STI-2008-00491, Revision 0, Savannah River National Laboratory, Aiken, South Carolina.
Cozzi AD. 2009b. Saltstone 3QCY08 TCLP Results. SRNL-STI-2009-00208, Revision 0, Savannah River National Laboratory, Aiken, South Carolina.
Cozzi AD. 2009c. Saltstone 4QCY08 TCLP Results. SRNL-STI-2009-00286, Revision 0, Savannah River National Laboratory, Aiken, South Carolina.
Criscenti LJ and RJ Serne. 1990. "Thermodynamic Modeling of Cement/Groundwater Interactions as a Tool for Long-Term Performance Assessment." In: Scientific Basis for Nuclear Waste Management XIII. VM Oversby and PW Brown, Editors. In: Materials Research Society Symposium Proceedings 176:81-90. Materials Research Society, Pittsburgh, Pennsylvania.
Denham M. 2008. Thermodynamic and Mass Balance Analysis of Expansive Phase Precipitation in Saltstone. WSRC-STI-2008-00236, Savannah River National Laboratory, Aiken, South Carolina.
Dixon K and M Phifer. 2008. Hydraulic and Physical Properties of MCU Saltstone. WSRC-STI-2007-00649, Revision 0, Savannah River National Laboratory, Aiken, South Carolina.
Dixon K, J Harbour, and M Phifer. 2008. Hydraulic and Physical Properties of Saltstone Grouts and Vault Concretes. SRNL-STI-2008-00421, Revision 0, Savannah River National Laboratory, Aiken, South Carolina.
DOE−U.S. Department of Energy. 2010. River Protection Project System Plan. ORP-11242, Revision 5, U.S. Department of Energy, Office of River Protection, Richland, Washington.
DOE−U.S. Department of Energy. 2011. Justification of Mission Need for the Secondary Liquid Waste Treatment Project. U.S. Department of Energy, Office of River Protection, Richland, Washington.

9.4
Duncan JB and SP Burke. 2008. Results of IONSIV® IE-95 Studies for the Removal of Radioactive Cesium from KE Basin Spent Nuclear Fuel Pool During Decommissioning Activities. CH2M Hill Hanford Group, Inc., Richland, Washington. Available at: RPP-RPT-37055, Revision 0.
Duncan JB, Cooke, LL Lockrem, MD Guthrie, and KJ Lueck. 2009. Assessment of Technetium GA Leachability in Cement-Stabilized Basin 43 Groundwater Brine. RPP-RPT-39195, Revision 1, Washington River Protection Solutions, Richland, Washington.
EPA—U.S. Environmental Protection Agency. 2000. Toxicity Characteristics Leaching Procedure. SW-846 Method 1311 for VOCs, SVOCs, Chlorinated Pesticides, Herbicides, Metals, and Mercury. Cincinnati, Ohio.
EPA—U.S. Environmental Protection Agency. 2008. Methods for Evaluating Solid Waste, Physical/Chemical Methods. SW-846, U. S. Environmental Protection Agency, Washington, D.C. Available online at http://www.epa.gov/wastes/hazard/testmethods/sw846/pdfs/chap8.pdf.
EPA—U.S. Environmental Protection Agency. 2009a. Leaching Test (Liquid-Solid Partitioning as a Function Liquid to Solid Ratio) of Constituents in Solid Materials Using a Parallel Batch Extraction Test. Draft Method 1313, Washington, D.C.
EPA—U.S. Environmental Protection Agency. 2009b. Leaching Test (Liquid-Solid Partitioning as a Function of Extract pH) of Constituents in Solid Materials Using a Parallel Batch Extraction Test. Draft Method 1316, Washington D.C.
EPA—U.S. Environmental Protection Agency. 2009c. Mass Transfer Rates of Constituents in Monolith or Compacted Granular Materials Using a Semi-Dynamic Tank Leaching Test. Draft Method 1315, Washington D.C.
Francis A J. 1977. The Cement Industry 1796-1914, David & Charles Publishing, Devon, United Kingdom.
Gilliam TM, RD Spence, WD Bostick and JL Shoemaker. 1990. “Solidification/Stabilization of Technetium in Cement-Based Grouts.” Journal of Hazardous Materials 24:189-197.
Guthrie MD, GA Cooke, JB Duncan, and LL Lockrem. 2009. “Assessment of Pertechnetate Getters, Reductants, and Stabilization.” RPP-41321-VA, Revision 0, Washington River Protection Solutions, Richland, Washington.
Harbour JR and AS Aloy. 2007. “International Program: Summary Report on the Properties of Cementitious Waste Forms.” WSRC-STI-2007-00056, Revision 0, Savannah River National Laboratory, Aiken, South Carolina.
Harbour JR and VJ Williams. 2008a. Measurement of Specific Heat Capacity of Saltstone. SRNS-STI-2008-00102, Revision 0, Savannah River National Laboratory, Aiken, South Carolina.
Harbour JR and VJ Williams. 2008b. Measurement of Waste Loading in Saltstone. WSRC-STI-2008-00336, Savannah River National Laboratory, Aiken, South Carolina.
Harbour JR and TB Edwards. 2009. Performance Properties of Saltstone Produced Using SWPF Simulants. SRNL-STI-2009-00810, Revision 0, Savannah River National Laboratory, Aiken, South Carolina.
9.5
Harbour JR, TB Edwards, T Lorier, CA Langton, RC Moore, JL Krumhansl, KC Holt, F Salas, and CA Sanchez. 2004. Stabilizing Grout Compatibility Study. WSRC-TR-2004-00021, Revision 0, Savannah River National Laboratory, Aiken, South Carolina.
Harbour JR, EK Hansen, TB Edwards, VJ Williams, RE Eibling, DR Best and DM Missimer. 2006a. Characterization of Slag, Fly Ash and Portland Cement for Saltstone. WSRC-TR-2006-00067, Revision 0, Savannah River National Laboratory, Aiken, South Carolina.
Harbour JR, EK Hansen, TB Edwards, and VJ Williams. 2006b. Effects of Temperature and CSSX Organics on Saltstone Processing Properties. WSRC-TR-2006-00075, Revision 0, Savannah River National Laboratory, Aiken, South Carolina.
Harbour JR, CA Langton, EW Holtzscheiter, AS Aloy, and EN Kovarskaya. 2006c. Pretreatment of Tc-Containing Waste and Its Effect on 99Tc Leaching From Grouts. WSRC-STI-2006-00310, Revision 1, Savannah River National Laboratory, Aiken, South Carolina.
Harbour JR, TB Edwards, VJ Williams, GW Scherer and DM Feliciano. 2007a. Permeability of Saltstone – Measurement by Beam Bending. WSRC-TR-2007-00437, Revision 0, Savannah River National Laboratory, Aiken, South Carolina.
Harbour JR, TB Edwards, EK Hansen and VJ Williams. 2007b. Impact of Aluminate Ions on the Properties of Saltstone Grout Mixes. WSRC-STI-2007-00506, Revision 0, Savannah River National Laboratory, Aiken, South Carolina.
Harbour JR, VJ Williams, and TB Edwards. 2007c. Heat of Hydration of Saltstone Mixes–Measurement by Isothermal Calorimetry. WSRC-STI- 2007-00263, Revision 0, Savannah River National Laboratory, Aiken, South Carolina.
Harbour JR, VJ Williams, TB Edwards, RE Eibling and RF Schumacher. 2007d. Saltstone Variability Study – Measurement of Porosity. WSRC-STI-2007-00352, Revision 0, Savannah River National Laboratory, Aiken, South Carolina.
Harbour JR, TB Edwards, EK Hansen and VJ Williams. 2008. Impact of Aluminate Ions on the Properties of Saltstone Grout Mixes. WSRC-STI-2008-00099, Westinghouse Savannah River Company, Aiken, South Carolina.
Harbour JR, TB Edwards, and VJ Williams. 2009a. Impact of Time/Temperature Curing Conditions and Aluminate Concentration on Saltstone Properties. SRNL-STI-2009-00184, Revision 0, Savannah River National Laboratory, Aiken, South Carolina.
Harbour JR, TB Edwards, and VJ Williams. 2009b. Key Factors That Influence the Performance Properties of ARP/MCU Saltstone Mixes. SRNL-STI-2009-00546, Revision 0, Savannah River National Laboratory, Aiken, South Carolina.
Harbour JR, TB Edwards, and VJ Williams. 2009c. The Impact of Dissolved Salts on Pastes Containing Fly Ash, Cement and Slag. SRNL-STI-2009-00583, Savannah River National Laboratory, Aiken, South Carolina.
Harris SP and RL Postles. 1991. Statistical Experimental Design for Saltstone Mixtures. WSRC-MS-91-560, Savannah River National Laboratory, Aiken, South Carolina.
9.6
Hill D. 1984. A History of Engineering in Classical and Medieval Times. Routledge Publishing, Taylor & Francis, London, United Kingdom.
Josephson GB, LM Bagaasen, JGH Geeting, PA Gauglitz, GJ Lumetta, and JS Tixier. 2003. Hanford Mission Acceleration Initiative – Preliminary Testing Recommendations for Supplemental Treatment. PNNL-14005, Revision 1, Pacific Northwest National Laboratory, Richland, Washington.
Kaplan DI. 2003. Estimated Duration of the Subsurface Reducing Environment Produced by the Z-Area Saltstone Disposal Facility. WSRC-RP-2003-00362, Revision 1, Westinghouse Savannah River Company, Aiken, South Carolina.
Kaplan DI, T Hang, and SE Aleman. 2005. Estimated Duration of the Reduction Capacity Within a High-Level Waste Tank (U). WSRC-RP-2005-01674, Revision 0, Westinghouse Savannah River Company, Aiken, South Carolina.
Kaplan DI, K Roberts, J Coates, M Siegfried, and S Serkiz. 2008. Saltstone and Concrete Interactions with Radionuclides: Sorption (Kd), Desorption, and Reduction Capacity Measurements. SRNS-STI-2008-00045, Savannah River National Laboratory, Aiken, South Carolina.
Koci GI. 2005. Conceptual Design Report for Effluent Treatment Facility Solidification Treatment Unit. HNF-26914, Rev 0, Fluor Hanford, Richland, Washington.
Krupka KM and RJ Serne. 1996. Performance Assessment of Low-Level Radioactive Waste Disposal Facilities: Effects on Radionuclide Concentrations by Cement/Ground-Water Interactions. NUREG/CR-6377, U. S. Nuclear Regulatory Commission, Washington, D.C. Langton CA. 1980. Longevity of Borehole and Shaft Sealing Materials: 2, Characterization of Cement-Based Ancient Building Material. ONWI -202, Office on Nuclear Waste Isolation, Battelle Memorial Institute, Columbus, Ohio.
Langton CA. 1988. “Challenging Applications for Hydrated and Chemical Reacted Ceramics.” DP-MS-88-163, presentation given at American Ceramic Society Meeting, Sydney, Australia, July 12, 1988.
Langton CA and PB Wong. 1991. “Properties of Slag Concrete for Low-Level Waste Containment.” WSRC-MS--91-073, Paper for presentation at American Concrete Institute Spring Meeting, March 17-21.
Langton CA. 1998. Direct Grout Stabilization of High Cesium Salt Waste: Salt Alternative Phase 111 Feasibility Study. WSRC-TR-98-00337, Revision 0, Savannah River National Laboratory, Aiken, South Carolina.
Langton CA, SK Plunkett, and EA Mansfield. 2002. Saltstone Formulation Evaluation, WSRC-TR-2002-00275, Savannah River National Laboratory, Aiken, South Carolina.
Langton CA. 2003. Technical Basis for LCS Saltstone Disposal Vault Classification. WSRC-TR-2003-00431, Rev. 0, Savannah River National Laboratory, Aiken, South Carolina.
Langton CA. 2007. Functional Performance Requirements for Components in the Saltstone Premix. SRNL-PSE-2007-00282, Savannah River National Laboratory, Aiken, South Carolina.
9.7
Langton CA. 2008. Literature Review of In-Drum Cement Waste Form Processing. WSRC-STI-2008-00195 Revision 0, Savannah River National Laboratory, Aiken, South Carolina.
Langton, CA. 2009a. Evaluation of Sulfate Attack on Saltstone Vault Concrete and Saltstone. SRNL-STI-2008-00050 Revision 1, Savannah River National Laboratory, Aiken, South Carolina.
Langton CA. 2009b. Saltstone Matrix Characterization and STADIUM Simulation Results. SRNS-STI-2009-00477, Revision 0, Savannah River National Laboratory, Aiken, South Carolina.
Langton, CA. 2010. Saltstone Characterization and Parameters for Performance Assessment Modeling: Simco Technologies, Inc. Task 6 Report Update. SRNL-STI-2010-00515 Revision 0, Savannah River National Laboratory, Aiken, South Carolina.
Langton CA, RD Spence, and J Barton. 2001. “State of the Art Report on High-Level Waste Tank Closure.” WSRC-TR-2001-00359, Revision 0, Savannah River National Laboratory, Aiken, South Carolina.
Langton CA, EK Hansen, PR Burket, DM Marsh, DP Healy, and JG Wheeler. 2006. Tank 50 Batch 0 Saltstone Formulation Confirmation (U). WSRC-TR-2006-00226, Revision 0, Savannah River National Laboratory, Aiken, South Carolina.
Langton CA, G Flach, H Burns, D Kosson, K Brown, A Garrabrants, H van der Sloot, JCL Meeussen, E Garboczi, JW Bullard, PE Stutzman, E Samson, J Marchand, P Mallick, L Suttora, D Esh, M Fuhrmann and J Philip. 2010. Cementitious Barriers Partnership Accomplishments and Relevance to the DOE Complex. SRNL-STI-2010-00735, paper given at WM2011 Conference, March 2-6, Phoenix, Arizona.
Lockrem LL. 2005. Hanford Containerized Cast Stone Facility Task 1-Process Testing and Development Final Report. RPP-RPT-26742 Revision 0, CH2M Hill Hanford Group, Inc., Richland, Washington.
Lockrem LL, GA Cooke, and M Johnson. 2003. Cast Stone Technology for Treatment and Disposal of Iodine-Rich Caustic Waste Demonstration Test Plan. RPP-18853, Revision 0, CH2M Hill Hanford Group, Inc., Richland, Washington.
Lockrem LL, GA Cooke, BA Clark, and R West. 2005. Cast Stone Technology for Treatment and Disposal of Iodine-Rich Caustic Waste Demonstration-Final Report. RPP-RPT-26725 Revision 0, CH2M Hill Hanford Group, Inc., Richland, Washington.
Lukens WW, JJ Bucher, DK Shuh, and NM Edelstein. 2005. “Evolution of Technetium Speciation in Reducing Grout.” Environmental Science & Technology 39:8064-8070.
Mahoney LA and RL Russell. 2004. Letter Report: Vitrification Offgas Caustic Scrubber Secondary Waste Simulant Formulation. PNNL-14582, Revision 1, Pacific Northwest National Laboratory, Richland, Washington.
Mann FM, RJ Puigh, R Khaleel, S Finfrock, BP McGrail, DH Bacon, and RJ Serne. 2003. Risk Assessment Supporting the Decision on the Initial Selection of Supplemental ILAW Technologies. RPP-17675, Revision 0, CH2M Hill Hanford Group Inc., Richland, Washington.

9.8
Mattigod SV, JH Westsik, Jr., CW Chung, MJ Lindberg and KE Parker. 2011. Waste Acceptance Testing of Secondary Waste Forms: Cast Stone, Ceramicrete and DuraLith. PNNL-20632, Pacific Northwest National Laboratory, Richland, Washington.
Mattus CH and TM Gilliam. 1994. A Literature Review of Mixed Waste Components: Sensitivities and Effects Upon Solidification/Stabilization in Cement-Based Matrices. ORNL/TM-12656, Oak Ridge National Laboratory, Oak Ridge, Tennessee.
Meeussen JCL, HA van der Sloot, DS Kosson, and S Sarkar. 2010. Demonstration of Leachxs™/Orchestra Capabilities by Simulating Constituent Release From a Cementitious Waste Form in a Reinforced Concrete Vault. CBP-TR-2010-007-C1, Rev. 0. Electronic copy of this document is available through links on the following website: http://cementbarriers.org.
Milestone NB, Y Bai, PR Borges, NC Collier, J-P Gorce, LE Gordon, A Setiadi, CA Utton, and Q Zhou. 2006. “Reactions in Cemented Nuclear Waste forms—the Need for a Toolbox of Different Cement Types.” In: Materials Research Society Symposium Proceedings. Vol. 932, Paper #40, Materials Research Society, Pittsburgh, Pennsylvania.
Neville AM. 1996. Properties of Concrete. Fourth Edition. Pearson, Prentice Hall, Upper Saddle River, New Jersey.
NRC—U.S. Nuclear Regulatory Commission. 1991. Technical Position on Waste Form, Revision 1. Final Waste Classification and Waste Form Technical Position Papers. NRC, Washington, D.C.
Oblath SB. 1984. Relative Release Rates of Nitrate, Tc, Cs and Sr From Saltstone. DPST-84-620, Savannah River National Laboratory, Aiken, South Carolina.
Orebaugh EG. 1992. DWPF Saltstone Study: Effects of Thermal History on Leach Index and Physical Integrity-Part II- Final Report. WSRC-RP-92-568, Revision 1, Savannah River National Laboratory, Aiken, South Carolina.
Pierce EM, SV Mattigod, RJ Serne, JP Icenhower, RD Scheele, W Um, N Qafoku, and JH Westsik, Jr. 2010a. Review of Potential Candidate Stabilization Technologies for Liquid and Solid Secondary Waste Streams. PNNL-19122, Pacific Northwest National Laboratory, Richland, Washington.
Pierce EM, U. Um, KJ Cantrell, MM Valenta, JH Westsik, Jr, RJ Serne, and KE Parker 2010b. Secondary Waste Form Screening Test Results—Cast Stone and Alkali Alumino-Silicate Geopolymer. PNNL-19505, Pacific Northwest National Laboratory, Richland, Washington.
Powers TC and TL Brownyard. 1947. “Studies of the Physical Properties of Hardened Portland Cement Paste.” Journal of the American Concrete Institute 43(9):101-132.
Rassat, RD, LA Mahoney, RL Russell, SA Bryan, and RL Sell. 2003. Cold Dissolved Saltcake Waste Simulant Development, Preparation, and Analysis. PNNL-14194, Rev.1, Pacific Northwest National Laboratory, Richland, Washington.
Raymond RE, RW Powell, DW Hamilton, WA Kitchen, BM Mauss, and TM Brouns. 2004. Initial Selection of Supplemental Treatment Technologies for Hanford’s Low-Activity Tank Waste. RPP-19763, WM-04 Conference, February 29-March 4, 2004, Tucson, Arizona.
9.9
Reigel MM. 2010a. Saltstone 1QCY10 TCLP Results. SRNL-STI-2010-00267, Revision 0, Savannah River National Laboratory, Aiken, South Carolina.
Reigel MM. 2010b. Saltstone 2QCY10 TCLP Results. SRNL-STI-2010-00514 Revision 0, Savannah River National Laboratory, Aiken, South Carolina.
Reigel MM. 2010c. Saltstone 4QCY09 TCLP Results. SRNL-STI-2010-00096 Revision 1, Savannah River National Laboratory, Aiken, South Carolina.
Reigel MM and AD Cozzi. 2009. Saltstone 1QCY09 TCLP Results. SRNL-STI-2009-00410, Revision 0, Savannah River National Laboratory, Aiken, South Carolina.
Reigel MM, AD Cozzi, NE Bibler, CC DiPrete, JW Ray, and AV Staub. 2010. Measurements Taken in Support of Qualification of Processing Savannah River Site Low-Level Liquid Waste into Saltstone – 10160. SRNL-STI-2010-00038, WM2010 Conference, March 7 -10, Phoenix, Arizona.
Roberts KA and DI Kaplan. 2009. Reduction Capacity of Saltstone and Saltstone Components. SRNL-STI-2009-00637 Revision 0, Savannah River National Laboratory, Aiken, South Carolina.
Rogers, RD, MA Hamilton, and JW McConnell, Jr. 1993. Microbial-Influenced Degradation-Literature Review. NUREG/CR-5987, Division of Regulatory Applications, Office of Nuclear Regulatory Research, US Nuclear Regulatory Commission, Washington, DC.
Rogers, RD, MA Hamilton, RH Veeh, and JW McConnell, Jr. 1994. Microbial Degradation of Low-Level Radioactive Waste—Annual Report for FY1993. NUREG/CR-6188 Vol. 1, Division of Regulatory Applications, Office of Nuclear Regulatory Research, US Nuclear Regulatory Commission, Washington, DC.
Rogers, RD, MA Hamilton, RH Veeh, and JW McConnell, Jr. 1995. Microbial Degradation of Low-Level Radioactive Waste—Annual Report for FY1994. NUREG/CR-6188 Vol. 2, Division of Regulatory Applications, Office of Nuclear Regulatory Research, US Nuclear Regulatory Commission, Washington, D.C. Roy DM and CA Langton. 1989. Studies of Ancient Concrete as Analogs of Cementitious Sealing Materials for a Repository in Tuff, LA-11527-MS, Los Alamos Technical Report, Las Alamos, New Mexico.
Russell RL, MJ Schweiger, JH Westsik, Jr, PR Hrma, DE Smith, AB Gallegos, MR Telander, and SG Pitman. 2006. Low Temperature Waste Immobilization Testing. PNNL-16052 1, Pacific Northwest National Laboratory, Richland, Washington.
Seitz RR and JC Walton. 1993. Modeling Approaches for Concrete Barriers Used in Low-Level Waste Disposal. NUREG/CR-6070, U.S. Nuclear Regulatory Commission, Division of Regulatory Applications, Washington, D.C.
Serne RJ. 1990. "Grouted Waste Leach Tests: Pursuit of Mechanisms and Data for Long-Term Performance Assessment." In: Scientific Basis for Nuclear Waste Management XIII. VM Oversby and PW Brown, Editors. 176:91-199. Materials Research Society, Pittsburgh, Pennsylvania.
Shadday MA Jr. 1993. Heat Transfer Modeling of the Saltstone Pouring and Curing Process. WSRC-TR-93-528, Savannah River National Laboratory, Aiken, South Carolina.

9.10
Shadday MA Jr. 2008. A Thermal Model of the Immobilization of Low-Level Radioactive Waste as Grout in Concrete Vaults. SRNL-STI-2008-00410, Savannah River National Laboratory, Aiken, South Carolina.
Shuh DV, NM Edelstein, CJ Burns, WW Lukens, JJ Bucher, MG Fickes, and BL Scott. 2010. Research Program to Investigate the Fundamental Chemistry of Technetium. Final Report of U.S. Department of Energy, EMSP-60296, Lawrence Berkeley National Laboratory, Berkeley, California.
SIMCO Technologies, Inc. 2009. Report Task 6 – Characterization of a Saltstone Mixture. Subcontract no. AC48992N prepared for Savannah River National Laboratory, Aiken, South Carolina.
Smith RW and JC Walton. 1993. “The Role of Oxygen Diffusion in the Release of Technetium from Reducing Cementitious Waste Forms.” In: Materials Research Society Symposium Proceedings 294:247-253. Materials Research Society, Pittsburgh, Pennsylvania.
Sobolev IA, SA Dmitriev, AS Barinov, GA Varlakova, ZI Golubeva, IV Startceva, and MI Ojovan. 2006. “39-years Performance of Cemented Radioactive Waste in a Mound Type Repository.” In: Materials Research Society Symposium Proceedings Vol. 932, Paper #130, Materials Research Society, Pittsburgh, Pennsylvania.
Spence RD and C Shi. 2005. Stabilization and Solidification of Radioactive and Mixed Waste. CRC Press, Boca Raton, Florida.
Steimke JL and MD Fowley. 1998. Measurement of Thermal Properties of Saltstone. WSRC-TR-97-00357, Savannah River National Laboratory, Aiken, South Carolina.
Sundaram SK, J Chun, W Um, KE Parker, C-W Chung, JH Westsik Jr, ME Valenta, ML Kimura, SG Pitman, and CA Burns. 2011. Secondary Waste Form Development and Optimization—Cast Stone. PNNL-20159, Pacific Northwest National Laboratory, Richland, Washington.
Taylor HFW. 1990. Cement Chemistry. Academic Press, Burlington, Massachusetts.
Taylor HFW. 1997. Cement Chemistry, 2nd Edition. Thomas Telford Publishing, London, United Kingdom.
TTT. 2009. Report for Treating Hanford LAW and WTP SW Simulants: Pilot Plant Mineralizing Flowsheet. RT-21-002, THOR Treatment Technologies, LLC, Denver, Colorado.
WAC—Washington Administrative Code. “Dangerous Waste Regulations.” WAC 173-303. Washington Administrative Code, Olympia, Washington. Available online at: http://apps.leg.wa.gov/wac/default.aspx?cite=173-303.
WAC—Washington Administrative Code. “Land Disposal Restrictions.” WAC 173-303-140. Washington Administrative Code, Olympia, Washington. Available online at http://apps.leg.wa.gov/wac/default.aspx?cite=173-303-140.
Wagman, DD, WH Evans, VB Parker, RH Shumm, I Halow, SM Bailey, KL Churney, and RL Nuttall. 1982. “The NBS Tables of Chemical Thermodynamic Properties. Selected Values for Inorganic and C1 and C2 Organic Substances in SI Units.” Journal of Physical and Chemical Reference Data:11(Supplement No. 2):1-392

9.11
Walton JC. 1992. Performance of Intact and Partially Degraded Concrete Barriers in Limiting Mass Transport. NUREG/CR-5445, U.S. Nuclear Regulatory Commission, Division of Regulatory Applications, Washington, D.C.
Walton JC and RR Seitz. 1991. Performance of Intact and Partially Degraded Concrete Barriers in Limiting Fluid Flow. NUREG/CR-5614, U.S. Nuclear Regulatory Commission, Division of Regulatory Applications, Washington, D.C.
Walton JC, LE Plansky, and RW Smith. 1990. Models for Estimation of Service Life of Concrete Barriers in Low-Level Radioactive Waste Disposal. NUREG/CR-5542, U.S. Nuclear Regulatory Commission, Division of Regulatory Applications, Washington, D.C.
Wang L, E Martens, D Jacques, P De Cannière, J Berry, and D Mallants. 2009. Review of Sorption Values for the Cementitious Near Field of a Near Surface Radioactive Waste Disposal Facility. ONDRAF/NIRAS NIROND-TR, Report 2008–23 E, ONDRAF/NIRAS Brussels, Belgium.
Washington State Department of Ecology, U.S. Environmental Protection Agency and U.S. Department of Energy (Ecology, EPA, and DOE). 1989. Hanford Facility Agreement and Consent Order, As Amended. Washington State Department of Ecology, U.S. Environmental Protection Agency, and U.S. Department of Energy, Olympia, Washington.
Wieland E, CA Johnson, B Lothenbach, and F Winnefeld. 2006. “Mechanisms and Modeling of Waste/Cement Interactions – Survey of Topics Presented at the Meiringen Workshop.” Materials Research Society Symposium Proceedings Vol. 932, Paper #39, Materials Research Society, Pittsburgh, Pennsylvania.
Wilhite EL. 1986. “Waste Salt Disposal at the Savannah River Plant.” DP-MS--85-64, presentation at the ANS International Meeting: Low-, Intermediate-,and High-Level Waste Management and Decontamination and Decommissioning Meeting, September 14-18, Niagara Falls, New York.
Zamecnik JR and AD Cozzi. 2009. Measurement of Ammonia Release from Saltstone. SRNL-STI-2008-00399, Revision 0, and SRNS-STI-2008-00120, Revision 0, Savannah River National Laboratory, Aiken, South Carolina.

Appendix A
Supplemental Treatment Technology Selection Decision Goals, Criteria, Measures, Technology
Issues, and Testing Objectives


A.
Table A.1. Supplemental Treatment Technology Selection Decision Goals, Criteria, and Measures(a)
Goal Criterion Measures Data Package Contents
Ensure worker and public safety Achieve inherently safe system Independent safety expert assessment Process description, equipment description, process temperatures, hazardous chemicals, worker dose, hydrogen generation, process effluents, flammable gases
Provide environmental protection comparable to current vitrified waste disposal plan
Waste form performance Flux at points of undisturbed soil and bottom of the waste packages
See next table
Disposal space required Acres of land for disposal site Waste loading, density, package design
Secondary wastes produced Potential to emit (PTE) constituents: solid waste volume, liquid waste volume
Process description, flowsheet description, off-gas generation, and secondary wastes expected
Maximize schedule acceleration Confidence in meeting 2028 date 50% probability data for achieving 10 gpm throughput
Unknown
Process robustness Metric tons of sodium (Na) processed by 2028
Range of wastes compositions tested, waste loading range, concentration (water content), sodium molarity
Maximize cost effectiveness Life cycle cost Life cycle cost Process description, flowsheet description, off-gas generation, and secondary wastes expected, dry materials description. Reference/cite cost data if located in literature
Peak year cost Peak year cost Process description, flowsheet description, off gas generation, and secondary wastes expected, dry materials description

A.
Table A.1. (contd)
Goal Criterion Measures Data Package Contents Maximize operability Operability risk Independent expert assessment to
include: number of unit operations; equipment count, etc.
Process description, flowsheet description
Minimize overall system interface impacts
System interface impacts Liquid effluent greater that ETF capacity
Secondary waste is at back end. ETF upgrade to provide capacity
Dose of waste package (impacting handling within disposal system
NA
Volume returned to double-shell tanks (impacting stored waste volume)
NA
(a) Raymond RE, RW Powell, DW Hamilton, WA Kitchen, BM Mauss, and TM Brouns. 2004. Initial Selection of Supplemental Treatment Technologies for Hanford’s Low-Activity Tank Waste. RPP-19763, WM-04, Waste Management Conference, February 29-March 4, Tucson, Arizona.
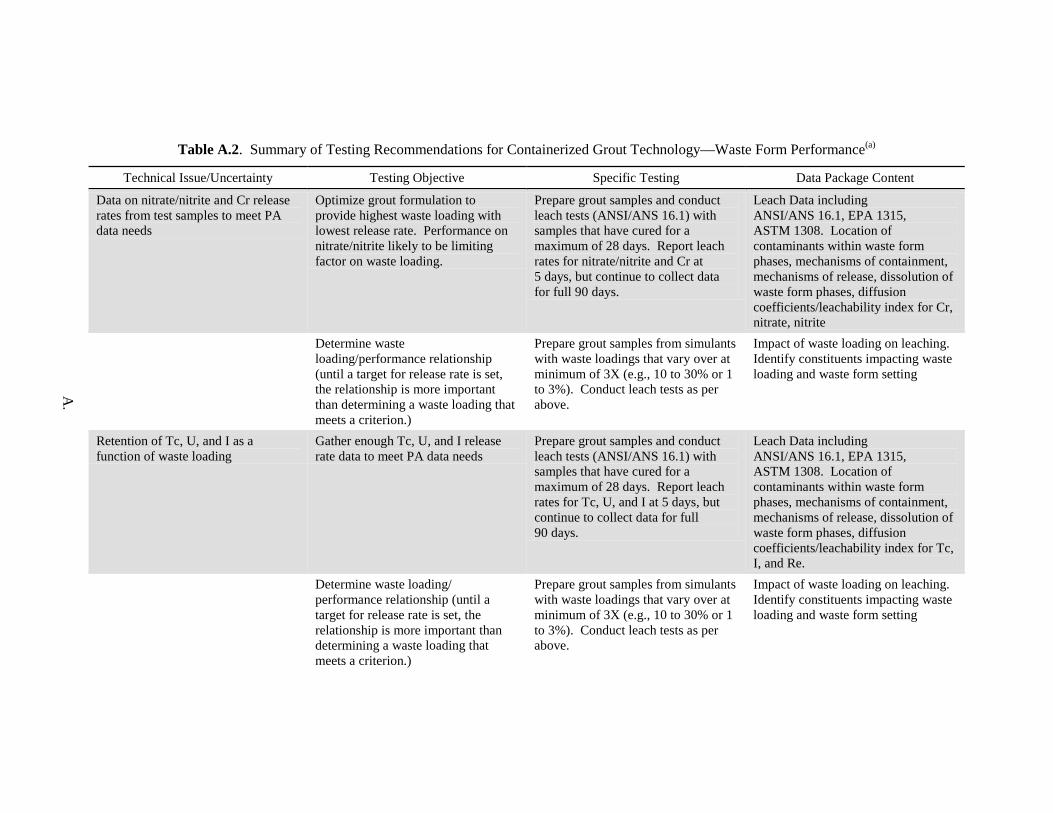
A.
Table A.2. Summary of Testing Recommendations for Containerized Grout Technology—Waste Form Performance(a)
Technical Issue/Uncertainty Testing Objective Specific Testing Data Package Content
Data on nitrate/nitrite and Cr release rates from test samples to meet PA data needs
Optimize grout formulation to provide highest waste loading with lowest release rate. Performance on nitrate/nitrite likely to be limiting factor on waste loading.
Prepare grout samples and conduct leach tests (ANSI/ANS 16.1) with samples that have cured for a maximum of 28 days. Report leach rates for nitrate/nitrite and Cr at 5 days, but continue to collect data for full 90 days.
Leach Data including ANSI/ANS 16.1, EPA 1315, ASTM 1308. Location of contaminants within waste form phases, mechanisms of containment, mechanisms of release, dissolution of waste form phases, diffusion coefficients/leachability index for Cr, nitrate, nitrite
Determine waste loading/performance relationship (until a target for release rate is set, the relationship is more important than determining a waste loading that meets a criterion.)
Prepare grout samples from simulants with waste loadings that vary over at minimum of 3X (e.g., 10 to 30% or 1 to 3%). Conduct leach tests as per above.
Impact of waste loading on leaching. Identify constituents impacting waste loading and waste form setting
Retention of Tc, U, and I as a function of waste loading
Gather enough Tc, U, and I release rate data to meet PA data needs
Prepare grout samples and conduct leach tests (ANSI/ANS 16.1) with samples that have cured for a maximum of 28 days. Report leach rates for Tc, U, and I at 5 days, but continue to collect data for full 90 days.
Leach Data including ANSI/ANS 16.1, EPA 1315, ASTM 1308. Location of contaminants within waste form phases, mechanisms of containment, mechanisms of release, dissolution of waste form phases, diffusion coefficients/leachability index for Tc, I, and Re.
Determine waste loading/ performance relationship (until a target for release rate is set, the relationship is more important than determining a waste loading that meets a criterion.)
Prepare grout samples from simulants with waste loadings that vary over at minimum of 3X (e.g., 10 to 30% or 1 to 3%). Conduct leach tests as per above.
Impact of waste loading on leaching. Identify constituents impacting waste loading and waste form setting
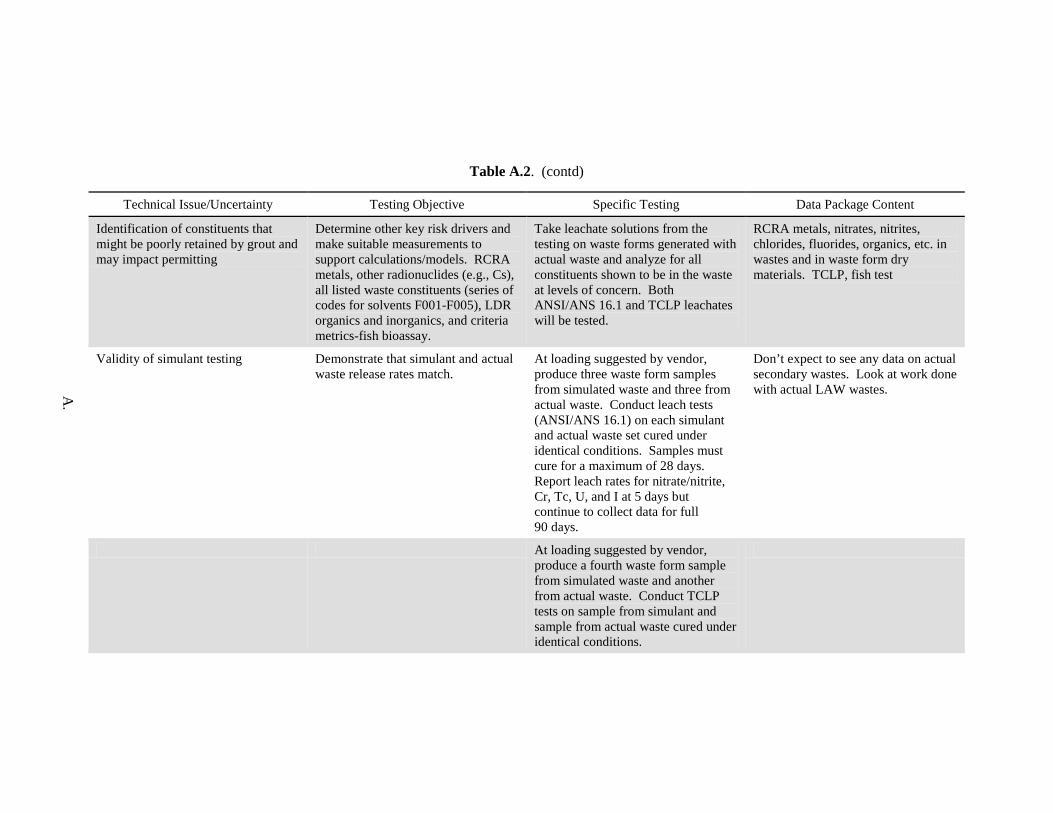
A.
Table A.2. (contd)
Technical Issue/Uncertainty Testing Objective Specific Testing Data Package Content
Identification of constituents that might be poorly retained by grout and may impact permitting
Determine other key risk drivers and make suitable measurements to support calculations/models. RCRA metals, other radionuclides (e.g., Cs), all listed waste constituents (series of codes for solvents F001-F005), LDR organics and inorganics, and criteria metrics-fish bioassay.
Take leachate solutions from the testing on waste forms generated with actual waste and analyze for all constituents shown to be in the waste at levels of concern. Both ANSI/ANS 16.1 and TCLP leachates will be tested.
RCRA metals, nitrates, nitrites, chlorides, fluorides, organics, etc. in wastes and in waste form dry materials. TCLP, fish test
Validity of simulant testing Demonstrate that simulant and actual waste release rates match.
At loading suggested by vendor, produce three waste form samples from simulated waste and three from actual waste. Conduct leach tests (ANSI/ANS 16.1) on each simulant and actual waste set cured under identical conditions. Samples must cure for a maximum of 28 days. Report leach rates for nitrate/nitrite, Cr, Tc, U, and I at 5 days but continue to collect data for full 90 days.
Don’t expect to see any data on actual secondary wastes. Look at work done with actual LAW wastes.
At loading suggested by vendor, produce a fourth waste form sample from simulated waste and another from actual waste. Conduct TCLP tests on sample from simulant and sample from actual waste cured under identical conditions.
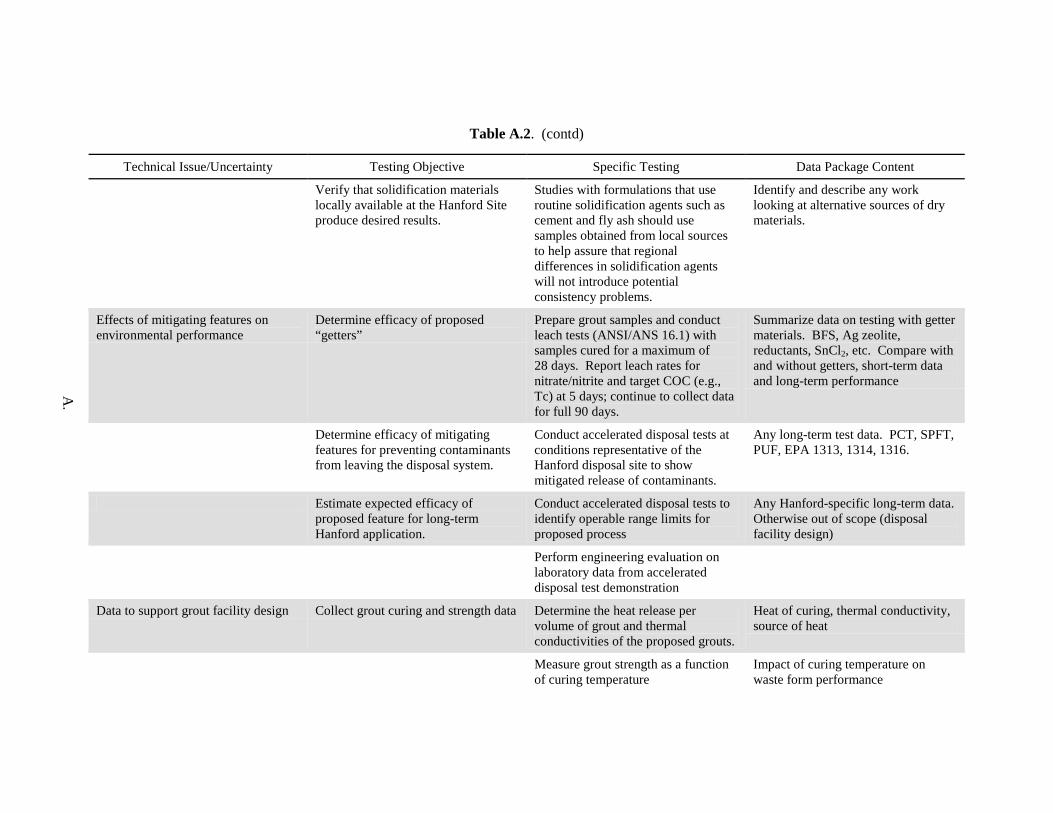
A.
Table A.2. (contd)
Technical Issue/Uncertainty Testing Objective Specific Testing Data Package Content
Verify that solidification materials locally available at the Hanford Site produce desired results.
Studies with formulations that use routine solidification agents such as cement and fly ash should use samples obtained from local sources to help assure that regional differences in solidification agents will not introduce potential consistency problems.
Identify and describe any work looking at alternative sources of dry materials.
Effects of mitigating features on environmental performance
Determine efficacy of proposed “getters”
Prepare grout samples and conduct leach tests (ANSI/ANS 16.1) with samples cured for a maximum of 28 days. Report leach rates for nitrate/nitrite and target COC (e.g., Tc) at 5 days; continue to collect data for full 90 days.
Summarize data on testing with getter materials. BFS, Ag zeolite, reductants, SnCl2, etc. Compare with and without getters, short-term data and long-term performance
Determine efficacy of mitigating features for preventing contaminants from leaving the disposal system.
Conduct accelerated disposal tests at conditions representative of the Hanford disposal site to show mitigated release of contaminants.
Any long-term test data. PCT, SPFT, PUF, EPA 1313, 1314, 1316.
Estimate expected efficacy of proposed feature for long-term Hanford application.
Conduct accelerated disposal tests to identify operable range limits for proposed process
Any Hanford-specific long-term data. Otherwise out of scope (disposal facility design)
Perform engineering evaluation on laboratory data from accelerated disposal test demonstration
Data to support grout facility design Collect grout curing and strength data Determine the heat release per volume of grout and thermal conductivities of the proposed grouts.
Heat of curing, thermal conductivity, source of heat
Measure grout strength as a function of curing temperature
Impact of curing temperature on waste form performance
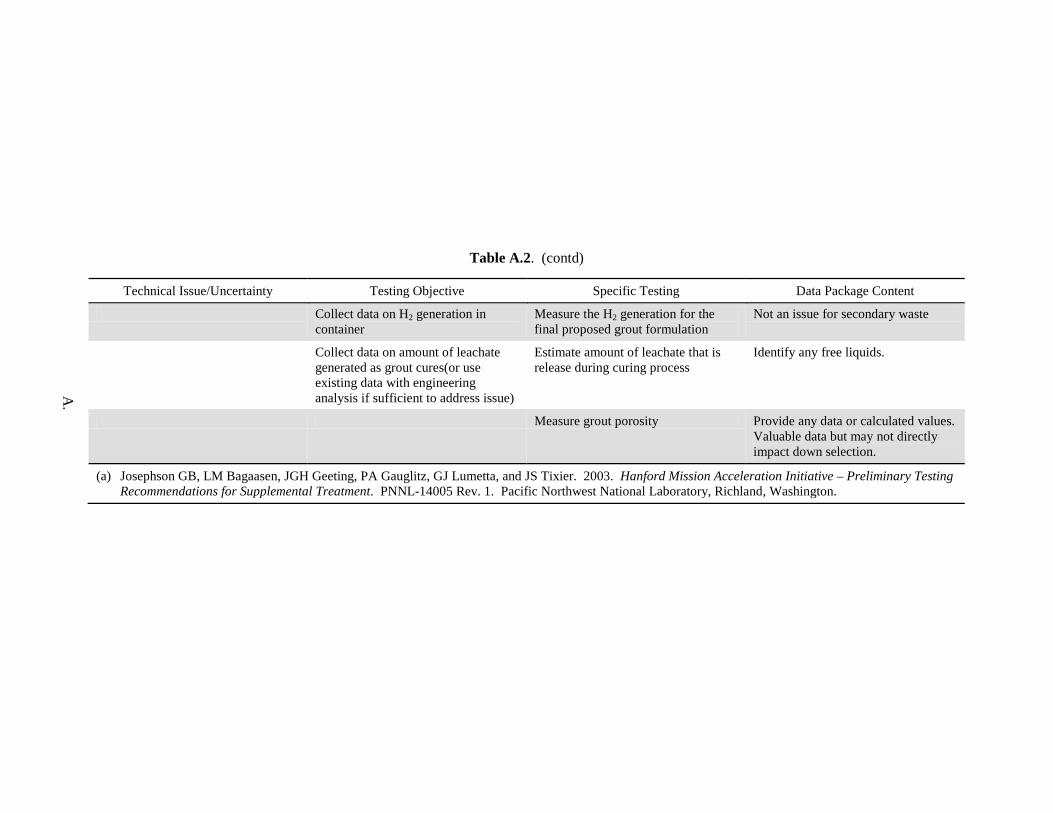
A.
Table A.2. (contd)
Technical Issue/Uncertainty Testing Objective Specific Testing Data Package Content
Collect data on H2 generation in container
Measure the H2 generation for the final proposed grout formulation
Not an issue for secondary waste
Collect data on amount of leachate generated as grout cures(or use existing data with engineering analysis if sufficient to address issue)
Estimate amount of leachate that is release during curing process
Identify any free liquids.
Measure grout porosity Provide any data or calculated values. Valuable data but may not directly impact down selection.
(a) Josephson GB, LM Bagaasen, JGH Geeting, PA Gauglitz, GJ Lumetta, and JS Tixier. 2003. Hanford Mission Acceleration Initiative – Preliminary Testing Recommendations for Supplemental Treatment. PNNL-14005 Rev. 1. Pacific Northwest National Laboratory, Richland, Washington.
Appendix B
Initial Draft Waste Form Selection/Waste Acceptance Criteria for Hanford WTP Secondary Waste Form

B.1
Appendix B
Initial Draft Waste Form Selection/Waste Acceptance Criteria for Hanford WTP Secondary Waste Form
The attached table provides initial draft waste acceptance criteria and waste form selection criteria for secondary liquid wastes from the Hanford Tank Waste Treatment and Immobilization Plant (WTP). It is assumed that the secondary wastes will be treated and solidified in the Effluent Treatment Facility before disposal in the Integrated Disposal Facility (IDF). The criteria were developed originally in 2004 and were based on the Hanford Site Solid Waste Acceptance Criteria as well as the waste acceptance criteria for the immobilized low-activity waste glass waste form to be prepared in WTP for disposal in IDF. In 2004 and 2005 Integrated Disposal Facility Waste Acceptance Criteria (RPP-8402) were drafted. The latest available version for this exercise is Rev. 1, dated February 23, 2005.
The first three columns provide the original secondary waste form requirements including the title of the requirement, the requirement itself, and the technical basis for the requirement. The fourth column provides the corresponding requirement from the IDF waste acceptance criteria. The fifth column identifies the data package content to address the requirement.

B.
Table B.1. Initial Draft Waste Form Selection/Waste Acceptance Criteria for Hanford WTP Secondary Waste Form
Property Requirement Basis IDF Waste Acceptance Criteria(a) Data Package Content
1.2.2.1 Return Streams
There shall be no return streams from the secondary waste stabilization facilities.
The process should not generate off-gas effluents. Any “bleed” water from curing or set-up of the stabilizing material (e.g., grout or other material) can be mitigated by design.
Process description, flowsheet description
1.2.2.2 Package Description
The constituent parts of each package are a sealed metal container enclosing the stabilized secondary waste form and an optional filler material.
The disposal infrastructure planned in conjunction with the Integrated Disposal Facility (IDF) includes systems for handling cylindrical WTP canisters, solid waste drums and boxes, and potentially large (8 ft. × 8 ft. × 20 ft.) roll-off boxes for the supplemental treatment waste form. The preferred option for SSW is to utilize one of the currently planned disposal system packages and corresponding interfaces. Use of a different container may be more efficient, but will have to be evaluated against the disposal system impacts.
4.3.1 Package Construction Containers must be made of or lined with materials that will not react with, and are otherwise compatible with, the dangerous waste during handling and storage before disposal such that the ability of the container to contain the waste is not impaired. Waste containers are limited to those constructed of noncombustible or fire retardant materials. Container materials will be limited to the following: • Metal, concrete, masonry • Other not listed here
Range of packages defined in IDF WAC. Provide description of waste form including chemical form
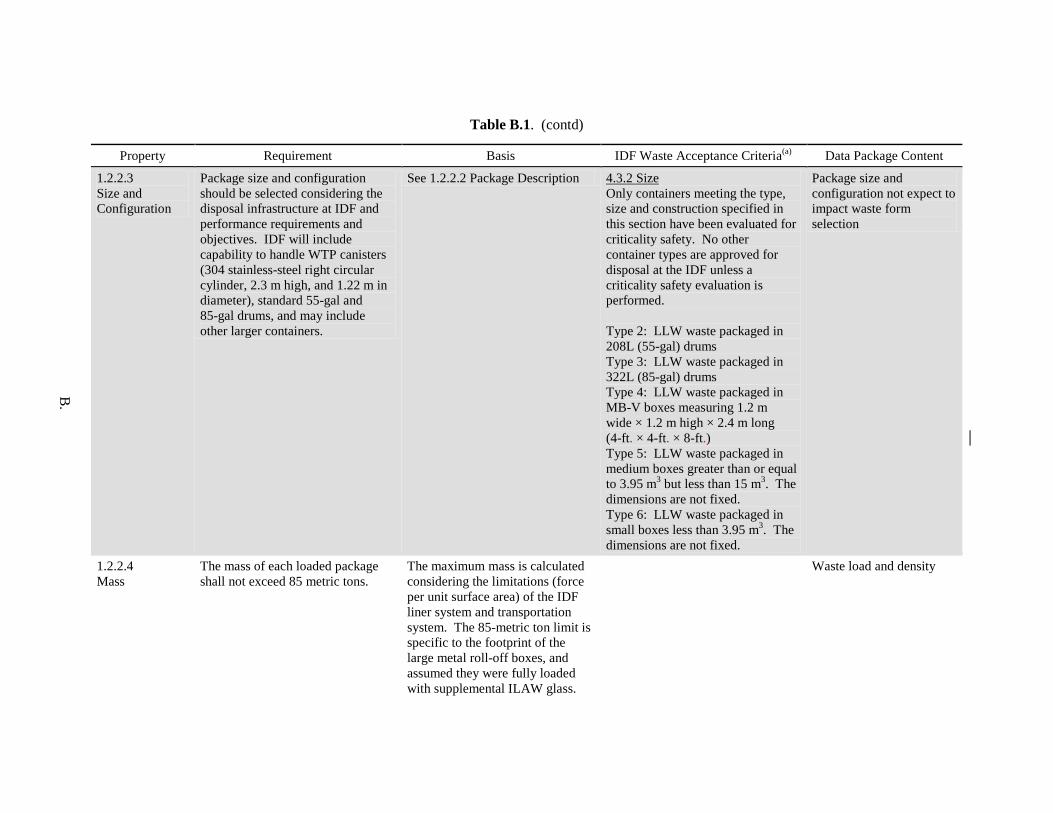
B.
Table B.1. (contd)
Property Requirement Basis IDF Waste Acceptance Criteria(a) Data Package Content
1.2.2.3 Size and Configuration
Package size and configuration should be selected considering the disposal infrastructure at IDF and performance requirements and objectives. IDF will include capability to handle WTP canisters (304 stainless-steel right circular cylinder, 2.3 m high, and 1.22 m in diameter), standard 55-gal and 85-gal drums, and may include other larger containers.
See 1.2.2.2 Package Description 4.3.2 Size Only containers meeting the type, size and construction specified in this section have been evaluated for criticality safety. No other container types are approved for disposal at the IDF unless a criticality safety evaluation is performed. Type 2: LLW waste packaged in 208L (55-gal) drums Type 3: LLW waste packaged in 322L (85-gal) drums Type 4: LLW waste packaged in MB-V boxes measuring 1.2 m wide × 1.2 m high × 2.4 m long (4-ft. × 4-ft. × 8-ft.) Type 5: LLW waste packaged in medium boxes greater than or equal to 3.95 m3 but less than 15 m3. The dimensions are not fixed. Type 6: LLW waste packaged in small boxes less than 3.95 m3. The dimensions are not fixed.
Package size and configuration not expect to impact waste form selection
1.2.2.4 Mass
The mass of each loaded package shall not exceed 85 metric tons.
The maximum mass is calculated considering the limitations (force per unit surface area) of the IDF liner system and transportation system. The 85-metric ton limit is specific to the footprint of the large metal roll-off boxes, and assumed they were fully loaded with supplemental ILAW glass.
Waste load and density
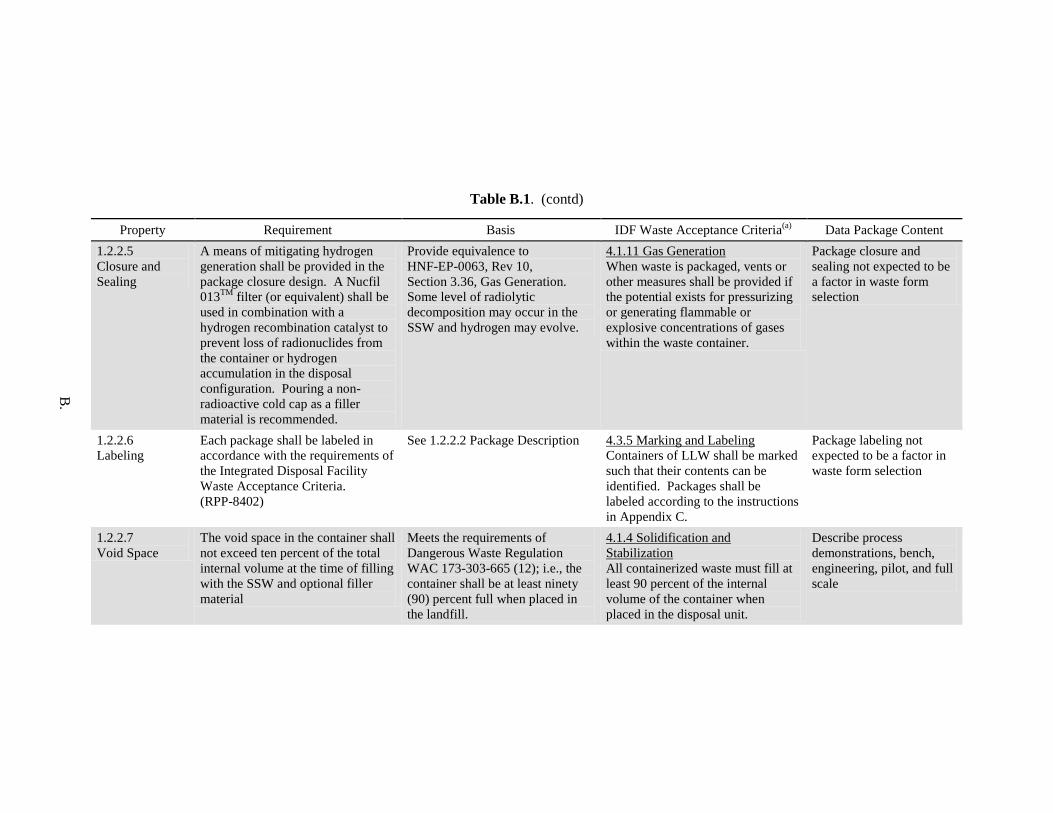
B.
Table B.1. (contd)
Property Requirement Basis IDF Waste Acceptance Criteria(a) Data Package Content 1.2.2.5 Closure and Sealing
A means of mitigating hydrogen generation shall be provided in the package closure design. A Nucfil 013TM filter (or equivalent) shall be used in combination with a hydrogen recombination catalyst to prevent loss of radionuclides from the container or hydrogen accumulation in the disposal configuration. Pouring a non-radioactive cold cap as a filler material is recommended.
Provide equivalence to HNF-EP-0063, Rev 10, Section 3.36, Gas Generation. Some level of radiolytic decomposition may occur in the SSW and hydrogen may evolve.
4.1.11 Gas Generation When waste is packaged, vents or other measures shall be provided if the potential exists for pressurizing or generating flammable or explosive concentrations of gases within the waste container.
Package closure and sealing not expected to be a factor in waste form selection
1.2.2.6 Labeling
Each package shall be labeled in accordance with the requirements of the Integrated Disposal Facility Waste Acceptance Criteria. (RPP-8402)
See 1.2.2.2 Package Description 4.3.5 Marking and Labeling Containers of LLW shall be marked such that their contents can be identified. Packages shall be labeled according to the instructions in Appendix C.
Package labeling not expected to be a factor in waste form selection
1.2.2.7 Void Space
The void space in the container shall not exceed ten percent of the total internal volume at the time of filling with the SSW and optional filler material
Meets the requirements of Dangerous Waste Regulation WAC 173-303-665 (12); i.e., the container shall be at least ninety (90) percent full when placed in the landfill.
4.1.4 Solidification and Stabilization All containerized waste must fill at least 90 percent of the internal volume of the container when placed in the disposal unit.
Describe process demonstrations, bench, engineering, pilot, and full scale
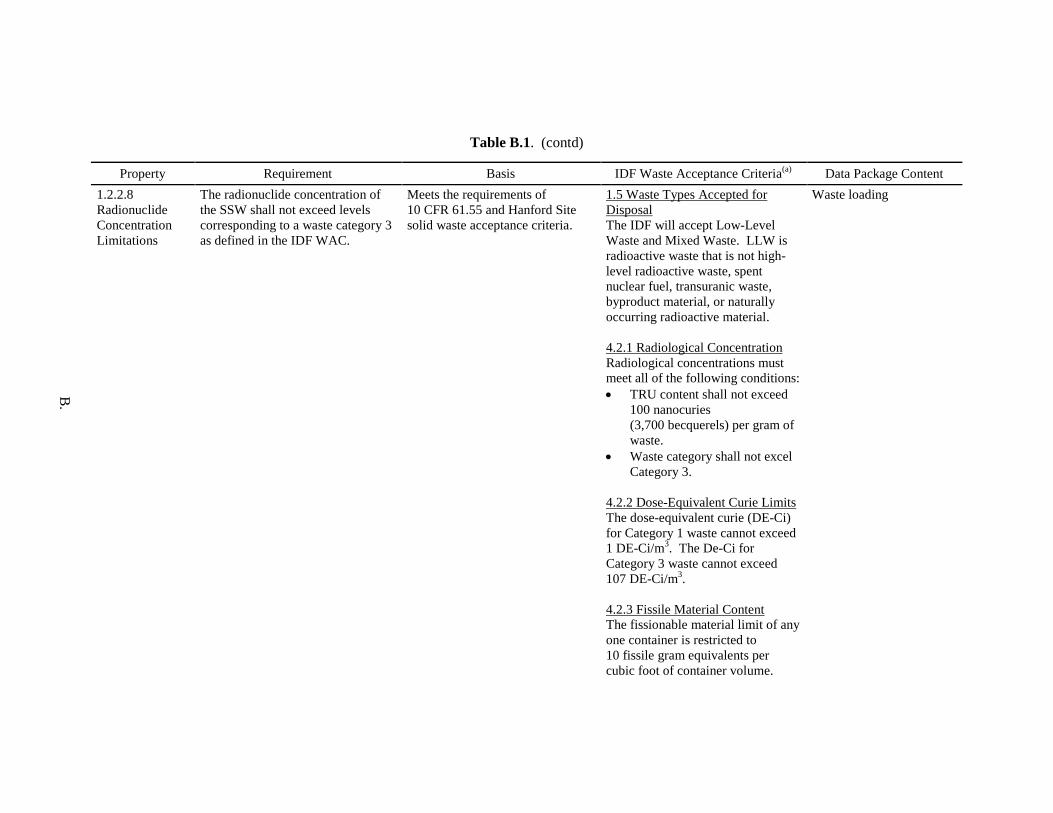
B.
Table B.1. (contd)
Property Requirement Basis IDF Waste Acceptance Criteria(a) Data Package Content 1.2.2.8 Radionuclide Concentration Limitations
The radionuclide concentration of the SSW shall not exceed levels corresponding to a waste category 3 as defined in the IDF WAC.
Meets the requirements of 10 CFR 61.55 and Hanford Site solid waste acceptance criteria.
1.5 Waste Types Accepted for Disposal The IDF will accept Low-Level Waste and Mixed Waste. LLW is radioactive waste that is not high-level radioactive waste, spent nuclear fuel, transuranic waste, byproduct material, or naturally occurring radioactive material. 4.2.1 Radiological Concentration Radiological concentrations must meet all of the following conditions: • TRU content shall not exceed
100 nanocuries (3,700 becquerels) per gram of waste.
• Waste category shall not excel Category 3.
4.2.2 Dose-Equivalent Curie Limits The dose-equivalent curie (DE-Ci) for Category 1 waste cannot exceed 1 DE-Ci/m3. The De-Ci for Category 3 waste cannot exceed 107 DE-Ci/m3. 4.2.3 Fissile Material Content The fissionable material limit of any one container is restricted to 10 fissile gram equivalents per cubic foot of container volume.
Waste loading
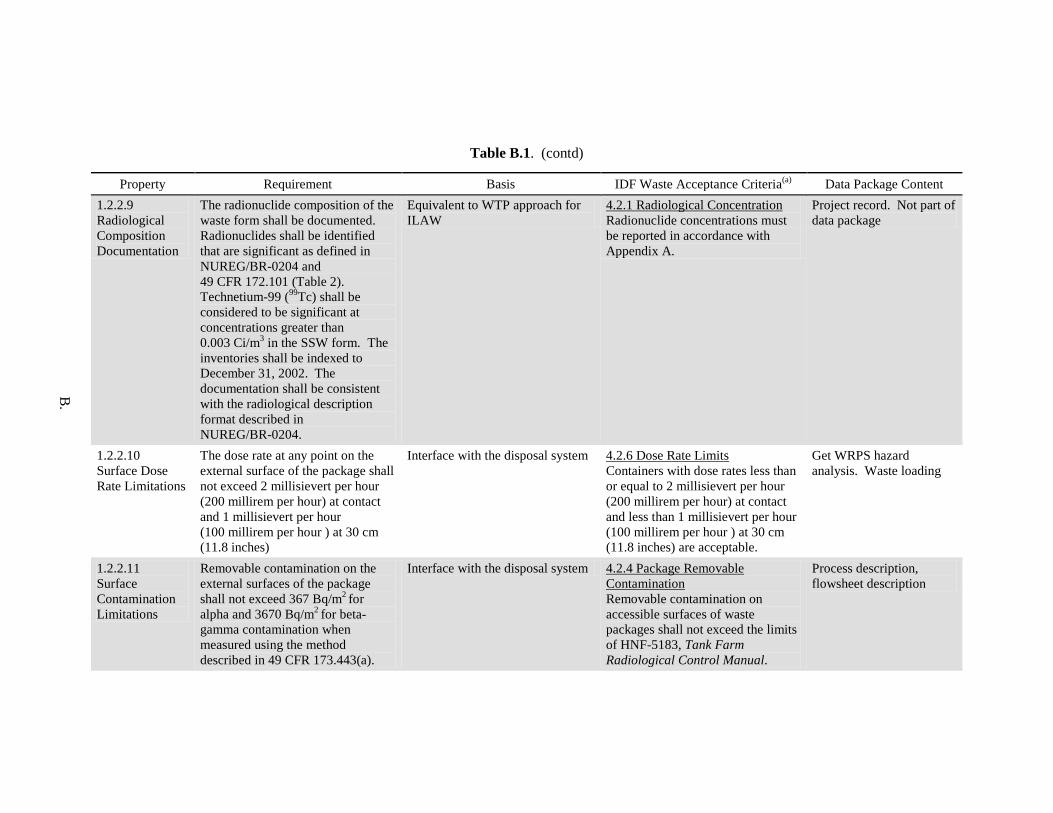
B.
Table B.1. (contd)
Property Requirement Basis IDF Waste Acceptance Criteria(a) Data Package Content 1.2.2.9 Radiological Composition Documentation
The radionuclide composition of the waste form shall be documented. Radionuclides shall be identified that are significant as defined in NUREG/BR-0204 and 49 CFR 172.101 (Table 2). Technetium-99 (99Tc) shall be considered to be significant at concentrations greater than 0.003 Ci/m3 in the SSW form. The inventories shall be indexed to December 31, 2002. The documentation shall be consistent with the radiological description format described in NUREG/BR-0204.
Equivalent to WTP approach for ILAW
4.2.1 Radiological Concentration Radionuclide concentrations must be reported in accordance with Appendix A.
Project record. Not part of data package
1.2.2.10 Surface Dose Rate Limitations
The dose rate at any point on the external surface of the package shall not exceed 2 millisievert per hour (200 millirem per hour) at contact and 1 millisievert per hour (100 millirem per hour ) at 30 cm (11.8 inches)
Interface with the disposal system 4.2.6 Dose Rate Limits Containers with dose rates less than or equal to 2 millisievert per hour (200 millirem per hour) at contact and less than 1 millisievert per hour (100 millirem per hour ) at 30 cm (11.8 inches) are acceptable.
Get WRPS hazard analysis. Waste loading
1.2.2.11 Surface Contamination Limitations
Removable contamination on the external surfaces of the package shall not exceed 367 Bq/m2 for alpha and 3670 Bq/m2 for beta-gamma contamination when measured using the method described in 49 CFR 173.443(a).
Interface with the disposal system 4.2.4 Package Removable Contamination Removable contamination on accessible surfaces of waste packages shall not exceed the limits of HNF-5183, Tank Farm Radiological Control Manual.
Process description, flowsheet description

B.
Table B.1. (contd)
Property Requirement Basis IDF Waste Acceptance Criteria(a) Data Package Content 1.2.2.12 External Temperature
The temperature of the accessible external surfaces of the package shall not exceed 50°C when returned to DOE. This temperature constraint shall assume a shaded, still air environment at an ambient temperature of 38°C
Interface with the disposal system 4.1.13 Heat Generation Waste must not generate excess heat that would compromise the integrity of both contained and nearby wastes. If heat generation from radiological decay in the waste package exceeds 4.1 watts per cubic meter (0.1 watt per cubic foot), the package must be evaluated to ensure that the heat does not affect the integrity of the container or surrounding containers. The maximum temperature is limited by the 71.1ºC allowable design temperature at the primary geomembrane.
Radiogenic heat is not an issue. Document heat of curing. Curing time, set time.

B.
Table B.1. (contd)
Property Requirement Basis IDF Waste Acceptance Criteria(a) Data Package Content 1.2.2.13 Free Liquids
The package shall contain no detectable free liquids as defined in ANSI/ANS-55.1 or SW-846 Method 9095
Compliance with 10 CFR Part 61 4.1.3 Liquids and Liquid Containing Wastes Liquid waste must be solidified or packaged in sufficient absorbent material to absorb twice the volume of liquid. Liquid waste or wastes containing liquids must be converted into a form that contains as little free-standing and non-corrosive liquid as is reasonably achievable, but in no case shall the liquid exceed 1% of the volume of the waste when the waste is in a disposal container designed to ensure stability, or 0.5% of the volume after it is processed to a stable form. For waste that has the potential for free liquid formation, the absence or presence of free liquids in the waste must be demonstrated using the following test method: Method 9095 (Paint Filter Liquids Test) as described in EPA Publication SW-846.
Document free liquids in laboratory and scale testing. Under what conditions were free liquids observed.

B.
Table B.1. (contd)
Property Requirement Basis IDF Waste Acceptance Criteria(a) Data Package Content 1.2.2.14 Pyrophoricity or Explosivity
The package contents shall not be pyrophoric, readily capable of detonation, or readily capable of explosive decomposition or reaction (including reaction with water) at normal pressure and temperature. The waste form and any optional filler materials shall not be ignitable or reactive as defined in WAC 173-303-090(5) and WAC 173-303-090(7).
Compliance with WAC. 4.1.9 Explosives Waste must not be readily capable of detonation or of explosive decomposition or reaction at anticipated pressures and temperatures, or of explosive reaction with water. 4.1.10 Pyrophoric Wastes Pyrophoric materials contained in the waste shall be treated, prepared, and packaged to be nonflammable.
Describe waste form including chemistry and starting materials.
1.2.2.15 Explosive or Toxic Gases
The loaded package shall not contain or be capable of generating quantities of explosive (e.g., hydrogen) or toxic gases, vapors, or fumes harmful to persons handling the waste.
SSW may generate radiolytic hydrogen that must be accounted for in the design.
4.1.11 Gas Generation Waste must not contain, or be capable of generating quantities of toxic gases, vapor, or fumes harmful to the public, workers, or disposal facility personnel, or harmful to the long-term structural stability of the disposal site.
Describe waste form including chemistry and starting materials. Radiogenic hydrogen is not expected to be an issue with secondary wastes. Decide how to address ammonia in SBS recycle.
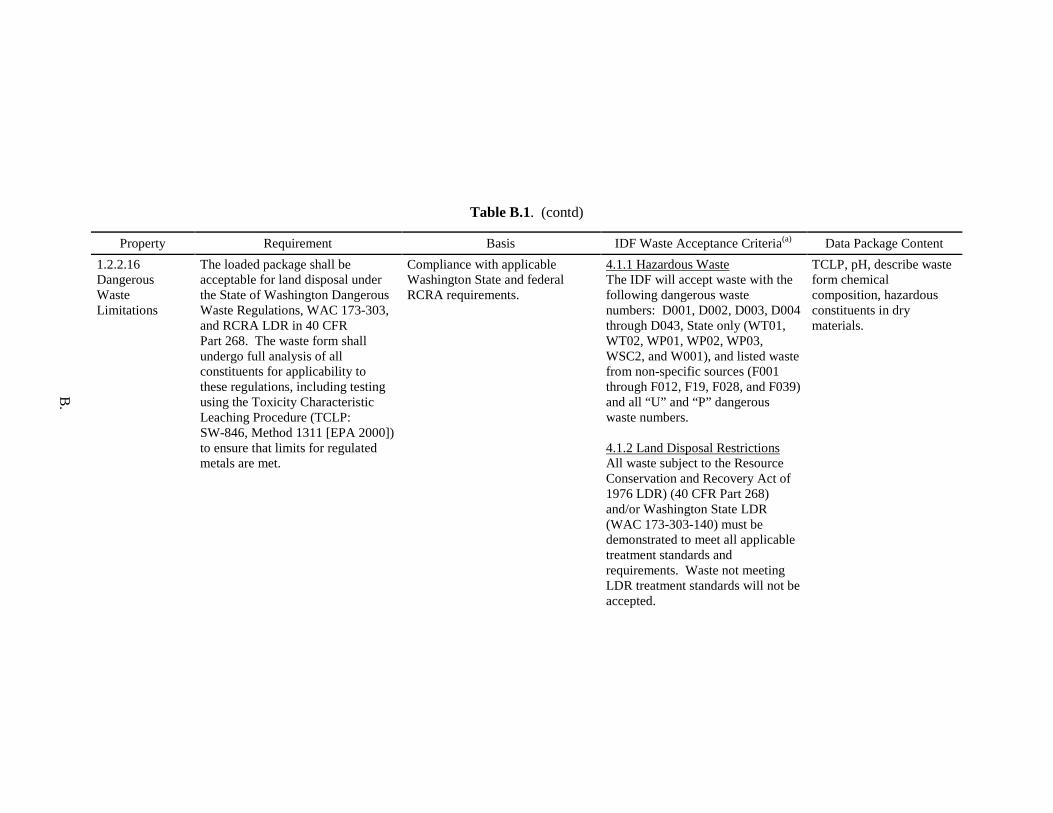
B.
Table B.1. (contd)
Property Requirement Basis IDF Waste Acceptance Criteria(a) Data Package Content 1.2.2.16 Dangerous Waste Limitations
The loaded package shall be acceptable for land disposal under the State of Washington Dangerous Waste Regulations, WAC 173-303, and RCRA LDR in 40 CFR Part 268. The waste form shall undergo full analysis of all constituents for applicability to these regulations, including testing using the Toxicity Characteristic Leaching Procedure (TCLP: SW-846, Method 1311 [EPA 2000]) to ensure that limits for regulated metals are met.
Compliance with applicable Washington State and federal RCRA requirements.
4.1.1 Hazardous Waste The IDF will accept waste with the following dangerous waste numbers: D001, D002, D003, D004 through D043, State only (WT01, WT02, WP01, WP02, WP03, WSC2, and W001), and listed waste from non-specific sources (F001 through F012, F19, F028, and F039) and all “U” and “P” dangerous waste numbers. 4.1.2 Land Disposal Restrictions All waste subject to the Resource Conservation and Recovery Act of 1976 LDR) (40 CFR Part 268) and/or Washington State LDR (WAC 173-303-140) must be demonstrated to meet all applicable treatment standards and requirements. Waste not meeting LDR treatment standards will not be accepted.
TCLP, pH, describe waste form chemical composition, hazardous constituents in dry materials.
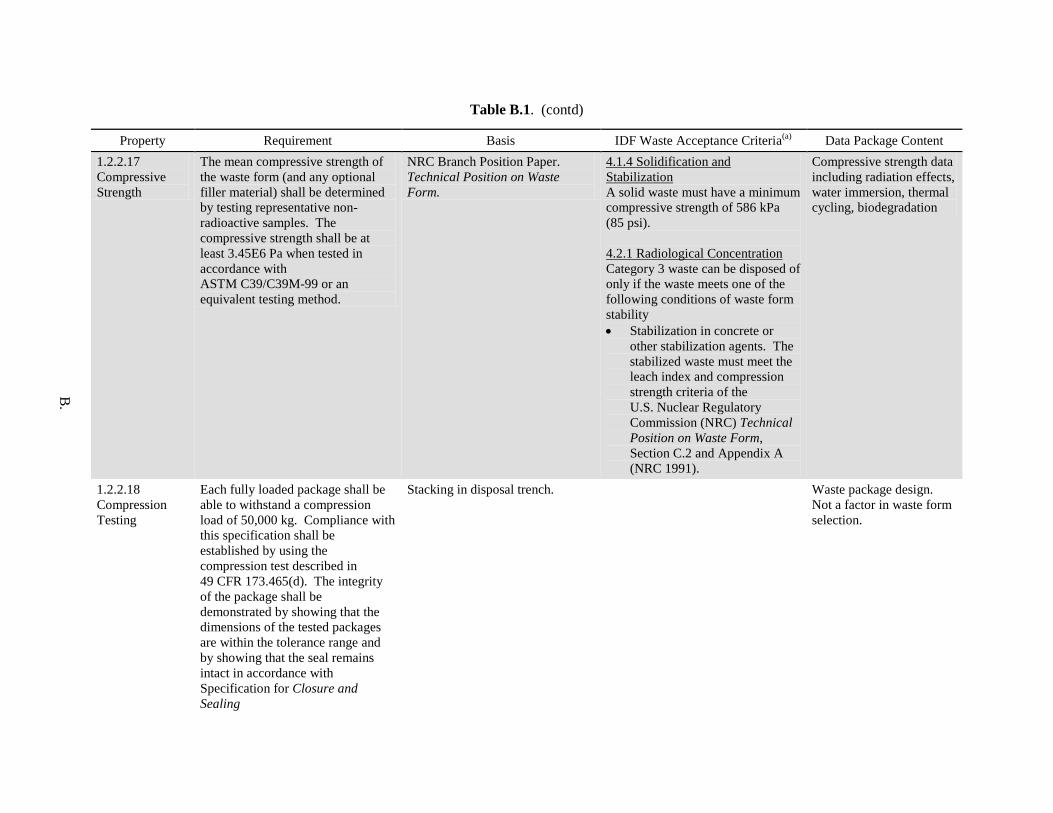
B.
Table B.1. (contd)
Property Requirement Basis IDF Waste Acceptance Criteria(a) Data Package Content 1.2.2.17 Compressive Strength
The mean compressive strength of the waste form (and any optional filler material) shall be determined by testing representative non-radioactive samples. The compressive strength shall be at least 3.45E6 Pa when tested in accordance with ASTM C39/C39M-99 or an equivalent testing method.
NRC Branch Position Paper. Technical Position on Waste Form.
4.1.4 Solidification and Stabilization A solid waste must have a minimum compressive strength of 586 kPa (85 psi). 4.2.1 Radiological Concentration Category 3 waste can be disposed of only if the waste meets one of the following conditions of waste form stability • Stabilization in concrete or
other stabilization agents. The stabilized waste must meet the leach index and compression strength criteria of the U.S. Nuclear Regulatory Commission (NRC) Technical Position on Waste Form, Section C.2 and Appendix A (NRC 1991).
Compressive strength data including radiation effects, water immersion, thermal cycling, biodegradation
1.2.2.18 Compression Testing
Each fully loaded package shall be able to withstand a compression load of 50,000 kg. Compliance with this specification shall be established by using the compression test described in 49 CFR 173.465(d). The integrity of the package shall be demonstrated by showing that the dimensions of the tested packages are within the tolerance range and by showing that the seal remains intact in accordance with Specification for Closure and Sealing
Stacking in disposal trench. Waste package design. Not a factor in waste form selection.

B.
Table B.1. (contd)
Property Requirement Basis IDF Waste Acceptance Criteria(a) Data Package Content 1.2.2.19 Manifesting
A shipping manifest shall be prepared for delivery with each shipment of SSW product. Information on the manifest shall satisfy the requirements in DOE Manual 435.1-1, Chapter N, Section I.(2), and NUREG/BR-0204. Any package containing dangerous waste must be labeled and manifested in accordance with WAC 173-303-370 and the Dangerous Waste Portion of the Resource Conservation and Recovery Act Permit for the Treatment, Storage, and Disposal of Dangerous Wastes (Permit No. WA 7890008967).
Equivalent to WTP glass packaging requirements
2.5 Waste Receipt and Acceptance Each waste shipment must be accompanied by the following paperwork: • A receipt report • A Uniform Hazardous Waste
Manifest • A Land Disposal Restriction
Notification/Certification Form (waste subject to 40 CFR Part 268).
Not a factor in waste form selection
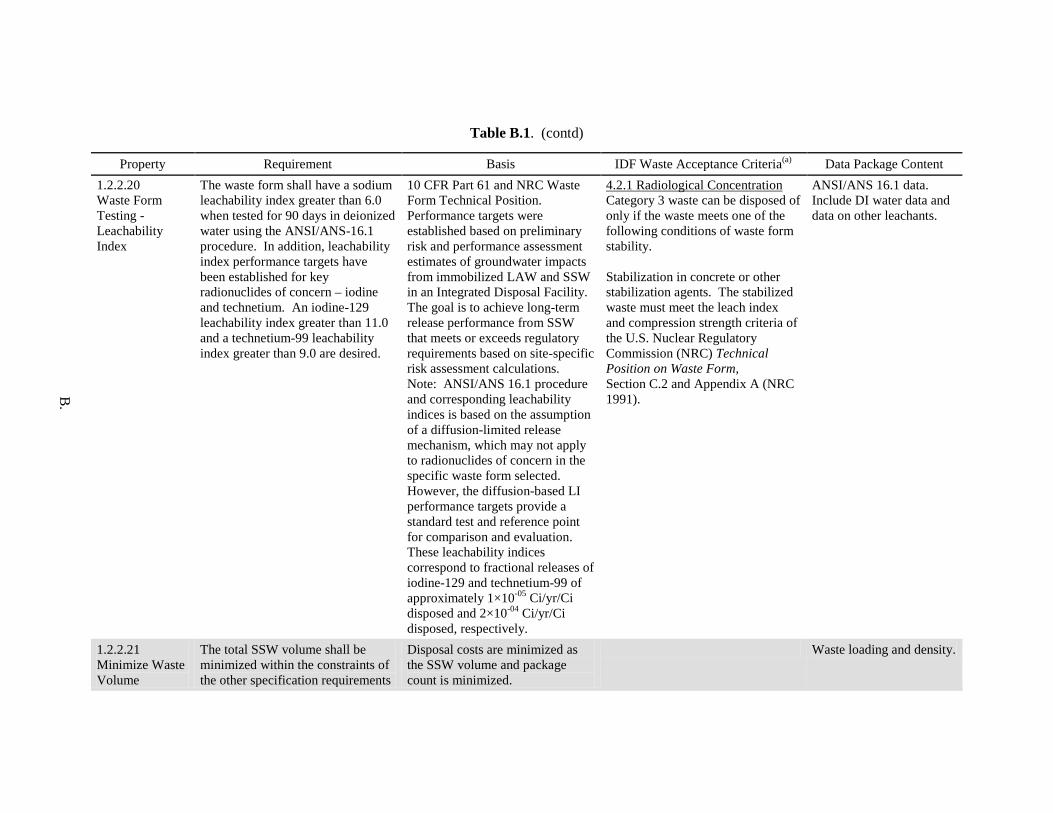
B.
Table B.1. (contd)
Property Requirement Basis IDF Waste Acceptance Criteria(a) Data Package Content 1.2.2.20 Waste Form Testing - Leachability Index
The waste form shall have a sodium leachability index greater than 6.0 when tested for 90 days in deionized water using the ANSI/ANS-16.1 procedure. In addition, leachability index performance targets have been established for key radionuclides of concern – iodine and technetium. An iodine-129 leachability index greater than 11.0 and a technetium-99 leachability index greater than 9.0 are desired.
10 CFR Part 61 and NRC Waste Form Technical Position. Performance targets were established based on preliminary risk and performance assessment estimates of groundwater impacts from immobilized LAW and SSW in an Integrated Disposal Facility. The goal is to achieve long-term release performance from SSW that meets or exceeds regulatory requirements based on site-specific risk assessment calculations. Note: ANSI/ANS 16.1 procedure and corresponding leachability indices is based on the assumption of a diffusion-limited release mechanism, which may not apply to radionuclides of concern in the specific waste form selected. However, the diffusion-based LI performance targets provide a standard test and reference point for comparison and evaluation. These leachability indices correspond to fractional releases of iodine-129 and technetium-99 of approximately 1×10-05 Ci/yr/Ci disposed and 2×10-04 Ci/yr/Ci disposed, respectively.
4.2.1 Radiological Concentration Category 3 waste can be disposed of only if the waste meets one of the following conditions of waste form stability. Stabilization in concrete or other stabilization agents. The stabilized waste must meet the leach index and compression strength criteria of the U.S. Nuclear Regulatory Commission (NRC) Technical Position on Waste Form, Section C.2 and Appendix A (NRC 1991).
ANSI/ANS 16.1 data. Include DI water data and data on other leachants.
1.2.2.21 Minimize Waste Volume
The total SSW volume shall be minimized within the constraints of the other specification requirements
Disposal costs are minimized as the SSW volume and package count is minimized.
Waste loading and density.
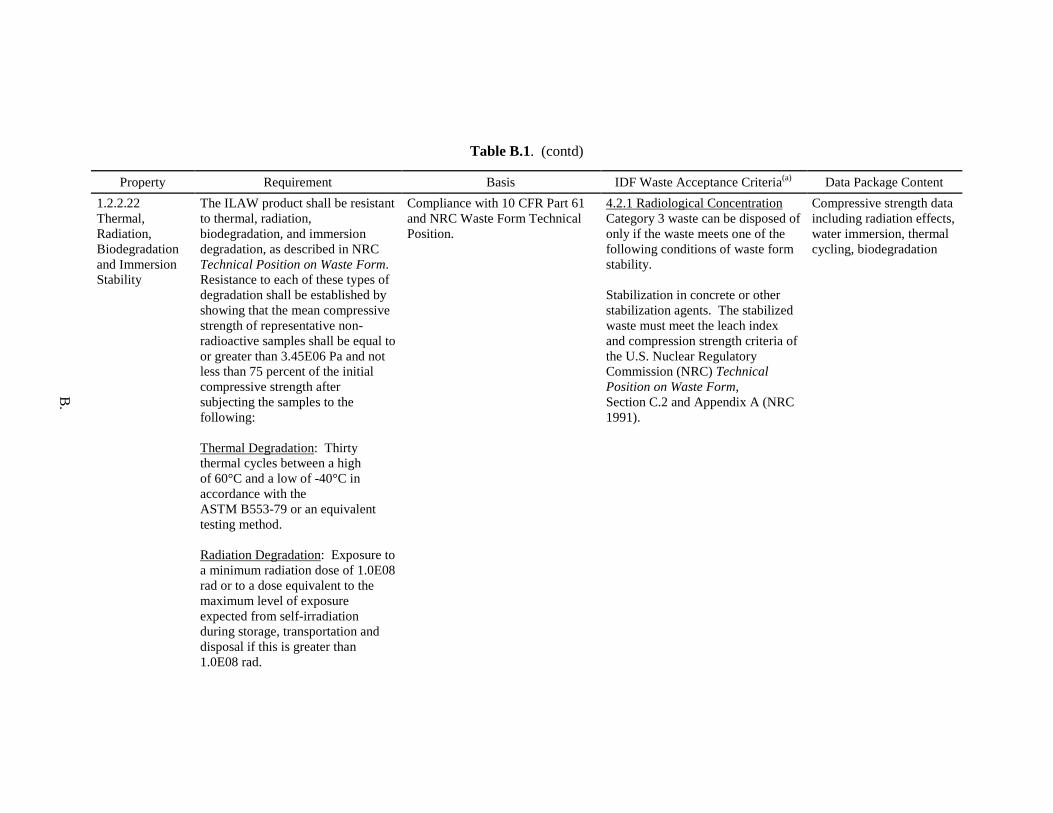
B.
Table B.1. (contd)
Property Requirement Basis IDF Waste Acceptance Criteria(a) Data Package Content 1.2.2.22 Thermal, Radiation, Biodegradation and Immersion Stability
The ILAW product shall be resistant to thermal, radiation, biodegradation, and immersion degradation, as described in NRC Technical Position on Waste Form. Resistance to each of these types of degradation shall be established by showing that the mean compressive strength of representative non-radioactive samples shall be equal to or greater than 3.45E06 Pa and not less than 75 percent of the initial compressive strength after subjecting the samples to the following: Thermal Degradation: Thirty thermal cycles between a high of 60°C and a low of -40°C in accordance with the ASTM B553-79 or an equivalent testing method. Radiation Degradation: Exposure to a minimum radiation dose of 1.0E08 rad or to a dose equivalent to the maximum level of exposure expected from self-irradiation during storage, transportation and disposal if this is greater than 1.0E08 rad.
Compliance with 10 CFR Part 61 and NRC Waste Form Technical Position.
4.2.1 Radiological Concentration Category 3 waste can be disposed of only if the waste meets one of the following conditions of waste form stability. Stabilization in concrete or other stabilization agents. The stabilized waste must meet the leach index and compression strength criteria of the U.S. Nuclear Regulatory Commission (NRC) Technical Position on Waste Form, Section C.2 and Appendix A (NRC 1991).
Compressive strength data including radiation effects, water immersion, thermal cycling, biodegradation
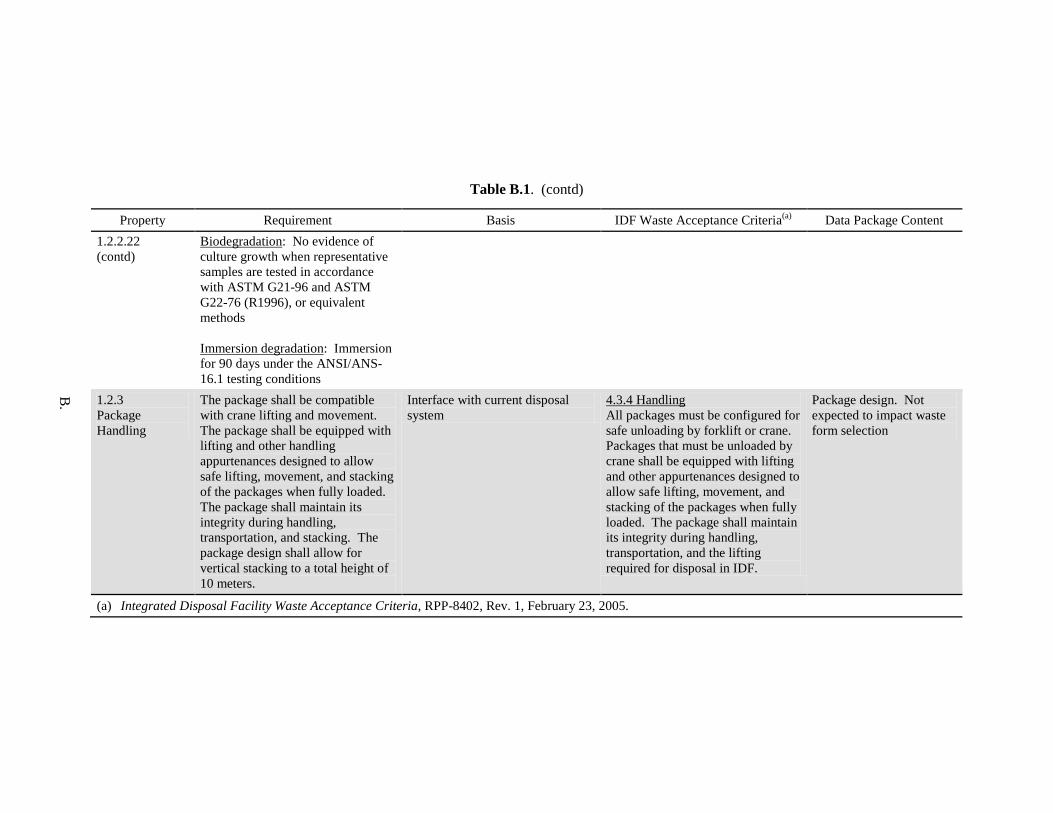
B.
Table B.1. (contd)
Property Requirement Basis IDF Waste Acceptance Criteria(a) Data Package Content 1.2.2.22 (contd)
Biodegradation: No evidence of culture growth when representative samples are tested in accordance with ASTM G21-96 and ASTM G22-76 (R1996), or equivalent methods Immersion degradation: Immersion for 90 days under the ANSI/ANS-16.1 testing conditions
1.2.3 Package Handling
The package shall be compatible with crane lifting and movement. The package shall be equipped with lifting and other handling appurtenances designed to allow safe lifting, movement, and stacking of the packages when fully loaded. The package shall maintain its integrity during handling, transportation, and stacking. The package design shall allow for vertical stacking to a total height of 10 meters.
Interface with current disposal system
4.3.4 Handling All packages must be configured for safe unloading by forklift or crane. Packages that must be unloaded by crane shall be equipped with lifting and other appurtenances designed to allow safe lifting, movement, and stacking of the packages when fully loaded. The package shall maintain its integrity during handling, transportation, and the lifting required for disposal in IDF.
Package design. Not expected to impact waste form selection
(a) Integrated Disposal Facility Waste Acceptance Criteria, RPP-8402, Rev. 1, February 23, 2005.


Appendix C
Details on Simulants, Actual Wastes, and Cementitious Waste Form Formulations Used at Hanford and
Savannah River


C.1
Appendix C
Details on Simulants, Actual Wastes, and Cementitious Waste Form Formulations Used at Hanford and
Savannah River
Table C.1. Dry Blend Oxide Composition of Cast Stone Materials Used by Cooke and Lockrem (see Cooke and Lockrem (2005); RPP-RPT-26851, Rev. 0, Appendix A or more details and XRD patterns for dry blend ingredients and hydrated Cast Stone made with Basin 42 brine waste stream)
Compound Formula Cement (wt%) Fly Ash (wt%) Slag (wt%) Na2O 0.34 4.33 0.31 MgO 0.785 1.52 11.9 Al2O3 4.48 24.4 10.5 SiO2 18.9 44.9 35 P2O5 0.91 SO3 4.17 1.25 2.79 Cl 0.014
K2O 0.416 0.727 0.431 CaO 66.34 8.62 38.6 TiO2 0.25 4.17 0.504 Cr2O3 0.026 0.011 MnO 0.058 0.046 0.404 Fe2O3 3.84 8.49 0.485 CuO 0.041 ZnO 0.102 0.024
Ga2O3 0.01 SrO 0.157 0.333 0.0452
Y2O3 0.014 ZrO2 0.013 0.148 0.0493 BaO 0.057
Nb2O5 0.018 Total 99.922 99.977 101.0295
Harbour et al. (2006a) (WSRC-TR-2006-00067) reports on baseline characterization performed on batches of dry ingredients that have been used in successful Saltstone campaigns. Future batches of Saltstone dry blend will be checked to be sure that they are not “out of range.”
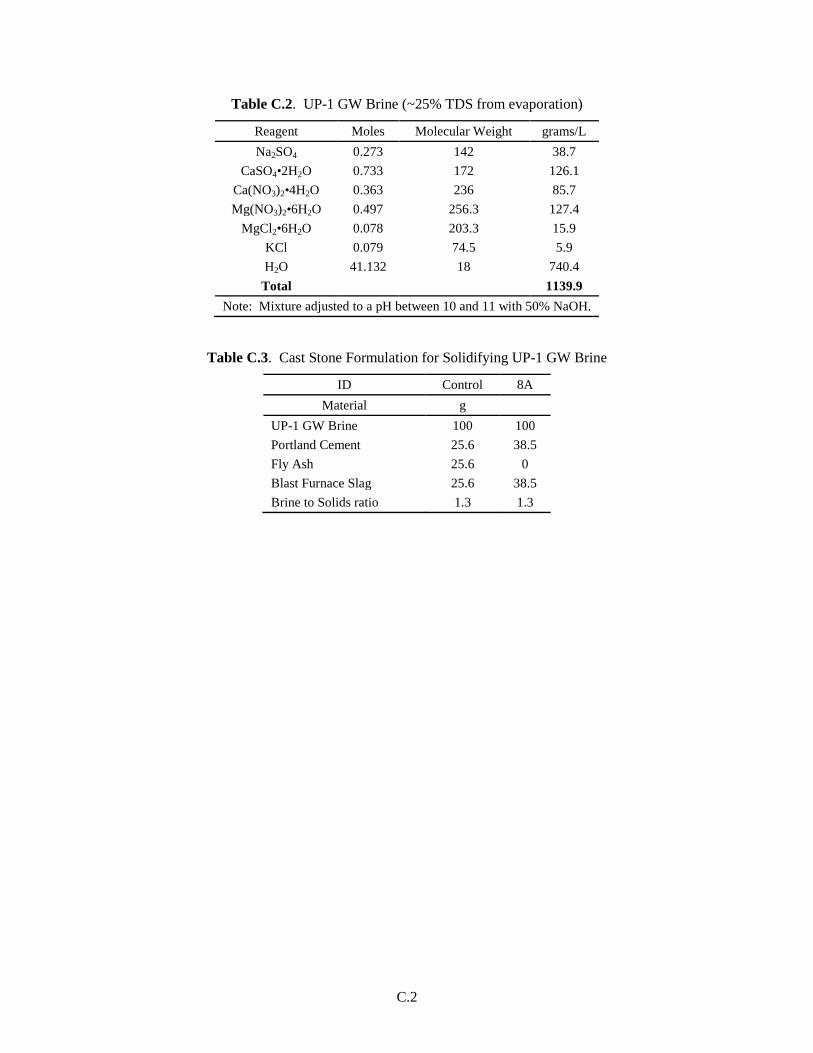
C.2
Table C.2. UP-1 GW Brine (~25% TDS from evaporation)
Reagent Moles Molecular Weight grams/L Na2SO4 0.273 142 38.7
CaSO4•2H2O 0.733 172 126.1 Ca(NO3)2•4H2O 0.363 236 85.7 Mg(NO3)2•6H2O 0.497 256.3 127.4
MgCl2•6H2O 0.078 203.3 15.9 KCl 0.079 74.5 5.9 H2O 41.132 18 740.4
Total 1139.9 Note: Mixture adjusted to a pH between 10 and 11 with 50% NaOH.
Table C.3. Cast Stone Formulation for Solidifying UP-1 GW Brine
ID Control 8A Material g
UP-1 GW Brine 100 100 Portland Cement 25.6 38.5 Fly Ash 25.6 0 Blast Furnace Slag 25.6 38.5 Brine to Solids ratio 1.3 1.3

C.3
Table C.4. Cast Stone + Tc Getter Formulations for Solidifying Basin 43 GW Brine
Description Material Units (g)
Cold Blank
Basin 43 GW Brine - 99Tc 110 Portland Cement: 33.34 Blast Furnace Slag: 16.7047 Getter: none —
Hot Blank
Basin 43 GW Brine + 99Tc 109.71 Portland Cement: 66.612 Blast Furnace Slag: 33.37 Getter: none —
Fishbone
Basin 43 GW Brine + 99Tc 110 Portland Cement: 66.63 Blast Furnace Slag: 33.29 Getter: Fishbone 10.01
Zero Valent Iron
Basin 43 GW Brine + 99Tc 110.09 Portland Cement: 66.6 Blast Furnace Slag: 33.34 Getter: Zero Valent Iron 10
Bone Black
Basin 43 GW Brine + 99Tc 110.02 Portland Cement: 66.6 Blast Furnace Slag: 33.31 Getter: Bone Black 10.01
Iron III Phosphate
Basin 43 GW Brine + 99Tc 110 Portland Cement: 66.675 Blast Furnace Slag: 33.33 Getter: Iron III Phosphate 10
Hydrotalcite
Basin 43 GW Brine + 99Tc 66.0065 Portland Cement: 39.99 Blast Furnace Slag: 19.99 Getter: Hydrotalcite 6.05
Fishbone ORP Adjusted
Basin 43 GW Brine + 99Tc 110.05 Portland Cement: 66.62 Blast Furnace Slag: 33.32 Getter: Fishbone 10.02
Bone Black ORP Adjusted
Basin 43 GW Brine + 99Tc 110.01 Portland Cement: 66.61 Blast Furnace Slag: 33.3 Getter: Bone Black 10.02
Zero Valent Iron ORP Adjusted
Basin 43 GW Brine + 99Tc 110.02 Portland Cement: 66.6 Blast Furnace Slag: 33.3 Getter: Zero Valent Iron 10.01
Iron III Phosphate ORP Adjusted
Basin 43 GW Brine + 99Tc 110.01 Portland Cement: 66.63 Blast Furnace Slag: 33.03 Getter: Iron III Phosphate 10.04
Hot Blank ORP Adjusted
Basin 43 GW Brine + 99Tc 110.01 Portland Cement: 66.62 Blast Furnace Slag: 33.31 Getter: none —
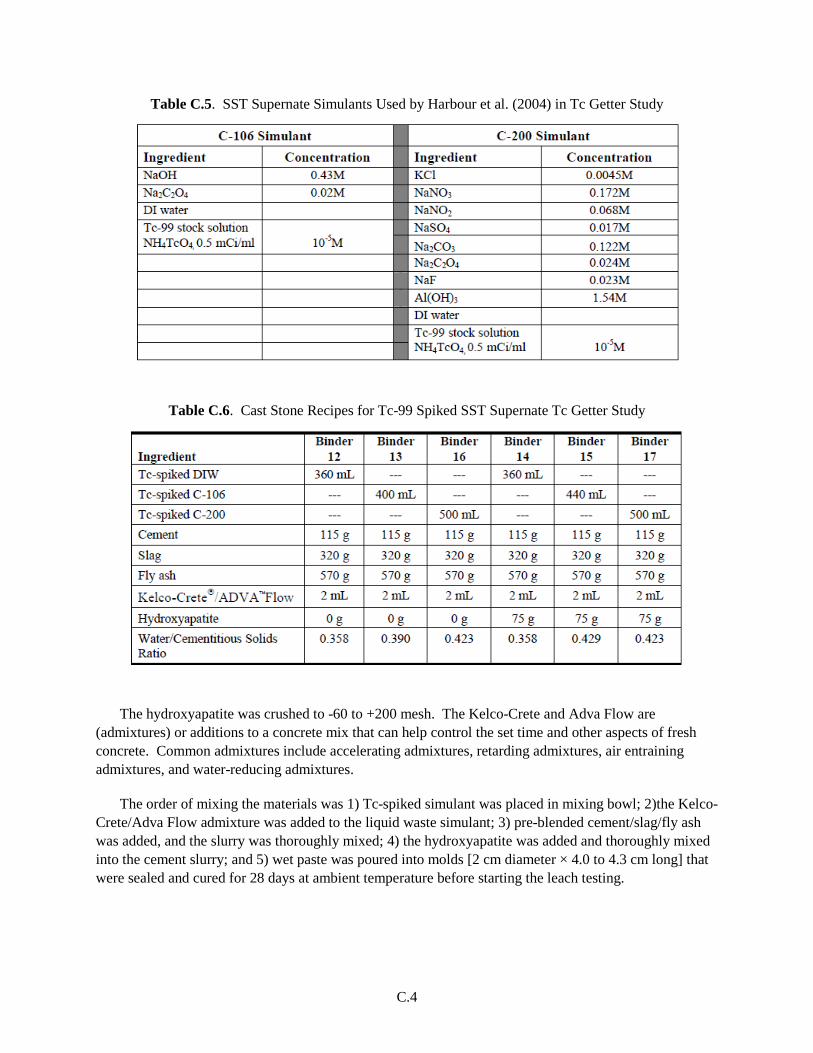
C.4
Table C.5. SST Supernate Simulants Used by Harbour et al. (2004) in Tc Getter Study
Table C.6. Cast Stone Recipes for Tc-99 Spiked SST Supernate Tc Getter Study
The hydroxyapatite was crushed to -60 to +200 mesh. The Kelco-Crete and Adva Flow are
(admixtures) or additions to a concrete mix that can help control the set time and other aspects of fresh concrete. Common admixtures include accelerating admixtures, retarding admixtures, air entraining admixtures, and water-reducing admixtures.
The order of mixing the materials was 1) Tc-spiked simulant was placed in mixing bowl; 2)the Kelco-Crete/Adva Flow admixture was added to the liquid waste simulant; 3) pre-blended cement/slag/fly ash was added, and the slurry was thoroughly mixed; 4) the hydroxyapatite was added and thoroughly mixed into the cement slurry; and 5) wet paste was poured into molds [2 cm diameter × 4.0 to 4.3 cm long] that were sealed and cured for 28 days at ambient temperature before starting the leach testing.
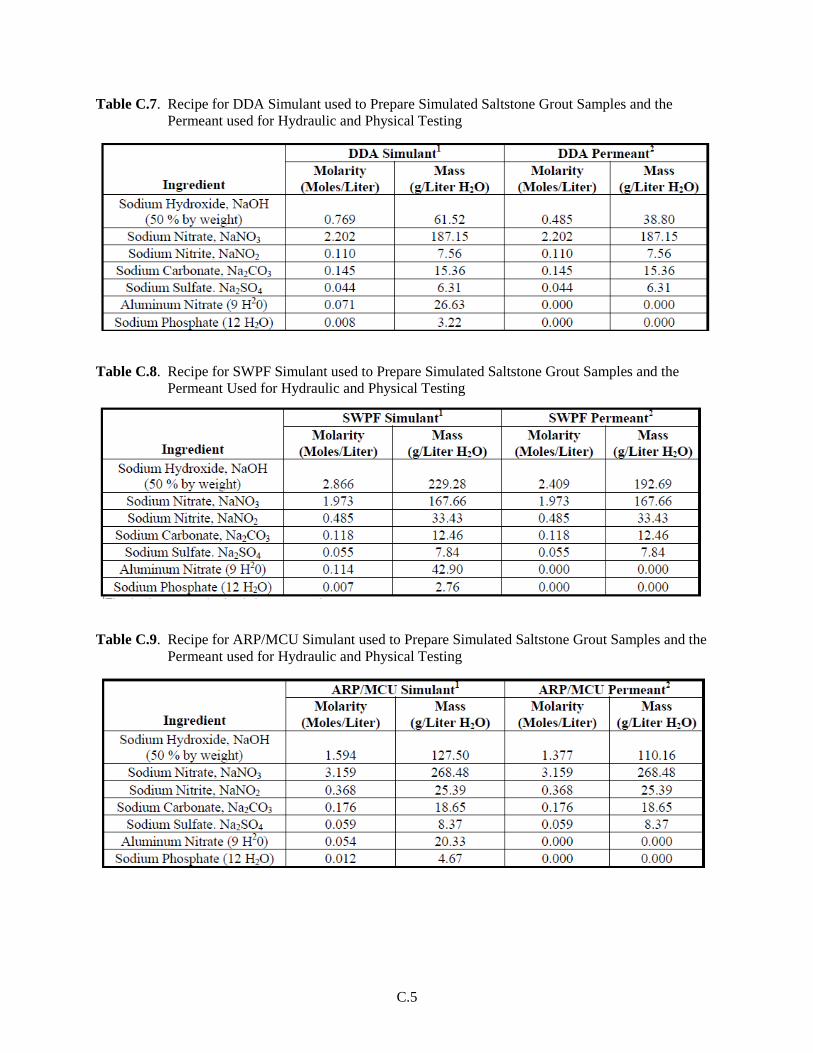
C.5
Table C.7. Recipe for DDA Simulant used to Prepare Simulated Saltstone Grout Samples and the Permeant used for Hydraulic and Physical Testing
Table C.8. Recipe for SWPF Simulant used to Prepare Simulated Saltstone Grout Samples and the Permeant Used for Hydraulic and Physical Testing
Table C.9. Recipe for ARP/MCU Simulant used to Prepare Simulated Saltstone Grout Samples and the Permeant used for Hydraulic and Physical Testing
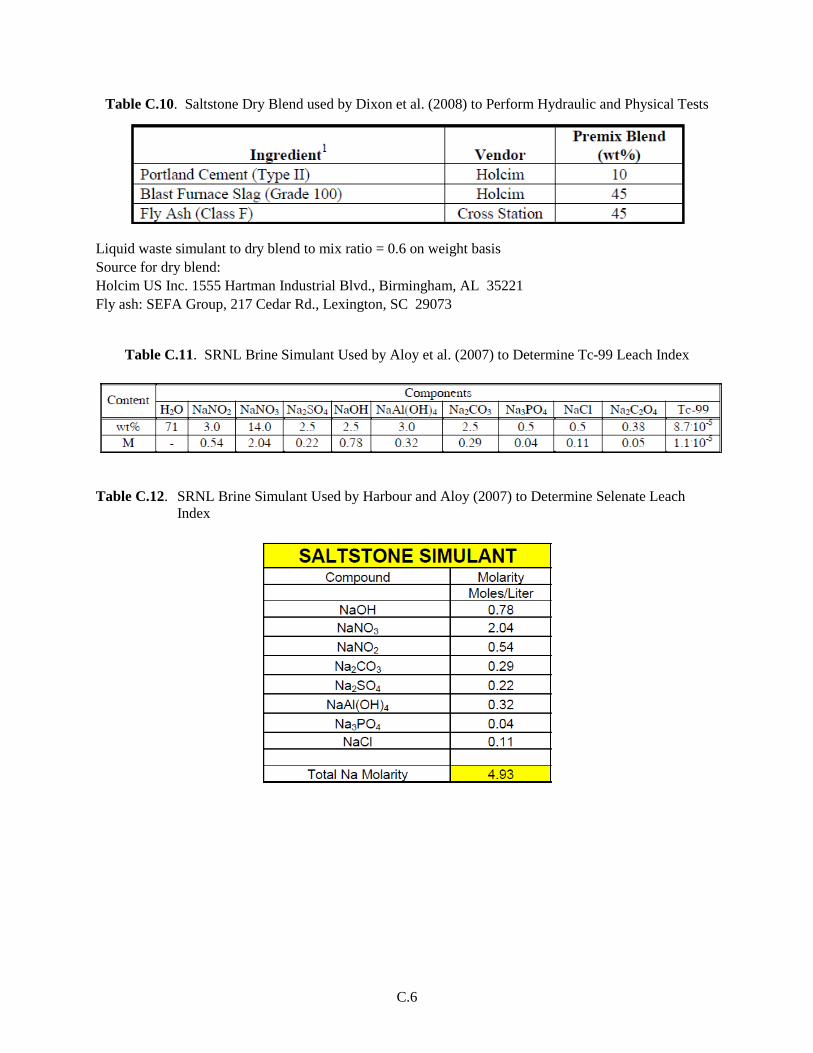
C.6
Table C.10. Saltstone Dry Blend used by Dixon et al. (2008) to Perform Hydraulic and Physical Tests
Liquid waste simulant to dry blend to mix ratio = 0.6 on weight basis Source for dry blend: Holcim US Inc. 1555 Hartman Industrial Blvd., Birmingham, AL 35221 Fly ash: SEFA Group, 217 Cedar Rd., Lexington, SC 29073
Table C.11. SRNL Brine Simulant Used by Aloy et al. (2007) to Determine Tc-99 Leach Index
Table C.12. SRNL Brine Simulant Used by Harbour and Aloy (2007) to Determine Selenate Leach Index
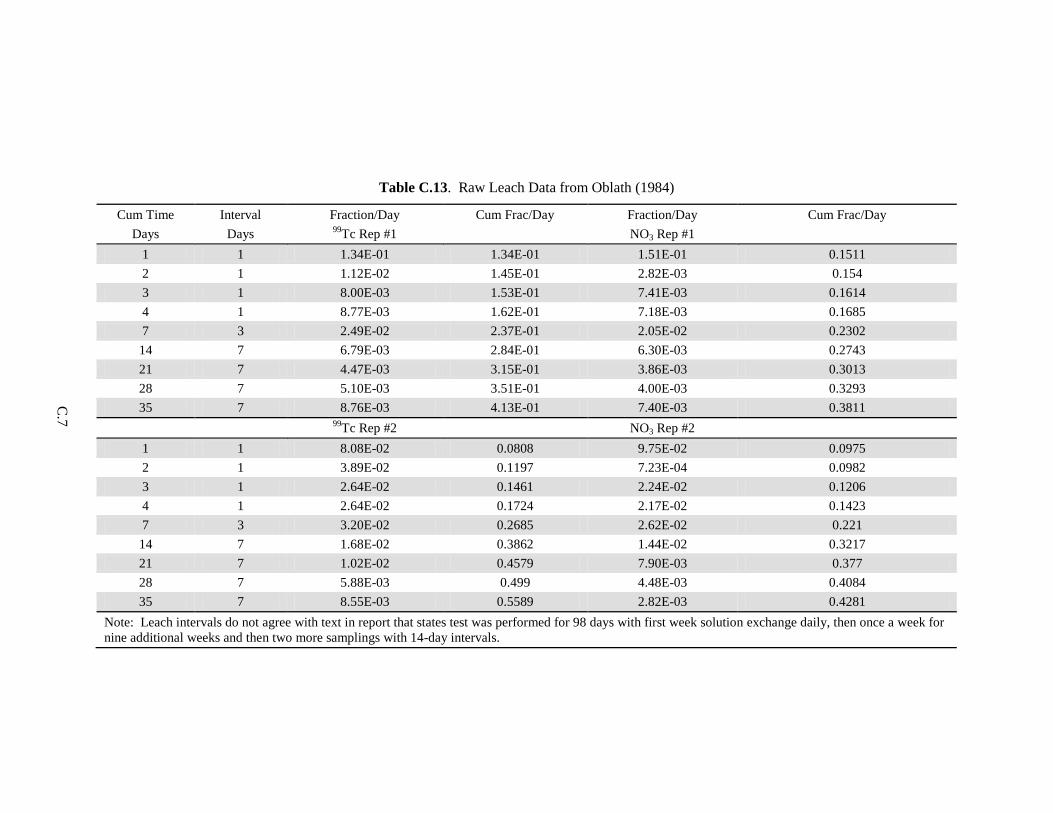
C.7
Table C.13. Raw Leach Data from Oblath (1984)
Cum Time Interval Fraction/Day Cum Frac/Day Fraction/Day Cum Frac/Day Days Days 99Tc Rep #1 NO3 Rep #1
1 1 1.34E-01 1.34E-01 1.51E-01 0.1511 2 1 1.12E-02 1.45E-01 2.82E-03 0.154 3 1 8.00E-03 1.53E-01 7.41E-03 0.1614 4 1 8.77E-03 1.62E-01 7.18E-03 0.1685 7 3 2.49E-02 2.37E-01 2.05E-02 0.2302 14 7 6.79E-03 2.84E-01 6.30E-03 0.2743 21 7 4.47E-03 3.15E-01 3.86E-03 0.3013 28 7 5.10E-03 3.51E-01 4.00E-03 0.3293 35 7 8.76E-03 4.13E-01 7.40E-03 0.3811 99Tc Rep #2 NO3 Rep #2
1 1 8.08E-02 0.0808 9.75E-02 0.0975 2 1 3.89E-02 0.1197 7.23E-04 0.0982 3 1 2.64E-02 0.1461 2.24E-02 0.1206 4 1 2.64E-02 0.1724 2.17E-02 0.1423 7 3 3.20E-02 0.2685 2.62E-02 0.221 14 7 1.68E-02 0.3862 1.44E-02 0.3217 21 7 1.02E-02 0.4579 7.90E-03 0.377 28 7 5.88E-03 0.499 4.48E-03 0.4084 35 7 8.55E-03 0.5589 2.82E-03 0.4281
Note: Leach intervals do not agree with text in report that states test was performed for 98 days with first week solution exchange daily, then once a week for nine additional weeks and then two more samplings with 14-day intervals.

C.8
Table C.14. LAW Simulant and Actual LAW Waste Used by Lockrem (2005)
Analyte LAW Simulant [M] Actual LAW [M] % Difference Al 0.058 0.208 -72 B N/A 0.0021 N/A C2O4 0.0097 0.0105 -7.4 CO3 (TIC) 0.484 0.533 -9.1 Ca N/A 0.0014 N/A Cl 0.0430 0.415 3.6 Cr 0.0097 0.0186 -48 F 0.030 0.018 63 K 0.0118 0.0090 30 Na 4.75 5.10 -6.9 NO2 0.414 0.414 0 NO3 2.34 2.44 -4.4 Free OH- 0.52 0.51 2.2 PO4 0.0461 0.0515 -11 Si N/A 0.0039 N/A SO4 0.0891 0.0932 -4.5 Other soluble TOC (e.g., acetate)
0.36 N/A N/A
TOC 0.285 0.233 22.6 (a) From Rassat et al. (2003). (b) Concentrations in molarity.

Appendix D
Figures Depicting the Text Matrix for Cast Stone Getter Testing for Iodide-Rich Secondary Waste Simulant

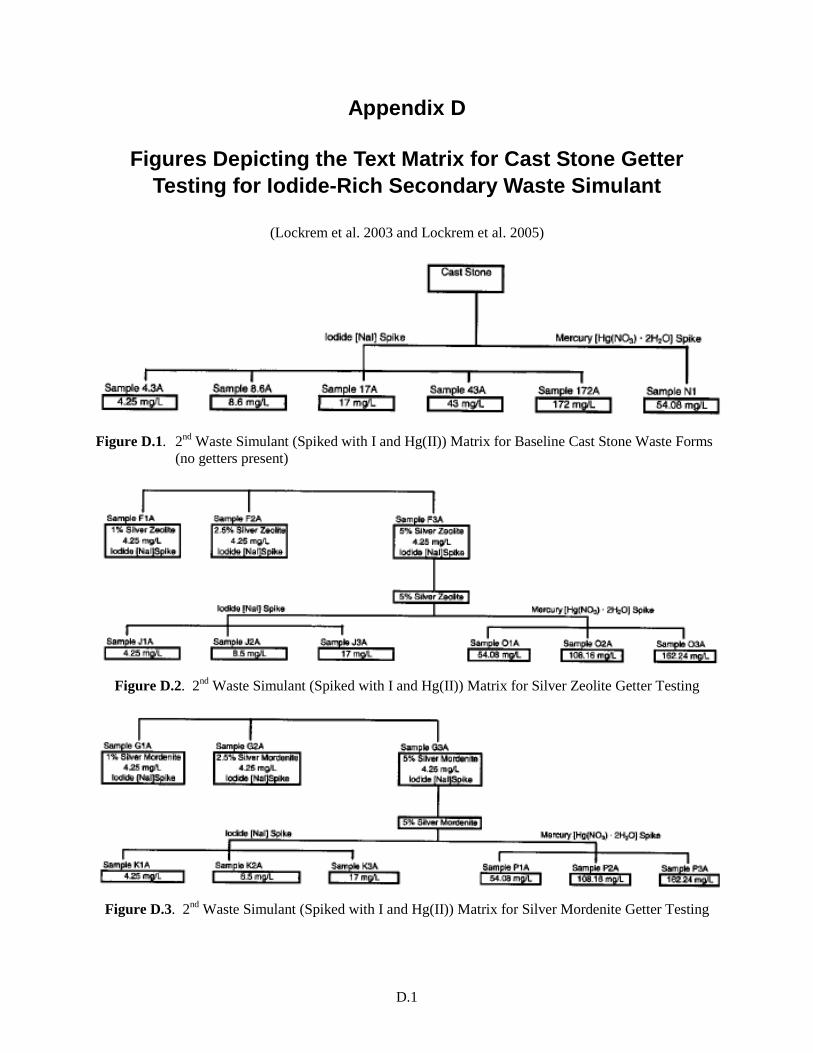
D.1
Appendix D
Figures Depicting the Text Matrix for Cast Stone Getter Testing for Iodide-Rich Secondary Waste Simulant
(Lockrem et al. 2003 and Lockrem et al. 2005)
Figure D.1. 2nd Waste Simulant (Spiked with I and Hg(II)) Matrix for Baseline Cast Stone Waste Forms
(no getters present)
Figure D.2. 2nd Waste Simulant (Spiked with I and Hg(II)) Matrix for Silver Zeolite Getter Testing
Figure D.3. 2nd Waste Simulant (Spiked with I and Hg(II)) Matrix for Silver Mordenite Getter Testing
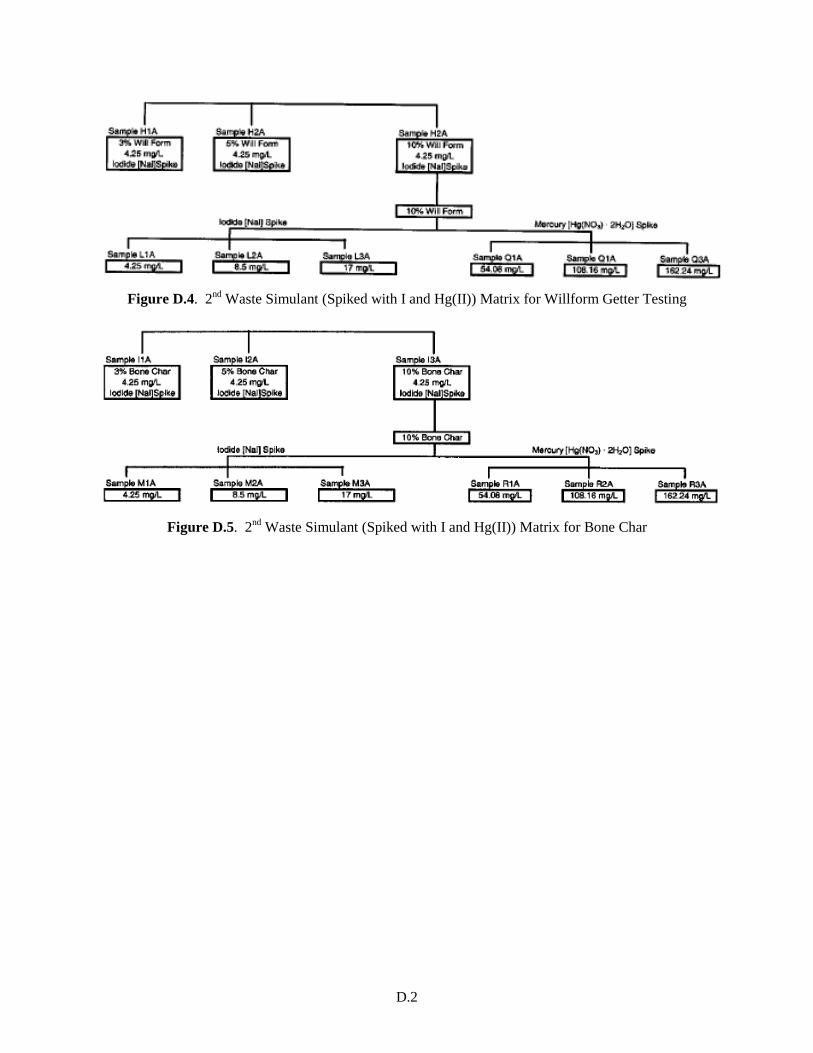
D.2
Figure D.4. 2nd Waste Simulant (Spiked with I and Hg(II)) Matrix for Willform Getter Testing
Figure D.5. 2nd Waste Simulant (Spiked with I and Hg(II)) Matrix for Bone Char
Appendix E
Specification Sheets from Vendors for Cast Stone Dry Blend Ingredients


E.1
Appendix E
Specification Sheets from Vendors for Cast Stone Dry Blend Ingredients
Figure E.1. Vendor Spec Sheet for Fly Ash
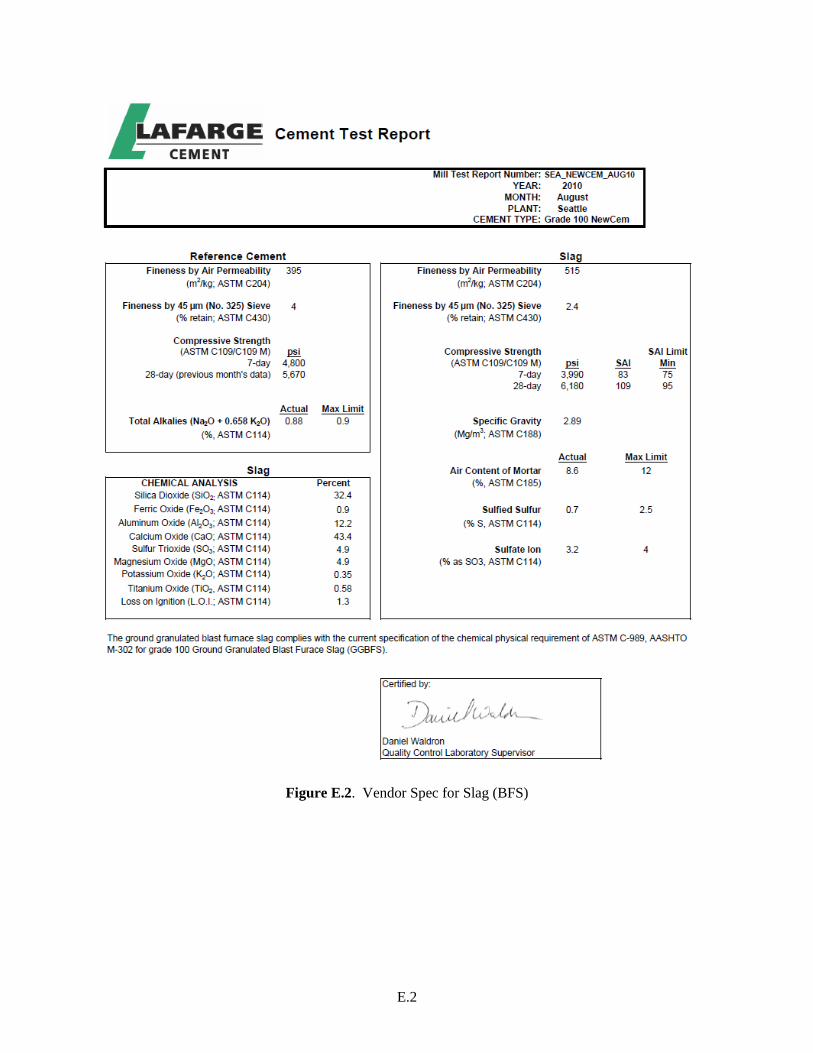
E.2
Figure E.2. Vendor Spec for Slag (BFS)
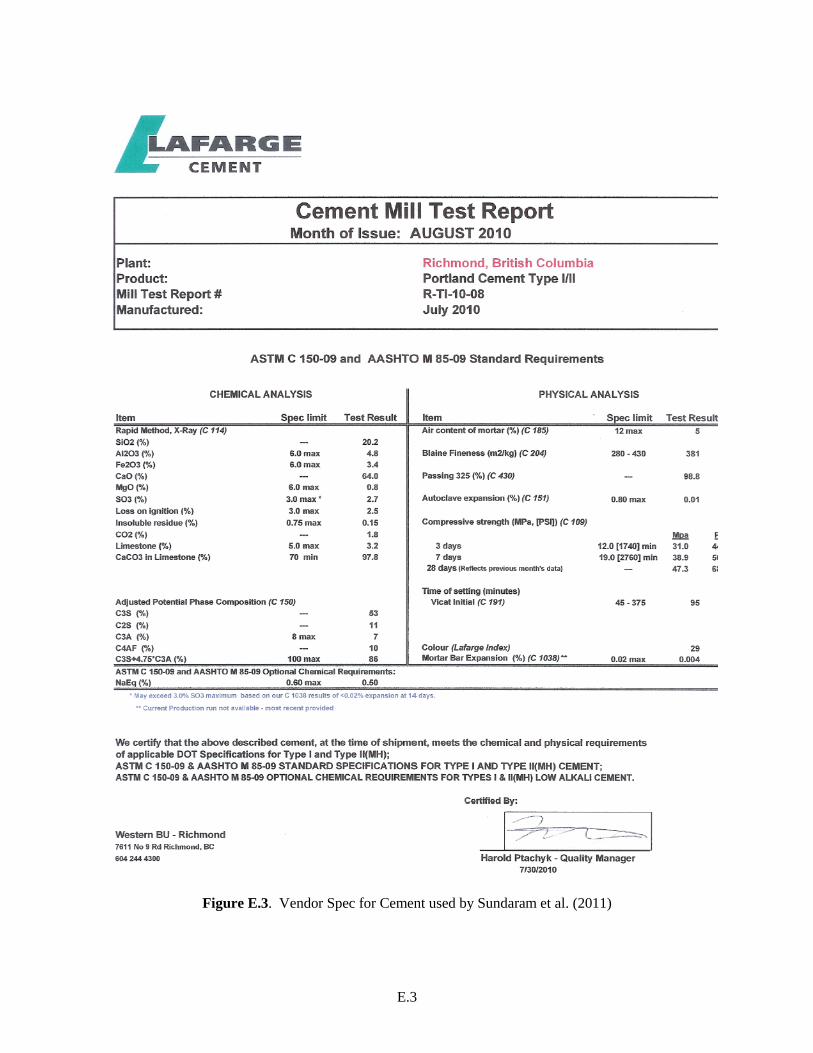
E.3
Figure E.3. Vendor Spec for Cement used by Sundaram et al. (2011)

Appendix F
Flow Schematics and Description of Savannah River (Z Plant) Saltstone Facility

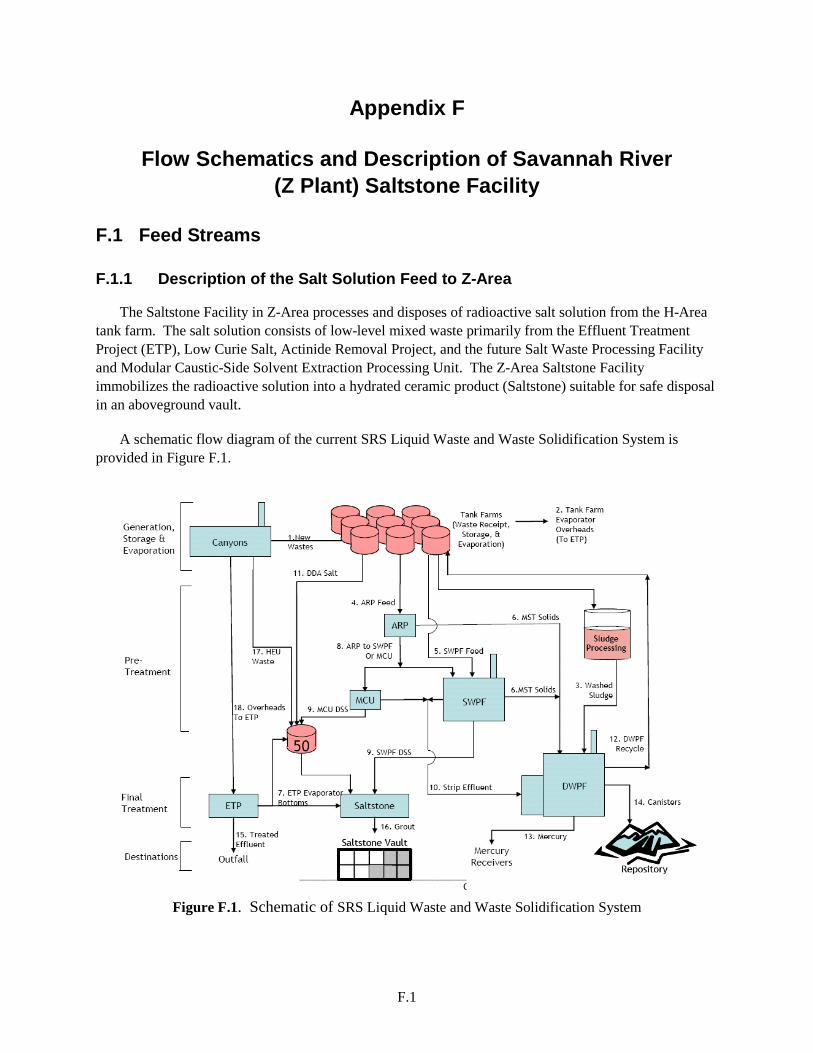
F.1
Appendix F
Flow Schematics and Description of Savannah River (Z Plant) Saltstone Facility
F.1 Feed Streams
F.1.1 Description of the Salt Solution Feed to Z-Area
The Saltstone Facility in Z-Area processes and disposes of radioactive salt solution from the H-Area tank farm. The salt solution consists of low-level mixed waste primarily from the Effluent Treatment Project (ETP), Low Curie Salt, Actinide Removal Project, and the future Salt Waste Processing Facility and Modular Caustic-Side Solvent Extraction Processing Unit. The Z-Area Saltstone Facility immobilizes the radioactive solution into a hydrated ceramic product (Saltstone) suitable for safe disposal in an aboveground vault.
A schematic flow diagram of the current SRS Liquid Waste and Waste Solidification System is provided in Figure F.1.
Figure F.1. Schematic of SRS Liquid Waste and Waste Solidification System
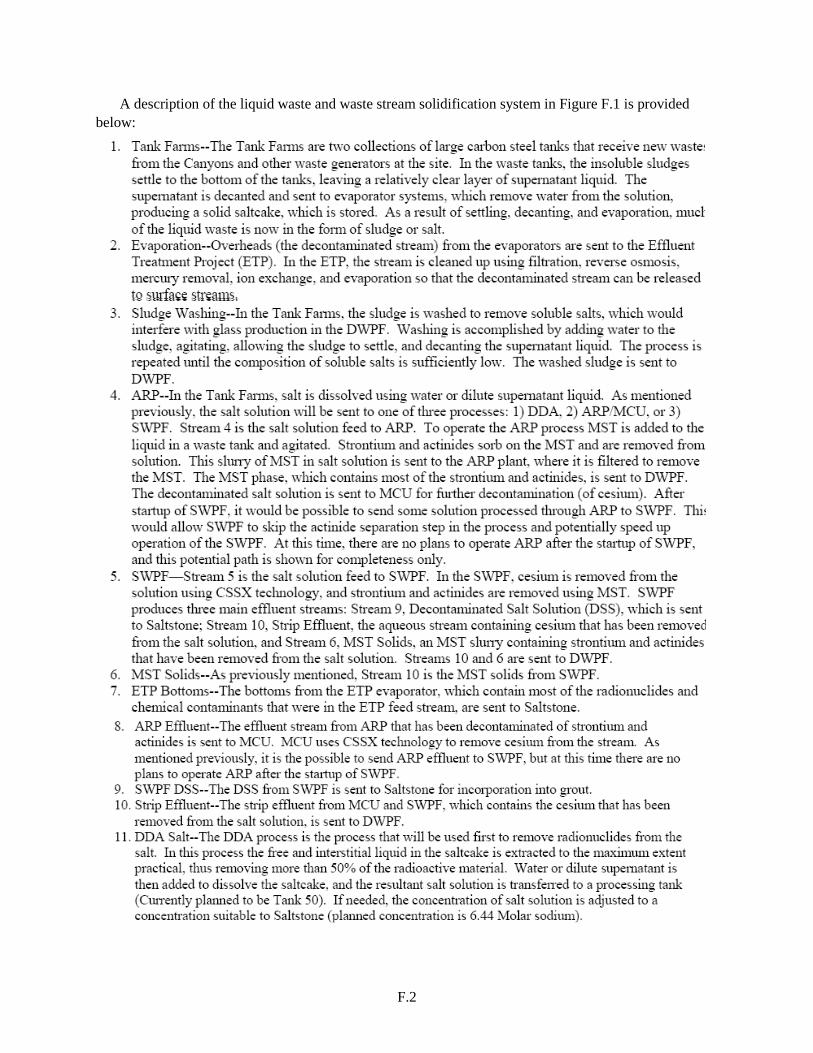
F.2
A description of the liquid waste and waste stream solidification system in Figure F.1 is provided below:

F.3
F.1.2 Description of Z-Area Salt Solution Feed (New Design Basis)
An interim salt processing campaign to remove low-activity salt waste from storage tanks at the SRS is planned to commence October 2005. The low-activity salt waste will be treated and disposed of at the Saltstone Production and Disposal Facility (SPDF) in order to maintain sufficient tank space for sludge processing a the Defense Waste Processing Facility (DWPF) and to allow staging of salt solution feed prior to startup of the Salt Waste Processing Facility (SWPF). The concentrations of the constituents in the decontaminated salt solution originally outlined in the Industrial Wastewater Treatment Facility (IWTF) and Industrial Solid Waste Landfill (ISWLF) permits for the SPDF will change as a result of interim salt processing activities.
The planned dates for sending the first nine batches of waste from the DDA and MCU processes to Saltstone are listed in Table F.1. The nominal average chemical concentrations expected in the decontaminated salt solutions resulting from salt waste treatment by the Deliquification, Dissolution, and Adjustment (DDA) process and the Actinide Removal Processes (ARP)/Modular Caustic Side Solvent Extraction (CSSX) Unit (MCU) are provided in Table F.2.
Table F.1. Schedule for sending DDA and ARP/MCU Waste Batches Accumulated in Tank 50-H to Saltstone

F.4
These estimated nominal average chemical compositions were prepared for tank waste management planning. The average compositions of the DDA waste and the ARP/MCU waste streams are provided in Table F.2. The concentrations in Table F.3 for the liquid waste sent to the Saltstone facility are weighted averages from concentrations obtained from SpaceMan Plus™ software runs performed by the WSRC Closure Business Unite personnel unless otherwise noted.
Table F.2. Average Estimated Compositions of Waste from the DDA and ARP/MCU Liquid Waste Treatment Processes
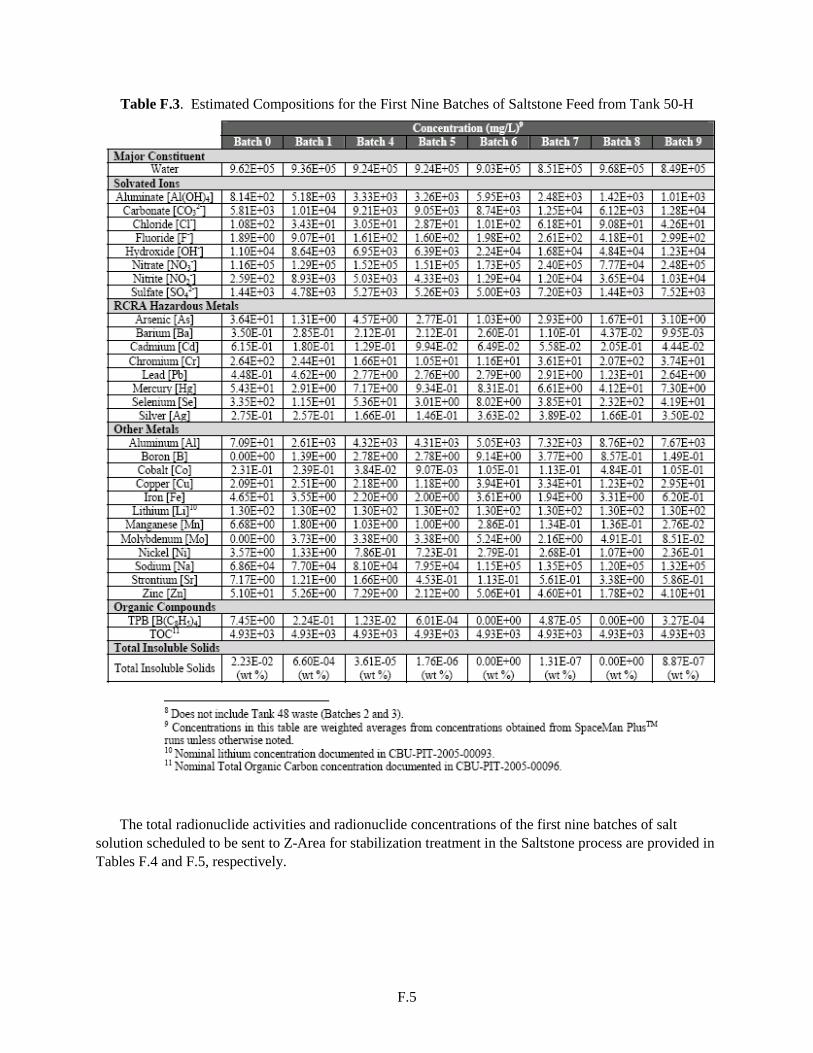
F.5
Table F.3. Estimated Compositions for the First Nine Batches of Saltstone Feed from Tank 50-H
The total radionuclide activities and radionuclide concentrations of the first nine batches of salt
solution scheduled to be sent to Z-Area for stabilization treatment in the Saltstone process are provided in Tables F.4 and F.5, respectively.
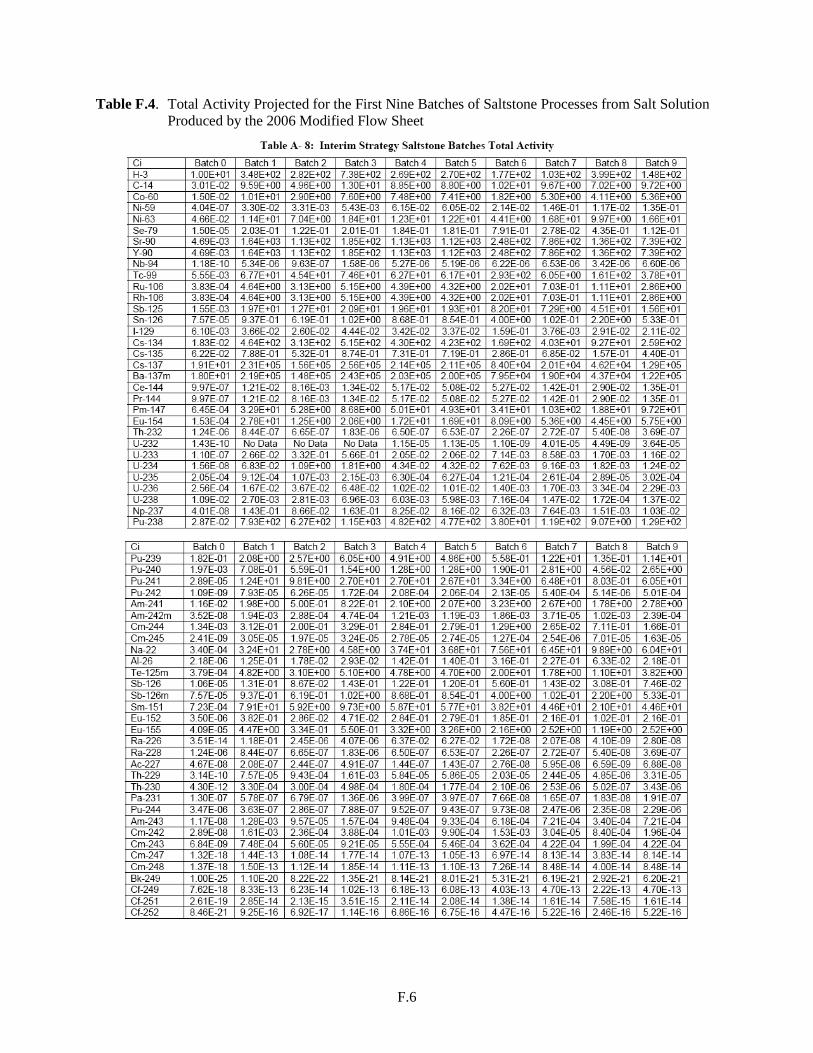
F.6
Table F.4. Total Activity Projected for the First Nine Batches of Saltstone Processes from Salt Solution Produced by the 2006 Modified Flow Sheet
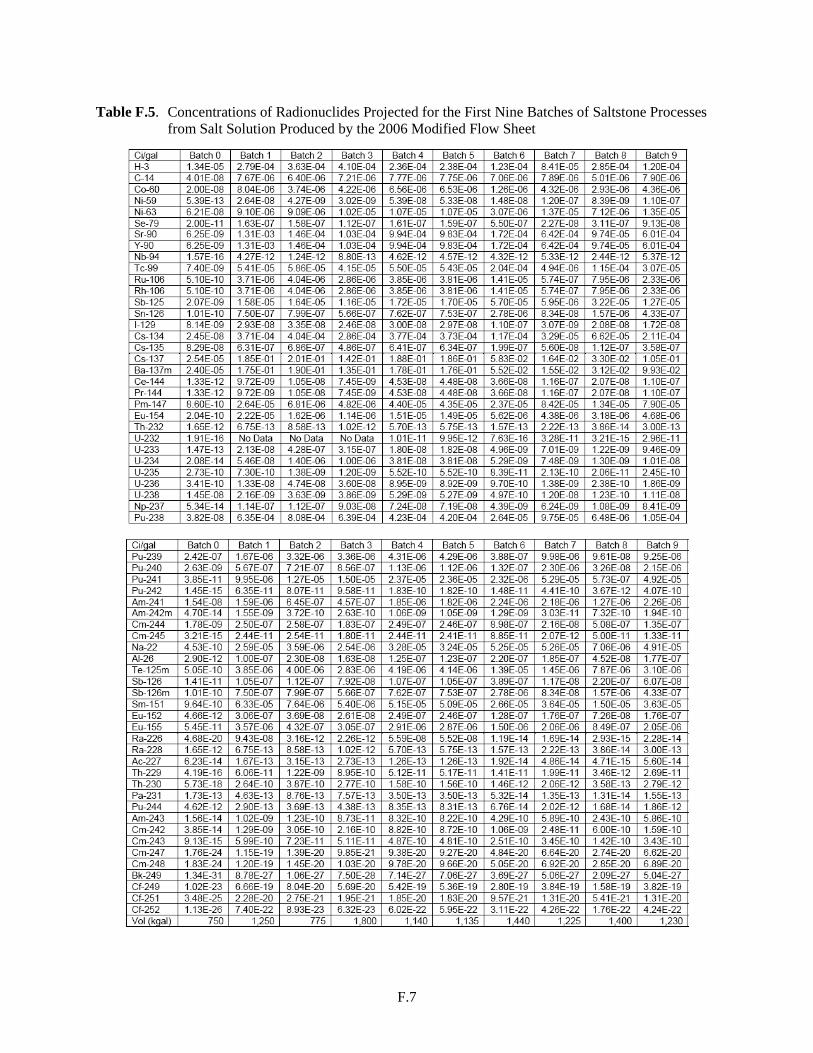
F.7
Table F.5. Concentrations of Radionuclides Projected for the First Nine Batches of Saltstone Processes from Salt Solution Produced by the 2006 Modified Flow Sheet

F.8
F.1.3 Description of Dry Materials
The premix and salt solution are fed to a continuous mixer to produce Saltstone, which is a leach-resistant solid and non-hazardous as defined by regulations. The combination of the Saltstone waste form and the concrete disposal vault limits migration of the chemical and radioactive constituents such that the groundwater at the disposal site boundary will meet drinking water standards.
The cementitious reagents used in the Saltstone waste form are Portland cement, ground granulated BFS and fly ash. Currently Type I/II Portland cement, Grade 100 BFS, and Class F fly ash meeting ASTM specifications C-150, C-989, and C-618, are procured in bulk from commercial suppliers. Oxide compositions of the bulk reagents from the current suppliers (2005/2006) are listed in Table F.6.
Table F.6. Chemical Compositions of Cement, Slag, and Fly Ash Used in Saltstone
Oxide Analysis
Portland Cement (wt%)
Grade 100 Slag (wt%)
Class F Fly Ash (wt%)
Batch 1 Batch 2 Batch 1 Batch 2 Batch 1 Batch 2 SiO2 20.5 20.3 37.9 40.4 54.2 56.8 TiO2 0.3 0.3 0.4 0.3 1.6 1.4 Al2O3 5.4 5.2 8.4 6.6 28.6 28.6 Fe2O3 3.7 3.8 0.4 0.3 6.0 5.6 CaO 64.9 63.0 38.5 35.0 0.7 0.6 MgO 1.2 1.2 12.9 13.1 0.9 0.8 Na2O 0.1 0.2 0.3 0.3 0.3 0.4 K2O 0.5 0.7 0.3 0.5 2.6 2.5 SO4 3.2 3.3 1.0 2.5 0.1 0.3 Volatiles NM NM NM NM 2.5 1.4 Total 99.8 98.0 100.1 99.0 97.5 98.4 NM = Not Measured.
F.1.4 Description of Saltstone Process
The Saltstone process system includes equipment and facilities for: dry bulk material handling, storage, and blending, salt solution transfer and metering, processing-aid admixture handling, Saltstone mixing and transfer, and vault filling. Portland cement, ground granulated BFS, and Class F fly ash are unloaded from trucks and pneumatically conveyed to storage silos. The dry solids are discharged from the silos, weighed and blended to produce a premix.
F.1.4.1 Description of Dry Materials Handling Equipment
Dry bulk materials, cement, slag, and fly ash are delivered separately in trucks. The truck unloading system consists of one station (inlet piping and isolation valve) for each of the four silos. Dry materials arriving in trucks are unloaded using blowers supplied by the vendor/shipper.
The Saltstone facility has four 17,850 cubic feet capacity silos, 22 feet in diameter and 59 feet high, for storing the dry cementitious reagents. The nominal weight capacity is 1,000 tons for the cement and slag silos and 560 tons for the less dense fly ash. Two baghouse collectors control dust vented from the receiving silo during a transfer. The collectors are mounted on silos #2 and #4. Collected dust is

F.9
periodically discharged into the silo on which the collector is mounted. A simplified flow diagram of the silo storage facility is provided in Figure F.2.
Figure F.2. Cementitious Regent Silo Storage Facility
F.1.4.2 Premix Blending and Conveying System
Cement, slag, and fly ash are each discharged from the respective storage silos, weighed separately into batch quantities, and then combined. This unmixed batch of the three materials is then blended to a uniform mixture, referred to as premix. The blended product is transferred to the premix feed bin which is located above the 210-Z Process building.
The dry materials are discharged from each storage silo through discharge valves into an enclosed air slide (one per silo) which conveys the fluidized material down slop to a weigh hopper centrally located under the four silos. Cement, slag and fly ash, each in turn are weighed to predetermined quantities to achieve a specified ratio in the batch. Fast and slow feed controls enable rapid initial filling of the hopper below, followed by slow filling as the hopper nears the target weight. A passive baghouse collector on the hopper controls the dust generated in the transfer operation.
The blending panel and programmable logic controller in the Central Control Room receive weight signals from the weigh hopper load cells and automatically control this process. Three sets of two load cells, each set has one load cell operating and one redundant, are mounted 120° apart and support the hopper on it upper circumference. As the predetermined weight of dry material is reached, the weigh hopper feed valve between each air slide and hopper close. The weigh hopper discharge valve opens and the contents empty into the empty (idle) premix blender unit. (During routine operations, one premix

F.10
blender is discharging into the premix hopper while the other is being filled.) A passive baghouse collector on each blender controls the dust generated when the material s discharge into the blender vessel.
Blending is initiated when a batch of cement, slag, and fly ash has been accumulated in one of the blender vessels. Fluidizing air from the air compressors is injected into the tank over a period of time to thoroughly mix the constituents. The blended product is call premix.
When the blending process is complete, the premix batch is transferred to the premix feed bin above the 210-Z Process Building using a dense-phase pneumatic transfer system. The premix is blown out of the pressurizing blending tank when the tank discharge valve opens at a preset pressure. The fluidized material is carried horizontally through a pipeline in a covered trench to the 210-Z Process Building, then upward through the line until it discharges into the top of the premix bin.
Simplified flow diagrams of the premix weighing and blending and premix blending and conveying compressed air supply are provided in Figures F.3 and F.4, respectively.
F.1.4.3 Premix Feeder System
Blended premix that has been transferred from the silo area is received in a bin that provides surge capacity for a weighing-feeding system. This feeding system provides a controlled flow of premix to the Saltstone mixer.
The premix is received into the premix feed bin, a conical-bottom 50-ton-capacity cylindrical bin that supplies cementitious reagents for 1 to 2 hours of normal operation. A baghouse collector on the premix bin retains the dust vented during the transfer from the blending tanks. Continuous and high-level instrumentation monitor the bin level.
The bin discharge cone is steep-angled. Three exterior aeration rings at spaced intervals near the bottom outlet assist discharge by injecting air through bin wall openings into the material. The bin discharges from its bottom cone outlet to the premix weigh bin, first, through a pneumatic slide gate shutoff valve, second, through an air operated butterfly fill control valve.
The material enters the weigh hopper through a tapered insert nozzle contained within a flexible connection. Air is injected downward along the sides of the nozzle to assist material flow through the constriction. Dust generated by material coming into the hopper is controlled by the premix bin dust collector. The hopper vents into the top of the premix bin above.
The weigh hopper has about an 8-ton capacity and handles up to 50 tons per hour of premix. The hopper is supported on load cells which enable feeding of the solids by dual variable-speed screw feeders on a loss-in-weight basis.
The loss-in-weight signal from the load cells sets the speed of the feeders. The feeder speed is maintained constant during filling of the weigh hopper. Agitators in the hopper bottom facilitate movement of the material into the dual screw feeders contained in the contiguous feeder housing. Material discharged from the feeders passes through a transition hopper that penetrates the regulated process area roof and drops vertically into the Saltstone mixer below.

F.11
Figure F.3. Premix Weighing and Blending System
A simplified flow diagram of the premix feeding system is provided in Figure F.5.
F.1.5 Salt Solution Feed System
The Salt Feed Tank receives salt solution through the inter-area transfer line. An agitator mixes the tank contents for sampling and suspends insoluble solids in the salt solution as it is received. Sampling capability is provided with an air jet sampler. The tank is vented to the process vent system. Outdoor salt solution lines are electronically heat traced and insulated to prevent crystallization.

F.12
Figure F.4. Premix Blending/Conveying Compressed Air System
A centrifugal pump and flow control valve feed salt solution to the Saltstone mixer. The salt solution
feed rate to the mixer is controlled based on a water to premix ratio. Nominal salt solution feed rate is 104 gpm. A recirculation line and pressure control valve regulates the pressure in the feed line. A water line to the pump primes the pump during startup.
An admixture addition station is provided to allow the metering of admixtures into the suction of the Salt Feed Tank Pump. The mist eliminator drain, flush lines from the pig launcher 4-way valves, regulated drains from the labs and process room, and the leachate return system are routed to the Salt Feed Tank for processing through the mixer and disposal in the vaults.
The Salt Feed Tank is a 6,500-gallon (working volume) carbon steel tank located in a concrete pit adjacent to the 210-Z Process Building. The tank and pit are covered with a roof for weather protection. The floor of the pit is sloped to direct spillage or leakage into a sump. A sump pump transfers any liquid spillage back to the Salt Feed Tank.
Salt solution is classified as a mixed waste because it is both radioactive and hazardous. It displays the characteristics of corrosivity (high pH) and metal toxicity (chromium content). The salt solution contains about 29 weight percent salt and has a density of about 1.23 kg/l. The salts are primarily sodium nitrate, sodium nitrite, and sodium hydroxide. The primary radionuclides in the salt solution are H-3, Sr-90, Tc-99, Sb-125, and Cs-137. Bounding chemical composition and radionuclide contents of the salt solution is provided in Tables F.2 through F.5.
Simplified Saltstone mixing and transfer flow diagrams are provided in Figures F.6 and F.7.

F.13
Figure F.5. Premix Blending System
F.1.6 Clean Cap Batch Tank
The Clean Cap Batch Tank (CCBT) is a 45,000 gallon (working volume) carbon steel tank located partially below grade in a concrete pit adjacent to the 210-Z Process Building. The tank and pit are covered with a roof for weather protection. The floor of the pit is sloped to direct spillage or leakage into a sump. A sump pump transfers any liquid to the CCBT or to the Salt Feed Tank (SFT).
F.1.7 Saltstone Mixing and Disposal
F.1.7.1 Saltstone Waste Form
The Saltstone mixer receives salt solution and premix (cement, slag, and fly ash) and mixes them to produce the Saltstone grout. The premix is gravity fed from a loss-in-weight feeder. Salt solution is fed

F.14
into the mixer at a flow rate based on the premix feed rate. The mixer is a continuous, variable-speed, twin screw mixer. The grout production rate is about 150 gpm. The nominal composition of Saltstone is provided in Table F.7.
Figure F.6. Salt Solution Feed System
Figure F.7. Salt Solution and Saltstone Transfer System
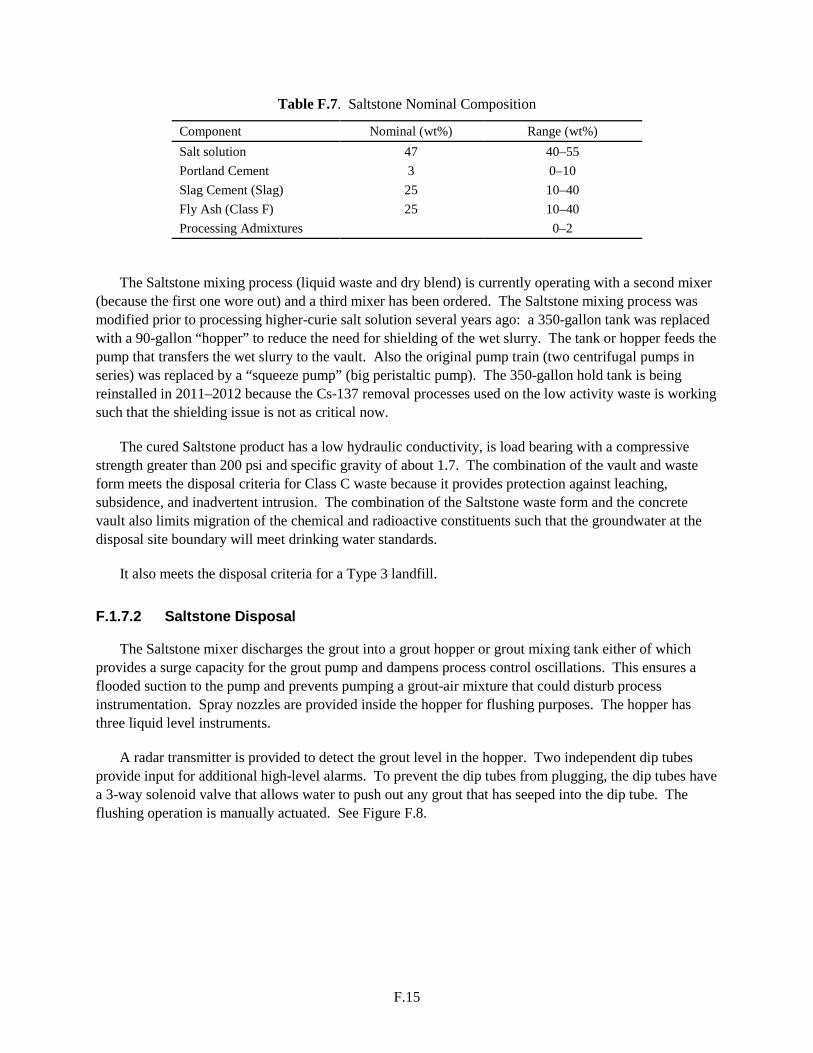
F.15
Table F.7. Saltstone Nominal Composition
Component Nominal (wt%) Range (wt%) Salt solution 47 40–55 Portland Cement 3 0–10 Slag Cement (Slag) 25 10–40 Fly Ash (Class F) 25 10–40 Processing Admixtures 0–2
The Saltstone mixing process (liquid waste and dry blend) is currently operating with a second mixer (because the first one wore out) and a third mixer has been ordered. The Saltstone mixing process was modified prior to processing higher-curie salt solution several years ago: a 350-gallon tank was replaced with a 90-gallon “hopper” to reduce the need for shielding of the wet slurry. The tank or hopper feeds the pump that transfers the wet slurry to the vault. Also the original pump train (two centrifugal pumps in series) was replaced by a “squeeze pump” (big peristaltic pump). The 350-gallon hold tank is being reinstalled in 2011–2012 because the Cs-137 removal processes used on the low activity waste is working such that the shielding issue is not as critical now.
The cured Saltstone product has a low hydraulic conductivity, is load bearing with a compressive strength greater than 200 psi and specific gravity of about 1.7. The combination of the vault and waste form meets the disposal criteria for Class C waste because it provides protection against leaching, subsidence, and inadvertent intrusion. The combination of the Saltstone waste form and the concrete vault also limits migration of the chemical and radioactive constituents such that the groundwater at the disposal site boundary will meet drinking water standards.
It also meets the disposal criteria for a Type 3 landfill.
F.1.7.2 Saltstone Disposal
The Saltstone mixer discharges the grout into a grout hopper or grout mixing tank either of which provides a surge capacity for the grout pump and dampens process control oscillations. This ensures a flooded suction to the pump and prevents pumping a grout-air mixture that could disturb process instrumentation. Spray nozzles are provided inside the hopper for flushing purposes. The hopper has three liquid level instruments.
A radar transmitter is provided to detect the grout level in the hopper. Two independent dip tubes provide input for additional high-level alarms. To prevent the dip tubes from plugging, the dip tubes have a 3-way solenoid valve that allows water to push out any grout that has seeped into the dip tube. The flushing operation is manually actuated. See Figure F.8.
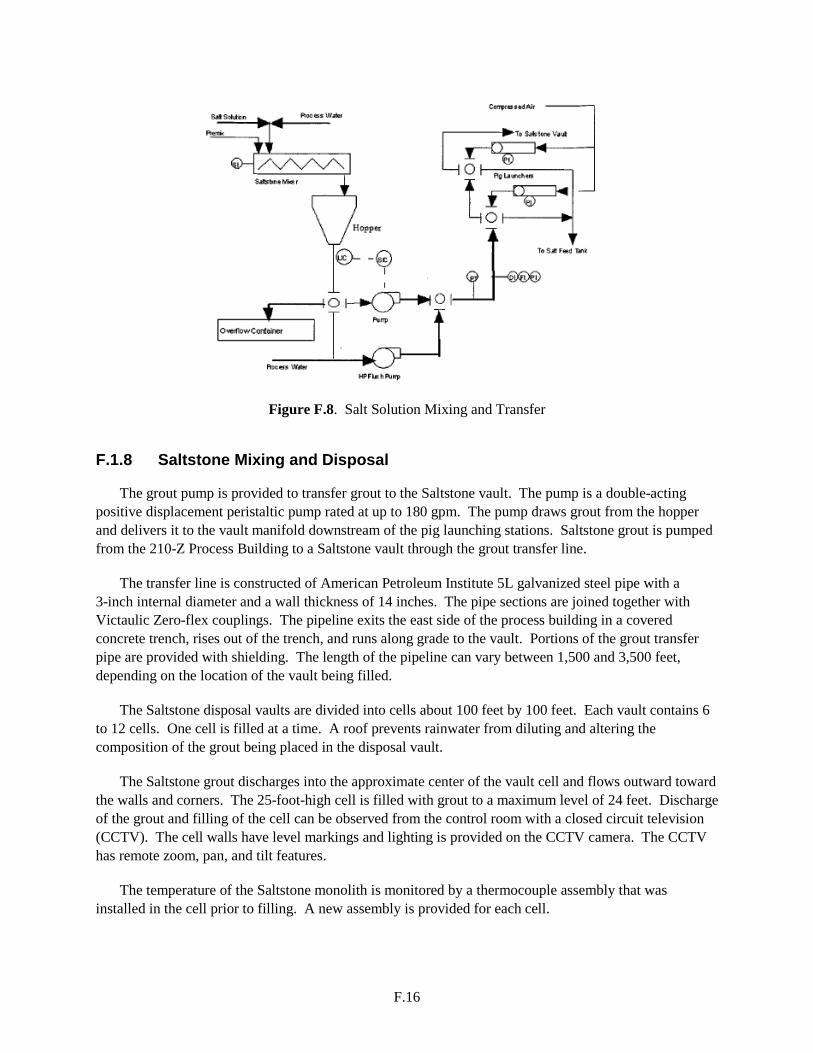
F.16
Figure F.8. Salt Solution Mixing and Transfer
F.1.8 Saltstone Mixing and Disposal
The grout pump is provided to transfer grout to the Saltstone vault. The pump is a double-acting positive displacement peristaltic pump rated at up to 180 gpm. The pump draws grout from the hopper and delivers it to the vault manifold downstream of the pig launching stations. Saltstone grout is pumped from the 210-Z Process Building to a Saltstone vault through the grout transfer line.
The transfer line is constructed of American Petroleum Institute 5L galvanized steel pipe with a 3-inch internal diameter and a wall thickness of 14 inches. The pipe sections are joined together with Victaulic Zero-flex couplings. The pipeline exits the east side of the process building in a covered concrete trench, rises out of the trench, and runs along grade to the vault. Portions of the grout transfer pipe are provided with shielding. The length of the pipeline can vary between 1,500 and 3,500 feet, depending on the location of the vault being filled.
The Saltstone disposal vaults are divided into cells about 100 feet by 100 feet. Each vault contains 6 to 12 cells. One cell is filled at a time. A roof prevents rainwater from diluting and altering the composition of the grout being placed in the disposal vault.
The Saltstone grout discharges into the approximate center of the vault cell and flows outward toward the walls and corners. The 25-foot-high cell is filled with grout to a maximum level of 24 feet. Discharge of the grout and filling of the cell can be observed from the control room with a closed circuit television (CCTV). The cell walls have level markings and lighting is provided on the CCTV camera. The CCTV has remote zoom, pan, and tilt features.
The temperature of the Saltstone monolith is monitored by a thermocouple assembly that was installed in the cell prior to filling. A new assembly is provided for each cell.
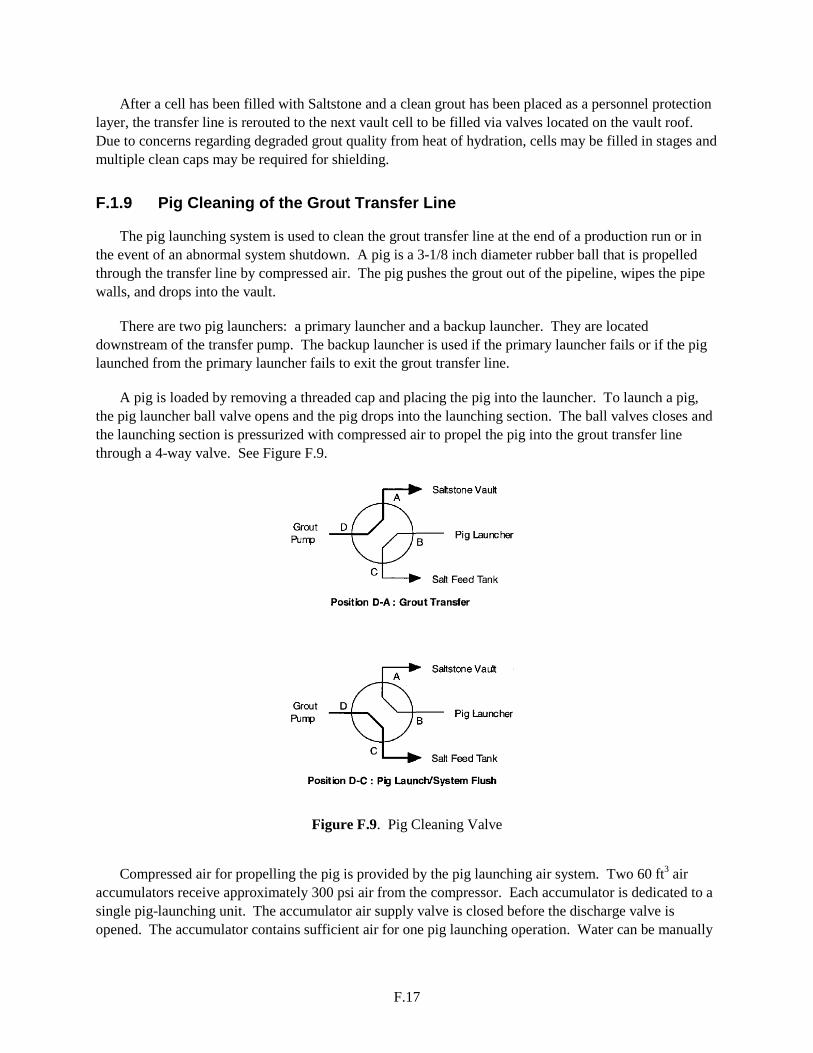
F.17
After a cell has been filled with Saltstone and a clean grout has been placed as a personnel protection layer, the transfer line is rerouted to the next vault cell to be filled via valves located on the vault roof. Due to concerns regarding degraded grout quality from heat of hydration, cells may be filled in stages and multiple clean caps may be required for shielding.
F.1.9 Pig Cleaning of the Grout Transfer Line
The pig launching system is used to clean the grout transfer line at the end of a production run or in the event of an abnormal system shutdown. A pig is a 3-1/8 inch diameter rubber ball that is propelled through the transfer line by compressed air. The pig pushes the grout out of the pipeline, wipes the pipe walls, and drops into the vault.
There are two pig launchers: a primary launcher and a backup launcher. They are located downstream of the transfer pump. The backup launcher is used if the primary launcher fails or if the pig launched from the primary launcher fails to exit the grout transfer line.
A pig is loaded by removing a threaded cap and placing the pig into the launcher. To launch a pig, the pig launcher ball valve opens and the pig drops into the launching section. The ball valves closes and the launching section is pressurized with compressed air to propel the pig into the grout transfer line through a 4-way valve. See Figure F.9.
Figure F.9. Pig Cleaning Valve
Compressed air for propelling the pig is provided by the pig launching air system. Two 60 ft3 air
accumulators receive approximately 300 psi air from the compressor. Each accumulator is dedicated to a single pig-launching unit. The accumulator air supply valve is closed before the discharge valve is opened. The accumulator contains sufficient air for one pig launching operation. Water can be manually

F.18
added to the accumulator with a hose in order to adjust the volume of air provided. A back-up air supply consisting of compressed air bottles is also provided.
F.1.10 Spent Flush Water Collection
The SFT receives salt solution for feed to the Saltstone mixing and transfer equipment. The SFT also receives drainage from the process vent system, the 210-Z Process Building drains, and the 704-Z Operations Building regulated drains, including lab hoods, sinks, and decontamination showers and the discharge of the leachate return system pumps. The SFT is provided with an agitator that runs to keep solids in suspension. An air jet sampler is provided for collecting liquid samples. The SFT is provided with liquid level instrumentation and is also vented to the process vent system.
The SFT is a 6,500-gallon (usable volume) carbon steel tank located below grade in a concrete pit adjacent to the CCBT. A common roof covers both the CCBT and the SFT. The floor of the pit is sloped to direct spillage or leakage into a sump. A sump pump is provided for transferring liquid into the SFT.
F.1.11 Process Vent System
The CCBT and the SFT vent system are vented to the process vent system. Manual valves in each vent line are adjusted as necessary to maintain the proper vacuum in the equipment being vented. This system consists of a mist eliminator, heater, two high-efficiency particulate air (HEPA) filters in parallel, and two 150-cfm blowers in parallel. One HEPA filter and one blower are on-line while the other is on standby.
The mist eliminator receives the vent stream from the CCBT and SFT. Pressure drop across the mist eliminator is monitored and a water flush is provided for washing the mesh pad. The mist eliminator drains to the SFT.
The stream enters the process vent heater. The heater raises the temperature of the stream by about 10°C to prevent condensation in the HEPA filter.
The vent stream then flows through the operating HEPA filter. The pressure drop across the filter is monitored, and high and low alarms are provided.
The vent stream enters the operating vent blowers. Flow is measured upstream of the blowers. A low-flow interlock automatically starts up the standby blower. The blower exit piping is equipped with a silencer and the gas is discharged to the 210-Z Process Building heating, ventilation, and air (HVA) stack. See Figure F.10.
F.1.12 High Pressure Flush System
A flush pump is provided to flush the grout line downstream of the grout pump, if required. The pump is a horizontal centrifugal pump rated at 125 gpm.
The pump draws process water from the process water header and delivers it to the discharge of the grout pump via a 30-way valve which isolates the pump discharge from the flush path. This pump will
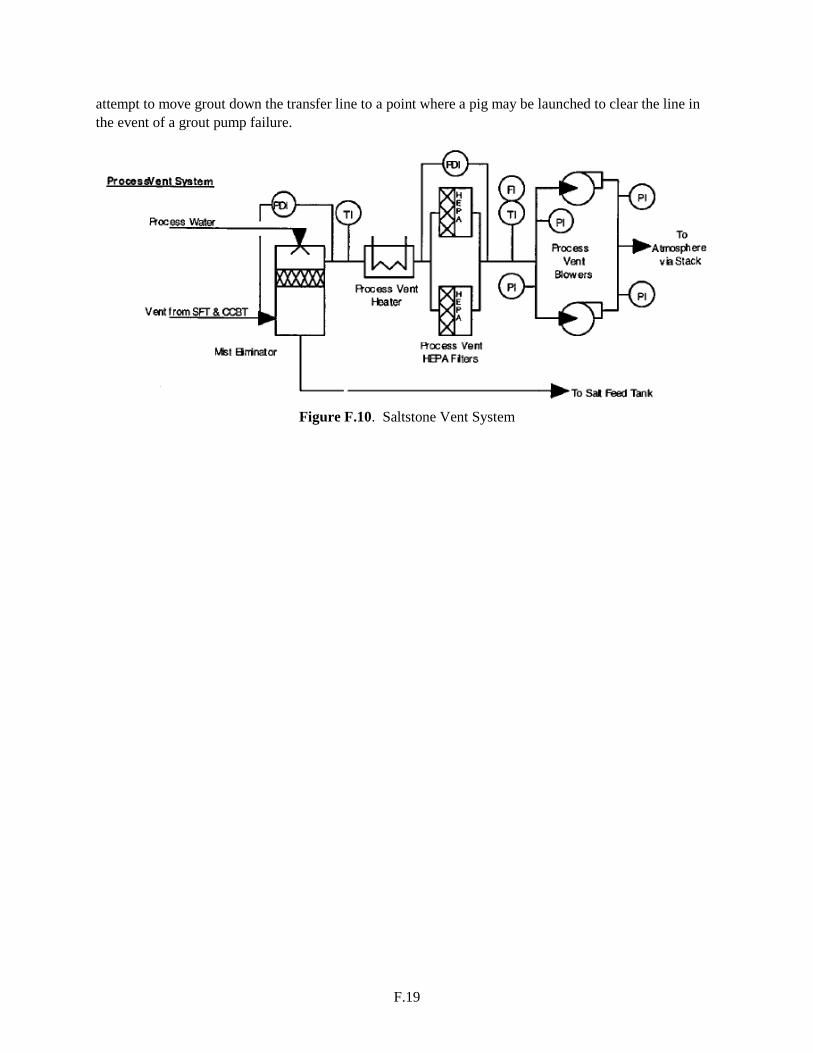
F.19
attempt to move grout down the transfer line to a point where a pig may be launched to clear the line in the event of a grout pump failure.
Figure F.10. Saltstone Vent System

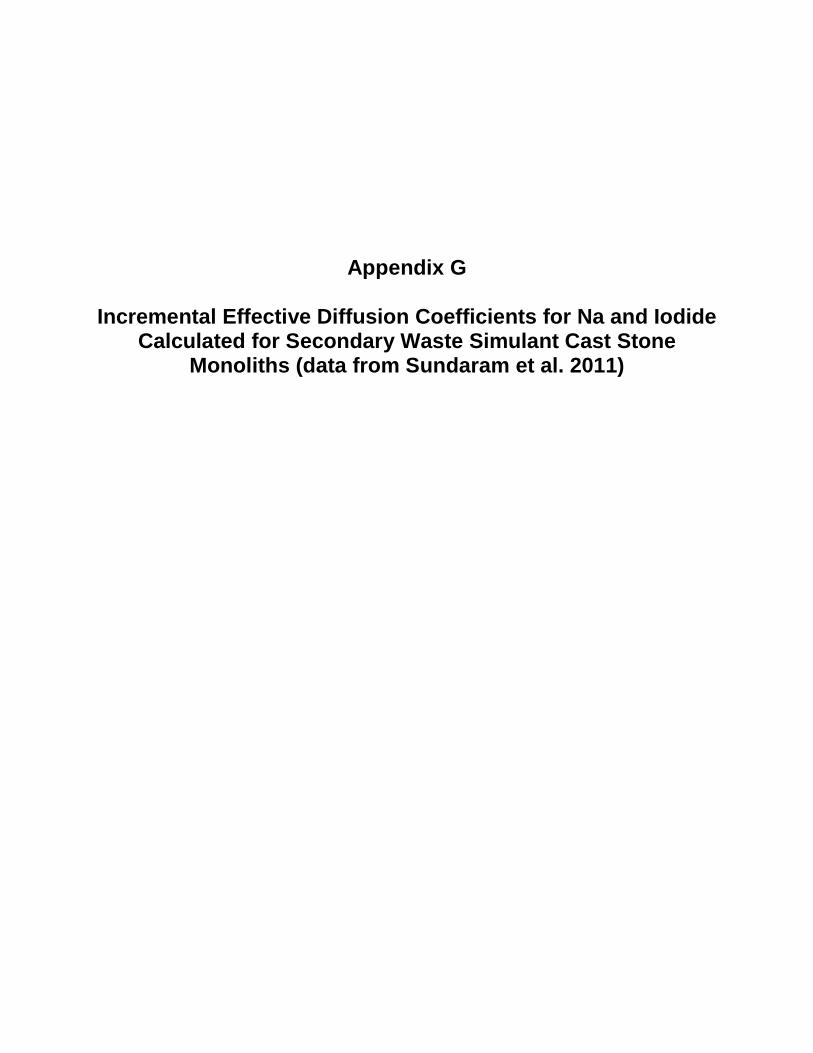
Appendix G
Incremental Effective Diffusion Coefficients for Na and Iodide Calculated for Secondary Waste Simulant Cast Stone
Monoliths (data from Sundaram et al. 2011)


G.1
Appendix G
Incremental Effective Diffusion Coefficients for Na and Iodide Calculated for Secondary Waste Simulant Cast Stone
Monoliths (data from Sundaram et al. 2011)
Figure G.1. Incremental Effective Diffusion Coefficients for Na in Cast Stone Monoliths Made with
Different 2M Na-Based Simulants (see Table 2.7 in main text)
Figure G.2. Leachability Index (LI) for Na in Cast Stone Monoliths Made with Different 2M Na-Based
Simulants (see Table 2.7 in main text)
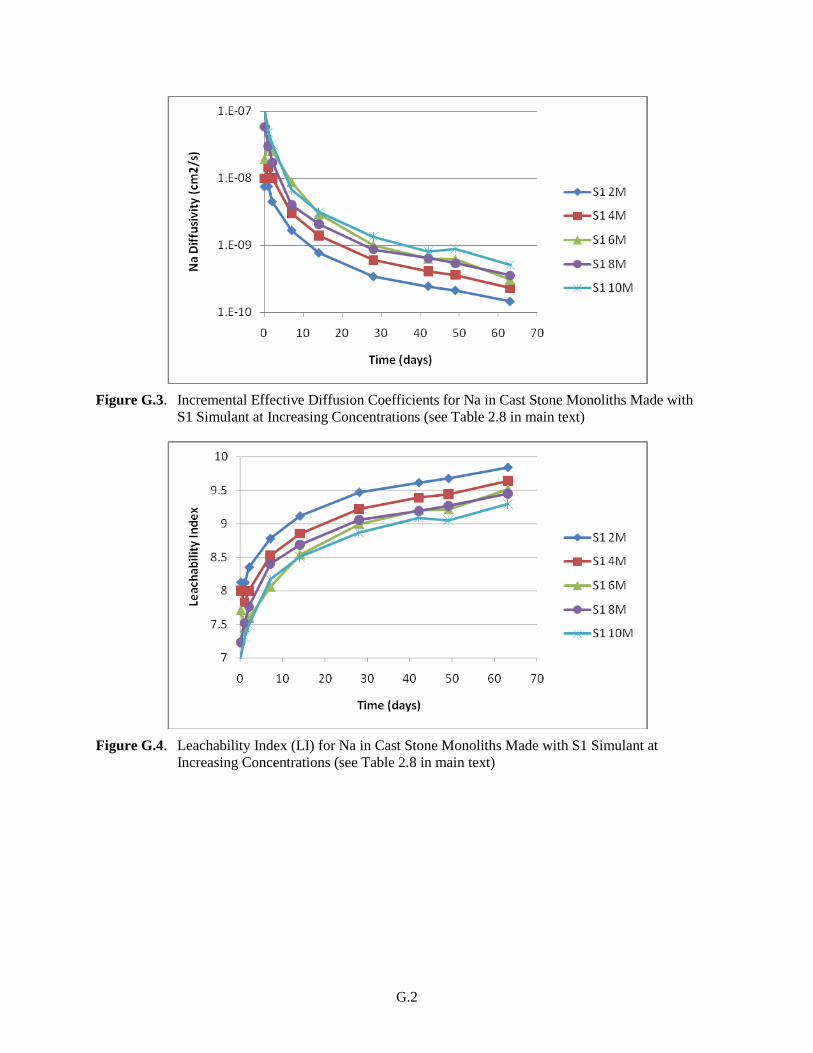
G.2
Figure G.3. Incremental Effective Diffusion Coefficients for Na in Cast Stone Monoliths Made with
S1 Simulant at Increasing Concentrations (see Table 2.8 in main text)
Figure G.4. Leachability Index (LI) for Na in Cast Stone Monoliths Made with S1 Simulant at
Increasing Concentrations (see Table 2.8 in main text)
G.3
1.00E-11
1.00E-10
1.00E-09
1.00E-08
1.00E-07
1.00E-06
0 10 20 30 40 50 60 70
Time (days)
Iodi
de D
iffus
ivity
(cm
2/s)
S1 2M
S2 2M
S3 2M
S4 2M
Figure G.5. Incremental Effective Diffusion Coefficients for Iodide in Cast Stone Monoliths Made with
Different 2M Na-Based Simulants (see Table 2.7 in main text)
6.00
6.50
7.00
7.50
8.00
8.50
9.00
9.50
10.00
10.50
0 10 20 30 40 50 60 70
Time (days)
Leac
habi
lity
Inde
x
S1 2M
S2 2M
S3 2M
S4 2M
Figure G.6. Leachability Index (LI) for Iodide in Cast Stone Monoliths with Different 2M Na-Based
Simulants (see Table 2.7 in main text)

G.4
1.E-08
1.E-07
1.E-06
0 10 20 30 40 50 60 70
Time (days)
Iodi
de D
iffus
ivity
(cm
2/s)
S1 2M
S1 4M
S1 6M
S1 8M
S1 10M
Figure G.7. Incremental Effective Diffusion Coefficients for Iodide in Cast Stone Monoliths Made with
S1 Simulant at Increasing Concentrations (see Table 2.8 in main text)
6.006.206.406.606.807.00
7.207.407.607.808.00
0 10 20 30 40 50 60 70
Time (days)
Leac
habi
lity
Inde
x
S1 2M
S1 4M
S1 6M
S1 8M
S1 10M
Figure G.8. Leachability Index (LI) for Iodide in Cast Stone Monoliths Made with S1 Simulant at
Increasing Concentrations (see Table 2.8 in main text)
Appendix H
TCLP Results for Cast Stone Waste Forms (from Mattigod et al. 2001)

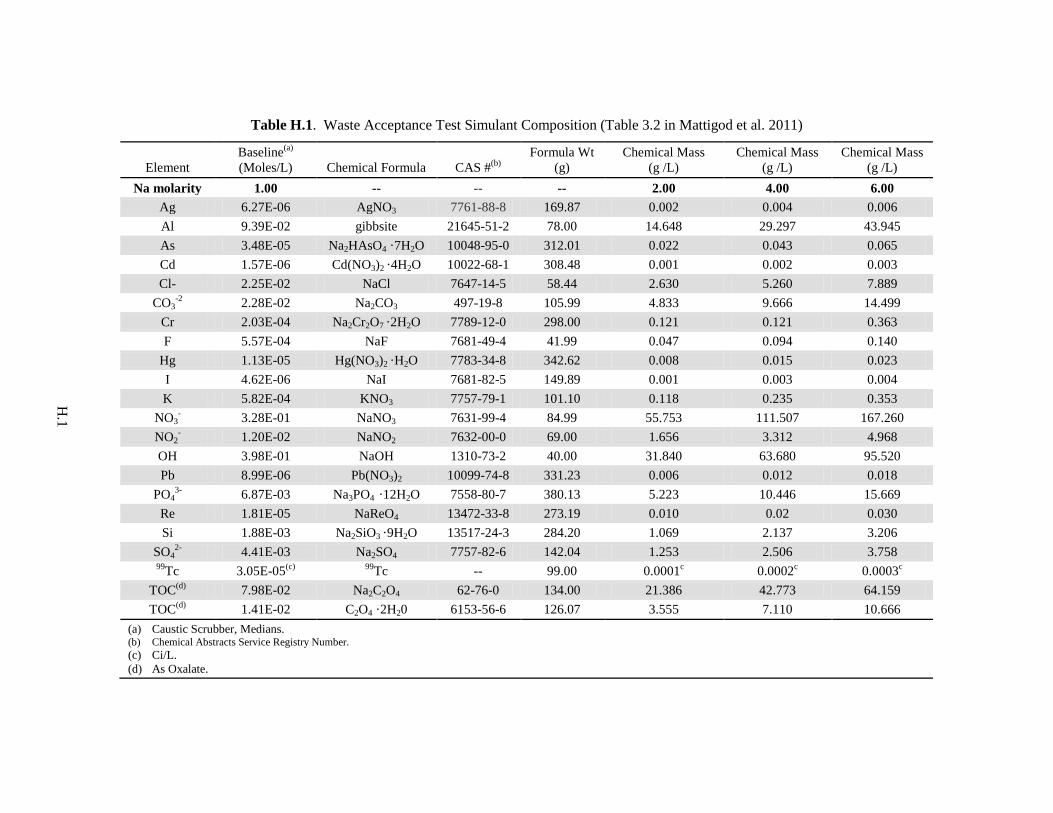
H.1
Table H.1. Waste Acceptance Test Simulant Composition (Table 3.2 in Mattigod et al. 2011)
Element Baseline(a)
(Moles/L) Chemical Formula CAS #(b) Formula Wt
(g) Chemical Mass
(g /L) Chemical Mass
(g /L) Chemical Mass
(g /L) Na molarity 1.00 -- -- -- 2.00 4.00 6.00
Ag 6.27E-06 AgNO3 7761-88-8 169.87 0.002 0.004 0.006 Al 9.39E-02 gibbsite 21645-51-2 78.00 14.648 29.297 43.945 As 3.48E-05 Na2HAsO4 ·7H2O 10048-95-0 312.01 0.022 0.043 0.065 Cd 1.57E-06 Cd(NO3)2 ·4H2O 10022-68-1 308.48 0.001 0.002 0.003 Cl- 2.25E-02 NaCl 7647-14-5 58.44 2.630 5.260 7.889
CO3-2 2.28E-02 Na2CO3 497-19-8 105.99 4.833 9.666 14.499
Cr 2.03E-04 Na2Cr2O7 ·2H2O 7789-12-0 298.00 0.121 0.121 0.363 F 5.57E-04 NaF 7681-49-4 41.99 0.047 0.094 0.140
Hg 1.13E-05 Hg(NO3)2 ·H2O 7783-34-8 342.62 0.008 0.015 0.023 I 4.62E-06 NaI 7681-82-5 149.89 0.001 0.003 0.004 K 5.82E-04 KNO3 7757-79-1 101.10 0.118 0.235 0.353
NO3- 3.28E-01 NaNO3 7631-99-4 84.99 55.753 111.507 167.260
NO2- 1.20E-02 NaNO2 7632-00-0 69.00 1.656 3.312 4.968
OH 3.98E-01 NaOH 1310-73-2 40.00 31.840 63.680 95.520 Pb 8.99E-06 Pb(NO3)2 10099-74-8 331.23 0.006 0.012 0.018
PO43- 6.87E-03 Na3PO4 ·12H2O 7558-80-7 380.13 5.223 10.446 15.669
Re 1.81E-05 NaReO4 13472-33-8 273.19 0.010 0.02 0.030 Si 1.88E-03 Na2SiO3 ·9H2O 13517-24-3 284.20 1.069 2.137 3.206
SO42- 4.41E-03 Na2SO4 7757-82-6 142.04 1.253 2.506 3.758
99Tc 3.05E-05(c) 99Tc -- 99.00 0.0001c 0.0002c 0.0003c TOC(d) 7.98E-02 Na2C2O4 62-76-0 134.00 21.386 42.773 64.159 TOC(d) 1.41E-02 C2O4 ·2H20 6153-56-6 126.07 3.555 7.110 10.666
(a) Caustic Scrubber, Medians. (b) Chemical Abstracts Service Registry Number. (c) Ci/L. (d) As Oxalate.

H.2
Table H.2. TCLP Test Results for Cast Stone Waste Forms made with S1 Simulant (taken from Table 5.17 in Mattigod et al. 2011)
Regulated Constituent
Cast Stone 2M Cast Stone 4M Cast Stone 6M
UTS(b) CS-11-S1-4-402-1(a)
CS-11-S1-4-402-2
CS-11-S1-2-603-1
CS-11-S1-2-603-2
CS-11-S1-6-502-1
CS-11-S1-6-502-2
Concentration (µg/L) RCRA Metals
Arsenic <40.00 <40.00 <40.00 <40.00 <40.00 <40.00 5,000 Barium 187 170 243 251 144 154 21,000
Cadmium <0.93 <0.93 <0.93 <0.93 <0.93 <0.93 110 Chromium <1.37 3.38 5.54 6.10 2.43 3.46 600
Lead <6.65 <6.65 <6.65 8.11 <6.65 <6.65 750 Mercury 0.0030 0.0033 0.0084 0.0107 0.0050 0.0078 25 Selenium <100 <100 115.2 <100 <100 <100 5,700
Silver <1.35 <1.35 <1.35 <1.35 <1.35 <1.35 140 Other Hazardous Metals
Antimony <50.0 <50.0 <50.0 <50.0 <50.0 <50.0 1,150 Beryllium 0.380 0.683 0.554 <0.31 0.782 0.931 1,220
Nickel <1.90 6.68 10.4 10.9 4.52 3.90 11,000 Thallium <25.0 <25.0 <25.0 <25.0 <25.0 <25.0 200
(a) Waste Form sample ID numbers are explained in Mattigod et al. (2011). (b) Universal Treatment Standards from 40 CFR Part 26.

PNNL-20706
Distribution
No. of No. of Copies Copies
Distr.1
4 Washington River Protection Solutions
P.O. Box 850 MSIN: H6-04 Richland, WA 99352 MA Melvin DJ Swanberg KE Smith LE Thompson
10 Local Distribution
Pacific Northwest National Laboratory PR Bredt K9-09 CF Brown K6-81 CJ Cantrell K6-81 C Chung K6-24 SV Mattigod K3-62 LM Peurrung K9-09 N Qafoku P7-54 RJ Serne K6-81 MM Valenta P7-54 JH Westsik, Jr K7-15