Embed Size (px)
Citation preview
Data organization in spreadsheets
Karl W. Broman ∗
Department of Biostatistics & Medical Informatics, University of Wisconsin-Madisonand
Kara H. WooInformation School, University of Washington
August 23, 2017
Abstract
Spreadsheets are widely used software tools for data entry, storage, analysis, andvisualization. Focusing on the data entry and storage aspects, this paper offers prac-tical recommendations for organizing spreadsheet data to reduce errors and ease lateranalyses. The basic principles are: be consistent, write dates like YYYY-MM-DD,don’t leave any cells empty, put just one thing in a cell, organize the data as a singlerectangle (with subjects as rows and variables as columns, and with a single headerrow), create a data dictionary, don’t include calculations in the raw data files, don’tuse font color or highlighting as data, choose good names for things, make backups,use data validation to avoid data entry errors, and save the data in plain text file.
Keywords: data management, data organization, spreadsheets, Microsoft Excel
∗The authors thank Lance Waller, Lincoln Mullen, and Jenny Bryan for their comments to improve themanuscript. Corresponding author: Karl W. Broman, University of Wisconsin–Madison, 2126 Genetics-Biotechnology Center, 425 Henry Mall, Madison, WI 53706, USA, [email protected]
1
PeerJ Preprints | https://doi.org/10.7287/peerj.preprints.3183v1 | CC BY 4.0 Open Access | rec: 24 Aug 2017, publ: 24 Aug 2017
1 Introduction
Spreadsheets, for all of their mundane rectangularness, have been the subject of angst and
controversy for decades. Some writers have admonished that “real programmers don’t use
spreadsheets” and that we must “stop that subversive spreadsheet” (Casimir 1992; Chad-
wick 2003). Others have advised researchers on how to use spreadsheets to improve their
productivity (Wagner and Keisler 2006). Amid this debate, spreadsheets have continued
to play a significant role in researchers’ workflows, and it is clear that they are a valuable
tool that researchers are unlikely to abandon completely.
The dangers of spreadsheets are real, however – so much so that the European Spread-
sheet Risks Interest Group keeps a public archive of spreadsheet “horror stories” (http:
//www.eusprig.org/horror-stories.htm). Many researchers have examined error rates
in spreadsheets, and Panko (2008) reported that in 13 audits of real-world spreadsheets, an
average of 88% contained errors. Popular spreadsheet programs also make certain types of
errors easy to commit and difficult to rectify. Microsoft Excel converts some gene names to
dates and stores dates differently between operating systems, which can cause problems in
downstream analyses (Zeeberg et al. 2004; Woo 2014). Researchers who use spreadsheets
should be aware of these common errors and design spreadsheets that are tidy, consistent,
and as resistant to mistakes as possible.
Spreadsheets are often used as a multipurpose tool for data entry, storage, analysis, and
visualization. Most spreadsheet programs allow users to perform all of these tasks, however
we believe that spreadsheets are best suited to data entry and storage, and that analysis
and visualization should happen separately. Analyzing and visualizing data in a separate
program, or at least in a separate copy of the data file, reduces the risk of contaminating
or destroying the raw data in the spreadsheet.
Murrell (2013) contrasts data that are formatted for humans to view by eye with data
that are formatted for a computer. He provides an extended example of computer code
to extract data from a set of files with complex arrangements. It is important that data
analysts be able to work with such complex data files. But if the initial arrangement of the
data files is planned with the computer in mind, the later analysis process is simplified.
In this paper we offer practical recommendations for organizing spreadsheet data in a
2
PeerJ Preprints | https://doi.org/10.7287/peerj.preprints.3183v1 | CC BY 4.0 Open Access | rec: 24 Aug 2017, publ: 24 Aug 2017
way that both humans and computer programs can read. By following this advice, re-
searchers will create spreadsheets that are less error-prone, easier for computers to process,
and easier to share with collaborators and the public. Spreadsheets that adhere to our
recommendations will work well with the tidy tools and reproducible methods described
elsewhere in this collection and will form the basis of a robust and reproducible analytic
workflow.
For an existing dataset whose arrangement could be improved, we recommend against
applying tedious and potentially error-prone hand-editing to revise the arrangement. Rather,
we hope that the reader might apply these principles when designing the layout for future
datasets.
2 Be consistent
The first rule of data organization is be consistent. Whatever you do, do it consistently.
Entering and organizing your data in a consistent way from the start will prevent you and
your collaborators from having to spend time harmonizing the data later.
Use consistent codes for categorical variables. For a categorical variable like the sex of a
mouse in a genetics study, use a single common value for males (e.g. “male”) and a single
common value for females (e.g. “female”). Don’t sometimes write “M”, sometimes “male”,
and sometimes “Male”. Pick one and stick to it.
Use a consistent fixed code for any missing values. We prefer to have every cell filled
in, so that one can distinguish between truly missing values and unintentionally missing
values. R users prefer “NA”. You could also use a hyphen. But stick with a single value
throughout. Definitely don’t use a numeric value like -999 or 999; it is easy to miss that
it is intended to be missing. Also, don’t insert a note in place of the data, explaining why
it is missing. Rather, make a separate column with such notes.
Use consistent variable names. If in one file (for example, the first batch of subjects), you
have a variable called “Glucose 10wk”, then call it exactly that in other files (for example,
for other batches of subjects). If it is variably called “Glucose 10wk”, “gluc 10weeks”,
and “10 week glucose”, then downstream the data analyst will have to work out that
these are all really the same thing.
3
PeerJ Preprints | https://doi.org/10.7287/peerj.preprints.3183v1 | CC BY 4.0 Open Access | rec: 24 Aug 2017, publ: 24 Aug 2017
Use consistent subject identifiers. If sometimes it is “153” and sometimes “mouse153”
and sometimes “mouse-153F” and sometimes “Mouse153”, there is going to be extra work
to figure out who is who.
Use a consistent data layout in multiple files. If your data are in multiple files and you
use different layouts in different files, it will be extra work for the analyst to combine the
files into one dataset for analysis. With a consistent structure, it will be easy to automate
this process.
Use consistent file names. Have some system for naming files. If one file is called
“Serum batch1 2015-01-30.csv”, then don’t call the file for the next batch “batch2 serum 52915.csv”
but rather use “Serum batch2 2015-05-29.csv”. Keeping a consistent file naming scheme
will help ensure that your files remain well organized, and it will make it easier to batch
process the files if you need to.
Use a consistent format for all dates, preferably with the standard format YYYY-MM-DD,
for example 2015-08-01. If sometimes you write 8/1/2015 and sometimes 8-1-15, it will
be more difficult to use the dates in analyses or data visualizations.
Use consistent phrases in your notes. If you have a separate column of notes (for
example, “dead” or “lo off curve”), be consistent in what you write. Don’t sometimes
write “dead” and sometimes “Dead”, or sometimes “lo off curve” and sometimes “off
curve lo”.
Be careful about extra spaces within cells. A blank cell is different than a cell that
contains a single space. And “male” is different from “ male ” (that is, with spaces at the
beginning and end).
3 Choose good names for things
It is important to pick good names for things. This can be hard, and so it is worth putting
some time and thought into it.
As a general rule, don’t use spaces, either in variable names or file names. They make
programming harder: the analyst will need to surround everything in double quotes, like
"glucose 6 weeks", rather than just writing glucose 6 weeks. Where you might use
spaces, use underscores or perhaps hyphens. But don’t use a mixture of underscores and
4
PeerJ Preprints | https://doi.org/10.7287/peerj.preprints.3183v1 | CC BY 4.0 Open Access | rec: 24 Aug 2017, publ: 24 Aug 2017
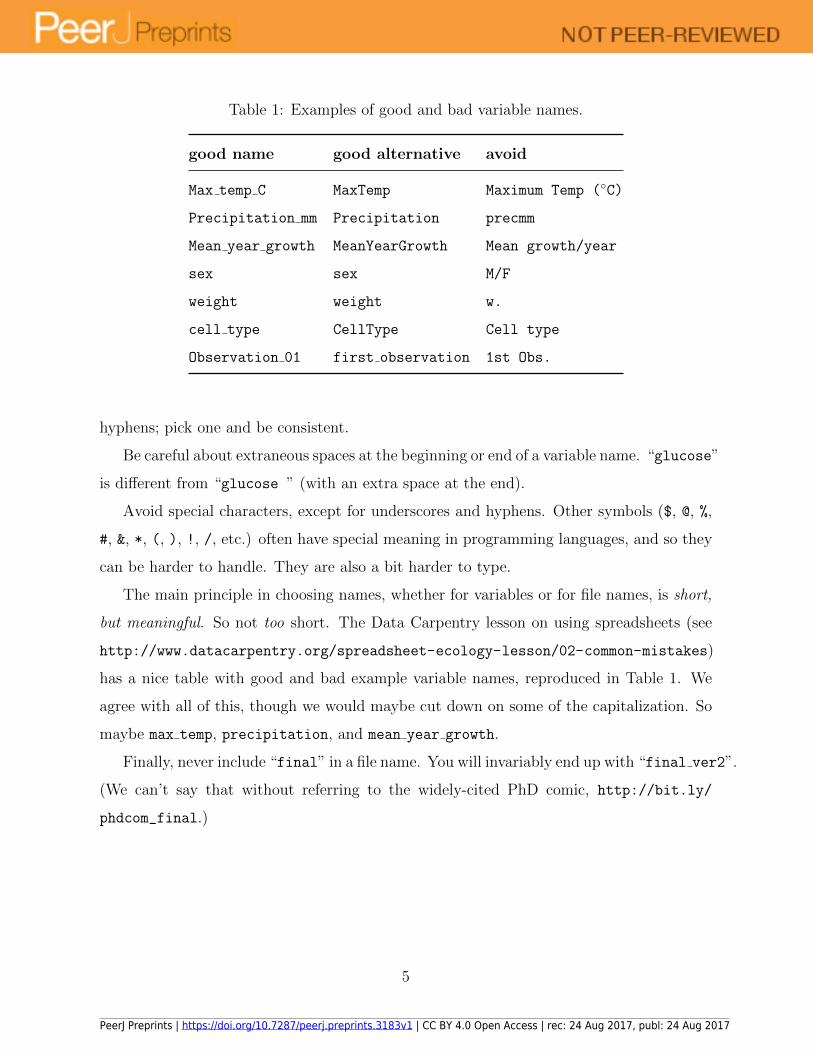
Table 1: Examples of good and bad variable names.
good name good alternative avoid
Max temp C MaxTemp Maximum Temp (◦C)
Precipitation mm Precipitation precmm
Mean year growth MeanYearGrowth Mean growth/year
sex sex M/F
weight weight w.
cell type CellType Cell type
Observation 01 first observation 1st Obs.
hyphens; pick one and be consistent.
Be careful about extraneous spaces at the beginning or end of a variable name. “glucose”
is different from “glucose ” (with an extra space at the end).
Avoid special characters, except for underscores and hyphens. Other symbols ($, @, %,
#, &, *, (, ), !, /, etc.) often have special meaning in programming languages, and so they
can be harder to handle. They are also a bit harder to type.
The main principle in choosing names, whether for variables or for file names, is short,
but meaningful. So not too short. The Data Carpentry lesson on using spreadsheets (see
http://www.datacarpentry.org/spreadsheet-ecology-lesson/02-common-mistakes)
has a nice table with good and bad example variable names, reproduced in Table 1. We
agree with all of this, though we would maybe cut down on some of the capitalization. So
maybe max temp, precipitation, and mean year growth.
Finally, never include “final” in a file name. You will invariably end up with “final ver2”.
(We can’t say that without referring to the widely-cited PhD comic, http://bit.ly/
phdcom_final.)
5
PeerJ Preprints | https://doi.org/10.7287/peerj.preprints.3183v1 | CC BY 4.0 Open Access | rec: 24 Aug 2017, publ: 24 Aug 2017
4 Write dates as YYYY-MM-DD
When entering dates, we strongly recommend using the global “ISO 8601” standard,
YYYY-MM-DD, such as 2013-02-27. (See the related xkcd comic, https://xkcd.com/1179.)
Microsoft Excel’s treatment of dates can cause problems in data (see https://storify.
com/kara_woo/excel-date-system-fiasco). It stores them internally as a number, with
different conventions on Windows and Macs. So, you may need to manually check the
integrity of your data when they come out of Excel.
Excel also has a tendency to turn other things into dates. For example, some gene
symbols (for example “Oct-4”) may be interpreted as dates and reformatted. Ziemann et
al. (2016) studied gene lists contained within the supplementary files from 18 journals for
the years 2005-2015, and found that ˜20% of the lists had errors in the gene names, related
to the conversion of gene symbols to dates or floating-point numbers.
We often prefer to use a plain text format for columns in an Excel worksheet that are
going to contain dates, so that it doesn’t do anything to them. To do this:
• Select the column
• In the menu bar, select Format → Cells
• Choose “Text” on the left
However, if you do this on columns that already contain dates, Excel will convert them
to a text value of their underlying numeric representation.
Another way to force Excel to treat dates as text is to begin the date with an apostrophe,
like this: '2014-06-14 (see http://bit.ly/twitter_apos). Excel will treat the cells as
text, but the apostrophe will not appear when you view the spreadsheet or export it to
other formats. This is a handy trick, but it requires impeccable diligence and consistency.
Alternatively, you could create three separate columns with year, month, and day. Those
will be ordinary numbers, and so Excel won’t mess them up. Finally, you could represent
dates as an 8-digit integer of the form YYYYMMDD, for example 20140614 for 2014-06-14
(see Briney 2017).
Figure 1 displays a portion of a spreadsheet that we got from a collaborator. We don’t
quite remember what those e’s were for, but in any case having different date formats within
6
PeerJ Preprints | https://doi.org/10.7287/peerj.preprints.3183v1 | CC BY 4.0 Open Access | rec: 24 Aug 2017, publ: 24 Aug 2017
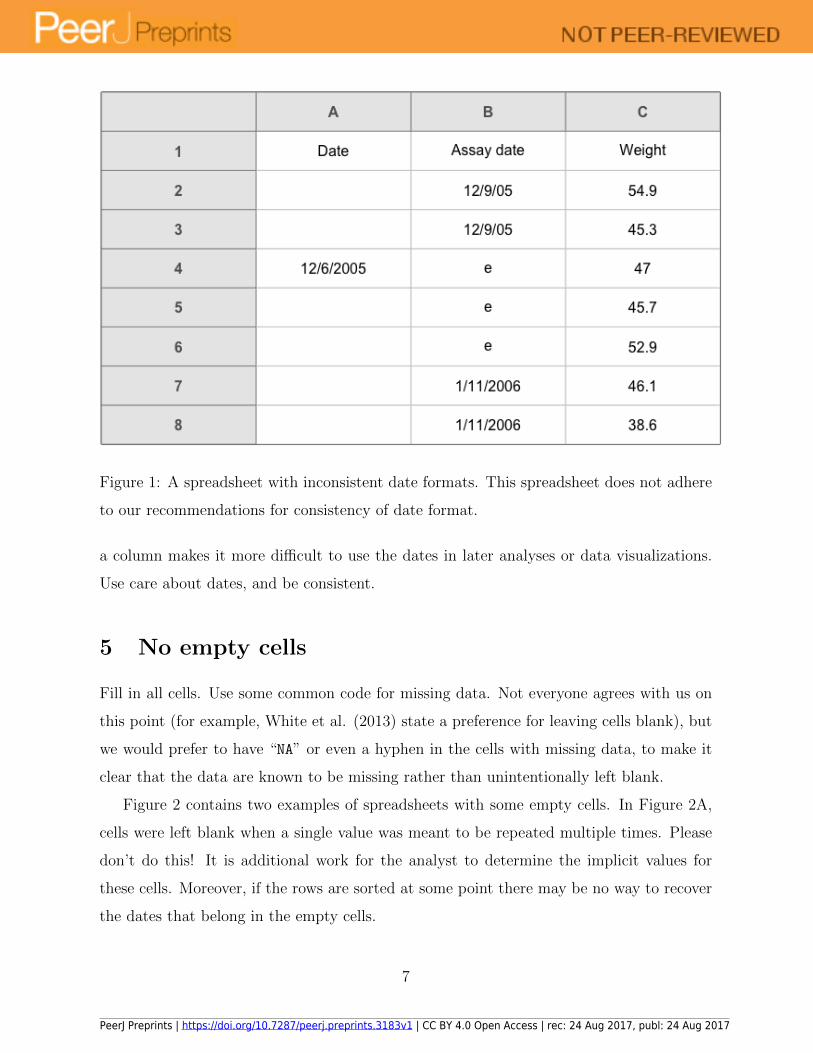
Figure 1: A spreadsheet with inconsistent date formats. This spreadsheet does not adhere
to our recommendations for consistency of date format.
a column makes it more difficult to use the dates in later analyses or data visualizations.
Use care about dates, and be consistent.
5 No empty cells
Fill in all cells. Use some common code for missing data. Not everyone agrees with us on
this point (for example, White et al. (2013) state a preference for leaving cells blank), but
we would prefer to have “NA” or even a hyphen in the cells with missing data, to make it
clear that the data are known to be missing rather than unintentionally left blank.
Figure 2 contains two examples of spreadsheets with some empty cells. In Figure 2A,
cells were left blank when a single value was meant to be repeated multiple times. Please
don’t do this! It is additional work for the analyst to determine the implicit values for
these cells. Moreover, if the rows are sorted at some point there may be no way to recover
the dates that belong in the empty cells.
7
PeerJ Preprints | https://doi.org/10.7287/peerj.preprints.3183v1 | CC BY 4.0 Open Access | rec: 24 Aug 2017, publ: 24 Aug 2017
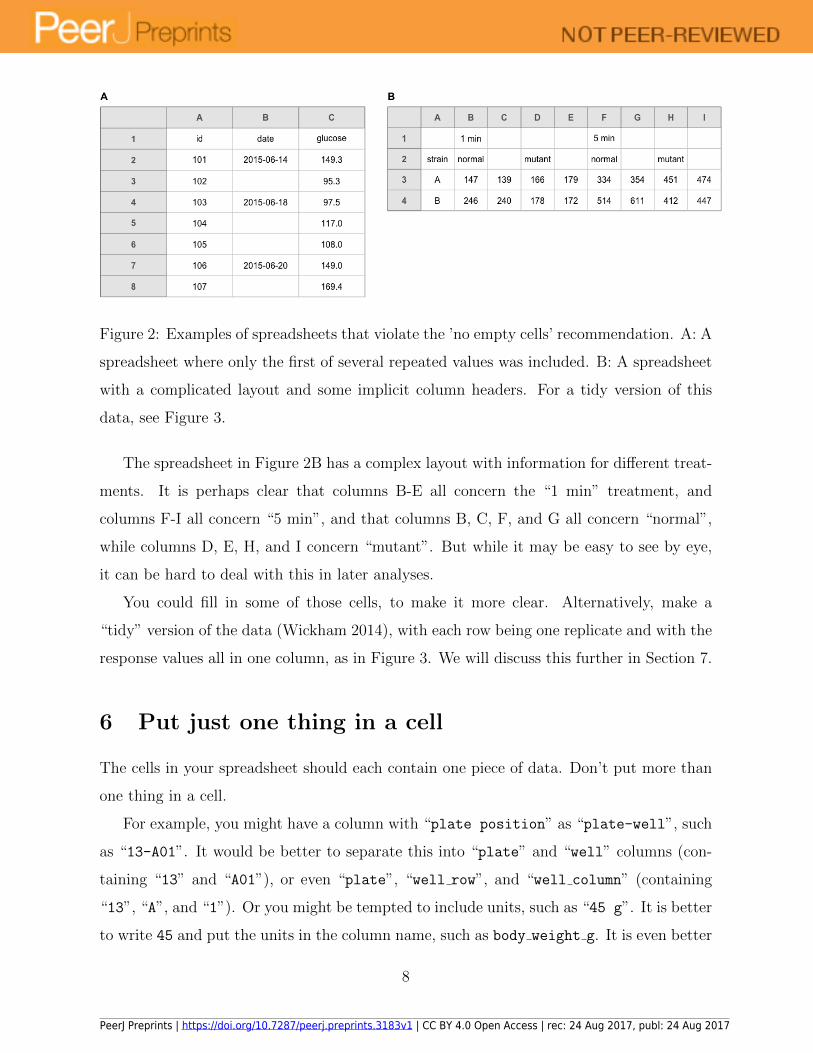
Figure 2: Examples of spreadsheets that violate the ’no empty cells’ recommendation. A: A
spreadsheet where only the first of several repeated values was included. B: A spreadsheet
with a complicated layout and some implicit column headers. For a tidy version of this
data, see Figure 3.
The spreadsheet in Figure 2B has a complex layout with information for different treat-
ments. It is perhaps clear that columns B-E all concern the “1 min” treatment, and
columns F-I all concern “5 min”, and that columns B, C, F, and G all concern “normal”,
while columns D, E, H, and I concern “mutant”. But while it may be easy to see by eye,
it can be hard to deal with this in later analyses.
You could fill in some of those cells, to make it more clear. Alternatively, make a
“tidy” version of the data (Wickham 2014), with each row being one replicate and with the
response values all in one column, as in Figure 3. We will discuss this further in Section 7.
6 Put just one thing in a cell
The cells in your spreadsheet should each contain one piece of data. Don’t put more than
one thing in a cell.
For example, you might have a column with “plate position” as “plate-well”, such
as “13-A01”. It would be better to separate this into “plate” and “well” columns (con-
taining “13” and “A01”), or even “plate”, “well row”, and “well column” (containing
“13”, “A”, and “1”). Or you might be tempted to include units, such as “45 g”. It is better
to write 45 and put the units in the column name, such as body weight g. It is even better
8
PeerJ Preprints | https://doi.org/10.7287/peerj.preprints.3183v1 | CC BY 4.0 Open Access | rec: 24 Aug 2017, publ: 24 Aug 2017

Figure 3: A tidy version of the data in Figure 2B.
9
PeerJ Preprints | https://doi.org/10.7287/peerj.preprints.3183v1 | CC BY 4.0 Open Access | rec: 24 Aug 2017, publ: 24 Aug 2017
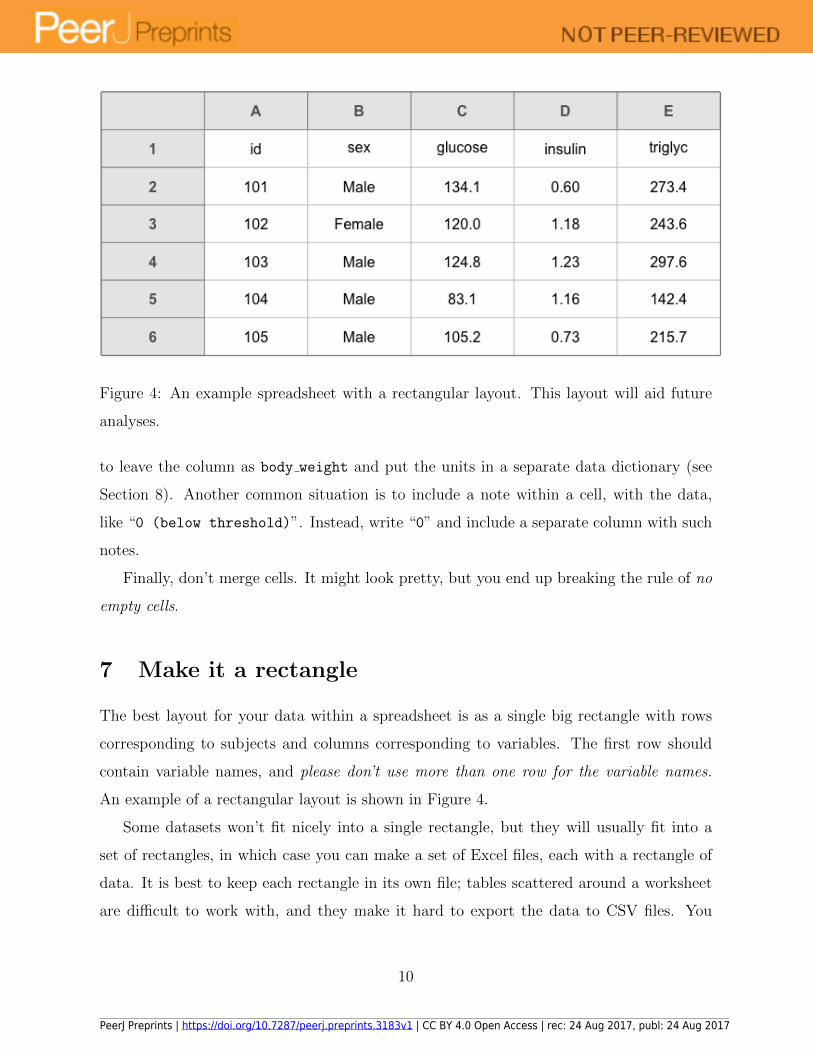
Figure 4: An example spreadsheet with a rectangular layout. This layout will aid future
analyses.
to leave the column as body weight and put the units in a separate data dictionary (see
Section 8). Another common situation is to include a note within a cell, with the data,
like “0 (below threshold)”. Instead, write “0” and include a separate column with such
notes.
Finally, don’t merge cells. It might look pretty, but you end up breaking the rule of no
empty cells.
7 Make it a rectangle
The best layout for your data within a spreadsheet is as a single big rectangle with rows
corresponding to subjects and columns corresponding to variables. The first row should
contain variable names, and please don’t use more than one row for the variable names.
An example of a rectangular layout is shown in Figure 4.
Some datasets won’t fit nicely into a single rectangle, but they will usually fit into a
set of rectangles, in which case you can make a set of Excel files, each with a rectangle of
data. It is best to keep each rectangle in its own file; tables scattered around a worksheet
are difficult to work with, and they make it hard to export the data to CSV files. You
10
PeerJ Preprints | https://doi.org/10.7287/peerj.preprints.3183v1 | CC BY 4.0 Open Access | rec: 24 Aug 2017, publ: 24 Aug 2017
might also consider having a single Excel file with multiple worksheets. We prefer to have
multiple files with one sheet each so we can more easily save the data as CSV files, but if
you do use multiple worksheets in a file be sure to use a consistent structure.
Some data don’t even fit into a set of rectangles, but then maybe spreadsheets are not
the best format for them, as spreadsheets are inherently rectangular.
The data files that we receive are usually not in rectangular form. More often, there
seem to be bits of data sprinkled about. Several examples are shown in Figure 5. In the
spreadsheets in Figure 5A and 5B, the data analyst will need to study the layout, work
out what everything means, and then spend some time rearranging things. If, from the
start, the data were organized as a rectangle, it would save the analyst a great deal of time.
The example in Figure 5C was based on a dataset that had a separate worksheet for each
subject, each in that complicated format. If all of the worksheets have exactly the same
layout, then it is not too hard to pull out the relevant information and combine it into a
rectangle. (One might write a script in R, Python, or Ruby.) But it is preferable to not
have means and SDs and fold change calculations cluttering up the raw data values, and it
seems that even for data entry, it would be easier to have all of the measurements on one
worksheet. Sometimes it is hard to see how to reorganize things as a rectangle, as in the
example in Figure 5D. It is sort of a rectangle; we could fill in the empty cells in the first
two columns by repeating the individual, date, and weight values. But it seems wrong to
repeat the weights, since they are not repeated measurements.
It is perhaps better to make two separate tables, one with the weights, and one with
these other measurements (which are for an in vivo assay, the glucose tolerance test: give
a mouse some glucose and measure serum glucose and insulin levels at different times
afterwards). An example of this is shown in Figure 6. Note that we’ve also changed the
handling of the “lo off curve” and “off curve lo” notes that were within the insulin
column, by inserting “NA” and adding a “note” column (and being consistent in the text
used in the note). We also added a column name for the first column with subject identifiers.
The layouts in Figure 6A and 6B are examples of “tidy” data (Wickham 2014): each
row is an experimental unit, which is usually just a subject but in the case of Figure 6B is
a single assay measurement on a subject. Reorganizing the data into a “tidy” format can
11
PeerJ Preprints | https://doi.org/10.7287/peerj.preprints.3183v1 | CC BY 4.0 Open Access | rec: 24 Aug 2017, publ: 24 Aug 2017
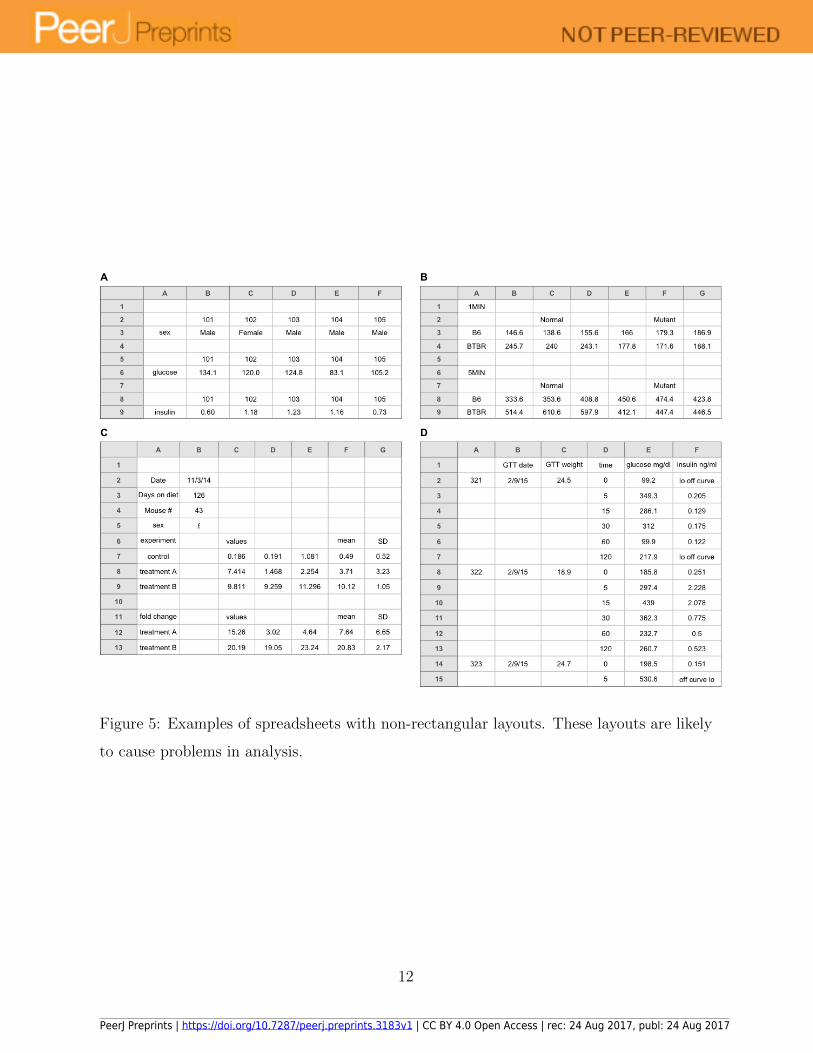
Figure 5: Examples of spreadsheets with non-rectangular layouts. These layouts are likely
to cause problems in analysis.
12
PeerJ Preprints | https://doi.org/10.7287/peerj.preprints.3183v1 | CC BY 4.0 Open Access | rec: 24 Aug 2017, publ: 24 Aug 2017
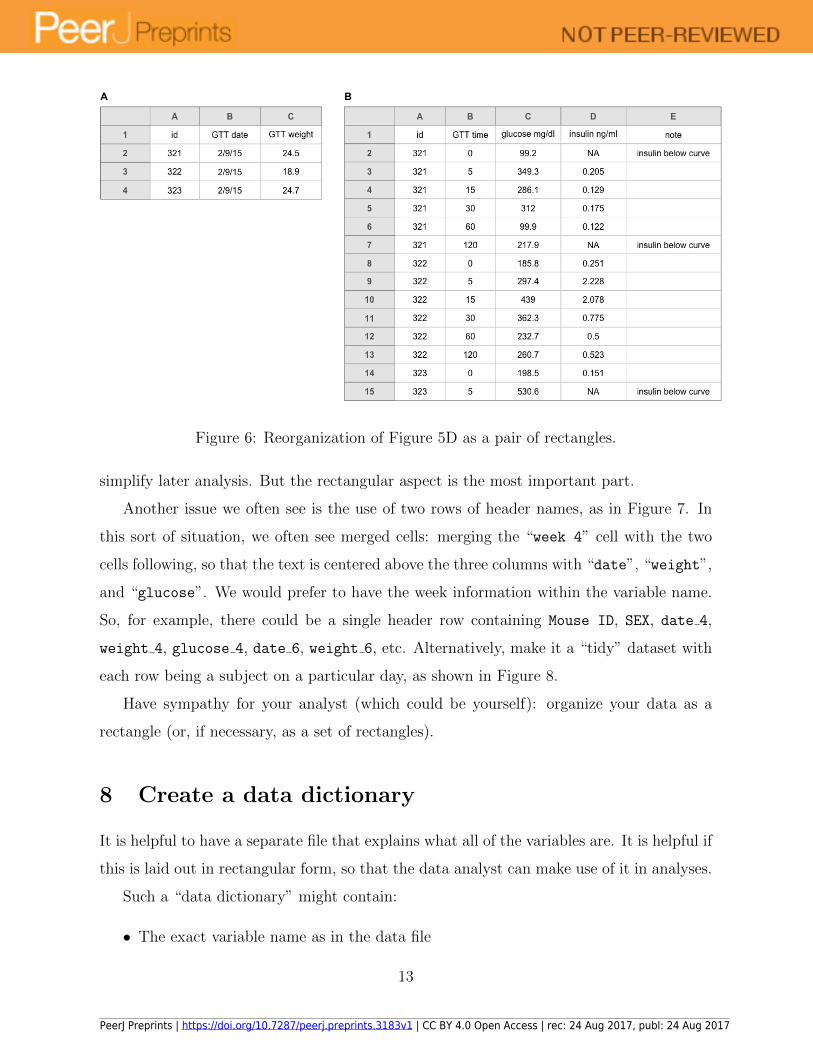
Figure 6: Reorganization of Figure 5D as a pair of rectangles.
simplify later analysis. But the rectangular aspect is the most important part.
Another issue we often see is the use of two rows of header names, as in Figure 7. In
this sort of situation, we often see merged cells: merging the “week 4” cell with the two
cells following, so that the text is centered above the three columns with “date”, “weight”,
and “glucose”. We would prefer to have the week information within the variable name.
So, for example, there could be a single header row containing Mouse ID, SEX, date 4,
weight 4, glucose 4, date 6, weight 6, etc. Alternatively, make it a “tidy” dataset with
each row being a subject on a particular day, as shown in Figure 8.
Have sympathy for your analyst (which could be yourself): organize your data as a
rectangle (or, if necessary, as a set of rectangles).
8 Create a data dictionary
It is helpful to have a separate file that explains what all of the variables are. It is helpful if
this is laid out in rectangular form, so that the data analyst can make use of it in analyses.
Such a “data dictionary” might contain:
• The exact variable name as in the data file
13
PeerJ Preprints | https://doi.org/10.7287/peerj.preprints.3183v1 | CC BY 4.0 Open Access | rec: 24 Aug 2017, publ: 24 Aug 2017
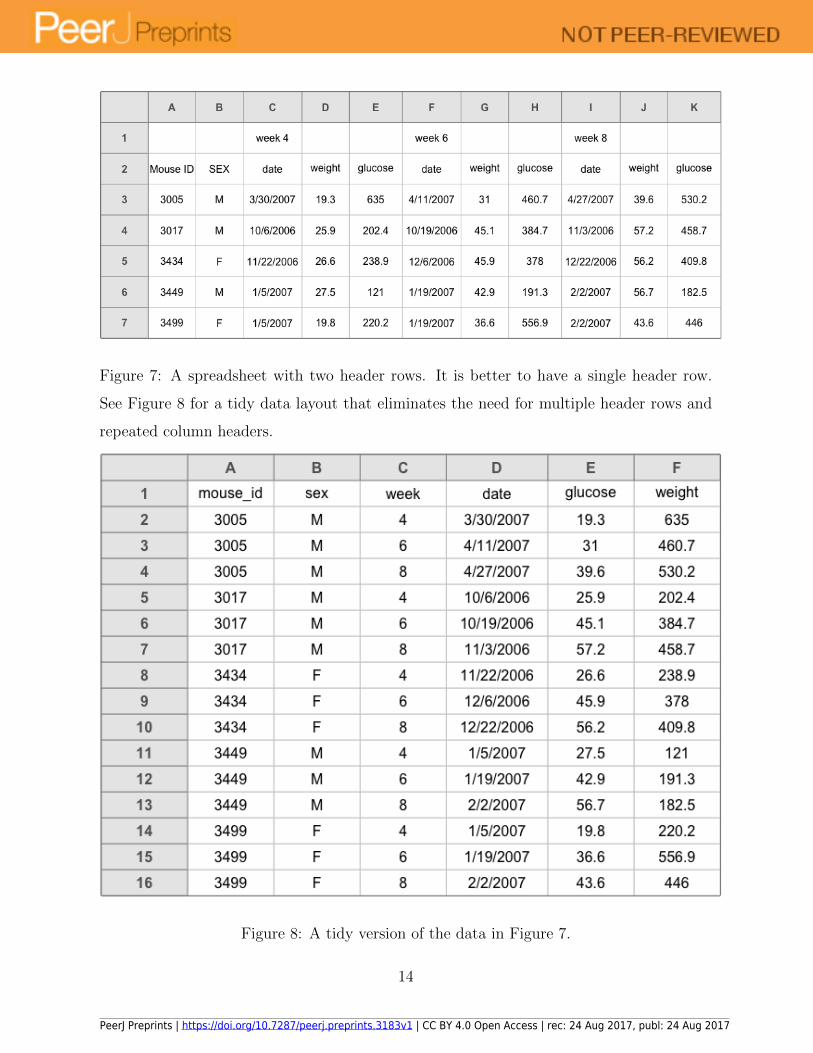
Figure 7: A spreadsheet with two header rows. It is better to have a single header row.
See Figure 8 for a tidy data layout that eliminates the need for multiple header rows and
repeated column headers.
Figure 8: A tidy version of the data in Figure 7.
14
PeerJ Preprints | https://doi.org/10.7287/peerj.preprints.3183v1 | CC BY 4.0 Open Access | rec: 24 Aug 2017, publ: 24 Aug 2017
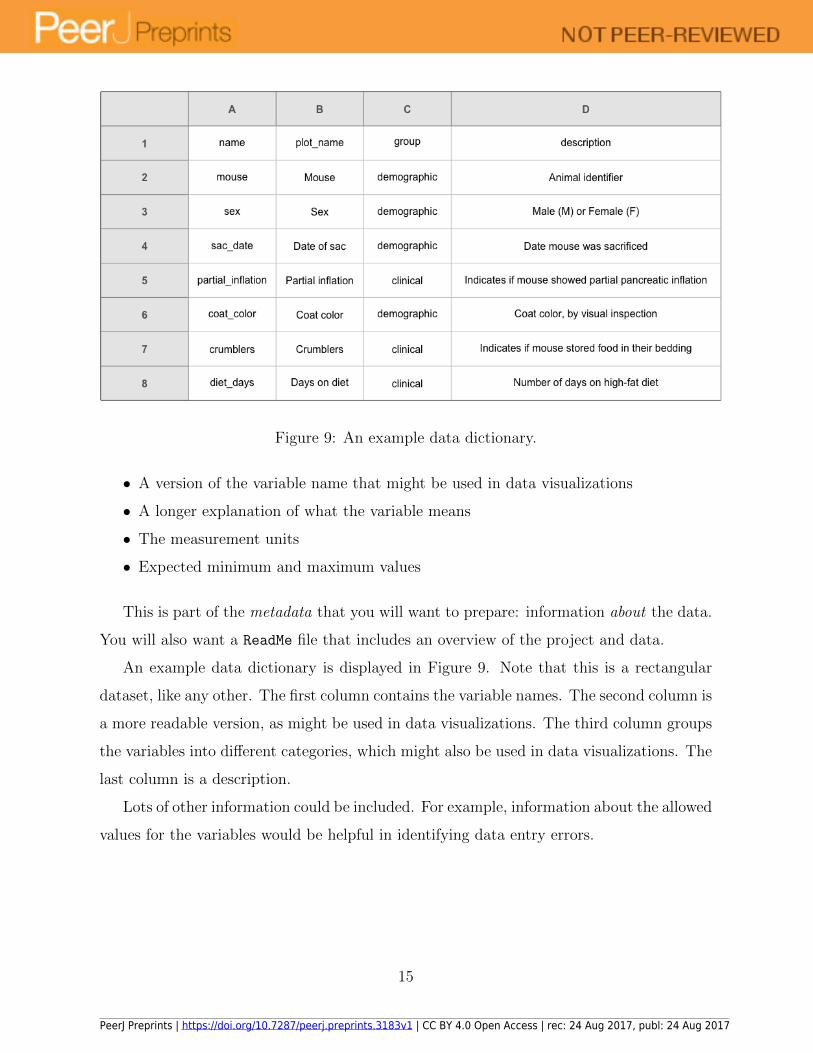
Figure 9: An example data dictionary.
• A version of the variable name that might be used in data visualizations
• A longer explanation of what the variable means
• The measurement units
• Expected minimum and maximum values
This is part of the metadata that you will want to prepare: information about the data.
You will also want a ReadMe file that includes an overview of the project and data.
An example data dictionary is displayed in Figure 9. Note that this is a rectangular
dataset, like any other. The first column contains the variable names. The second column is
a more readable version, as might be used in data visualizations. The third column groups
the variables into different categories, which might also be used in data visualizations. The
last column is a description.
Lots of other information could be included. For example, information about the allowed
values for the variables would be helpful in identifying data entry errors.
15
PeerJ Preprints | https://doi.org/10.7287/peerj.preprints.3183v1 | CC BY 4.0 Open Access | rec: 24 Aug 2017, publ: 24 Aug 2017
9 No calculations in the raw data files
Often, the Excel files that our collaborators send us include all kinds of calculations and
graphs. We feel strongly that your primary data file should contain just the data and
nothing else: no calculations, no graphs.
If you are doing calculations in your data file, that likely means you are regularly opening
it and typing into it. Doing so incurs some risk that you will accidentally type junk into
your data.
(Has this happened to you? You open an Excel file and start typing and nothing
happens, and then you select a cell and you can start typing. Where did all of that initial
text go? Well, sometimes it got entered into some random cell, to be discovered later during
data analysis.)
Your primary data file should be a pristine store of data. Write-protect it, back it up,
and don’t touch it.
If you want to do some analyses in Excel, make a copy of the file and do your calculations
and graphs in the copy.
10 Don’t use font color or highlighting as data
You might be tempted to highlight particular cells with suspicious data, or rows that
should be ignored. Or the font or font color might have some meaning. Instead, add
another column with an indicator variable (for example, "trusted", with values TRUE or
FALSE).
For example, in Figure 10A, a suspicious entry is highlighted. It would be better to
include an additional column that indicates the outliers (as in Figure 10B). The highlighting
is nice visually, but it is hard to extract that information for use in the later analysis.
Analysis programs can much more readily handle data that are stored in a column than
that which is encoded in cell highlighting, font, etc. (and in fact this markup will be lost
completely in many programs).
Another possible use of highlighting would be to indicate males and females in a mouse
study by highlighting the corresponding rows in different colors. But rather than use
16
PeerJ Preprints | https://doi.org/10.7287/peerj.preprints.3183v1 | CC BY 4.0 Open Access | rec: 24 Aug 2017, publ: 24 Aug 2017
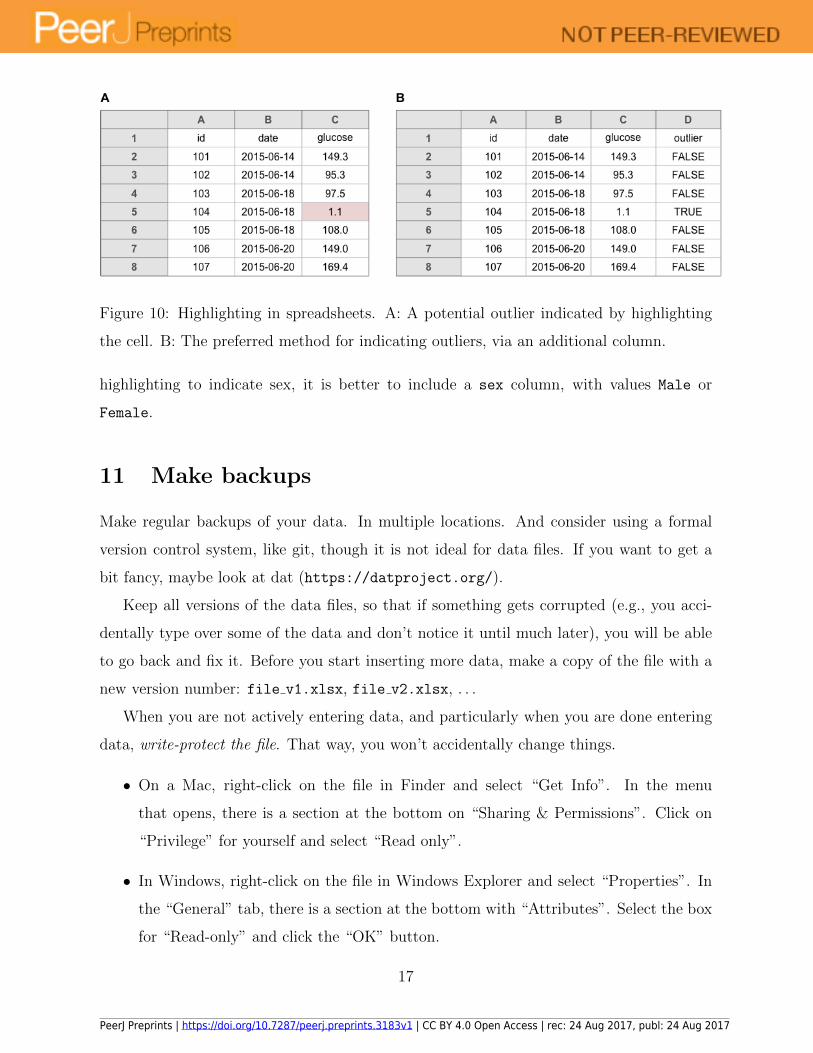
Figure 10: Highlighting in spreadsheets. A: A potential outlier indicated by highlighting
the cell. B: The preferred method for indicating outliers, via an additional column.
highlighting to indicate sex, it is better to include a sex column, with values Male or
Female.
11 Make backups
Make regular backups of your data. In multiple locations. And consider using a formal
version control system, like git, though it is not ideal for data files. If you want to get a
bit fancy, maybe look at dat (https://datproject.org/).
Keep all versions of the data files, so that if something gets corrupted (e.g., you acci-
dentally type over some of the data and don’t notice it until much later), you will be able
to go back and fix it. Before you start inserting more data, make a copy of the file with a
new version number: file v1.xlsx, file v2.xlsx, . . .
When you are not actively entering data, and particularly when you are done entering
data, write-protect the file. That way, you won’t accidentally change things.
• On a Mac, right-click on the file in Finder and select “Get Info”. In the menu
that opens, there is a section at the bottom on “Sharing & Permissions”. Click on
“Privilege” for yourself and select “Read only”.
• In Windows, right-click on the file in Windows Explorer and select “Properties”. In
the “General” tab, there is a section at the bottom with “Attributes”. Select the box
for “Read-only” and click the “OK” button.
17
PeerJ Preprints | https://doi.org/10.7287/peerj.preprints.3183v1 | CC BY 4.0 Open Access | rec: 24 Aug 2017, publ: 24 Aug 2017
Back up your data!
12 Use data validation to avoid errors
Regarding the task of data entry, it is important to ensure that the process is as error-free
and repetitive-stress-injury-free as possible. One useful tool for avoiding data entry errors
is the “data validation” feature in Excel (see http://bit.ly/excel_dataval), to control
the type of data or the values that users can enter into a cell.
• Select a column
• In the menu bar, choose Data → Validation
• Choose appropriate validation criteria. For example
– A whole number in some range
– A decimal number in some range
– A list of possible values
– Text, but with a limit on length
At the same time, you could select particular data types for the column, such as text, to
avoid having dates (or transcription factor names!) get mangled by Excel. We mentioned
this before in the discussion of dates, but it is worth repeating:
• Select the column
• In the menu bar, select Format → Cells
• Choose “Text” on the left
This may seem cumbersome, but if it helps you to avoid data entry mistakes, it would
be worth it.
13 Save the data in plain text files
Keep a copy of your data files in a plain text format, with comma or tab delimiters. We
generally use comma-delimited (CSV) files. The spreadsheet in Figure 11A would be saved
as a plain text file with commas separating the fields, as in Figure 11B.
18
PeerJ Preprints | https://doi.org/10.7287/peerj.preprints.3183v1 | CC BY 4.0 Open Access | rec: 24 Aug 2017, publ: 24 Aug 2017
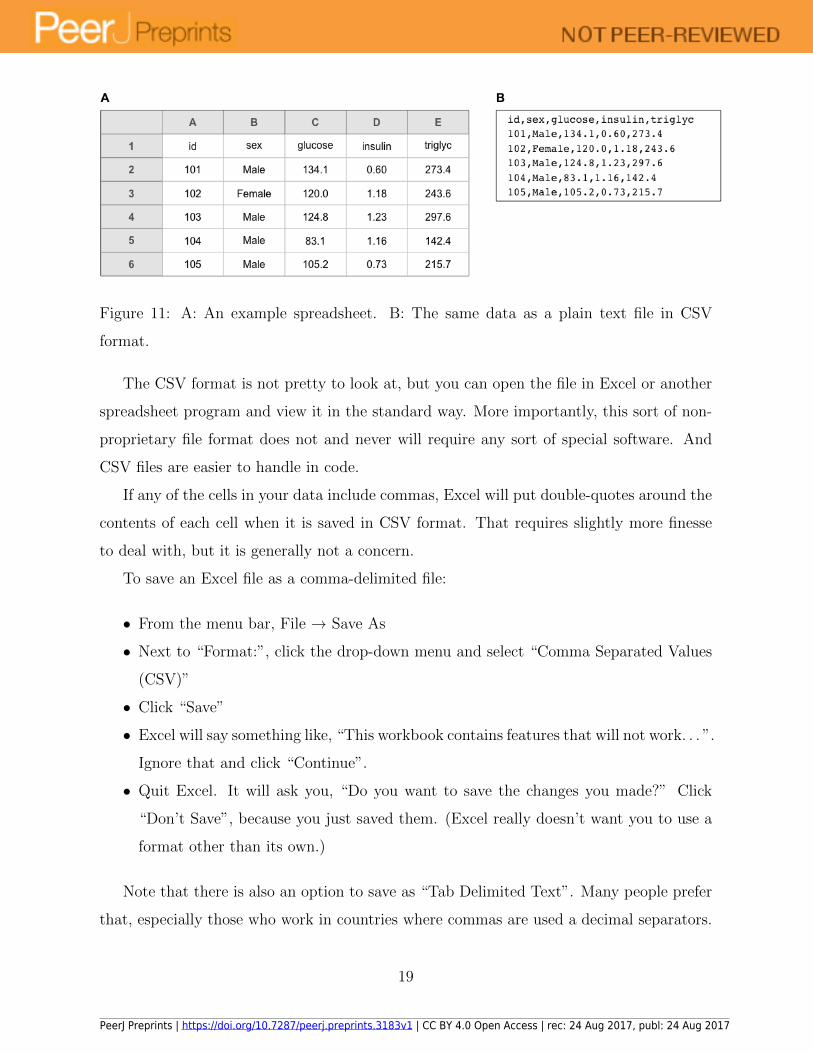
Figure 11: A: An example spreadsheet. B: The same data as a plain text file in CSV
format.
The CSV format is not pretty to look at, but you can open the file in Excel or another
spreadsheet program and view it in the standard way. More importantly, this sort of non-
proprietary file format does not and never will require any sort of special software. And
CSV files are easier to handle in code.
If any of the cells in your data include commas, Excel will put double-quotes around the
contents of each cell when it is saved in CSV format. That requires slightly more finesse
to deal with, but it is generally not a concern.
To save an Excel file as a comma-delimited file:
• From the menu bar, File → Save As
• Next to “Format:”, click the drop-down menu and select “Comma Separated Values
(CSV)”
• Click “Save”
• Excel will say something like, “This workbook contains features that will not work. . . ”.
Ignore that and click “Continue”.
• Quit Excel. It will ask you, “Do you want to save the changes you made?” Click
“Don’t Save”, because you just saved them. (Excel really doesn’t want you to use a
format other than its own.)
Note that there is also an option to save as “Tab Delimited Text”. Many people prefer
that, especially those who work in countries where commas are used a decimal separators.
19
PeerJ Preprints | https://doi.org/10.7287/peerj.preprints.3183v1 | CC BY 4.0 Open Access | rec: 24 Aug 2017, publ: 24 Aug 2017
Also note that, if your Excel file did contain critical features that will not work when
saved as a plain text file, such as highlighted cells, that is a problem; those features will be
lost. For your primary data file, keep things simple.
14 Summary
Spreadsheet programs (such as Microsoft Excel, Google Sheets, and LibreOffice Calc) are
valuable tools for entering, organizing, and storing data. They can also be used for calcu-
lations, analysis, and visualizations, but we have focused on the data organization aspects
here, and we encourage users interested in doing calculations or making data visualizations
within spreadsheets to keep their primary data files pristine and data-only, and to do their
calculations and visualizations in separate files.
We have offered a number of suggestions for how best to organize data within a spread-
sheet. Our primary concerns are to protect the integrity of the data, and to ease later
analysis.
Focus primarily on adopting these principles for future projects. While your current
data files may not meet these standards, it is best not to use copy-and-paste to rearrange
the files. By doing so, there’s a good chance of introducing errors. Data rearrangement is
best accomplished via code (such as with an R, Python, or Ruby script) so you never lose
the record of what you did to the data.
References
Briney, K. 2017. “Two Strategies for Working with Dates in Excel.” http://dataabinitio.
com/?p=798.
Casimir, R. J. 1992. “Real Programmers Don’t Use Spreadsheets.” SIGPLAN Not. 27
(6): 10–16. doi:10.1145/130981.130982.
Chadwick, D. 2003. “Stop That Subversive Spreadsheet!” In Integrity and Internal
Control in Information Systems V, edited by M. Gertz, 205–11. IFIP — the International
Federation for Information Processing 124. Springer US. http://link.springer.com/
20
PeerJ Preprints | https://doi.org/10.7287/peerj.preprints.3183v1 | CC BY 4.0 Open Access | rec: 24 Aug 2017, publ: 24 Aug 2017

chapter/10.1007/978-0-387-35693-8_13.
Murrell, P. 2013. “Data Intended for Human Consumption, Not Machine Consump-
tion.” In Bad Data Handbook, by Q. E. MacCallum, 31–51. Sebastopol, CA: O’Reilly
Media.
Panko, R. 2008. “What We Know About Spreadsheet Errors.” http://panko.shidler.
hawaii.edu/SSR/Mypapers/whatknow.htm.
Wagner, J. M., and J. Keisler. 2006. “Enhance Your Own Research Productivity Using
Spreadsheets.” In Models, Methods, and Applications for Innovative Decision Making, 148–
62. INFORMS Tutorials in Operations Research. INFORMS. doi:10.1287/educ.1063.0028.
White, E. P., E. Baldridge, Z. T. Brym, K. J. Locey, D. J. McGlinn, and S. R. Supp.
2013. “Nine Simple Ways to Make It Easier to (Re)use Your Data.” Ideas in Ecology and
Evolution 6 (2). doi:10.4033/iee.v6i2.4608.
Wickham, H. 2014. “Tidy Data.” Journal of Statistical Software 59: 1–23. doi:10.18637/jss.v059.i10.
Woo, K. H. 2014. “Abandon All Hope, Ye Who Enter Dates in Excel.” Data Pub.
https://datapub.cdlib.org/2014/04/10/abandon-all-hope-ye-who-enter-dates-in-
excel/.
Zeeberg, B. R., J. Riss, D. W. Kane, K. J. Bussey, E. Uchio, W. M. Linehan, J. C.
Barrett, and J. N. Weinstein. 2004. “Mistaken Identifiers: Gene Name Errors Can Be
Introduced Inadvertently When Using Excel in Bioinformatics.” BMC Bioinformatics 5
(June): 80. doi:10.1186/1471-2105-5-80.
Ziemann, M., Y. Eren, and A. El-Osta. 2016. “Gene Name Errors Are Widespread in
the Scientific Literature.” Genome Biology 17: 177. doi:10.1186/s13059-016-1044-7.
21
PeerJ Preprints | https://doi.org/10.7287/peerj.preprints.3183v1 | CC BY 4.0 Open Access | rec: 24 Aug 2017, publ: 24 Aug 2017