Embed Size (px)
Citation preview
Data Mining with Cellular Discrete Event Modeling and Simulation
Shafagh Jafer University of Virginia at Wise
Wise, VA, USA [email protected]
Yasser Jafer University of Ottawa Ottawa, ON, Canada [email protected]
Gabriel Wainer Carleton University
Ottawa, ON, Canada [email protected]
Keywords: Cellular discrete event simulation, Cell-DEVS, data mining, classification Abstract Data mining is the process of extracting patterns from data. A main step in this process is referred to as data classification. In this work, we investigate the use of the Cell-DEVS formalism for classifying data. The cells in a Cell-DEVS based grid are individually very simple but together they can represent complex behavior and are capable of self-organization. Three classifier models are implemented using Cell-DEVS. Different simulation scenarios are presented investigating the effect of Von Neumann versus Moore neighborhood in the classifiers’ models. We show that effective classification performance, comparable to those produced by complex data mining techniques, can be obtained from the collective behavior of discrete-event cellular grids. 1. INTRODUCTION The rapid emergence of computer and database technologies has turned data processing into a challenging task that is almost impossible to perform manually. Today's databases contain numerous data with many independent attributes that need to be considered simultaneously in order to extract accurate system behavior. Human's limited capacity for data processing has led to the need for automated extraction of useful knowledge from huge databases. Data mining and knowledge discovery [1] [2] have been widely recognized as core techniques in finding strategic information hidden in very large databases. These techniques focus on extracting new information from a large pool of data. This process requires the use of sophisticated data analysis algorithms to discover previously unknown valid patterns and relationships in large data sets. Moreover, data mining is not only about collection and management of data, but it also includes analysis and prediction. Data mining is a relatively young discipline with wide and diverse applications. Some of the application domains in this field include: financial data analysis (e.g. banking and loan services), retail industry (e.g. on-line shopping), telecommunication industry (e.g. long-distance telephone services), biological data analysis (e.g. bioinformatics and biomedical research), intrusion detection (e.g. internet security), and many other fields. Data mining is an ongoing
research field with many unfolded issues that are being currently investigated. Classification, as one of the main data mining tasks, deals with the categorization of data for its most effective and efficient use. Classification techniques have been widely used by the machine learning and statistics communities over the past several decades [3]. In this task, data is classified into different classes according to any criteria, and not only in terms of their relative importance or frequency of use. Classification, as a form of data analysis, is a well-known method used for extracting models describing important data classes. Data classification, along with prediction, are used in predicting future data trends which are vastly used for pattern recognition [4]. Many classification and prediction methods have been proposed by researchers, such as decision tree classifiers, rule-based classifiers, k-nearest-neighbor classifiers, fuzzy logic techniques, and many others [1]. Most of these algorithms suffer from memory constraints, limiting the application of the technique to small data sizes only. Developing scalable classification and prediction techniques capable of handling large-scale data set remains as a challenge in this field. In a recent effort [5], Cellular Automata (CA) [6] was applied to data mining for the purpose of data classification. The study made use of the powerful characteristics of CA to show that effective classification performance can be achieved by very simple transition rules among the cellular neighbors that make purely local decisions. However, the study does not compete with classical models of data classification, and the time complexity of the algorithm grows as it is applied over larger cellular models. We are thus interested in studying the application of Cellular Discrete Event System Specification (Cell-DEVS) [7] to resolve the data classification problem. Unlike CA, Cell-DEVS does not require updating the entire cellular grid at every time step. Rather, only cells with updated neighbor values are evaluated. This improvement overcomes the issue of the original CA by reducing the overall execution cost, leading to faster classifications over large-scale data sets. We have implemented different classification models using the CD++ development environment [8] which implements Cell-DEVS theory and allows visualization of the cellular models in real-time. The models used in this paper are similar to those studied in [5] where the original CA
technique was applied to data classification. We show that effective classification performance, comparable to those produced by complex data mining techniques, can be obtained from the collective behavior of discrete-event cellular grids, which is composed of very simple cells that make local decisions solely based on the information gathered from their immediate neighbors. The models presented here stand as the basis for exploring data mining with Cell-DEVS. Investigating more complex and mature models and techniques are our next research direction towards DEVS-based data mining. The remainder of this paper is organized as follows. Section 2 provides basic background on data classification, and cellular automata, and presents related research in the scope of our work. Section 3 describes an approach to using Cell-DEVS for data mining, and highlights the benefits of using this methodology over the classical CA. Section 4 presents three classifier models implemented using Cell-DEVS in CD++ environment. It also provides some basic experiments on two-dimensional patterns using different cellular neighborhood definition. Section 5 provides the concluding remarks, and discusses our future research plan. 2. BACKGROUND 2.1. Data Classification Data mining is an interdisciplinary field, which combines a set of disciplines including database systems, statistics, machine learning, visualization, and information science. Moreover, depending on the kinds of data to be mined, other techniques such as pattern recognition, image analysis, computer graphics or even bioinformatics might be integrated as well. Therefore, the challenge is to distinguish among the different data mining systems, and to identify the appropriate technique that best meets one’s needs. An important part of data mining is pattern classification. A data mining system has the potential of generating thousands or even millions of patterns. It is very important to identify the patterns that are interesting and provide meaningful information. A pattern is considered useful if [1]: (1) it is easily understood by humans, (2) can be validated with new or test data, and (3) is useful and novel [1]. A data mining system is said to be complete if it is able to generate all of the interesting patterns. Obviously since it is often unrealistic and inefficient for data mining systems to generate all of the possible patterns, user-supplied constraints and conditions are used to narrow down the search. Data classification, as a form of data analysis is a technique for identifying useful and interesting patterns by focusing on predefined characteristics among the data of the set being under study. The process of data classification is implemented by first building a classifier that describes a predetermined set of data classes or concepts. This step is referred to as the learning step (or training phase), since the classifier is built
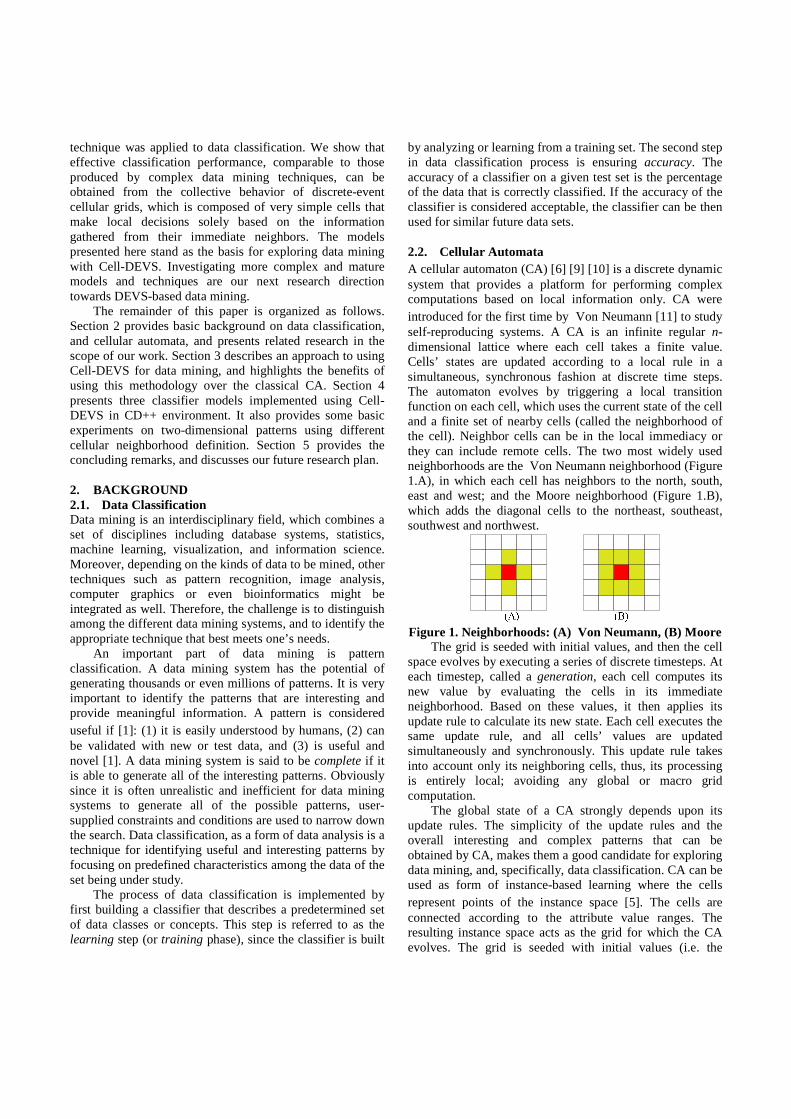
by analyzing or learning from a training set. The second step in data classification process is ensuring accuracy. The accuracy of a classifier on a given test set is the percentage of the data that is correctly classified. If the accuracy of the classifier is considered acceptable, the classifier can be then used for similar future data sets. 2.2. Cellular Automata A cellular automaton (CA) [6] [9] [10] is a discrete dynamic system that provides a platform for performing complex computations based on local information only. CA were introduced for the first time by Von Neumann [11] to study self-reproducing systems. A CA is an infinite regular n-dimensional lattice where each cell takes a finite value. Cells’ states are updated according to a local rule in a simultaneous, synchronous fashion at discrete time steps. The automaton evolves by triggering a local transition function on each cell, which uses the current state of the cell and a finite set of nearby cells (called the neighborhood of the cell). Neighbor cells can be in the local immediacy or they can include remote cells. The two most widely used neighborhoods are the Von Neumann neighborhood (Figure 1.A), in which each cell has neighbors to the north, south, east and west; and the Moore neighborhood (Figure 1.B), which adds the diagonal cells to the northeast, southeast, southwest and northwest.
Figure 1. Neighborhoods: (A) Von Neumann, (B) Moore The grid is seeded with initial values, and then the cell space evolves by executing a series of discrete timesteps. At each timestep, called a generation, each cell computes its new value by evaluating the cells in its immediate neighborhood. Based on these values, it then applies its update rule to calculate its new state. Each cell executes the same update rule, and all cells’ values are updated simultaneously and synchronously. This update rule takes into account only its neighboring cells, thus, its processing is entirely local; avoiding any global or macro grid computation. The global state of a CA strongly depends upon its update rules. The simplicity of the update rules and the overall interesting and complex patterns that can be obtained by CA, makes them a good candidate for exploring data mining, and, specifically, data classification. CA can be used as form of instance-based learning where the cells represent points of the instance space [5]. The cells are connected according to the attribute value ranges. The resulting instance space acts as the grid for which the CA evolves. The grid is seeded with initial values (i.e. the
training instances), and the CA runs until a stable state is reached (convergence point). The intention is that cells with similar class assignments will group and merge into distinct regions over the cell space. 2.3. CA and Classification A number of studies have been proposed aiming at using CA models for classification. The model proposed by [12] uses a two dimensional CA, and an attribute that changes over time in order to provide a dynamic and accurate classification. This approach mixes a group of classifiers to improve the classification accuracy. The results reported show that the iterative process of combining classifiers in CA leads to superior accuracy, since a combination of methods can be applied to a single model. Another CA classifier model proposed in [5] makes use of multidimensional CA to classify data according to class assignments. The study shows that effective generalization can be achieved with very simple rules and cells that make purely local decisions. The experiments presented in that paper also reported that the performance obtained using CA is comparable to the more traditional (and complex) data mining algorithms. The study in [13] provides an enhancement over the model presented in [5] by modifying the transition rules to make the new model surpass the previous model in terms of performance and accuracy. However, both of these studies still suffer from high time complexity due to the discrete-time update nature of CA. CA has also been used in other domains of data mining. The research presented in [14] proposes a cellular automata model that can be used in Neuroimaging, specifically for functional magnetic resonance imaging (fMRI) brain images classification. The experimental results showed that CA outperformed the support vector machine classification method [15] in terms of accuracy, sensitivity, specificity, and performance. Moreover, a data clustering and visualization model for cellular ants was presented in [16]. The CA provided a decentralized multi-agent system that can autonomously detect data similarity patterns (clustering) in multi-dimensional datasets and then determine the corresponding visual cues, such as position, color, and shape size, of the visual objects. The research shows two new features of the cellular ant method: color and shape size negotiation because of combining CA insights with data clustering. The major limitation of all of the previous studies mentioned above is the time complexity of the CA models, which grows exponentially especially when the cell space is large and is composed of more than two dimensions. CA requires updating all of the cell space at every time step. This leads to major speedup drawbacks as most of the cells do not necessarily need to re-compute their local rules (their state is the same from current generation to previous
generation). Aiming at overcoming this limitation of the original CA, in this research we propose the use of Cell-DEVS for data classification. Cell-DEVS formalism requires only those cells with sate change to re-compute their evaluation rules leading to a major speedup over the conventional CA. 2.4. Cell-DEVS for Data mining Despite its widespread application, CA has two major limitations, making it computationally inefficient. First, due to its discrete-time nature, simulation precision and execution efficiency is greatly restricted. Secondly, at each time step, all the cells are evaluated synchronously, incurring an unnecessarily computational cost when only a small fraction of the cells needs to be updated. The Cell-DEVS formalism [7] overcomes these issues by integrating DEVS [17] and CA to present each cell as an atomic DEVS model. Cell-DEVS solves the problem of unnecessary processing burden in cells and allows for more efficient asynchronous execution, using a continuous time base, without loosing accuracy. The formalism allows defining an n-dimensional cell space to represent complex discrete event spatial models, where each cell is a DEVS atomic model, allowing for specifying both temporal and spatial relations between model components. In this methodology, each cell changes state in response to the occurrence of events in an event-driven fashion. A Cell-DEVS atomic model is defined by [18]:
TDC = < X, Y, I, S, θ, N, d, δint, δext, τ, λ, D >, where X is a set of external input events; Y is a set of external output events; I represents the model's modular interface; S is the set of sequential states for the cell; θ is the cell state definition; N is the set of states for the input events; d is the delay for the cell; δint is the internal transition function; δext is the external transition function; τ is the local computation function; λ is the output function; and D is the state's duration function. The modular interface (I) represents the input/output ports of the cell and their connection to the neighbor cell. Communications among cells are performed through these ports. The values inserted through input ports are used to compute the future state of the cell by evaluating the local computation function τ. Once τ is computed, if the result is different from the current cell’s state, this new state value must be sent out to all neighboring cells informing the state change. Otherwise, the cell remains in its current state and therefore no output will be propagated to other cells. This will happen when the time given by the delay function expires. Finally, the internal, external transition functions and output functions (λ) define this behavior. Cell-DEVS improves execution performance of cellular models by using a discrete-event approach. It also enhances the cell’s timing definition by making it more expressive.
CD++ [8] is an open-source object-oriented modeling and simulation environment that implements both DEVS and Cell-DEVS theories in C++. The tool provides a specification language that defines the model’s coupling, the initial values, the external events, and the local transition rules for Cell-DEVS models. CD++ also includes an interpreter for Cell-DEVS models. The language is based on the formal specifications of Cell-DEVS. The model specification includes the definition of the size and dimension of the cell space, the shape of the neighborhood and the border. The cell’s local computing function is defined using a set of rules with the form postcondition delay {precondition}. These indicate that when the precondition is met, the state of the cell changes to the designated postcondition after the duration specified by delay. If the precondition is not met, then the next rule is evaluated until a rule is satisfied or there are no more rules. CD++ also provides a visualization tool, called CD++ Modeler, which takes the result of the Cell-DEVS simulation as input and generates a 2-D representation of the cell space evolution over the simulation time. This feature of the tool provides an interactive environment allowing for visual tracking of the classification process as it takes place over discrete timesteps. We propose using Cell-DEVS for data classification. A model is presented as a cellular grid with initial points that are spread over the cell space. Using simple voting rules, a cell’s neighbors are examined and the cell’s value is set according to the number of neighbors that are set to a given class. Such model can be constructed in any dimension allowing incorporating more sophisticated features and classification rules. The simplicity of the computational rules and the ease of extending the model into a multi-dimensional classifier makes Cell-DEVS a good choice for applying data classification for large-scale data sets. In addition, Cell-DEVS addresses major issues in data mining regarding mining methodology, user interaction, performance, and diverse data types. 3. CELL-DEVS CLASSIFIER MODELS In this section, we present our classifier models based on Cell-DEVS, and implemented in the CD++ environment. Three different classifier models were constructed and examined with different data:
• A two-class data classifier with Von Neumann neighborhood,
• A three-class data classifier with Von Neumann and Moore neighborhoods, and
• A parabola data classifier with Von Neumann and Moore neighborhoods.
The purpose of these models is to show the ability of Cell-DEVS theory in exploiting classification characteristics among the data set. We will show how simple evaluation rules classify the data as a result of only local computations
of a given cell considering its immediate neighboring as dictated by the Cell-DEVS model specification. In all of our models, a cell space is seeded with initial values, and then the model evolves through a series cell computations. The simulation is divided into a number of generations. At each timestep, a new generation starts, requiring each cell to compute its new value by examining its neighboring cells. Based on the values of its neighboring cells, the cell then applies its evaluation rule to compute its new state. Each cell executes the same rule, but only those cells with a new state broadcast their new status to their neighboring cells. This will avoid the simultaneous and synchronous update of all the cells, as in the original CA. The simulation generations proceed until all cells are assigned a class. 3.1. Two-class Classifier Model Our first classifier model creates a 2-D cell space that is initially seeded with two different classes. Cells are classified as either Type 1 (cell’s value = 1) or Type 2 (cell’s value = 2) based on the following voting rules [5]:
0 : class 1 neighbors + class 2 neighbors = 0 1 : class 1 neighbors > class 2 neighbors 2 : class 1 neighbors < class 2 neighbors Rand({1,2}) : class 1 neighbors = class 2 neighbors
Given the above voting rules, the formal Cell-DEVS specification of the model is as follows:
TDC = < X, Y, I, S, θ, N, d, δint, δext, τ, λ, D > X = Y = Ø S = {0, 1, 2} N = {(-1,0), (0,-1), (0,0), (0,1), (1,0)} d = 100 ms τ: N�S
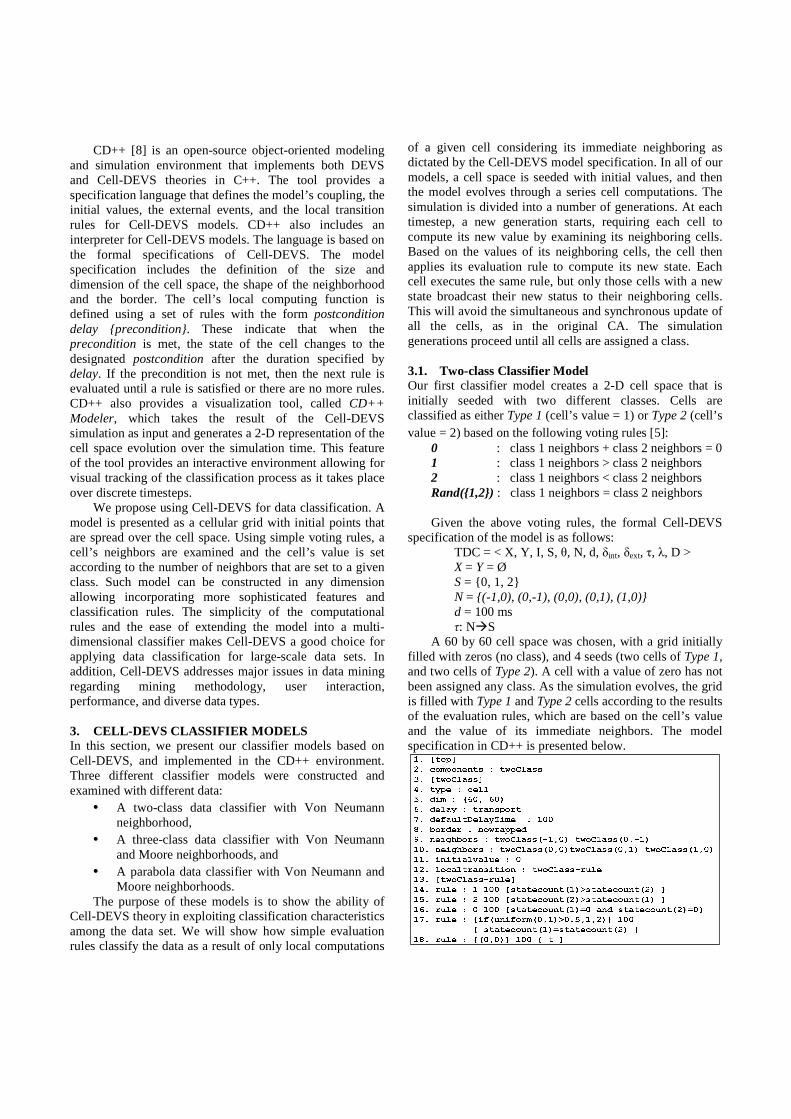
A 60 by 60 cell space was chosen, with a grid initially filled with zeros (no class), and 4 seeds (two cells of Type 1, and two cells of Type 2). A cell with a value of zero has not been assigned any class. As the simulation evolves, the grid is filled with Type 1 and Type 2 cells according to the results of the evaluation rules, which are based on the cell’s value and the value of its immediate neighbors. The model specification in CD++ is presented below.
Line 1 through line 11 show the specification of the model in terms of size, delay of each generation (the timestep from one generation to another which is 100 msec.), and the neighborhood definition of each cell. Line 14 through line 18 present the evaluation rules for the classifier. These rules examine each cell’s four neighbors and set its class to the majority class. Each rule presents the resulting value of the cell if the condition presented in the brackets is met. It takes 100 milliseconds for the value of
the cell to be transmitted to the neighbors. The function statecount(n) returns the number of neighboring cells with the value n. The rule at line 17 shows a tie-breaking scenario where if the cell has equal number of class1 and class2 neighbors, it will be assigned a class type based on the value returned by the random function. That is, if the generated random number, from the uniform distribution between 0 and 1, is larger than 0.5, then the cell is assigned to class1, otherwise, the cell’s value will be of type class2.
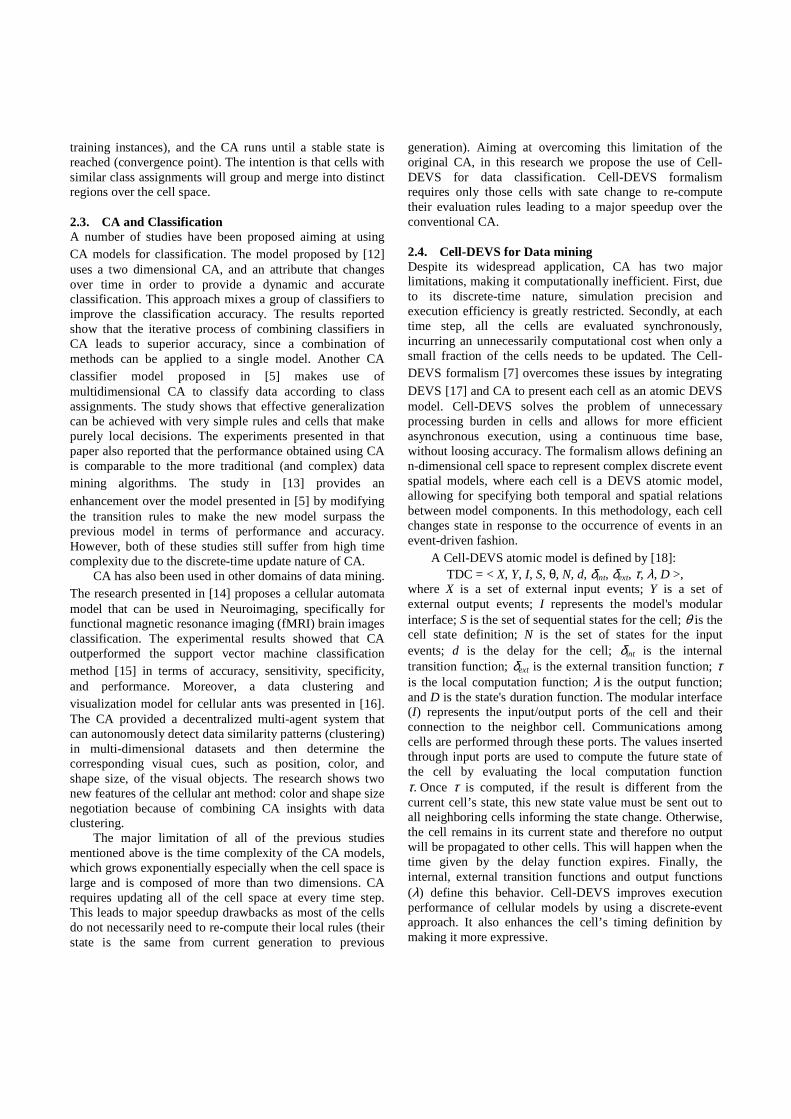
Figure 2. Two-Class Model with Von Neumann Neighborhood
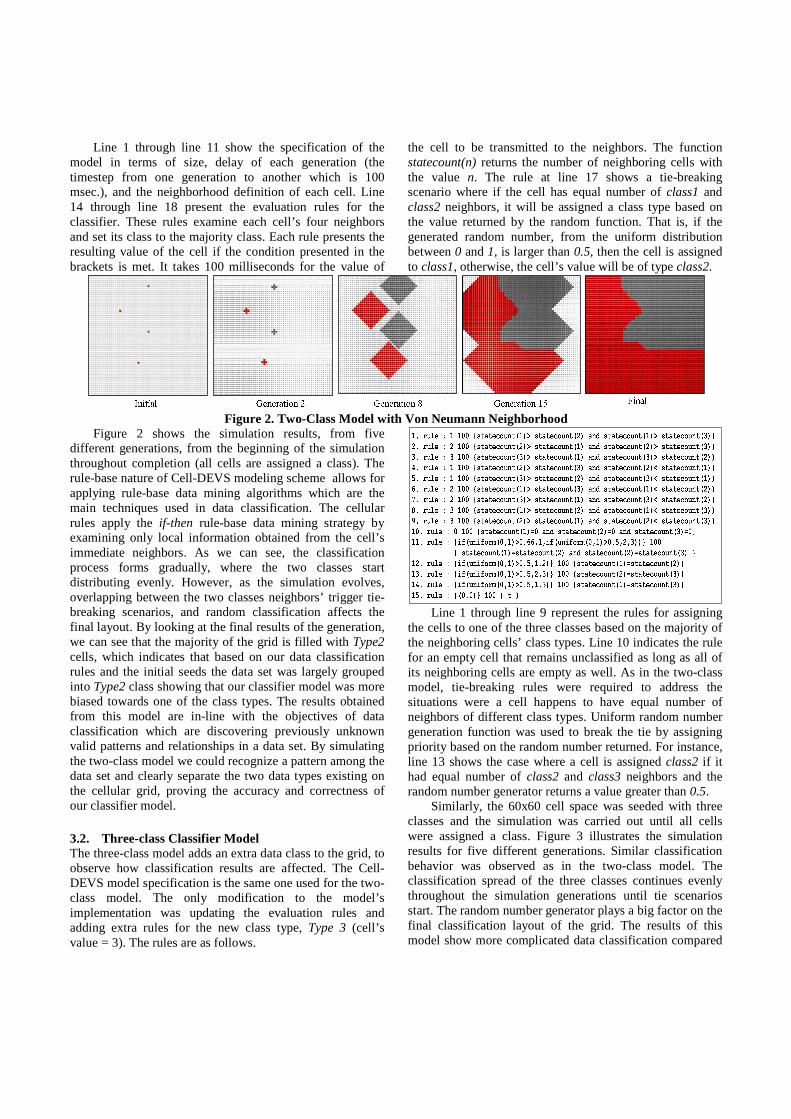
Figure 2 shows the simulation results, from five different generations, from the beginning of the simulation throughout completion (all cells are assigned a class). The rule-base nature of Cell-DEVS modeling scheme allows for applying rule-base data mining algorithms which are the main techniques used in data classification. The cellular rules apply the if-then rule-base data mining strategy by examining only local information obtained from the cell’s immediate neighbors. As we can see, the classification process forms gradually, where the two classes start distributing evenly. However, as the simulation evolves, overlapping between the two classes neighbors’ trigger tie-breaking scenarios, and random classification affects the final layout. By looking at the final results of the generation, we can see that the majority of the grid is filled with Type2 cells, which indicates that based on our data classification rules and the initial seeds the data set was largely grouped into Type2 class showing that our classifier model was more biased towards one of the class types. The results obtained from this model are in-line with the objectives of data classification which are discovering previously unknown valid patterns and relationships in a data set. By simulating the two-class model we could recognize a pattern among the data set and clearly separate the two data types existing on the cellular grid, proving the accuracy and correctness of our classifier model. 3.2. Three-class Classifier Model The three-class model adds an extra data class to the grid, to observe how classification results are affected. The Cell-DEVS model specification is the same one used for the two-class model. The only modification to the model’s implementation was updating the evaluation rules and adding extra rules for the new class type, Type 3 (cell’s value = 3). The rules are as follows.
Line 1 through line 9 represent the rules for assigning the cells to one of the three classes based on the majority of the neighboring cells’ class types. Line 10 indicates the rule for an empty cell that remains unclassified as long as all of its neighboring cells are empty as well. As in the two-class model, tie-breaking rules were required to address the situations were a cell happens to have equal number of neighbors of different class types. Uniform random number generation function was used to break the tie by assigning priority based on the random number returned. For instance, line 13 shows the case where a cell is assigned class2 if it had equal number of class2 and class3 neighbors and the random number generator returns a value greater than 0.5. Similarly, the 60x60 cell space was seeded with three classes and the simulation was carried out until all cells were assigned a class. Figure 3 illustrates the simulation results for five different generations. Similar classification behavior was observed as in the two-class model. The classification spread of the three classes continues evenly throughout the simulation generations until tie scenarios start. The random number generator plays a big factor on the final classification layout of the grid. The results of this model show more complicated data classification compared
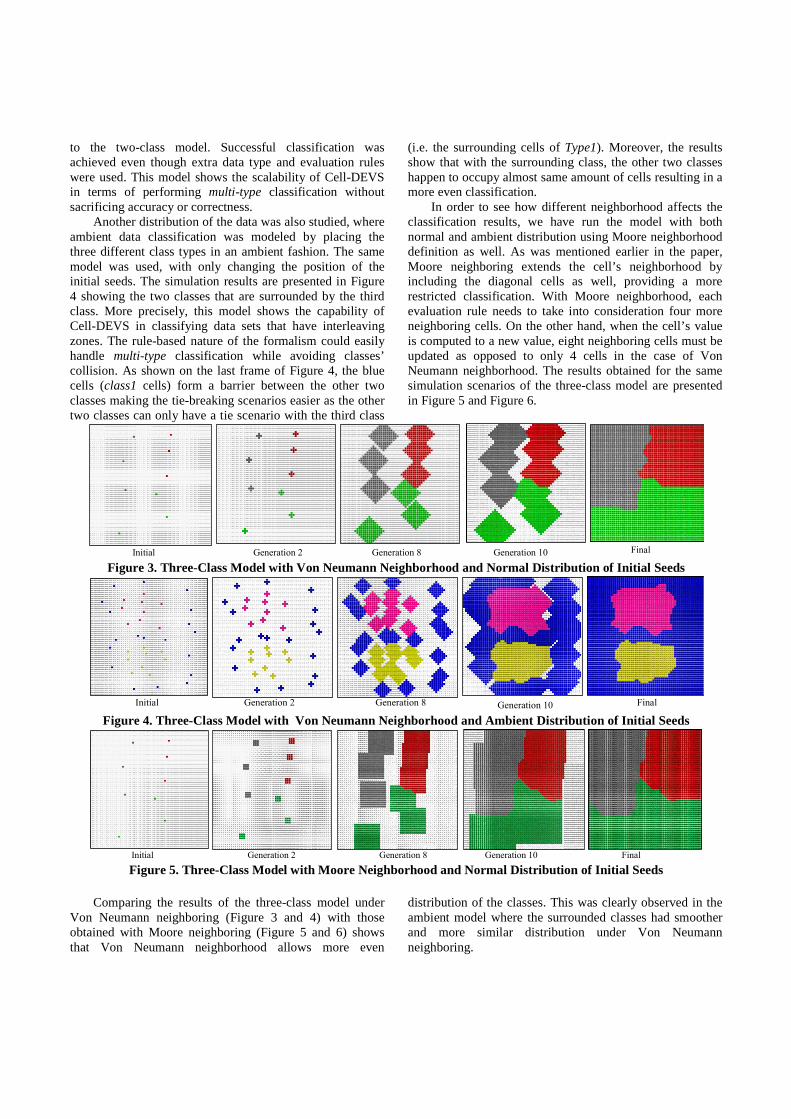
to the two-class model. Successful classification was achieved even though extra data type and evaluation rules were used. This model shows the scalability of Cell-DEVS in terms of performing multi-type classification without sacrificing accuracy or correctness. Another distribution of the data was also studied, where ambient data classification was modeled by placing the three different class types in an ambient fashion. The same model was used, with only changing the position of the initial seeds. The simulation results are presented in Figure 4 showing the two classes that are surrounded by the third class. More precisely, this model shows the capability of Cell-DEVS in classifying data sets that have interleaving zones. The rule-based nature of the formalism could easily handle multi-type classification while avoiding classes’ collision. As shown on the last frame of Figure 4, the blue cells (class1 cells) form a barrier between the other two classes making the tie-breaking scenarios easier as the other two classes can only have a tie scenario with the third class
(i.e. the surrounding cells of Type1). Moreover, the results show that with the surrounding class, the other two classes happen to occupy almost same amount of cells resulting in a more even classification. In order to see how different neighborhood affects the classification results, we have run the model with both normal and ambient distribution using Moore neighborhood definition as well. As was mentioned earlier in the paper, Moore neighboring extends the cell’s neighborhood by including the diagonal cells as well, providing a more restricted classification. With Moore neighborhood, each evaluation rule needs to take into consideration four more neighboring cells. On the other hand, when the cell’s value is computed to a new value, eight neighboring cells must be updated as opposed to only 4 cells in the case of Von Neumann neighborhood. The results obtained for the same simulation scenarios of the three-class model are presented in Figure 5 and Figure 6.
Initial Generation 2 Generation 8 Generation 10 Final Figure 3. Three-Class Model with Von Neumann Neighborhood and Normal Distribution of Initial Seeds
Initial Generation 2 Generation 8 Generation 10 Final
Figure 4. Three-Class Model with Von Neumann Neighborhood and Ambient Distribution of Initial Seeds
Initial Generation 2 Generation 8 Generation 10 Final Figure 5. Three-Class Model with Moore Neighborhood and Normal Distribution of Initial Seeds
Comparing the results of the three-class model under Von Neumann neighboring (Figure 3 and 4) with those obtained with Moore neighboring (Figure 5 and 6) shows that Von Neumann neighborhood allows more even
distribution of the classes. This was clearly observed in the ambient model where the surrounded classes had smoother and more similar distribution under Von Neumann neighboring.
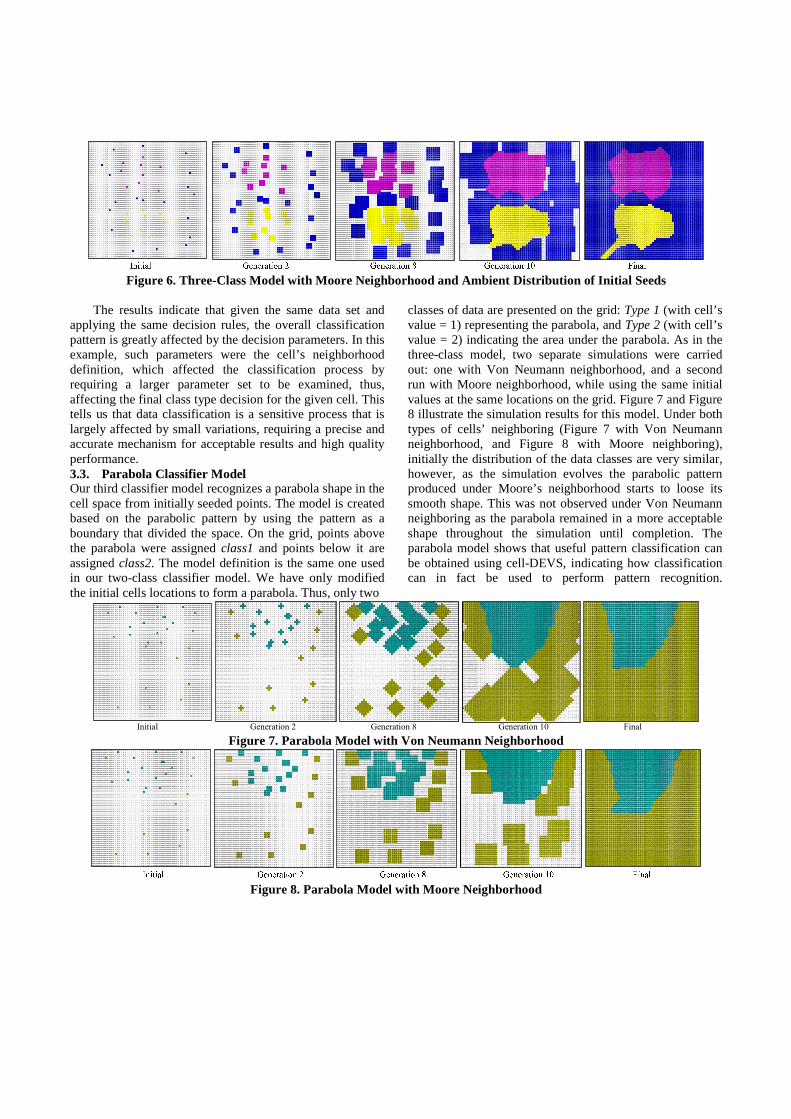
Figure 6. Three-Class Model with Moore Neighborhood and Ambient Distribution of Initial Seeds
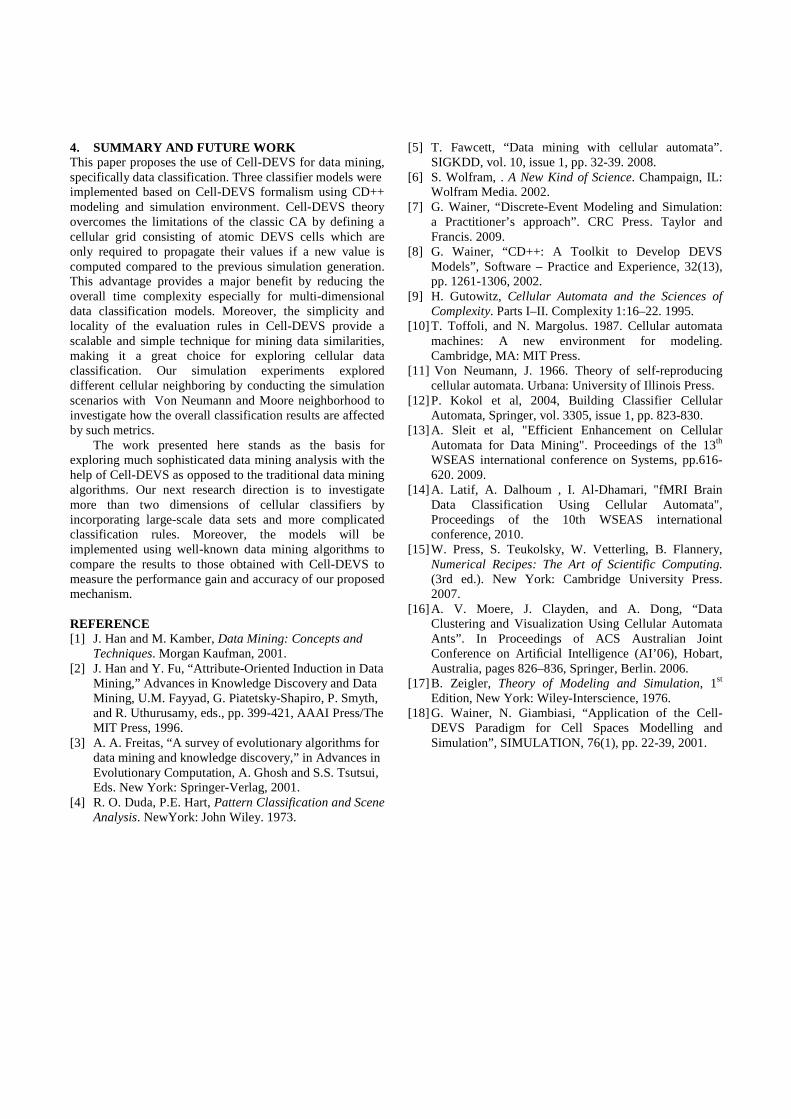
The results indicate that given the same data set and applying the same decision rules, the overall classification pattern is greatly affected by the decision parameters. In this example, such parameters were the cell’s neighborhood definition, which affected the classification process by requiring a larger parameter set to be examined, thus, affecting the final class type decision for the given cell. This tells us that data classification is a sensitive process that is largely affected by small variations, requiring a precise and accurate mechanism for acceptable results and high quality performance. 3.3. Parabola Classifier Model Our third classifier model recognizes a parabola shape in the cell space from initially seeded points. The model is created based on the parabolic pattern by using the pattern as a boundary that divided the space. On the grid, points above the parabola were assigned class1 and points below it are assigned class2. The model definition is the same one used in our two-class classifier model. We have only modified the initial cells locations to form a parabola. Thus, only two
classes of data are presented on the grid: Type 1 (with cell’s value = 1) representing the parabola, and Type 2 (with cell’s value = 2) indicating the area under the parabola. As in the three-class model, two separate simulations were carried out: one with Von Neumann neighborhood, and a second run with Moore neighborhood, while using the same initial values at the same locations on the grid. Figure 7 and Figure 8 illustrate the simulation results for this model. Under both types of cells’ neighboring (Figure 7 with Von Neumann neighborhood, and Figure 8 with Moore neighboring), initially the distribution of the data classes are very similar, however, as the simulation evolves the parabolic pattern produced under Moore’s neighborhood starts to loose its smooth shape. This was not observed under Von Neumann neighboring as the parabola remained in a more acceptable shape throughout the simulation until completion. The parabola model shows that useful pattern classification can be obtained using cell-DEVS, indicating how classification can in fact be used to perform pattern recognition.
Initial Generation 2 Generation 8 Generation 10 Final Figure 7. Parabola Model with Von Neumann Neighborhood
Figure 8. Parabola Model with Moore Neighborhood
4. SUMMARY AND FUTURE WORK This paper proposes the use of Cell-DEVS for data mining, specifically data classification. Three classifier models were implemented based on Cell-DEVS formalism using CD++ modeling and simulation environment. Cell-DEVS theory overcomes the limitations of the classic CA by defining a cellular grid consisting of atomic DEVS cells which are only required to propagate their values if a new value is computed compared to the previous simulation generation. This advantage provides a major benefit by reducing the overall time complexity especially for multi-dimensional data classification models. Moreover, the simplicity and locality of the evaluation rules in Cell-DEVS provide a scalable and simple technique for mining data similarities, making it a great choice for exploring cellular data classification. Our simulation experiments explored different cellular neighboring by conducting the simulation scenarios with Von Neumann and Moore neighborhood to investigate how the overall classification results are affected by such metrics. The work presented here stands as the basis for exploring much sophisticated data mining analysis with the help of Cell-DEVS as opposed to the traditional data mining algorithms. Our next research direction is to investigate more than two dimensions of cellular classifiers by incorporating large-scale data sets and more complicated classification rules. Moreover, the models will be implemented using well-known data mining algorithms to compare the results to those obtained with Cell-DEVS to measure the performance gain and accuracy of our proposed mechanism. REFERENCE [1] J. Han and M. Kamber, Data Mining: Concepts and
Techniques. Morgan Kaufman, 2001. [2] J. Han and Y. Fu, “Attribute-Oriented Induction in Data
Mining,” Advances in Knowledge Discovery and Data Mining, U.M. Fayyad, G. Piatetsky-Shapiro, P. Smyth, and R. Uthurusamy, eds., pp. 399-421, AAAI Press/The MIT Press, 1996.
[3] A. A. Freitas, “A survey of evolutionary algorithms for data mining and knowledge discovery,” in Advances in Evolutionary Computation, A. Ghosh and S.S. Tsutsui, Eds. New York: Springer-Verlag, 2001.
[4] R. O. Duda, P.E. Hart, Pattern Classification and Scene Analysis. NewYork: John Wiley. 1973.
[5] T. Fawcett, “Data mining with cellular automata”. SIGKDD, vol. 10, issue 1, pp. 32-39. 2008.
[6] S. Wolfram, . A New Kind of Science. Champaign, IL: Wolfram Media. 2002.
[7] G. Wainer, “Discrete-Event Modeling and Simulation: a Practitioner’s approach”. CRC Press. Taylor and Francis. 2009.
[8] G. Wainer, “CD++: A Toolkit to Develop DEVS Models”, Software – Practice and Experience, 32(13), pp. 1261-1306, 2002.
[9] H. Gutowitz, Cellular Automata and the Sciences of Complexity. Parts I–II. Complexity 1:16–22. 1995.
[10] T. Toffoli, and N. Margolus. 1987. Cellular automata machines: A new environment for modeling. Cambridge, MA: MIT Press.
[11] Von Neumann, J. 1966. Theory of self-reproducing cellular automata. Urbana: University of Illinois Press.
[12] P. Kokol et al, 2004, Building Classifier Cellular Automata, Springer, vol. 3305, issue 1, pp. 823-830.
[13] A. Sleit et al, "Efficient Enhancement on Cellular Automata for Data Mining". Proceedings of the 13th WSEAS international conference on Systems, pp.616-620. 2009.
[14] A. Latif, A. Dalhoum , I. Al-Dhamari, "fMRI Brain Data Classification Using Cellular Automata", Proceedings of the 10th WSEAS international conference, 2010.
[15] W. Press, S. Teukolsky, W. Vetterling, B. Flannery, Numerical Recipes: The Art of Scientific Computing. (3rd ed.). New York: Cambridge University Press. 2007.
[16] A. V. Moere, J. Clayden, and A. Dong, “Data Clustering and Visualization Using Cellular Automata Ants”. In Proceedings of ACS Australian Joint Conference on Artificial Intelligence (AI’06), Hobart, Australia, pages 826–836, Springer, Berlin. 2006.
[17] B. Zeigler, Theory of Modeling and Simulation, 1st Edition, New York: Wiley-Interscience, 1976.
[18] G. Wainer, N. Giambiasi, “Application of the Cell-DEVS Paradigm for Cell Spaces Modelling and Simulation”, SIMULATION, 76(1), pp. 22-39, 2001.