Embed Size (px)
Citation preview

P. Adamopoulos New York University
Lecture 4: Discriminant Functions
Stern School of Business
New York University
Spring 2014
Data Mining for Business Analytics

P. Adamopoulos New York University
Heat map of XYZ Hotels geographic brand affinity
P. Adamopoulos New York University
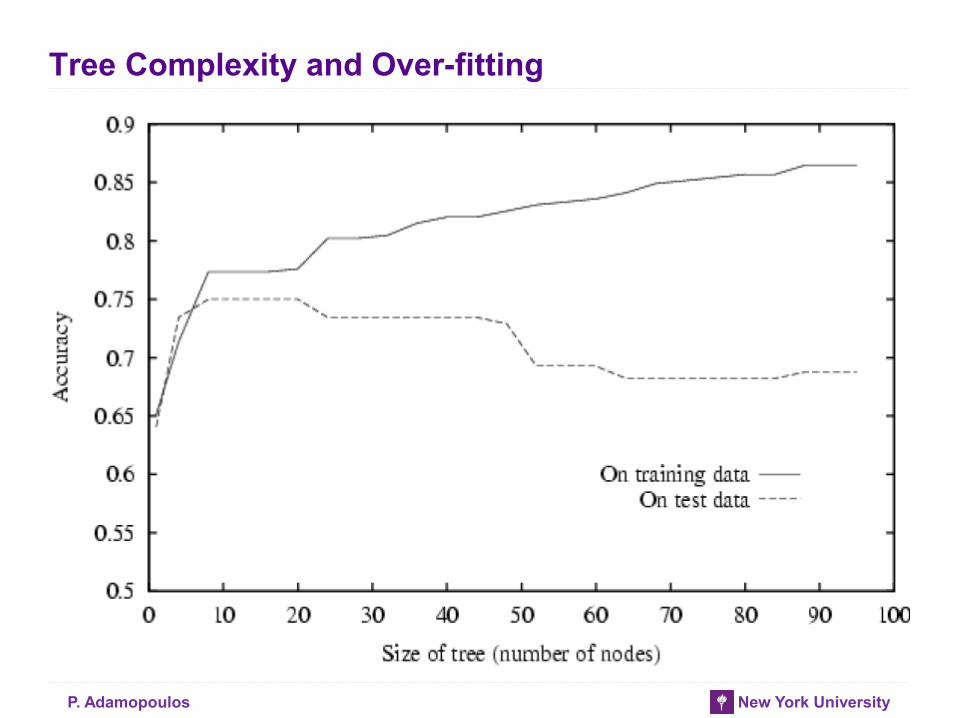
Tree Complexity and Over-fitting

P. Adamopoulos New York University
Trees on Churn

P. Adamopoulos New York University
Pruning
• Pruning simplifies a decision tree to prevent over-fitting to noise in
the data
• Post-pruning:
• takes a fully-grown decision tree and discards unreliable parts
• Pre-pruning:
• stops growing a branch when information becomes unreliable
• Post-pruning preferred in practice

P. Adamopoulos New York University
Post-pruning a tree
P. Adamopoulos New York University
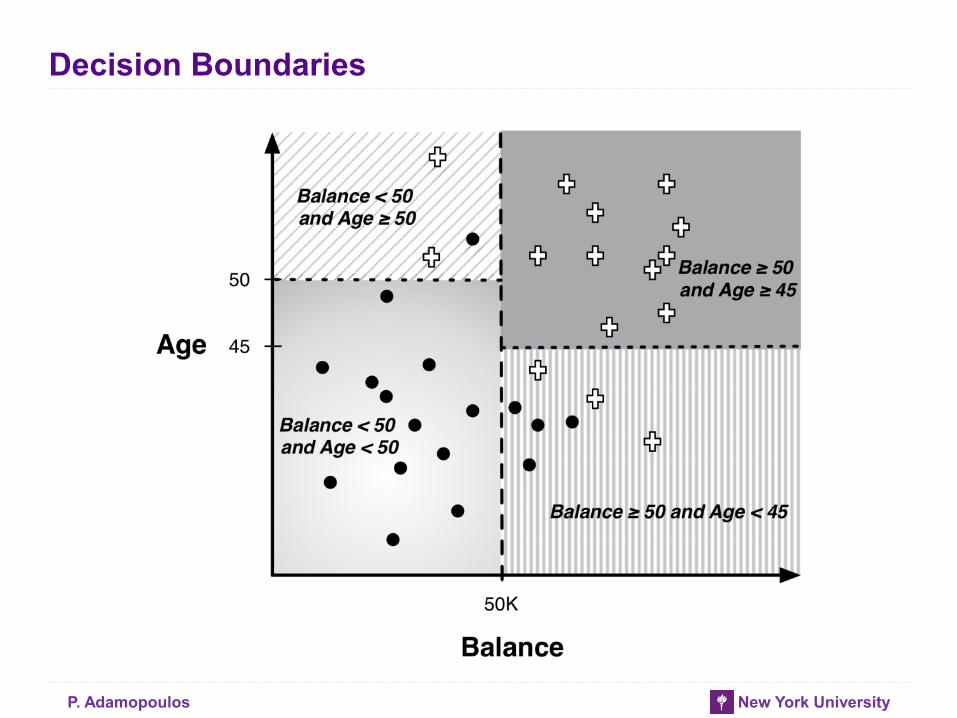
Decision Boundaries
P. Adamopoulos New York University
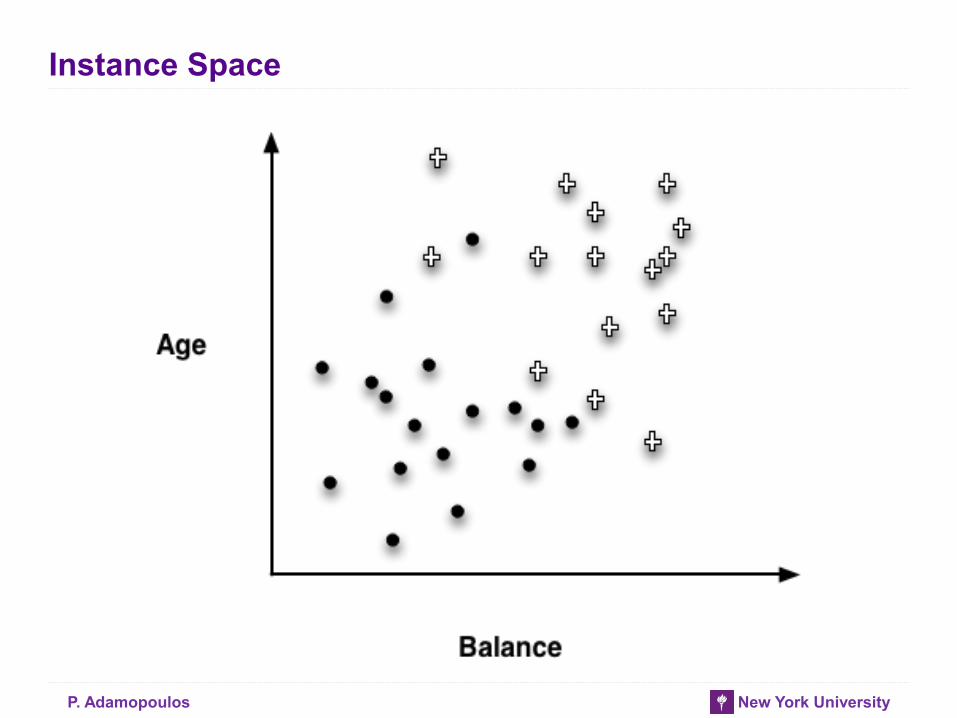
Instance Space

P. Adamopoulos New York University
Linear Classifier

P. Adamopoulos New York University
Example of Classification Function
• Linear discriminant:
𝑐𝑙𝑎𝑠𝑠 𝑥 = + if 1.0 × 𝐴𝑔𝑒 − 1.5 × 𝐵𝑎𝑙𝑎𝑛𝑐𝑒 + 60 > 0 ● if 1.0 × 𝐴𝑔𝑒 − 1.5 × 𝐵𝑎𝑙𝑎𝑛𝑐𝑒 + 60 ≤ 0
• We now have a parameterized model: the weights of the linear
function are the parameters
• The weights are often loosely interpreted as importance indicators
of the features
• A different sort of multivariate supervised segmentation
• The difference from DTs is that the method for taking multiple attributes
into account is to create a mathematical function of them

P. Adamopoulos New York University
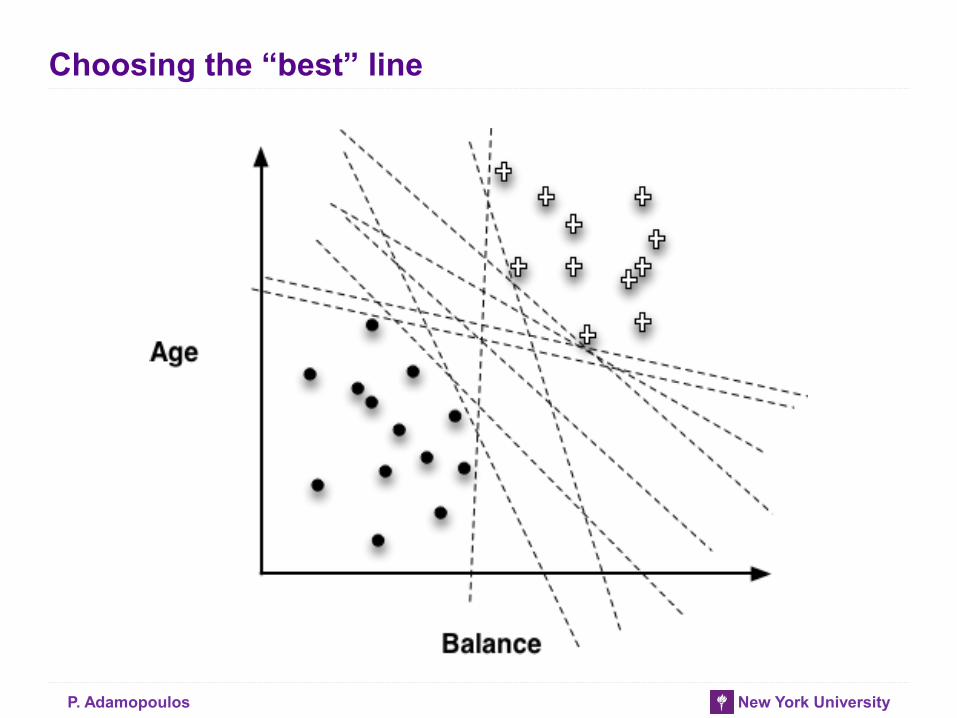
Choosing the “best” line

P. Adamopoulos New York University
Objective Functions
• “Best” line depends on the objective (loss) function
• Objective function should represent our goal
• A loss function determines how much penalty should be assigned to
an instance based on the error in the model’s predicted value
• Examples of objective (or loss) functions:
• 𝜆 𝑦; 𝑥 = 𝑦 − 𝑓(𝑥)
• 𝜆 𝑦; 𝑥 = 𝑦 − 𝑓 𝑥2 [convenient mathematically – linear regression]
• 𝜆 𝑦; 𝑥 = 𝐼 𝑦 ≠ 𝑓(𝑥)
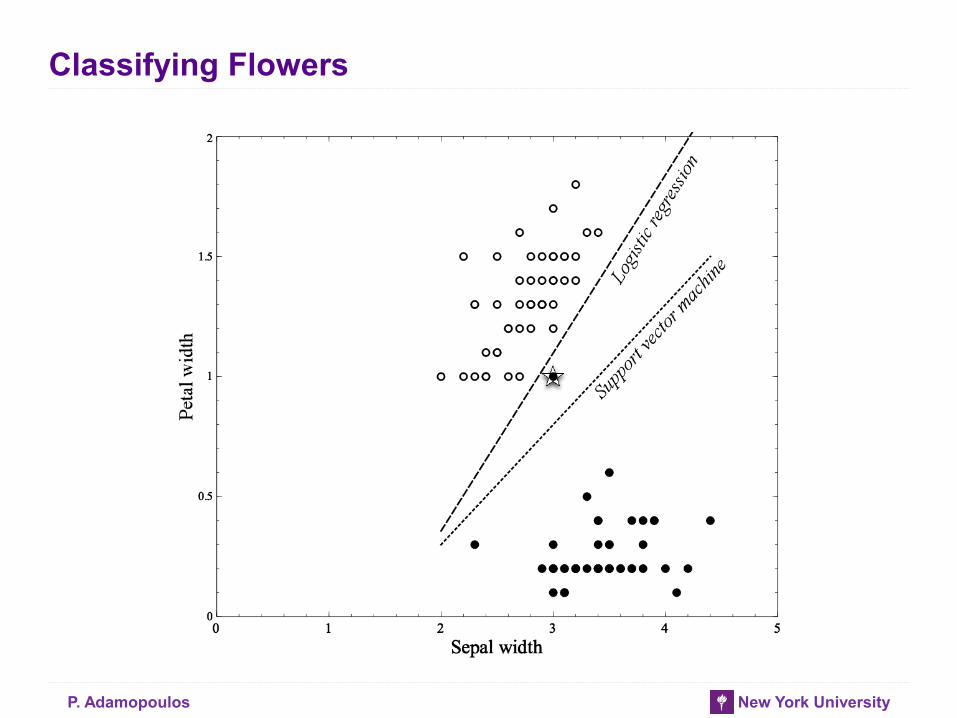
• Linear regression, logistic regression, and support vector
machines are all very similar instances of our basic fundamental
technique:
• The key difference is that each uses a different objective function

P. Adamopoulos New York University
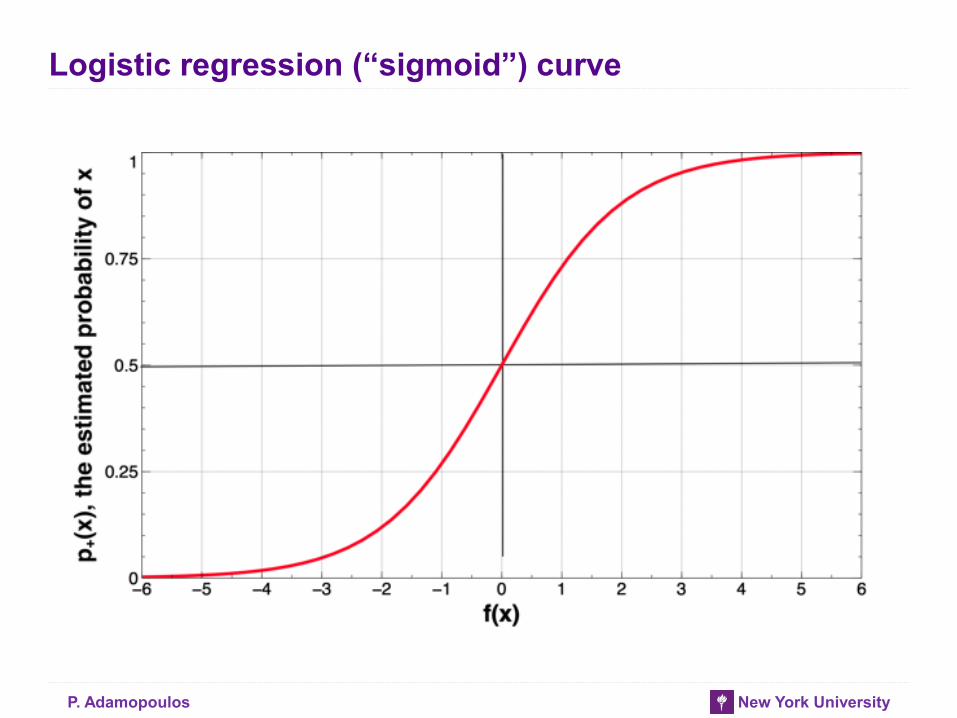
Logistic regression is a misnomer
• The distinction between classification and regression is whether the
value for the target variable is categorical or numeric
• For logistic regression, the model produces a numeric estimate
• However, the values of the target variable in the data are
categorical
• Logistic regression is estimating the probability of class membership
(a numeric quantity) over a categorical class
• Logistic regression is a class probability estimation model and
not a regression model
P. Adamopoulos New York University
Logistic regression (“sigmoid”) curve
P. Adamopoulos New York University
Classifying Flowers
P. Adamopoulos New York University
Choosing the “best” line
P. Adamopoulos New York University
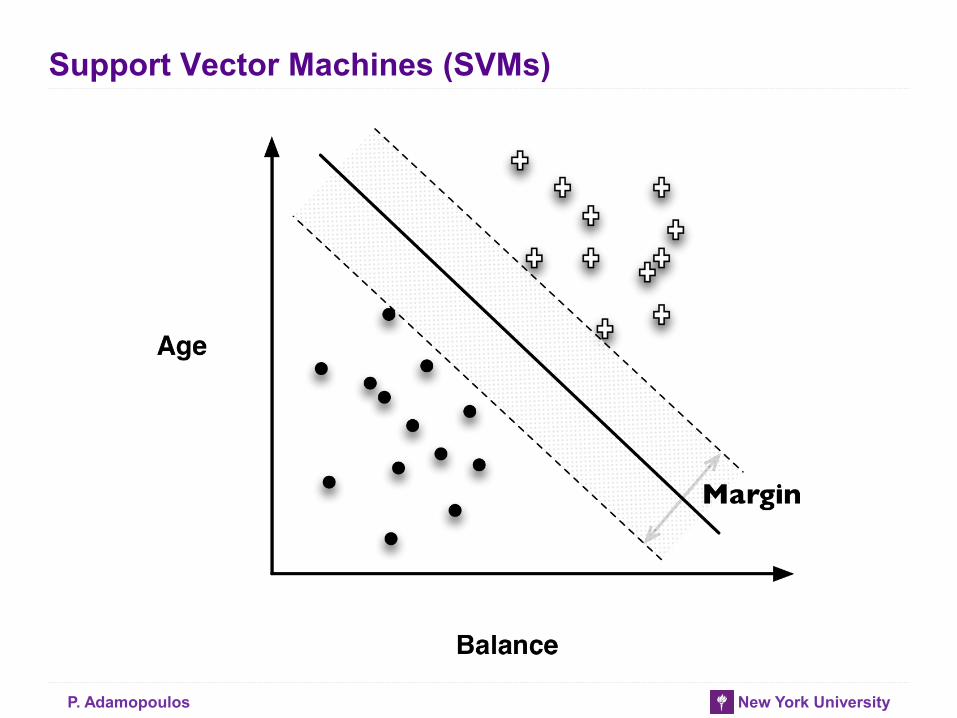
Support Vector Machines (SVMs)

P. Adamopoulos New York University
Support Vector Machines (SVMs)
• Linear Discriminants
• Effective
• Use “hinge loss”
• Also, non-linear SVMs

P. Adamopoulos New York University
Hinge Loss functions
• Support vector machines use hinge loss
• Hinge loss incurs no penalty for an example that is not on the wrong
side of the margin
• The hinge loss only becomes positive when an example is on the
wrong side of the boundary and beyond the margin
• Loss then increases linearly with the example’s distance from the margin
• Penalizes points more the farther they are from the separating boundary

P. Adamopoulos New York University
Loss Functions
• Zero-one loss assigns a loss of zero for a correct decision and one
for an incorrect decision
• Squared error specifies a loss proportional to the square of the
distance from the boundary
• Squared error loss usually is used for numeric value prediction
(regression), rather than classification
• The squaring of the error has the effect of greatly penalizing predictions
that are grossly wrong
P. Adamopoulos New York University
Ranking Instances and Probability Class Estimation
• In many applications, we don’t simply want a yes or no prediction of
whether an instance belongs to the class, but we want some notion
of which examples are more or less likely to belong to the class
• Which consumers are most likely to respond to this offer?
• Which customers are most likely to leave when their contracts expire?
• Ranking
• Tree induction
• Linear discriminant functions (e.g., linear regressions, logistic
regressions, SVMs)
• Ranking is free
• Class Probability Estimation
• Tree induction
• Logistic regression

P. Adamopoulos New York University
The many faces of classification: Classification / Probability Estimation / Ranking
Ranking:
• Business context determines the number of actions (“how far down
the list”)
Probability:
• You can always rank / classify if you have probabilities!
Increasing difficulty
Classification Ranking Probability

P. Adamopoulos New York University
Ranking: Examples
• Search engines
• Whether a document is relevant to a topic / query

P. Adamopoulos New York University
Class Probability Estimation: Examples
• MegaTelCo
• Ranking vs. Class Probability Estimation
• Identify accounts or transactions as likely to have been defrauded
• The director of the fraud control operation may want the analysts to
focus not simply on the cases most likely to be fraud, but on accounts
where the expected monetary loss is higher
• We need to estimate the actual probability of fraud

P. Adamopoulos New York University
Application of Logistic Regression
• The Wisconsin Breast Cancer Dataset

P. Adamopoulos New York University
Wisconsin Breast Cancer dataset
• From each of these basic characteristics, three values were
computed: the mean (_mean), standard error (_SE), and “worst” or
largest

P. Adamopoulos New York University
Wisconsin Breast Cancer dataset
P. Adamopoulos New York University
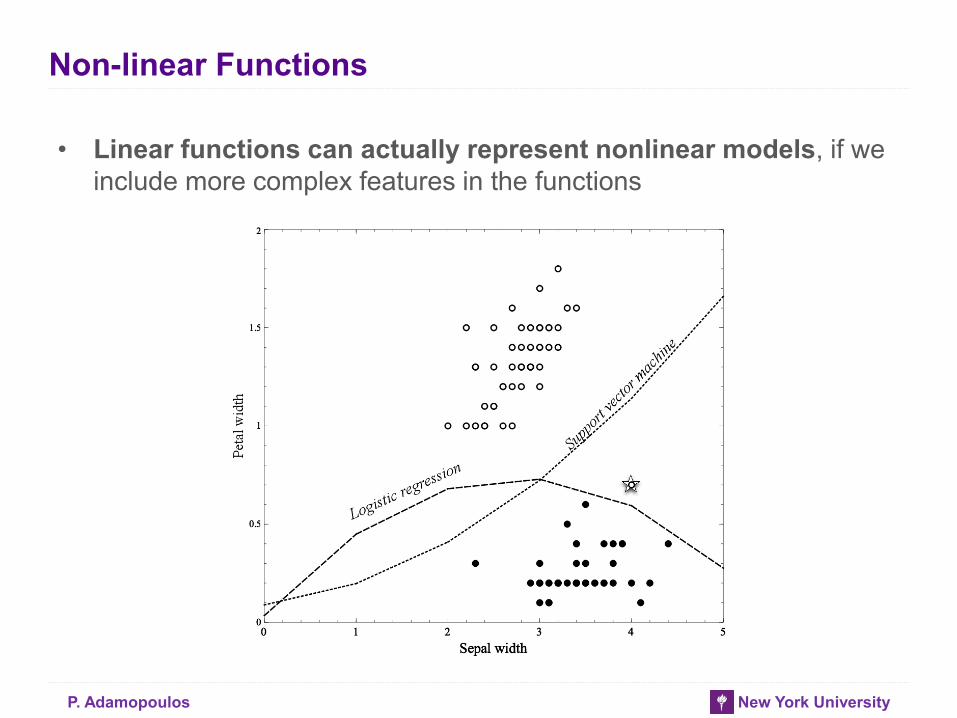
Non-linear Functions
• Linear functions can actually represent nonlinear models, if we
include more complex features in the functions

P. Adamopoulos New York University
Non-linear Functions
• Using “higher order” features is just a “trick”
• Common techniques based on fitting the parameters of complex,
nonlinear functions:
• Non-linear support vector machines and neural networks
• Nonlinear support vector machine with a “polynomial kernel”
consider “higher-order” combinations of the original features
• Squared features, products of features, etc.
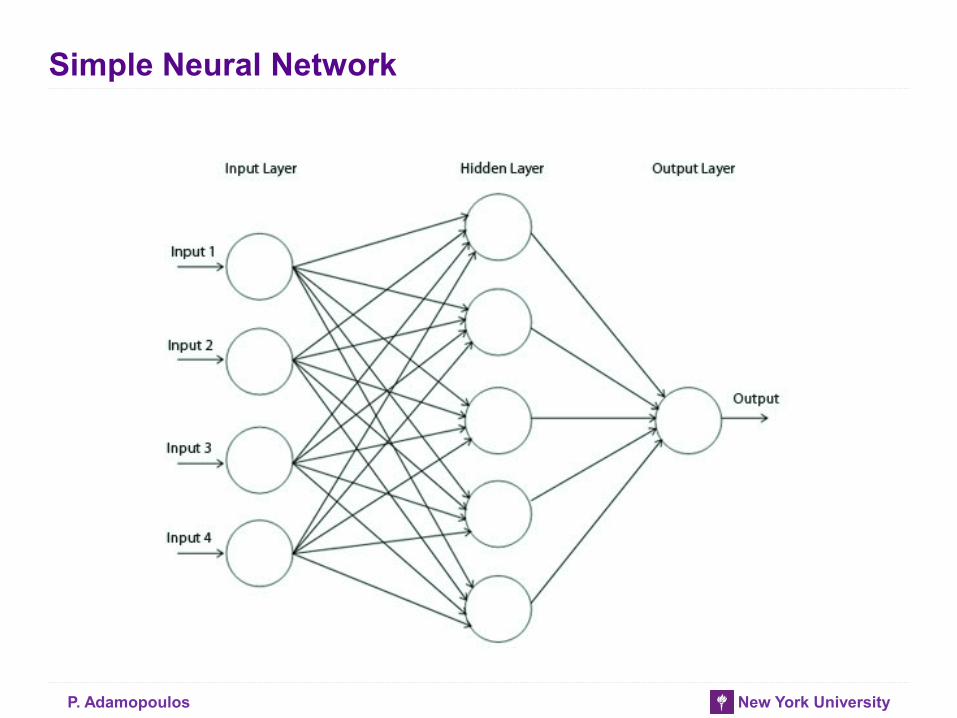
• Think of a neural network as a “stack” of models
• On the bottom of the stack are the original features
• Each layer in the stack applies a simple model to the outputs of the
previous layer
• Might fit data too well (..to be continued)
P. Adamopoulos New York University
Simple Neural Network

P. Adamopoulos New York University
Linear Models versus Tree Induction
• What is more comprehensible to the stakeholders?
• Rules or a numeric function?
• How “smooth” is the underlying phenomenon being modeled?
• Trees need a lot of data to approximate curved boundaries
• How “non-linear” is the underlying phenomenon being modeled?
• If very, much “data engineering” needed to apply linear models
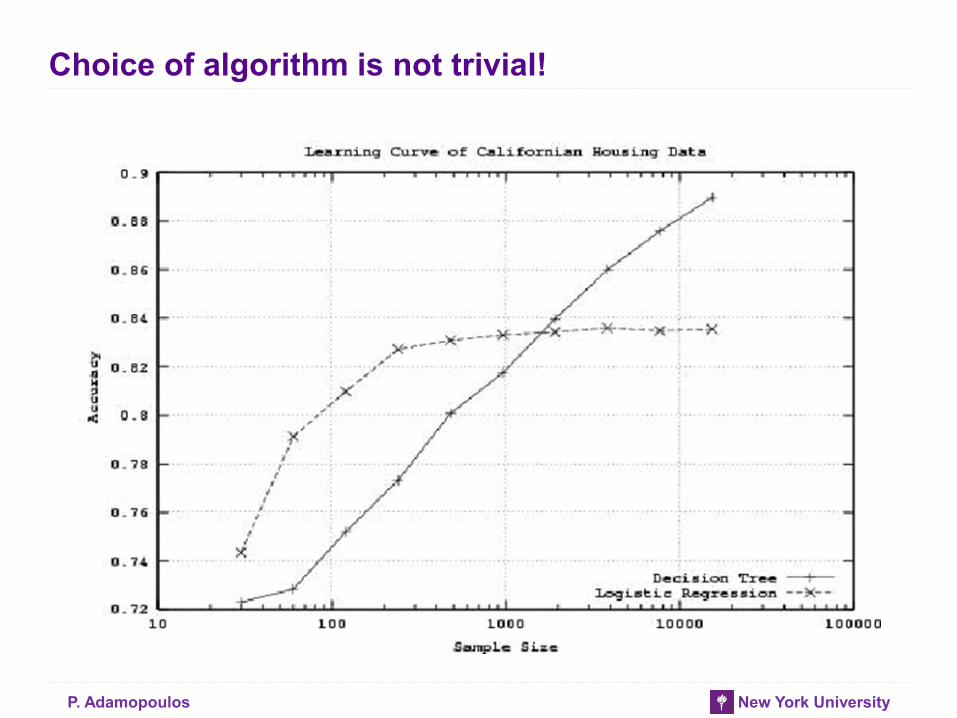
• How much data do you have?!
• There is a key tradeoff between the complexity that can be modeled and
the amount of training data available
• What are the characteristics of the data: missing values, types of
variables, relationships between them, how many are irrelevant, etc.
• Trees fairly robust to these complications

P. Adamopoulos New York University
Data Mining Process
P. Adamopoulos New York University
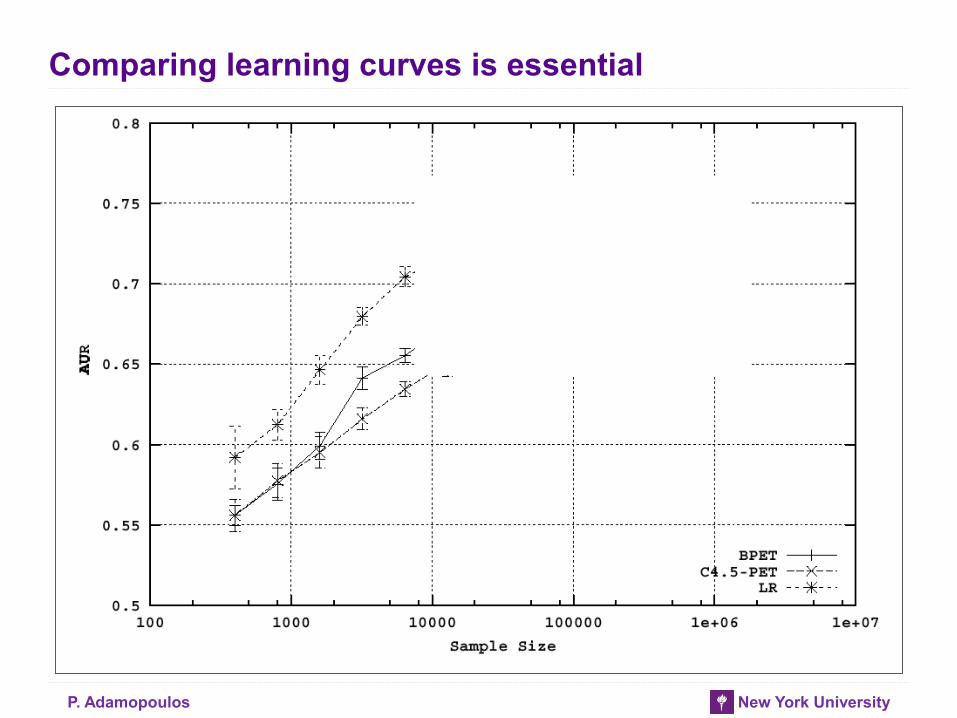
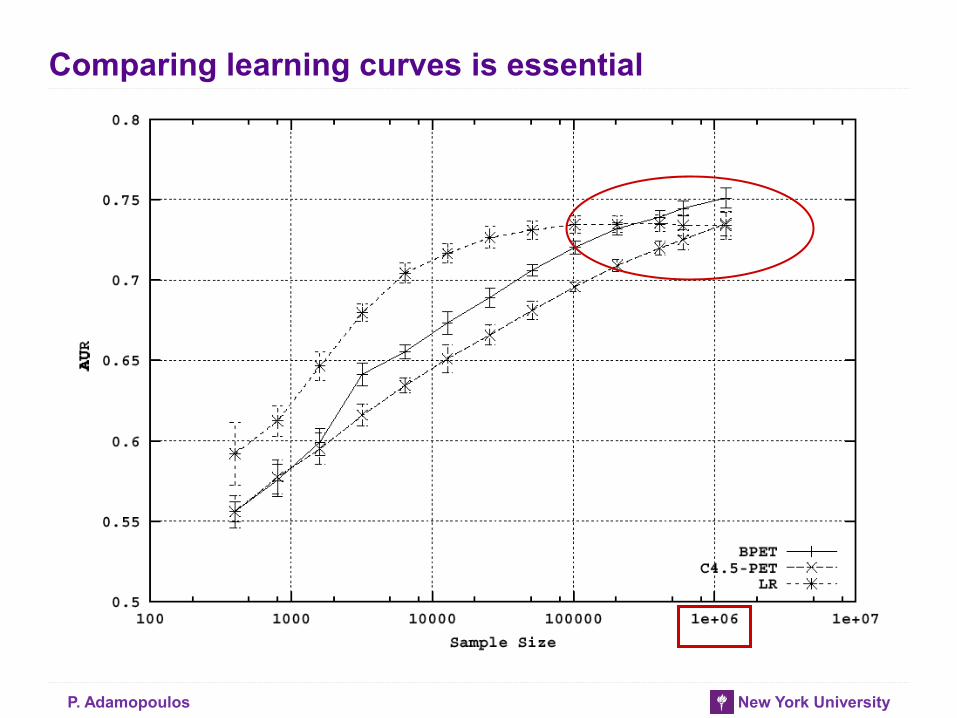
Comparing learning curves is essential
P. Adamopoulos New York University
Comparing learning curves is essential
P. Adamopoulos New York University
Choice of algorithm is not trivial!

P. Adamopoulos New York University
Thanks!

P. Adamopoulos New York University
Questions?