Embed Size (px)
Citation preview
DATA MINING:DATA MINING:Algorithms, Applications and Algorithms, Applications and
BeyondBeyond
Chandan K. ReddyChandan K. Reddy
Department of Computer ScienceDepartment of Computer ScienceWayne State University, Detroit, Wayne State University, Detroit,
MI – 48202.MI – 48202.
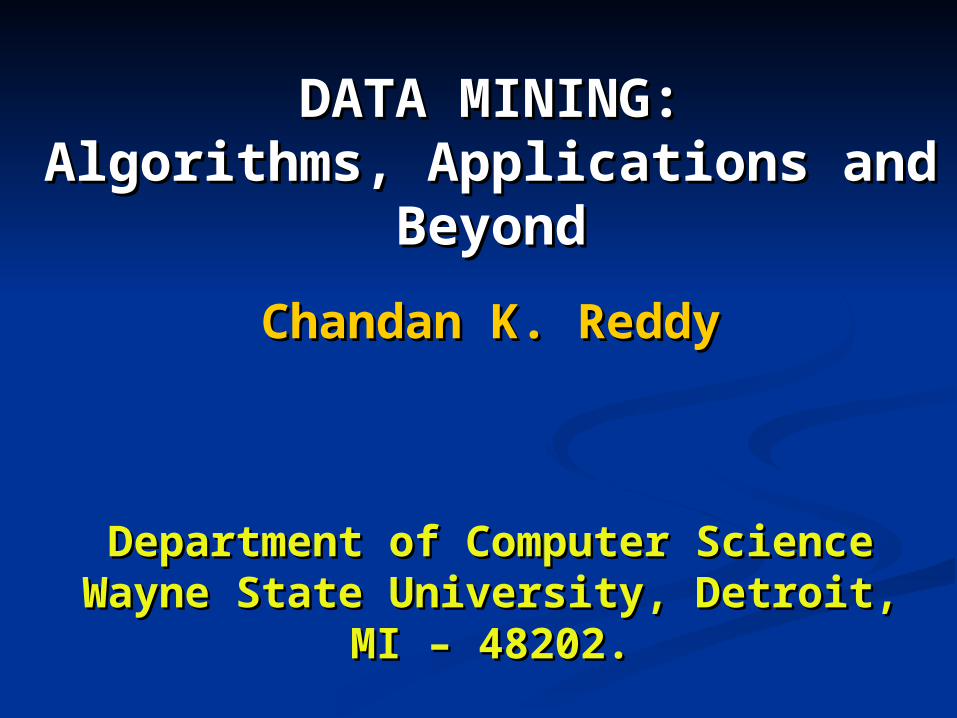
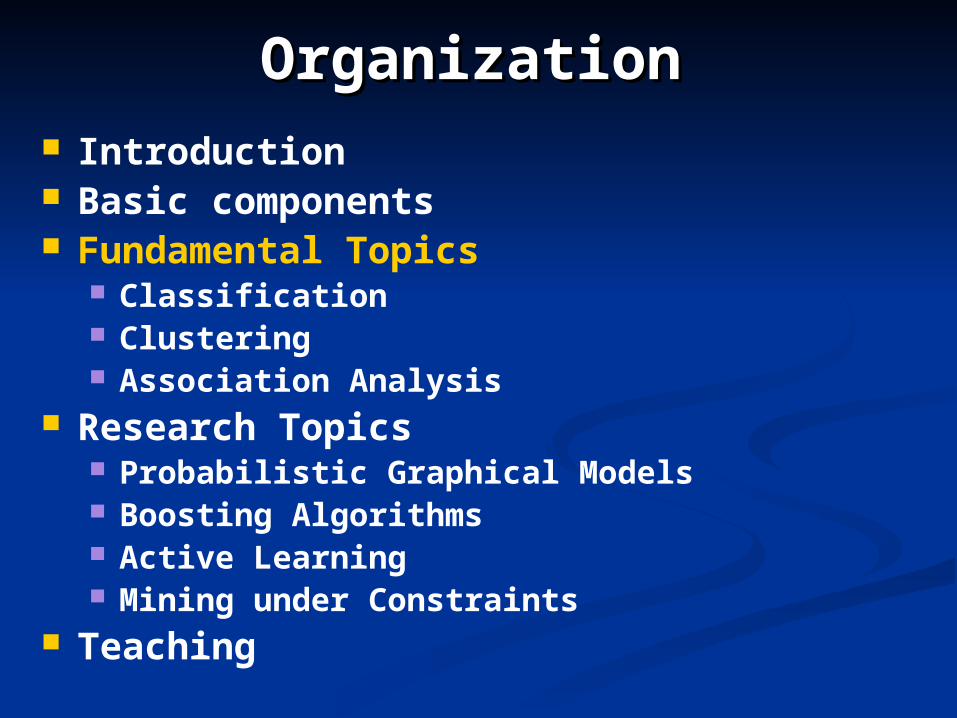
OrganizationOrganization Introduction Basic components Fundamental Topics
Classification Clustering Association Analysis
Research Topics Probabilistic Graphical Models Boosting Algorithms Active Learning Mining under Constraints
Teaching
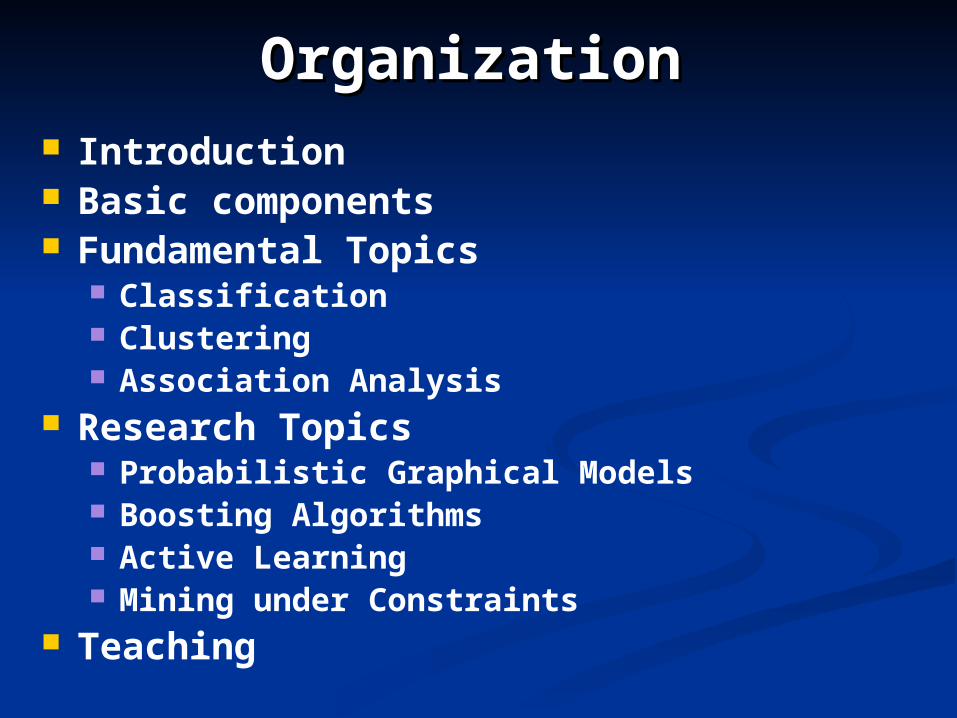
Lots of Data ….Lots of Data ….
Customer TransactionsCustomer Transactions BioinformaticsBioinformatics BankingBanking Internet / WebInternet / Web Biomedical ImagingBiomedical Imaging

So What ?????So What ?????
Computers Computers have become cheaper and have become cheaper and more powerful, so storage is not an more powerful, so storage is not an issueissue
There is often information “There is often information “hiddenhidden” in ” in the data that is not readily evidentthe data that is not readily evident
Human analysts may take weeks to Human analysts may take weeks to discover useful informationdiscover useful information
Much of the data is never analyzed at allMuch of the data is never analyzed at all
We are drowning in We are drowning in data, but starving for data, but starving for
knowledge!!! knowledge!!!

Data Mining is …Data Mining is …
““the nontrivial extraction of the nontrivial extraction of implicitimplicit, , previously unknownpreviously unknown, and , and potentially potentially usefuluseful information from data” information from data”
““the science of extracting useful the science of extracting useful information from large data sets or information from large data sets or databases”databases”
-Wikipedia.org-Wikipedia.org
More appropriate term will be ….More appropriate term will be ….Knowledge Discovery in DatabasesKnowledge Discovery in Databases
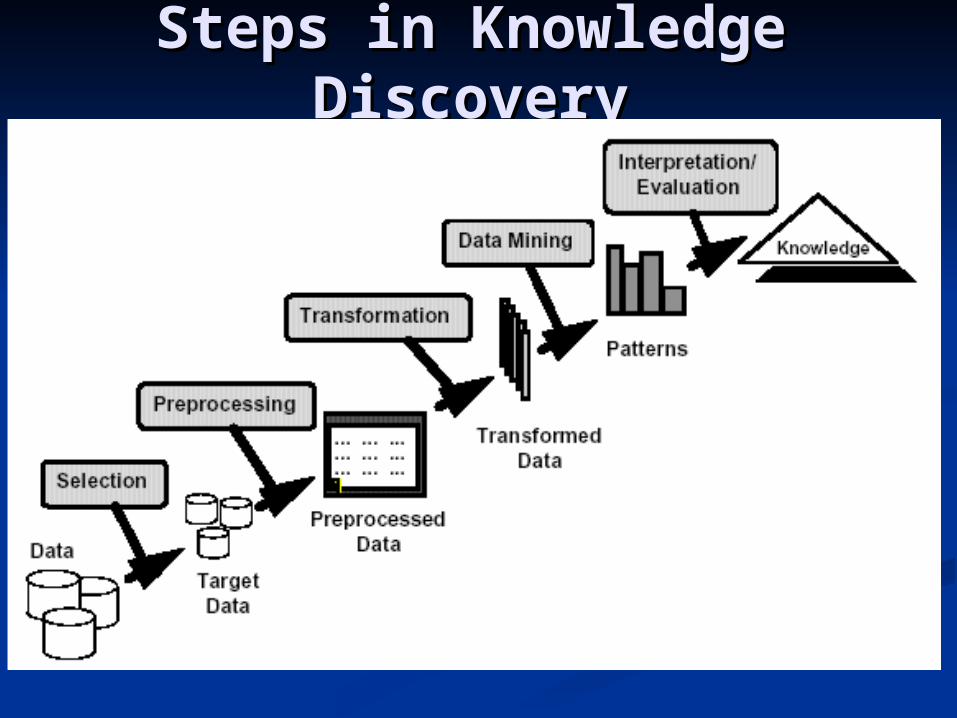
Steps in Knowledge Steps in Knowledge DiscoveryDiscovery
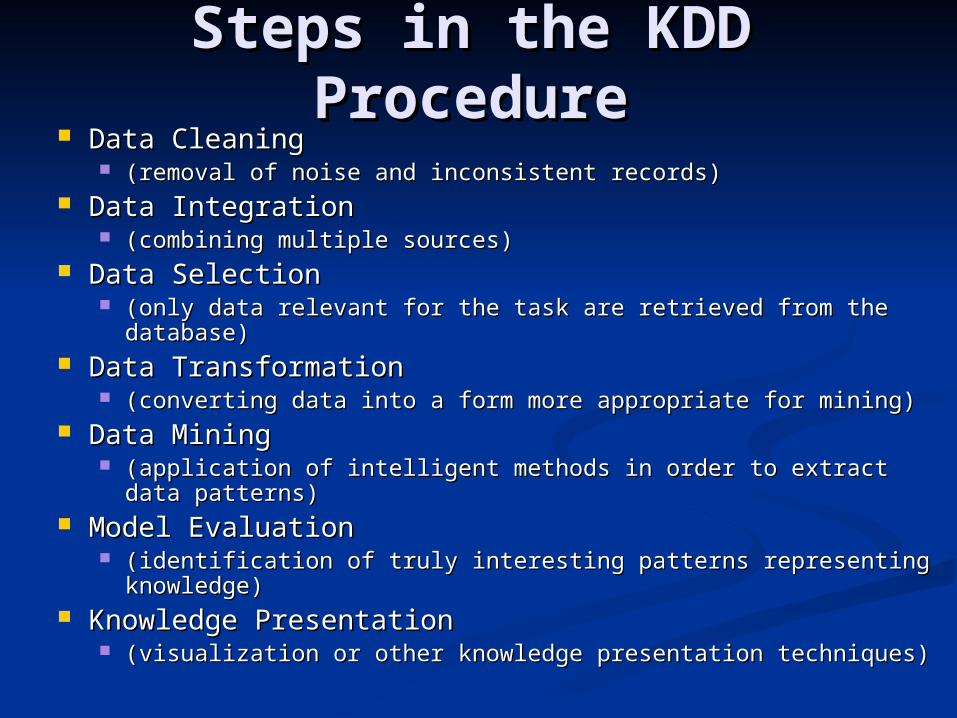
Steps in the KDD Steps in the KDD ProcedureProcedure
Data Cleaning Data Cleaning (removal of noise and inconsistent records)(removal of noise and inconsistent records)
Data Integration Data Integration (combining multiple sources)(combining multiple sources)
Data Selection Data Selection (only data relevant for the task are retrieved from the database)(only data relevant for the task are retrieved from the database)
Data Transformation Data Transformation (converting data into a form more appropriate for mining)(converting data into a form more appropriate for mining)
Data Mining Data Mining (application of intelligent methods in order to extract data (application of intelligent methods in order to extract data
patterns)patterns) Model Evaluation Model Evaluation
(identification of truly interesting patterns representing (identification of truly interesting patterns representing knowledge)knowledge)
Knowledge Presentation Knowledge Presentation (visualization or other knowledge presentation techniques)(visualization or other knowledge presentation techniques)
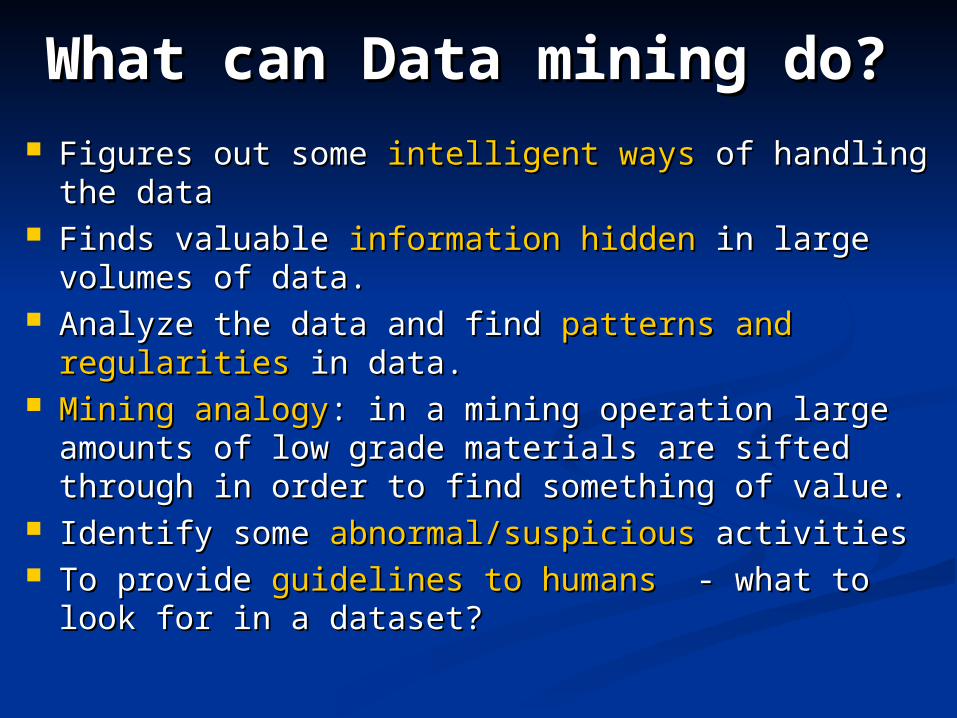
What can Data mining do?What can Data mining do? Figures out some Figures out some intelligent waysintelligent ways of handling of handling
the datathe data Finds valuable Finds valuable information hiddeninformation hidden in large in large
volumes of data. volumes of data. Analyze the data and find Analyze the data and find patterns and patterns and
regularitiesregularities in data. in data. Mining analogyMining analogy: in a mining operation large : in a mining operation large
amounts of low grade materials are sifted amounts of low grade materials are sifted through in order to find something of value. through in order to find something of value.
Identify some Identify some abnormal/suspiciousabnormal/suspicious activities activities To provide To provide guidelines to humansguidelines to humans - what to look - what to look
for in a dataset?for in a dataset?
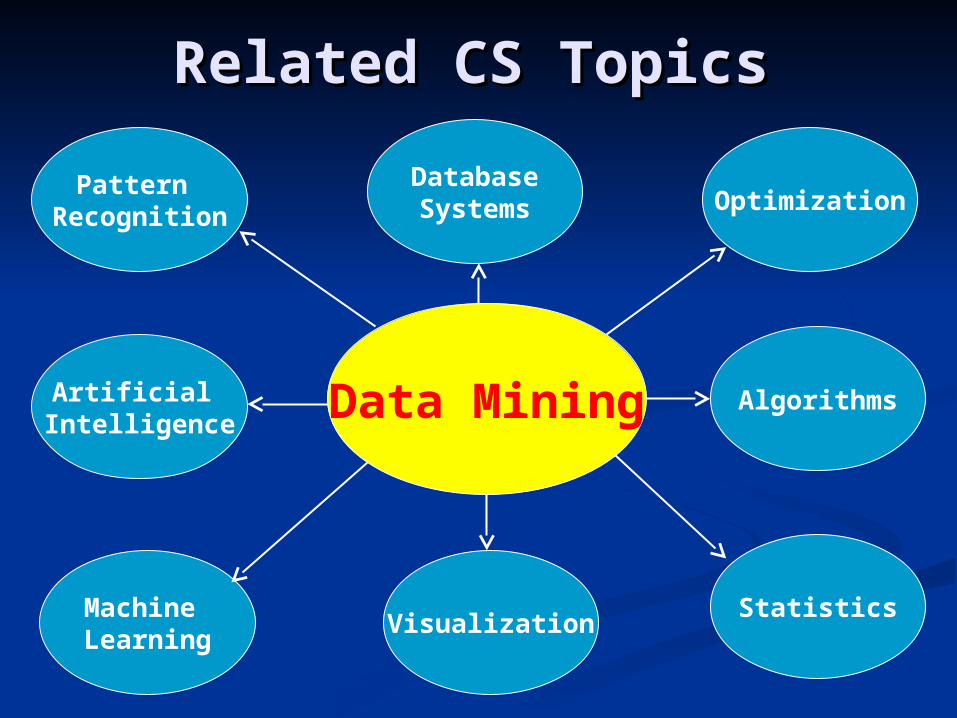
Related CS TopicsRelated CS Topics
Data Mining
Optimization
StatisticsVisualization
Machine Learning
Pattern Recognition
DatabaseSystems
Artificial Intelligence
Algorithms
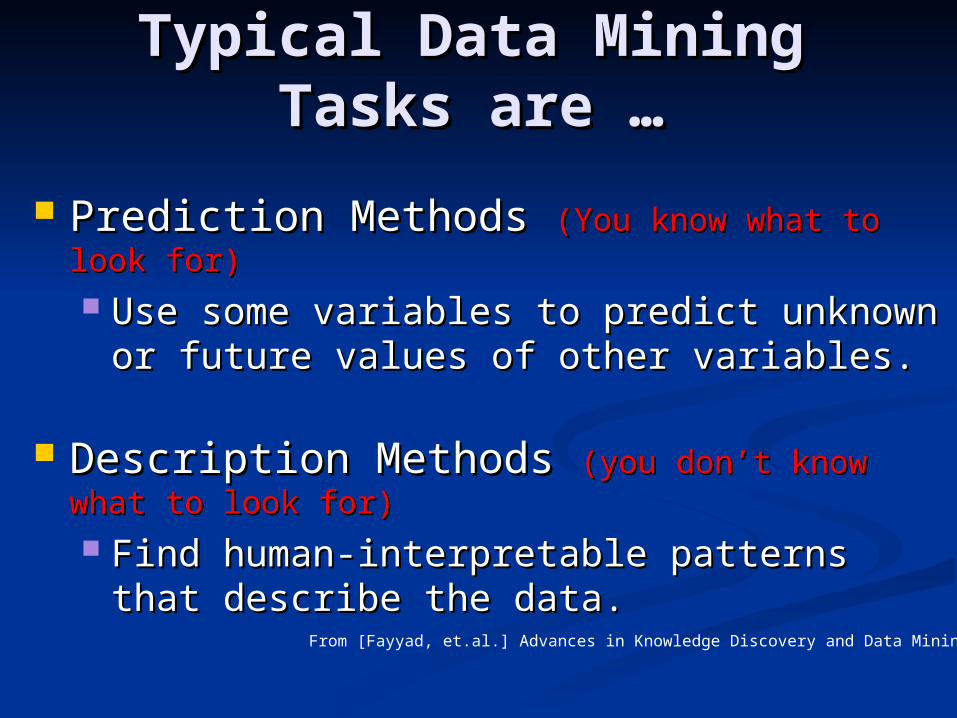
Typical Data Mining Typical Data Mining Tasks are …Tasks are …
Prediction Methods Prediction Methods (You know what to look (You know what to look for)for) Use some variables to predict unknown or Use some variables to predict unknown or
future values of other variables.future values of other variables.
Description Methods Description Methods (you don’t know what to (you don’t know what to look for)look for) Find human-interpretable patterns that Find human-interpretable patterns that
describe the data.describe the data.From [Fayyad, et.al.] Advances in Knowledge Discovery and Data Mining, 1996
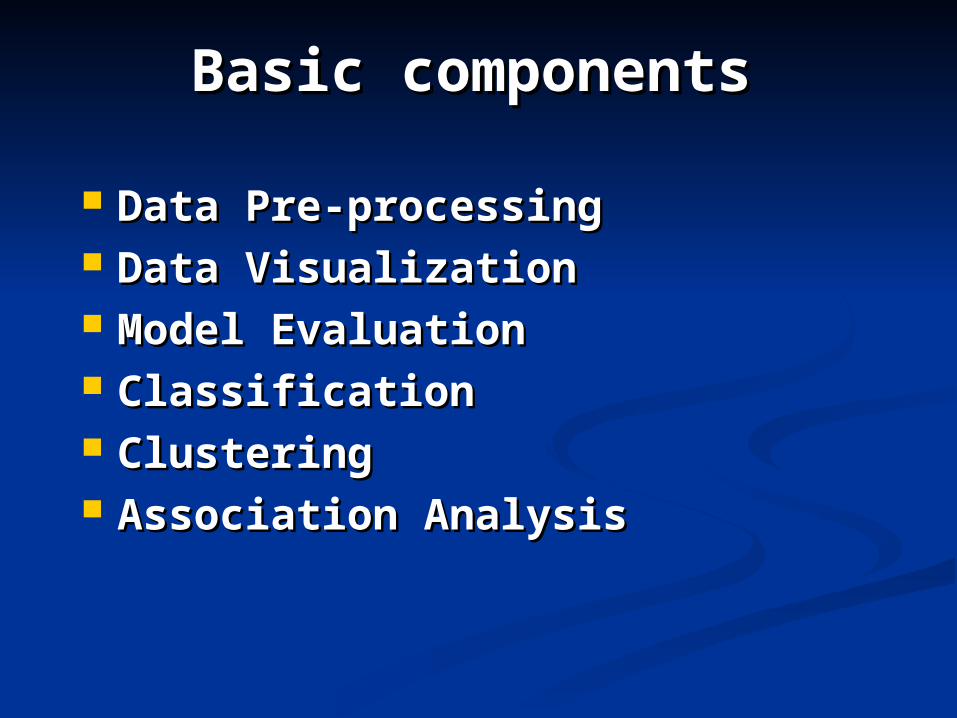
Basic componentsBasic components
Data Pre-processingData Pre-processing Data VisualizationData Visualization Model EvaluationModel Evaluation ClassificationClassification ClusteringClustering Association AnalysisAssociation Analysis
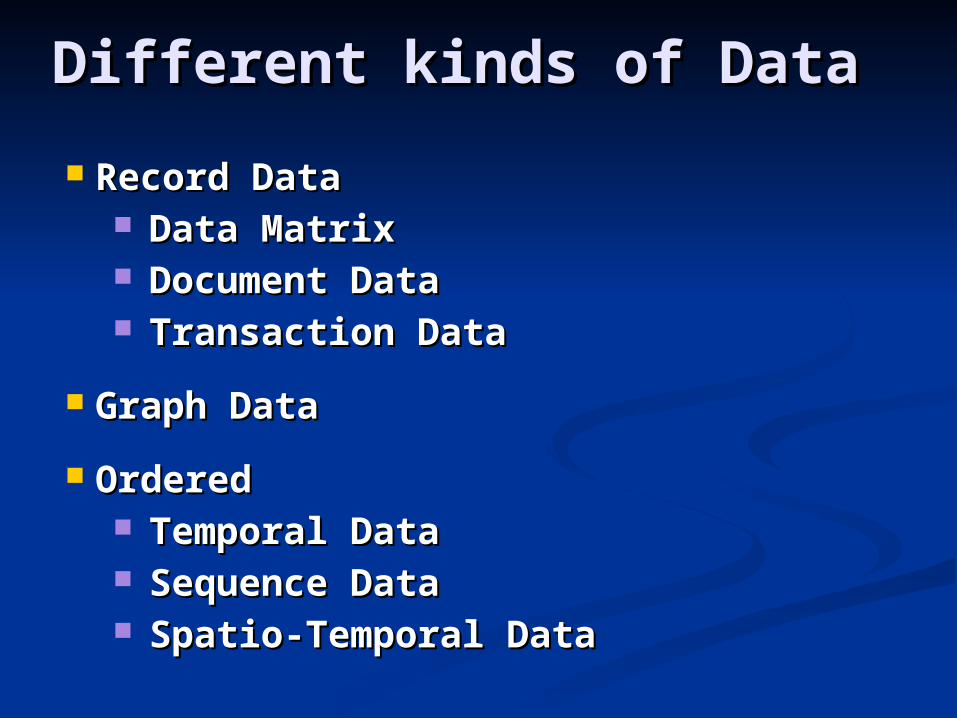
Different kinds of Data Different kinds of Data
Record DataRecord Data Data MatrixData Matrix Document DataDocument Data Transaction DataTransaction Data
Graph DataGraph Data
OrderedOrdered Temporal DataTemporal Data Sequence DataSequence Data Spatio-Temporal DataSpatio-Temporal Data
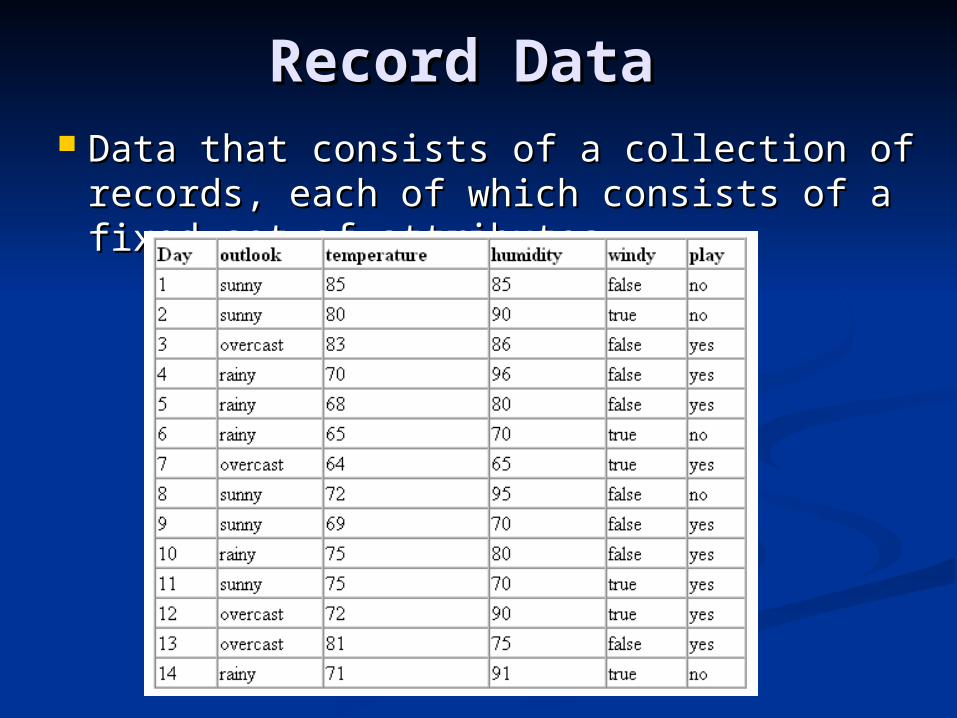
Record Data Record Data Data that consists of a collection of Data that consists of a collection of
records, each of which consists of a fixed records, each of which consists of a fixed set of attributes set of attributes
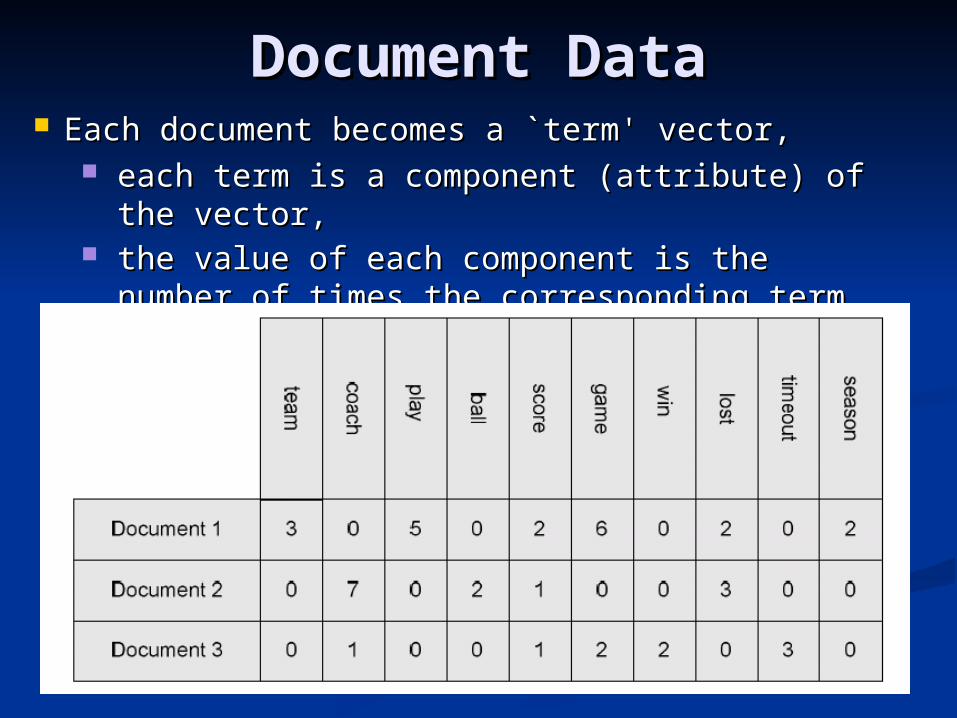
Document DataDocument Data Each document becomes a `term' vector, Each document becomes a `term' vector,
each term is a component (attribute) of the each term is a component (attribute) of the vector,vector,
the value of each component is the number of the value of each component is the number of times the corresponding term occurs in the times the corresponding term occurs in the document.document.
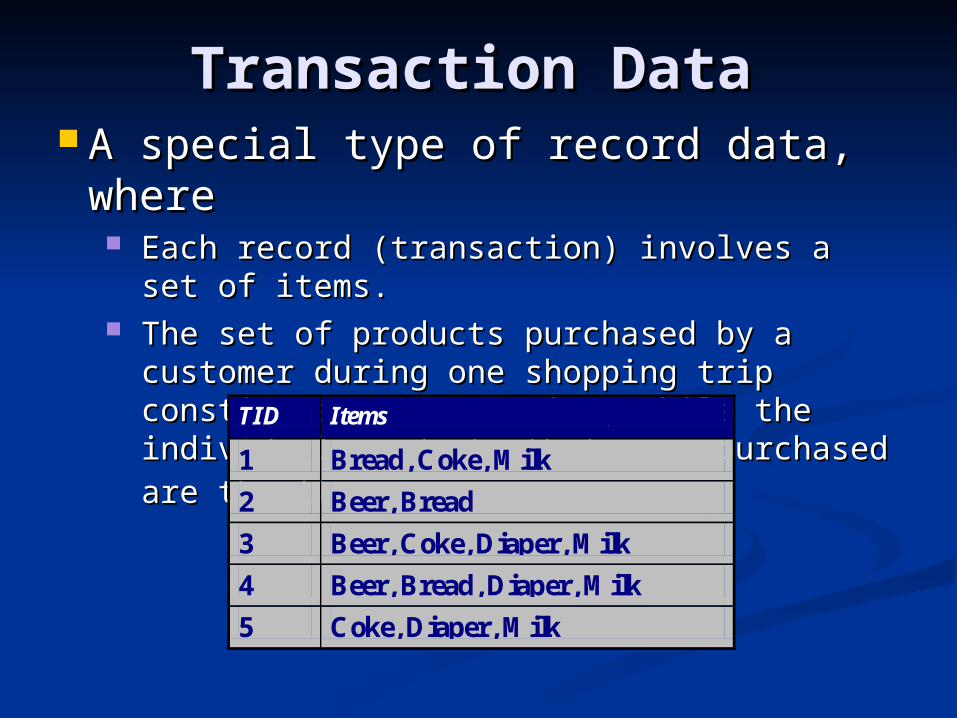
Transaction DataTransaction Data A special type of record data, where A special type of record data, where
Each record (transaction) involves a set of Each record (transaction) involves a set of items. items.
The set of products purchased by a customer The set of products purchased by a customer during one shopping trip constitute a during one shopping trip constitute a transaction, while the individual products that transaction, while the individual products that were purchased are the items.were purchased are the items. TID Items
1 Bread, Coke, Milk
2 Beer, Bread
3 Beer, Coke, Diaper, Milk
4 Beer, Bread, Diaper, Milk
5 Coke, Diaper, Milk
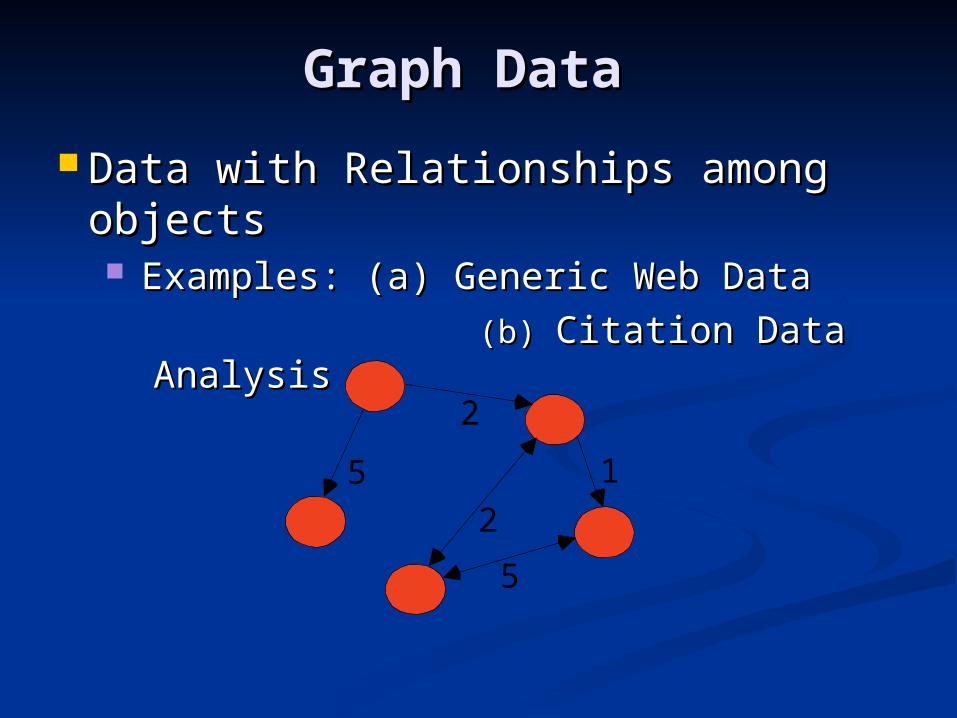
Graph Data Graph Data
Data with Relationships among Data with Relationships among objectsobjects Examples: (a) Generic Web Data Examples: (a) Generic Web Data
(b) (b) Citation DataCitation Data AnalysisAnalysis
5
2
1
2
5
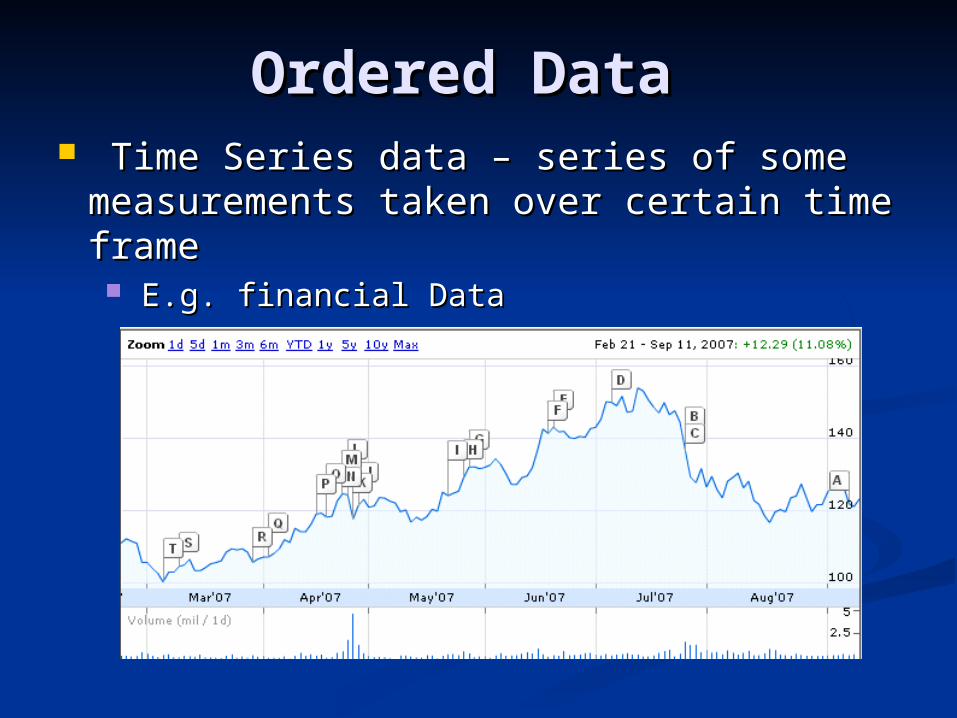
Ordered Data Ordered Data Time Series data – series of some Time Series data – series of some
measurements taken over certain time framemeasurements taken over certain time frame E.g. financial DataE.g. financial Data
Ordered Data Ordered Data
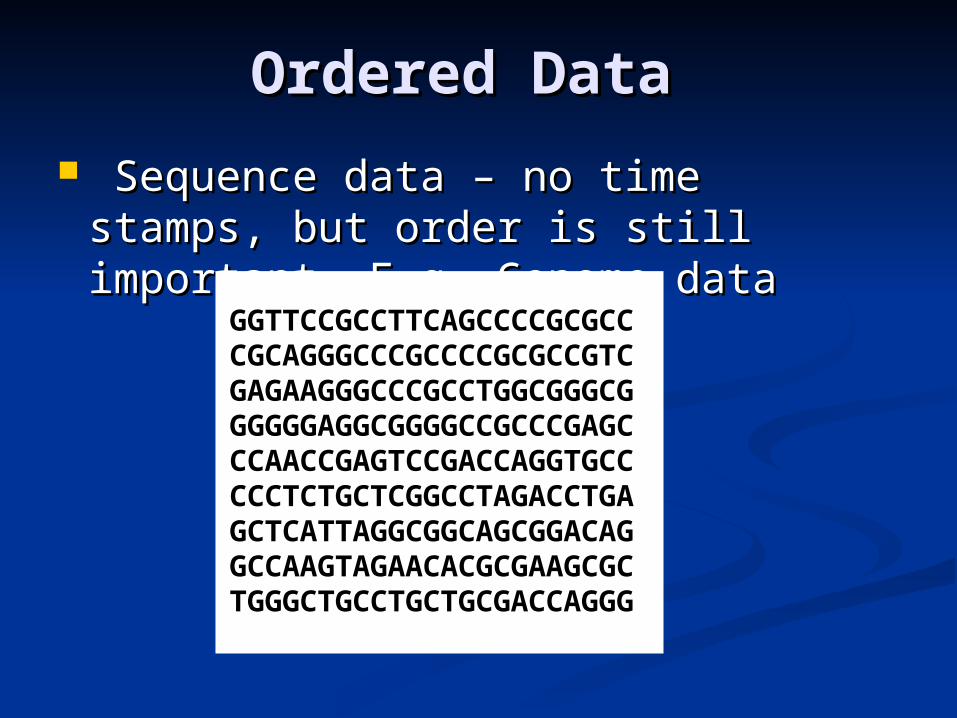
Sequence data – no time stamps, but Sequence data – no time stamps, but order is still important. E.g. Genome order is still important. E.g. Genome datadata
GGTTCCGCCTTCAGCCCCGCGCCCGCAGGGCCCGCCCCGCGCCGTCGAGAAGGGCCCGCCTGGCGGGCGGGGGGAGGCGGGGCCGCCCGAGCCCAACCGAGTCCGACCAGGTGCCCCCTCTGCTCGGCCTAGACCTGAGCTCATTAGGCGGCAGCGGACAGGCCAAGTAGAACACGCGAAGCGCTGGGCTGCCTGCTGCGACCAGGG
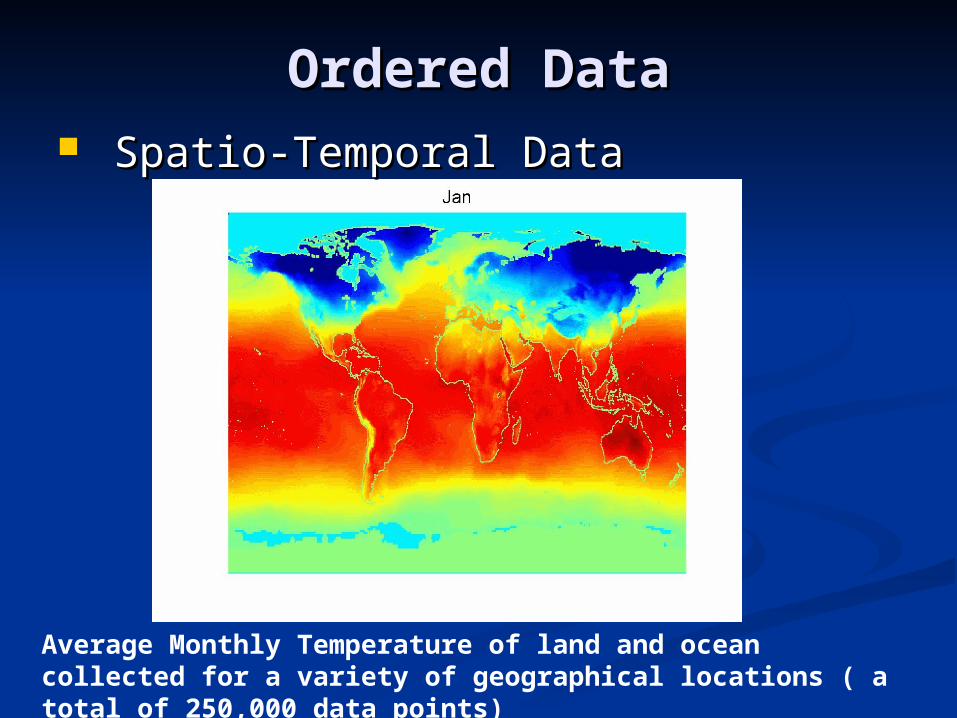
Ordered DataOrdered Data Spatio-Temporal DataSpatio-Temporal Data
Average Monthly Temperature of land and ocean collected for a variety of geographical locations ( a total of 250,000 data points)
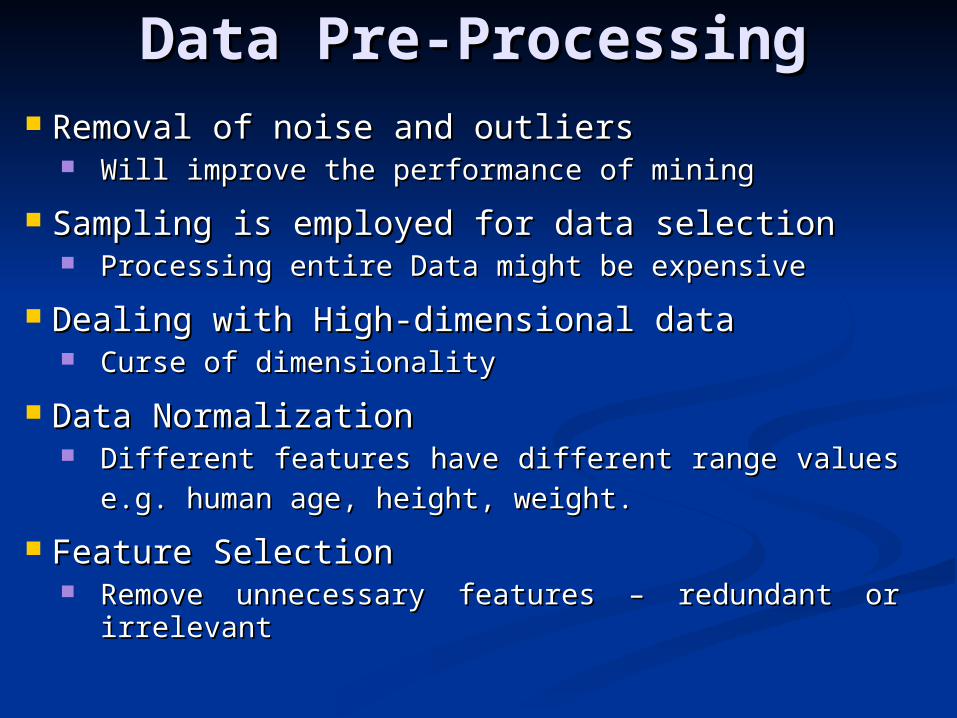
Data Pre-ProcessingData Pre-Processing Removal of noise and outliersRemoval of noise and outliers
Will improve the performance of miningWill improve the performance of mining
Sampling is employed for data selectionSampling is employed for data selection Processing entire Data might be expensiveProcessing entire Data might be expensive
Dealing with High-dimensional dataDealing with High-dimensional data Curse of dimensionality Curse of dimensionality
Data NormalizationData Normalization Different features have different range values Different features have different range values
e.g. human age, height, weight.e.g. human age, height, weight.
Feature SelectionFeature Selection Remove unnecessary features – redundant or irrelevant Remove unnecessary features – redundant or irrelevant
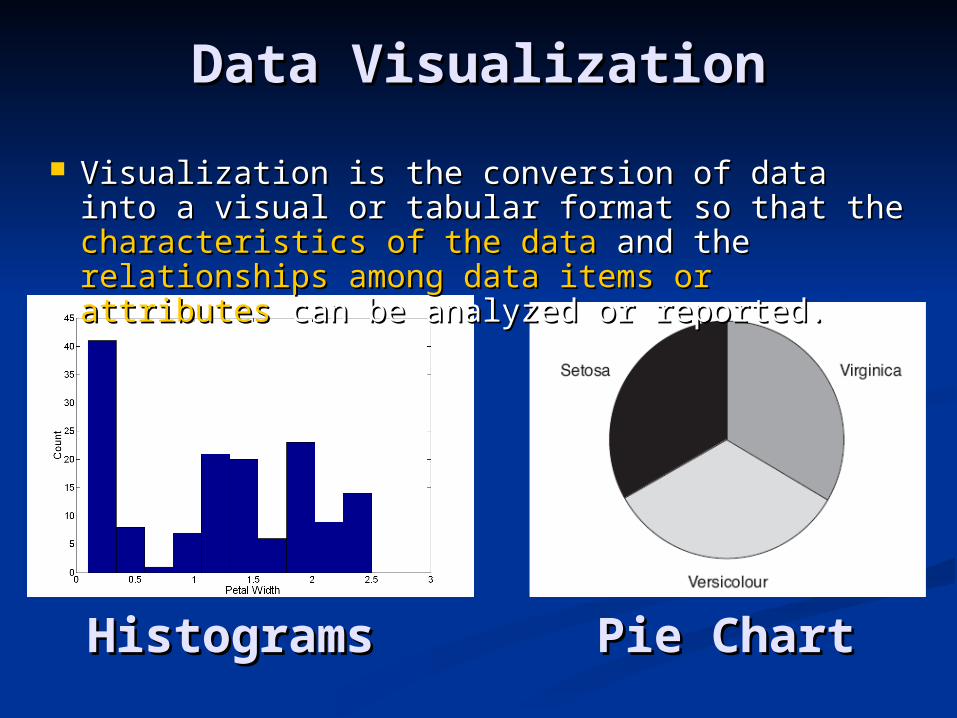
Data VisualizationData Visualization
HistogramsHistograms Pie ChartPie Chart
Visualization is the conversion of data into a visual Visualization is the conversion of data into a visual or tabular format so that the or tabular format so that the characteristics of the characteristics of the datadata and the and the relationships among data itemsrelationships among data items or or attributesattributes can be analyzed or reported. can be analyzed or reported.
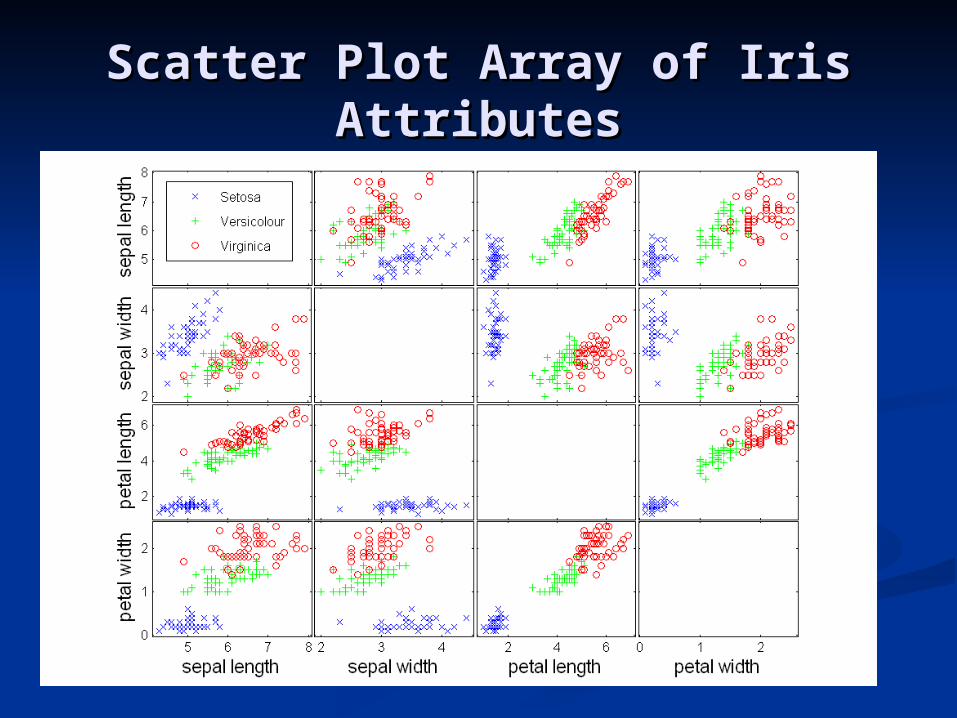
Scatter Plot Array of Iris Scatter Plot Array of Iris AttributesAttributes
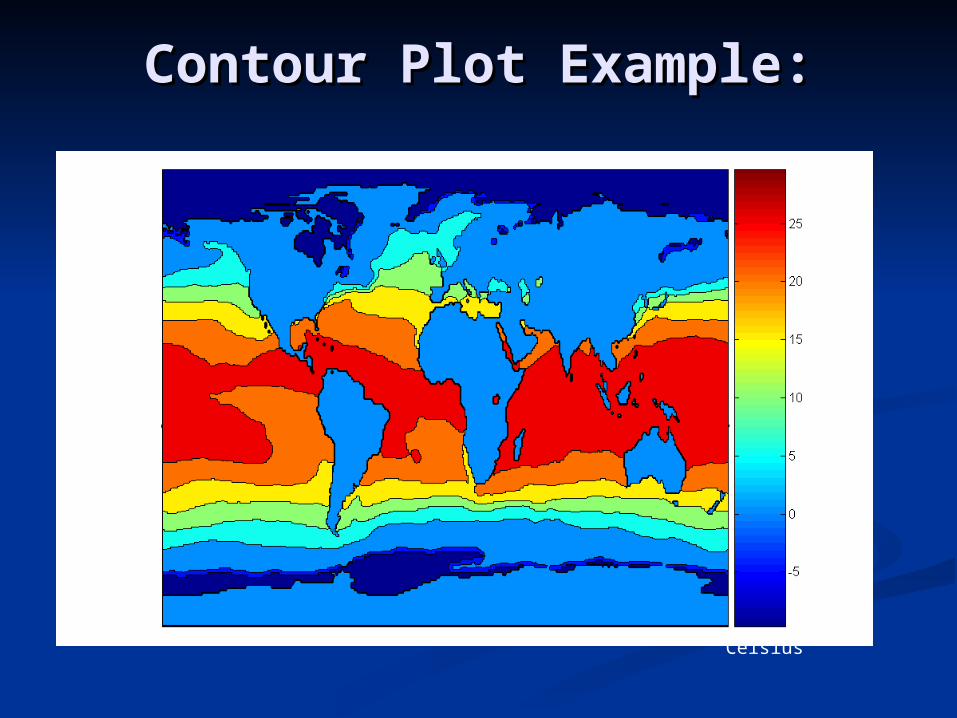
Contour Plot Example:Contour Plot Example:
Celsius
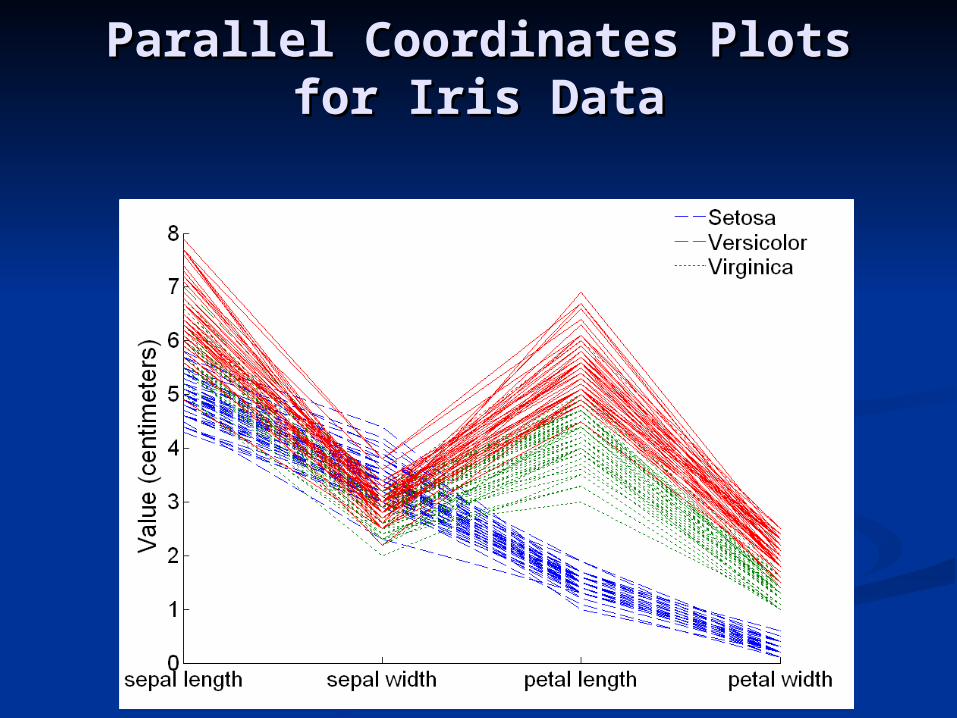
Parallel Coordinates Plots for Parallel Coordinates Plots for Iris DataIris Data
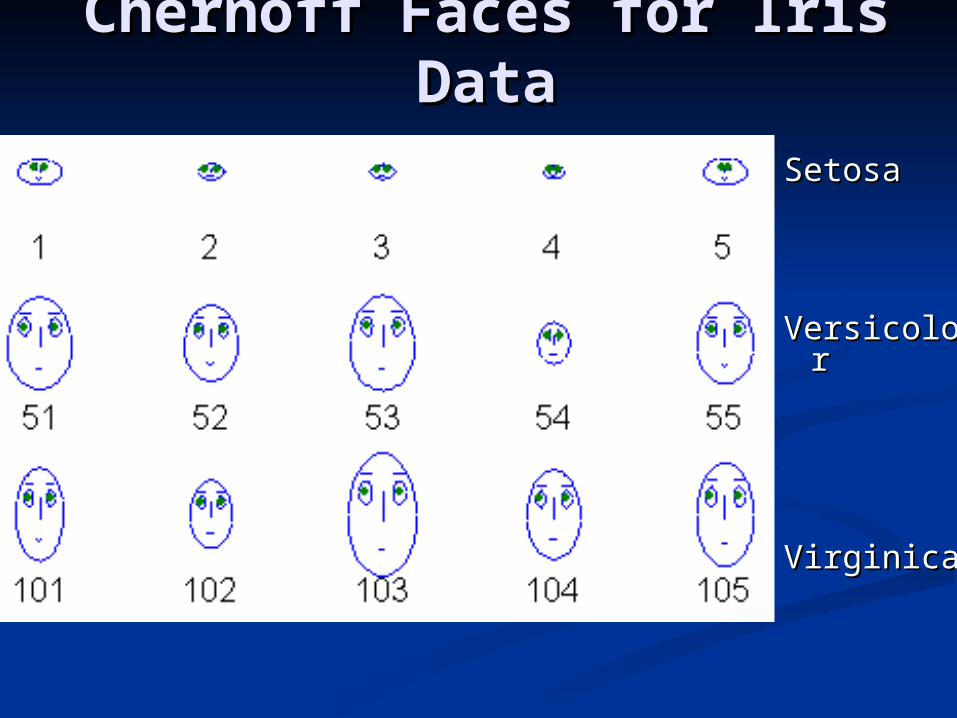
Chernoff Faces for Iris DataChernoff Faces for Iris Data
SetosaSetosa
VersicolouVersicolourr
VirginicaVirginica
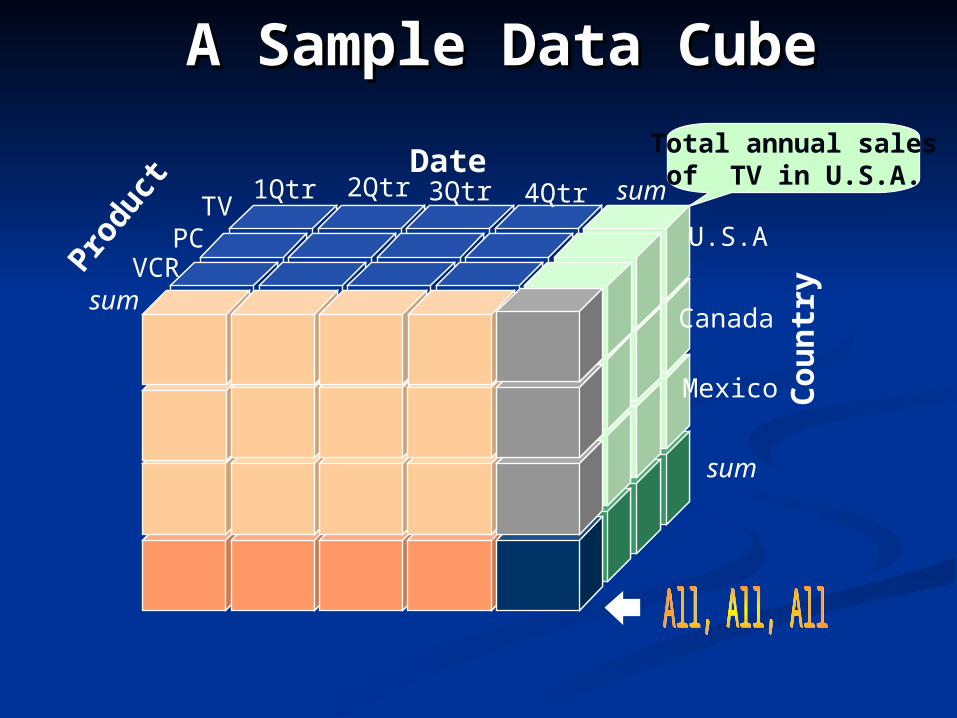
A Sample Data CubeA Sample Data Cube
Total annual salesof TV in U.S.A.Date
Produ
ct
Cou
ntr
ysum
sum TV
VCRPC
1Qtr 2Qtr 3Qtr 4Qtr
U.S.A
Canada
Mexico
sum
OrganizationOrganization Introduction Basic components Fundamental Topics
Classification Clustering Association Analysis
Research Topics Probabilistic Graphical Models Boosting Algorithms Active Learning Mining under Constraints
Teaching
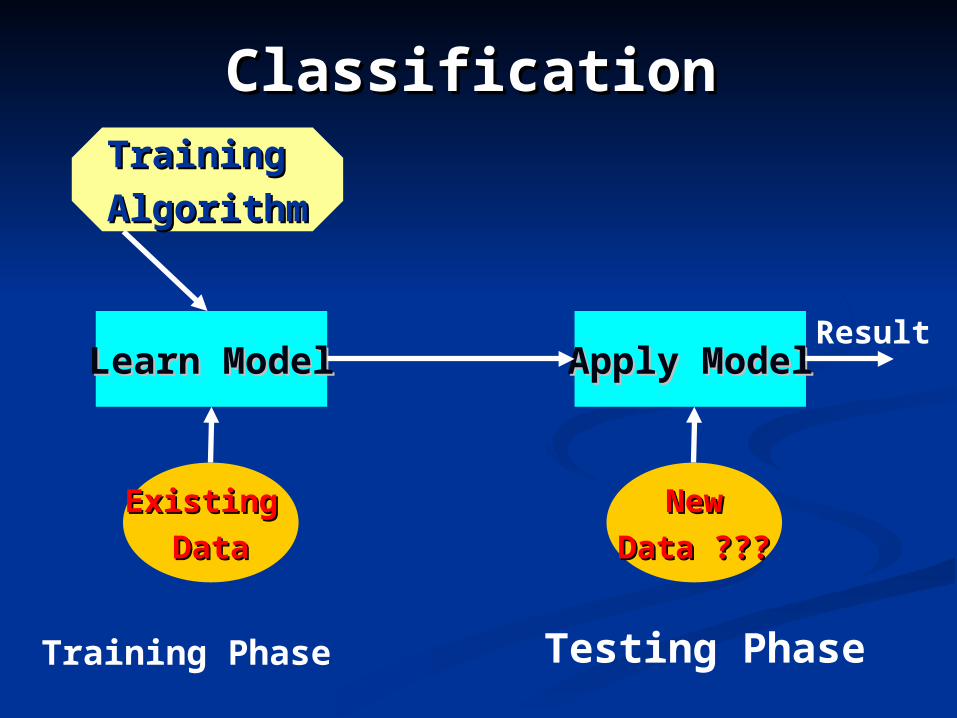
ClassificationClassification
Existing Existing
DataDataNewNew
Data ???Data ???
Learn ModelLearn Model Apply ModelApply Model
Training Training
AlgorithmAlgorithm
Training Phase Testing Phase
Result

Classification modelsClassification models
OutlookOutlook
HumidityHumidity WindyWindy
NoNo YesYes
YesYes
YesYesNoNo
SunnySunny
OvercastOvercast
RainyRainy
TrueTrue FalseFalseHighHigh NormalNormal
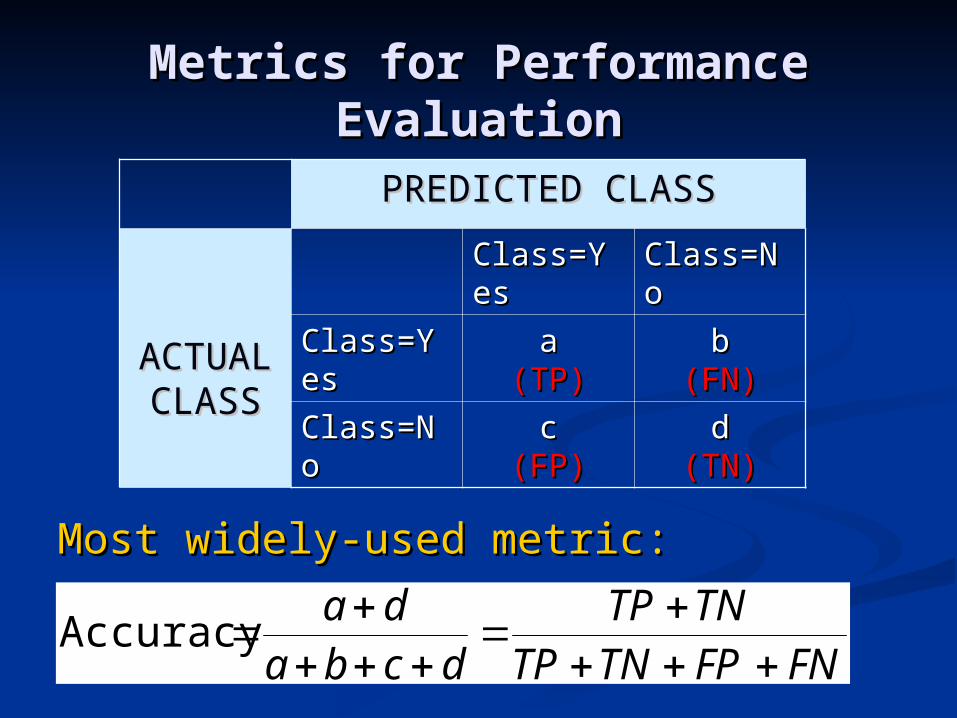
Metrics for Performance Metrics for Performance EvaluationEvaluation
Most widely-used metric:Most widely-used metric:
PREDICTED CLASSPREDICTED CLASS
ACTUAACTUALL
CLASSCLASS
Class=YClass=Yeses
Class=NClass=Noo
Class=YClass=Yeses
aa(TP)(TP)
bb(FN)(FN)
Class=NClass=Noo
cc(FP)(FP)
dd(TN)(TN)
FNFPTNTPTNTP
dcbada
Accuracy
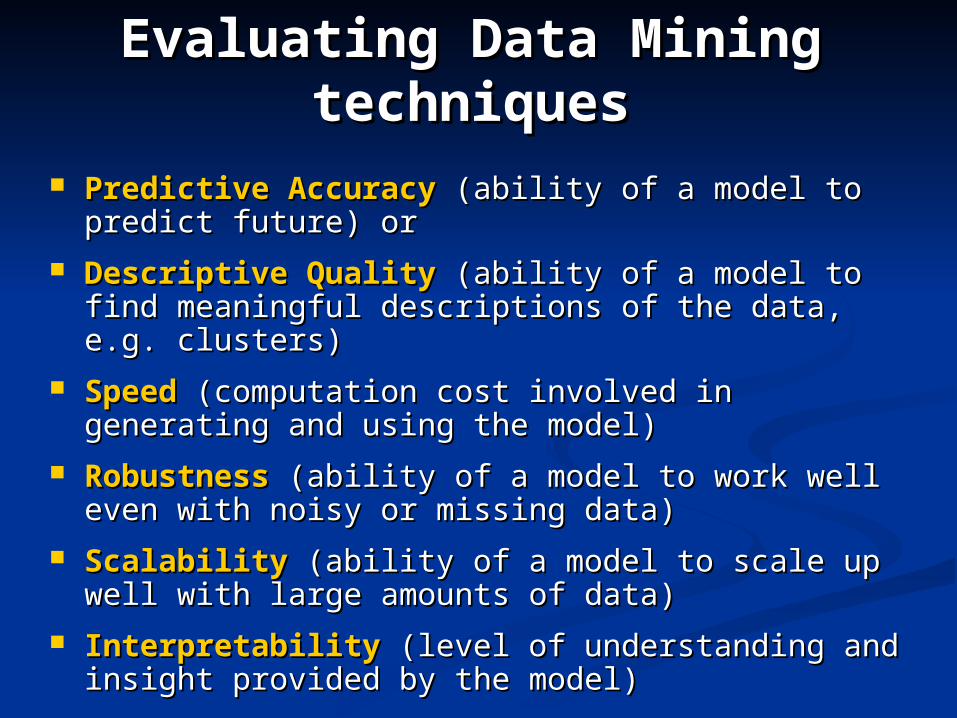
Evaluating Data Mining Evaluating Data Mining techniquestechniques
Predictive AccuracyPredictive Accuracy (ability of a model to (ability of a model to predict future) or predict future) or
Descriptive QualityDescriptive Quality (ability of a model to find (ability of a model to find meaningful descriptions of the data, e.g. clusters)meaningful descriptions of the data, e.g. clusters)
SpeedSpeed (computation cost involved in generating (computation cost involved in generating and using the model)and using the model)
RobustnessRobustness (ability of a model to work well even (ability of a model to work well even with noisy or missing data)with noisy or missing data)
ScalabilityScalability (ability of a model to scale up well (ability of a model to scale up well with large amounts of data)with large amounts of data)
InterpretabilityInterpretability (level of understanding and (level of understanding and insight provided by the model)insight provided by the model)
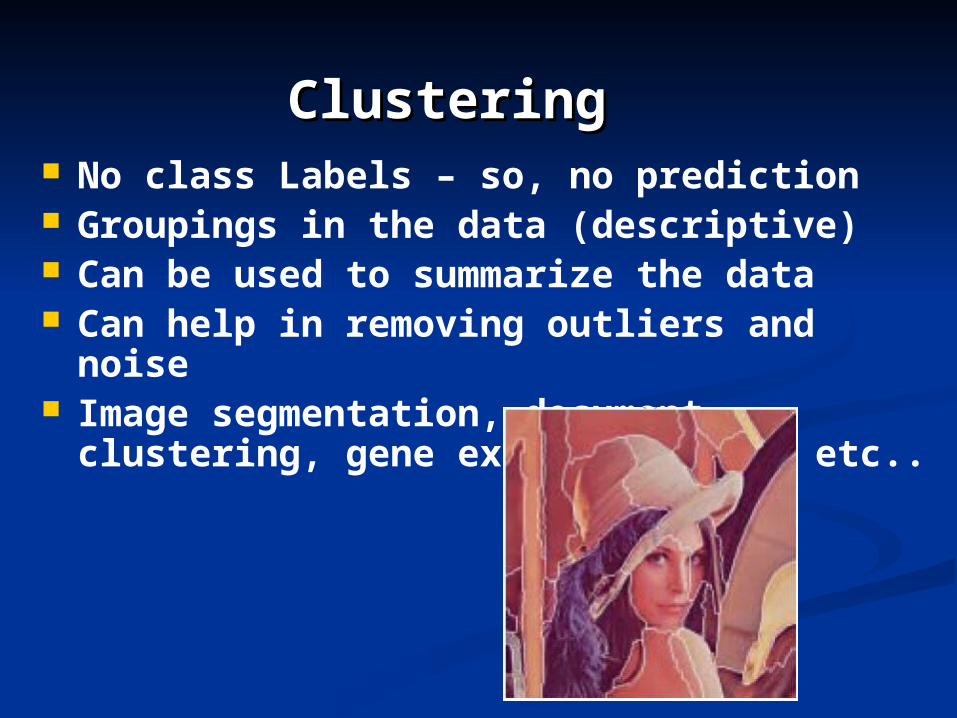
ClusteringClustering No class Labels – so, no prediction Groupings in the data (descriptive) Can be used to summarize the data Can help in removing outliers and noise Image segmentation, document
clustering, gene expression data etc..

Association AnalysisAssociation Analysis Given a set of transactions, Given a set of transactions, find rules that will find rules that will
predictpredict the occurrence of an item based on the the occurrence of an item based on the occurrences of other items in the transactionoccurrences of other items in the transaction
Market-Basket transactions
TID Items
1 Bread, Milk
2 Bread, Diaper, Beer, Eggs
3 Milk, Diaper, Beer, Coke
4 Bread, Milk, Diaper, Beer
5 Bread, Milk, Diaper, Coke
Example of Association Rules
{Diaper} {Beer},{Milk, Bread} {Eggs,Coke},{Beer, Bread} {Milk},
Implication means co-occurrence, not causality!

OrganizationOrganization Introduction Basic components Fundamental Topics
Classification Clustering Association Analysis
Research Topics Probabilistic Graphical Models Boosting Algorithms Active Learning Mining under Constraints
Teaching
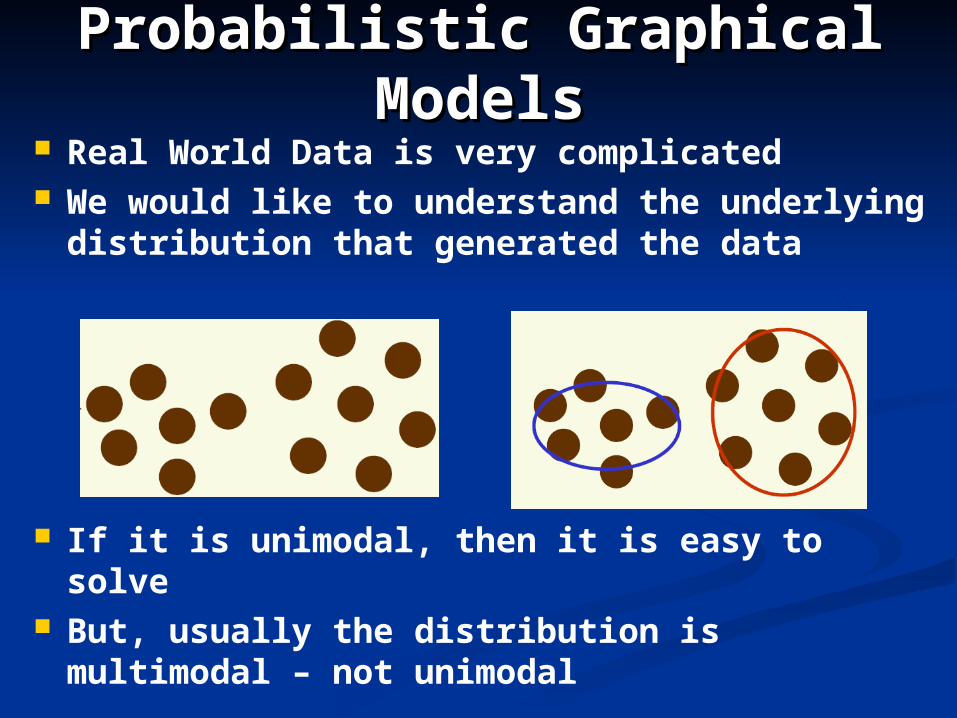
Probabilistic Graphical Probabilistic Graphical ModelsModels
Real World Data is very complicated We would like to understand the
underlying distribution that generated the data
If it is unimodal, then it is easy to solve But, usually the distribution is
multimodal – not unimodal
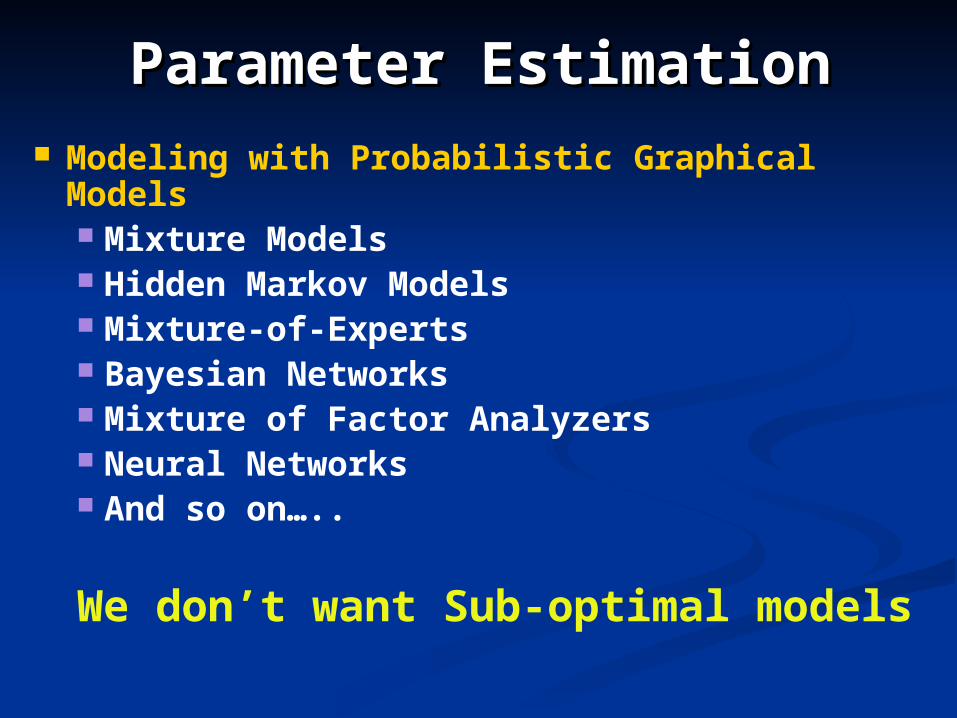
Parameter EstimationParameter Estimation Modeling with Probabilistic Graphical
Models Mixture Models Hidden Markov Models Mixture-of-Experts Bayesian Networks Mixture of Factor Analyzers Neural Networks And so on…..
We don’t want Sub-optimal models
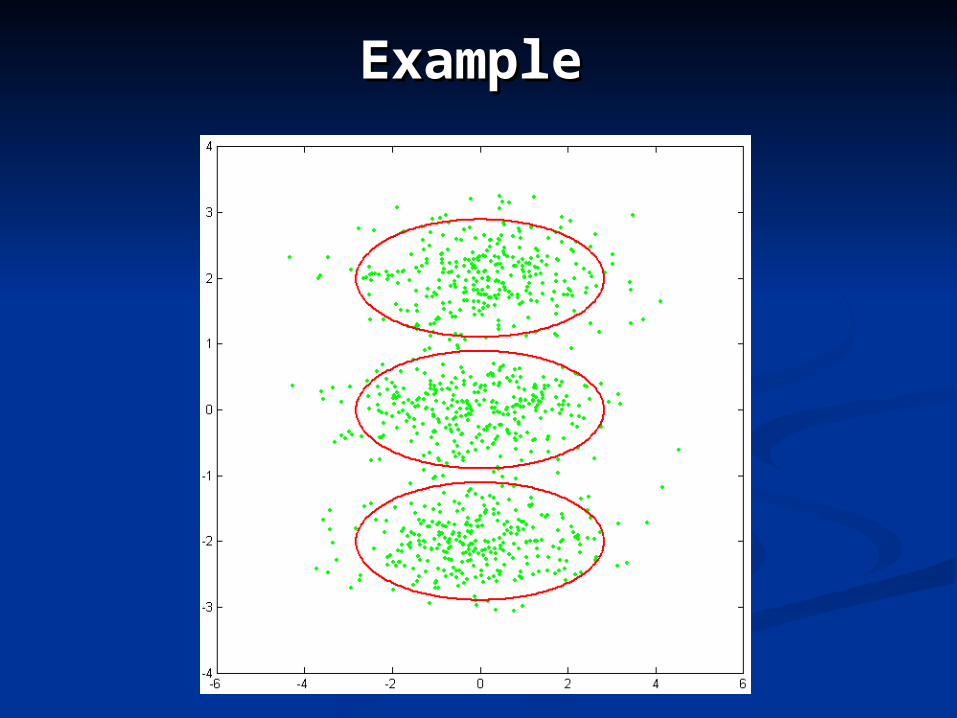
ExampleExample
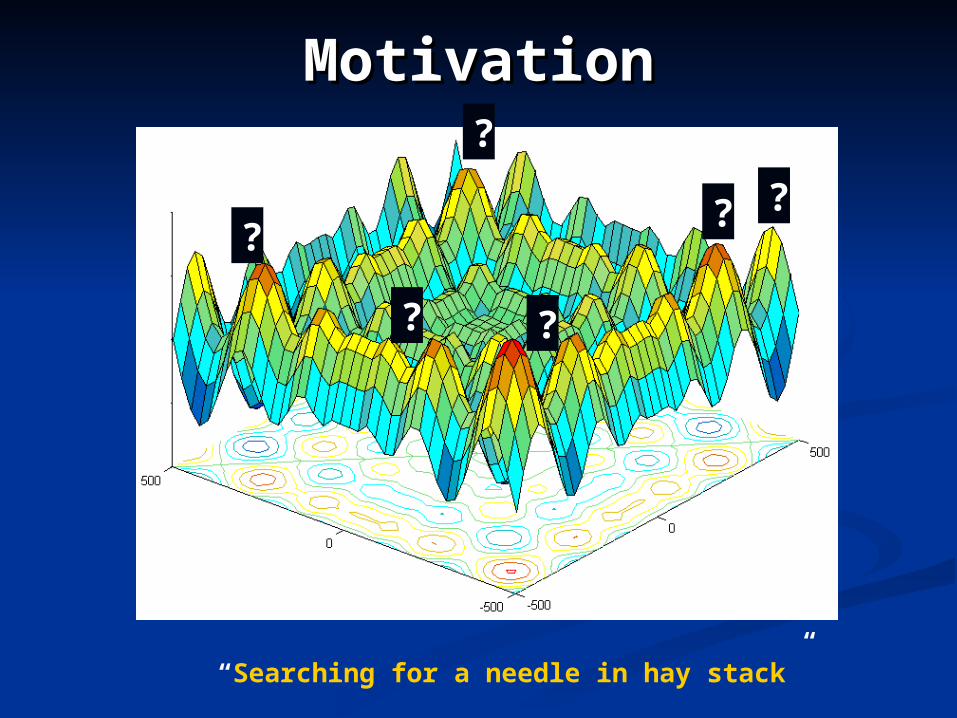
MotivationMotivation
“Searching for a needle in hay stack”
?
? ??
??
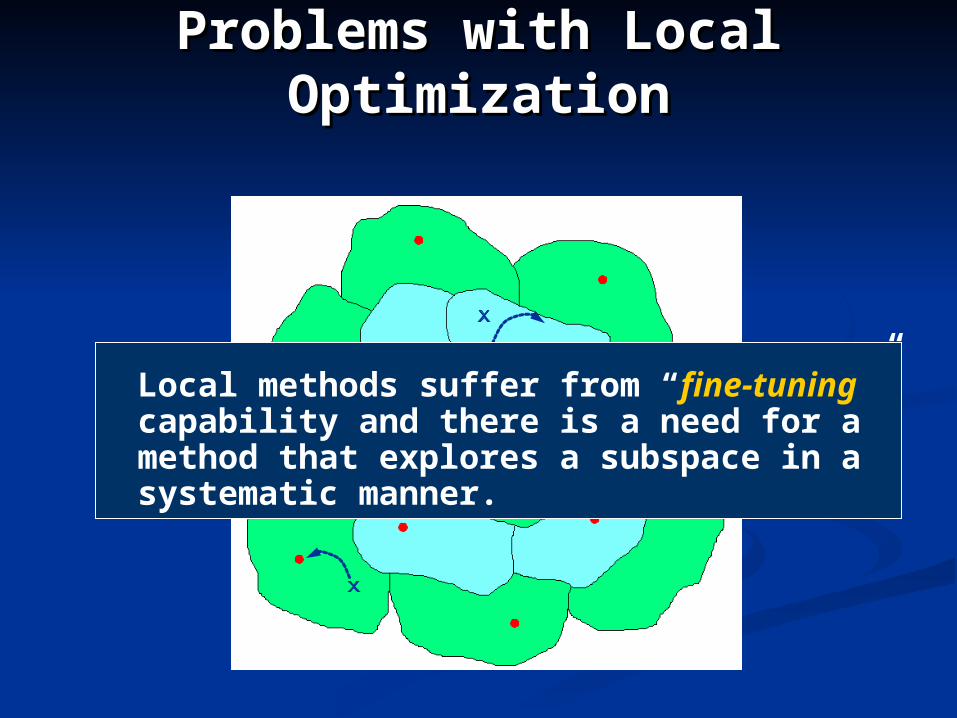
Problems with Local Problems with Local OptimizationOptimization
Local methods suffer from “fine-tuning ” capability and there is a need for a method that explores a subspace in a systematic manner.
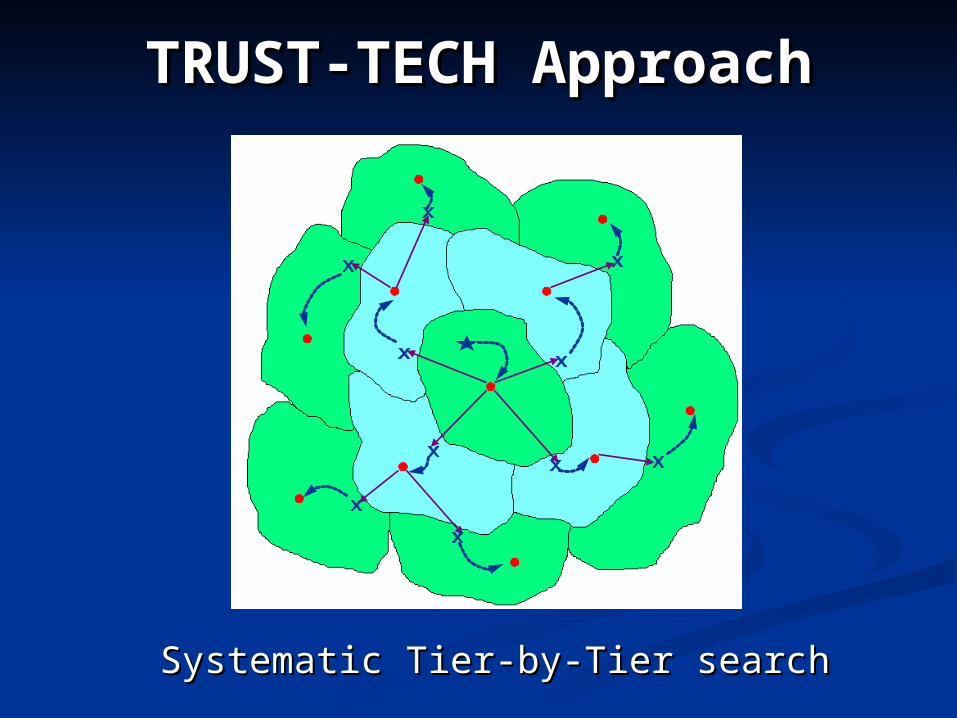
TRUST-TECH ApproachTRUST-TECH Approach
Systematic Tier-by-Tier searchSystematic Tier-by-Tier search
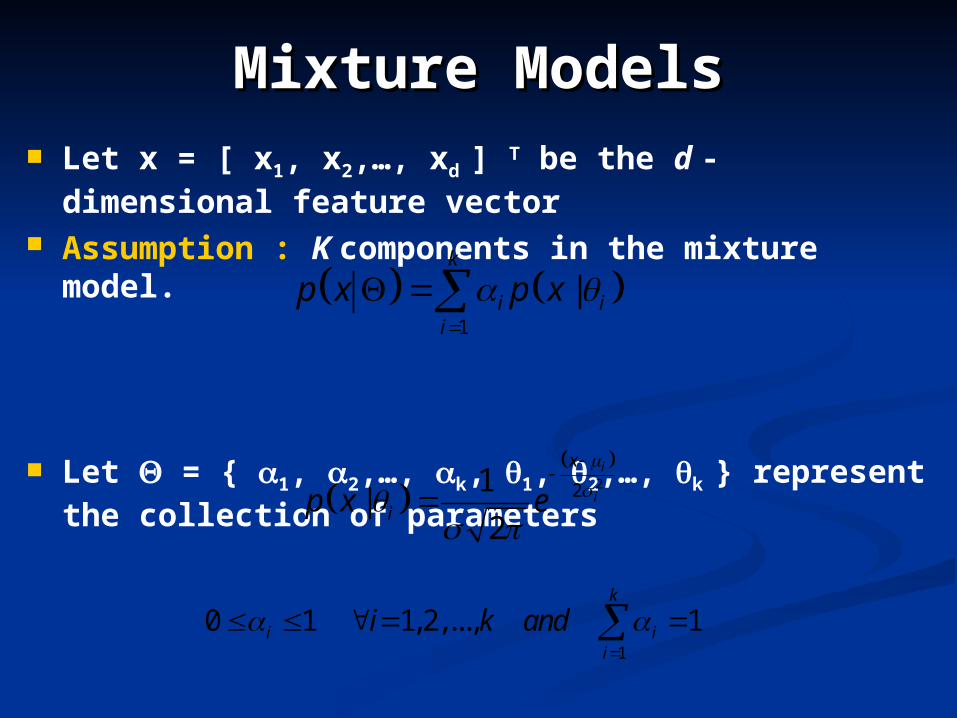
Mixture ModelsMixture Models Let x = [ x1, x2,…, xd ] T be the d - dimensional
feature vector Assumption : K components in the mixture
model.
Let = { 1, 2,…, k, 1, 2,…, k } represent the collection of parameters
1
|k
i ii
p x p x
221|
2
i
i
x
ip x e
1
0 1 1,2,..., 1k
i ii
i k and
Maximum Likelihood Maximum Likelihood EstimationEstimation
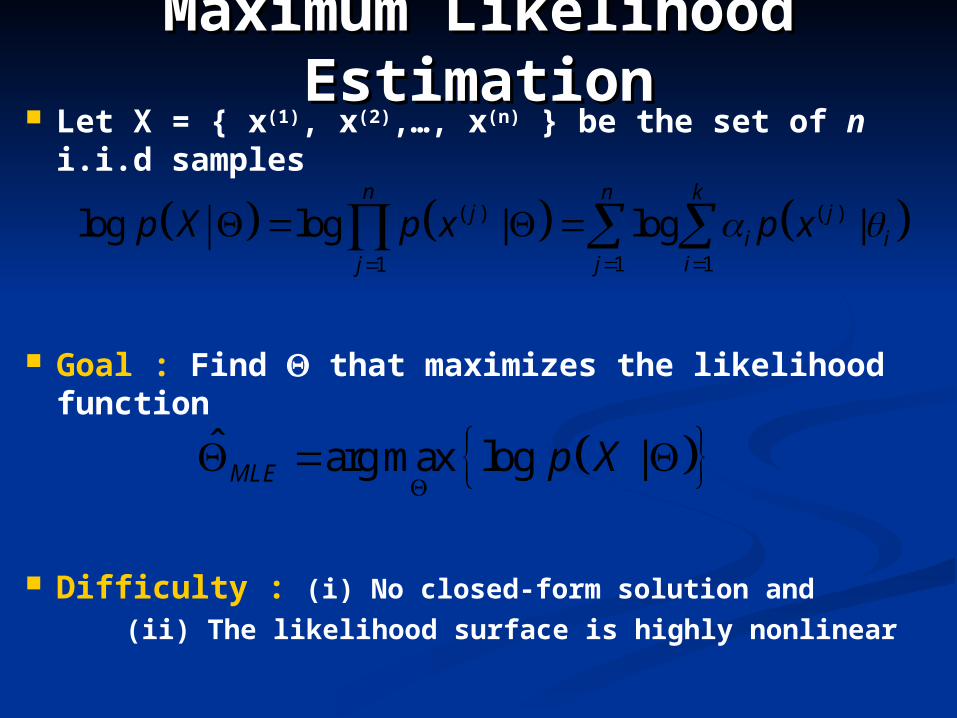
Let X = { x(1), x(2),…, x(n) } be the set of n i.i.d samples
Goal : Find that maximizes the likelihood function
Difficulty : (i) No closed-form solution and
(ii) The likelihood surface is highly nonlinear
( ) ( )
1 11
log log | log |n n k
j ji i
j ij
p X p x p x
ˆ arg max log |MLE p X

EM AlgorithmEM Algorithm Initialization : Set the initial parameters
Iteration : Iterate the following until
convergence E-Step : Compute the Q-function i.e.
expectation of the log likelihood given the current parameters
M-Step : Maximize the Q-function with respect to
( ) ( ), og , | | ,t tZQ E l p X Z X
1 arg max |t tQ
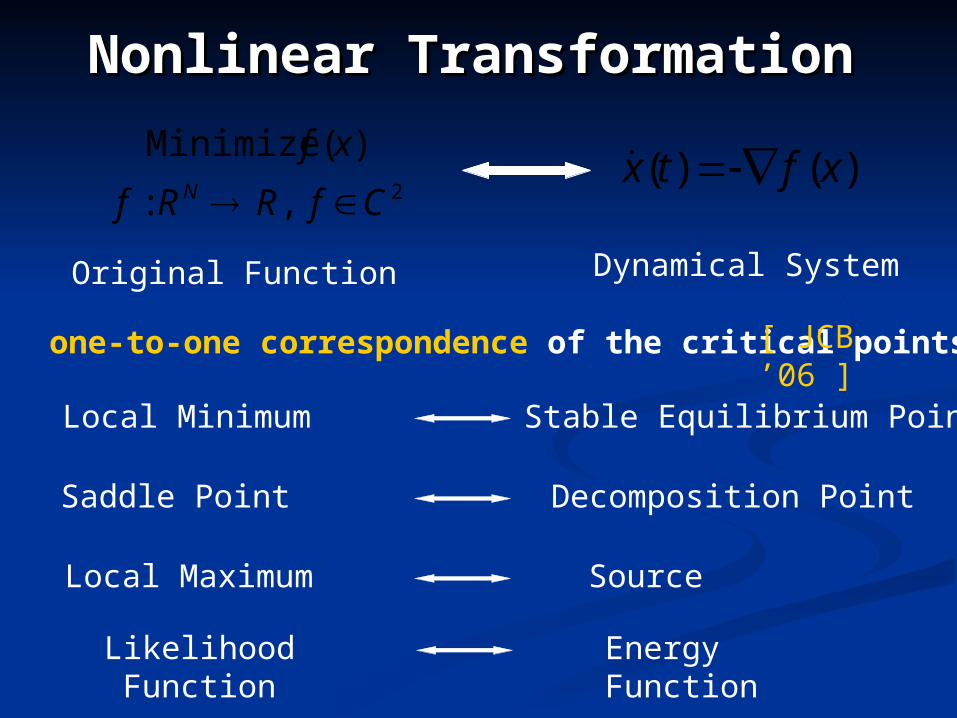
Nonlinear TransformationNonlinear Transformation
one-to-one correspondence of the critical points
2 ,:
)( Minimize
CfRRf
xfN
)()( xftx
Local Minimum
Local Maximum
Stable Equilibrium Point
Decomposition Point
Source
Saddle Point
Original Function Dynamical System
Likelihood Function
Energy Function
[ JCB ’06 ]
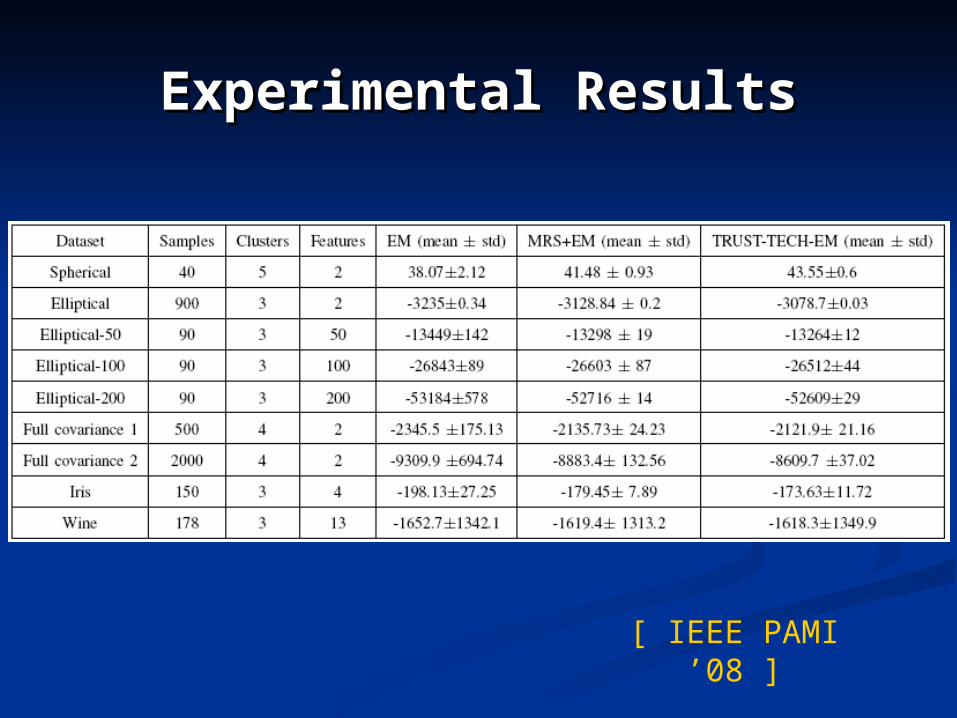
Experimental ResultsExperimental Results
[ IEEE PAMI ’08 ]
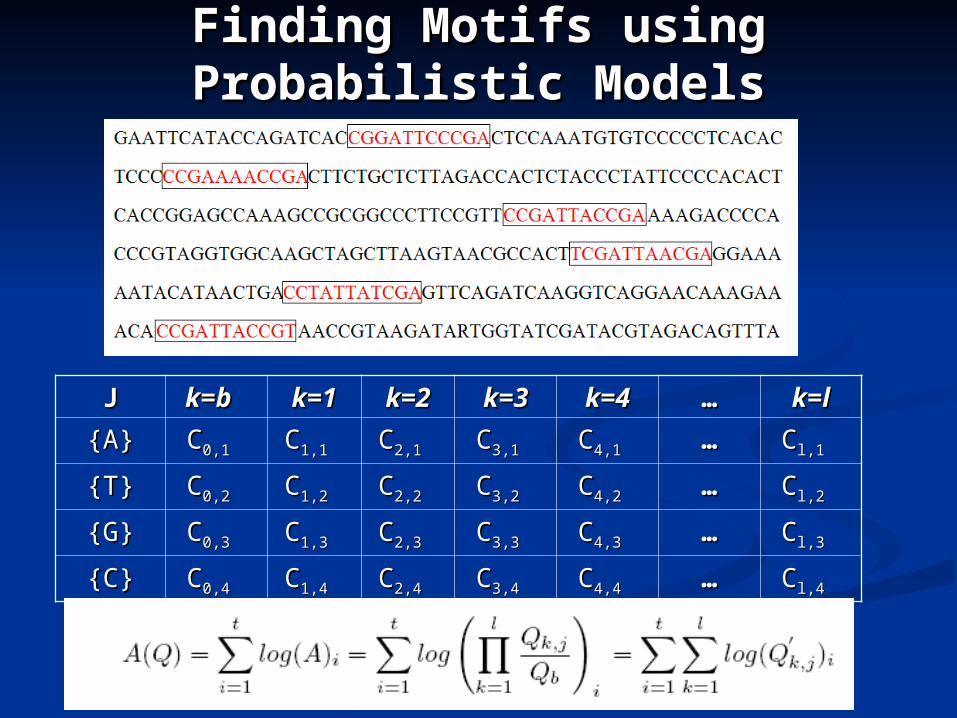
Finding Motifs using Finding Motifs using Probabilistic ModelsProbabilistic Models
JJ k=bk=b k=1k=1 k=2k=2 k=3k=3 k=4k=4 …… k=lk=l
{A}{A} CC0,10,1 CC1,11,1 CC2,12,1 CC3,13,1 CC4,14,1 …… CCl,1l,1
{T}{T} CC0,20,2 CC1,21,2 CC2,22,2 CC3,23,2 CC4,24,2 …… CCl,2l,2
{G}{G} CC0,30,3 CC1,31,3 CC2,32,3 CC3,33,3 CC4,34,3 …… CCl,3l,3
{C}{C} CC0,40,4 CC1,41,4 CC2,42,4 CC3,43,4 CC4,44,4 …… CCl,4l,4
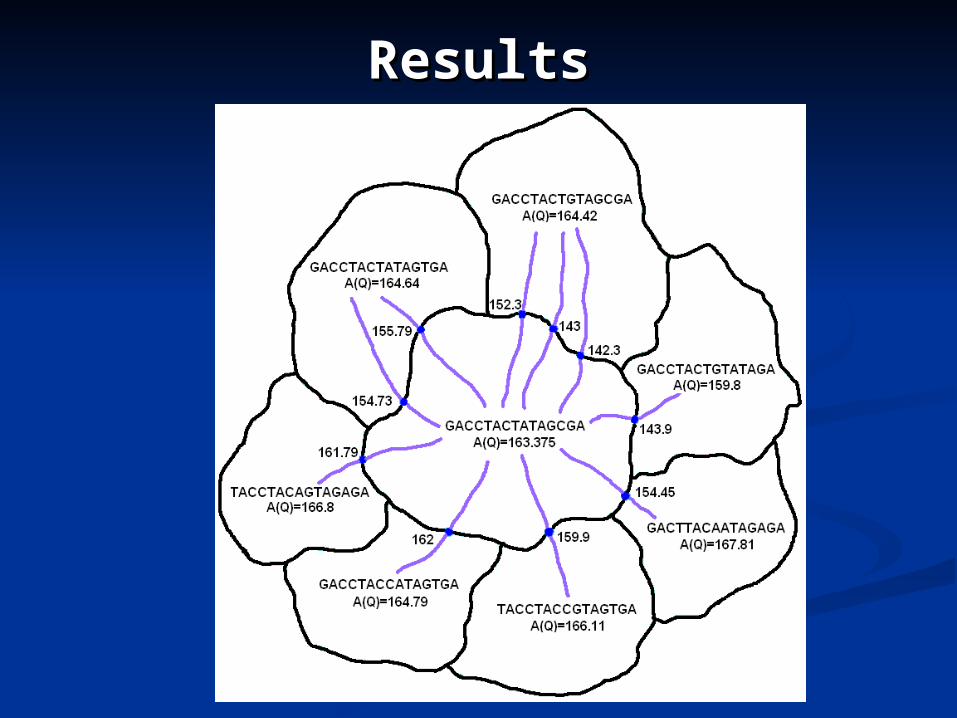
ResultsResults

ResultsResults
120
140
160
180
200
(11,2
)
(13,3
)
(15,4
)
(17,5
)
(20,6
)
Motifs
Ali
gn
men
t S
core
Original
Tier-1
Tier-2
Different Motifs and the average score using random starts.The first tier and second tier improvements
[ BMC AMB ’06 ]
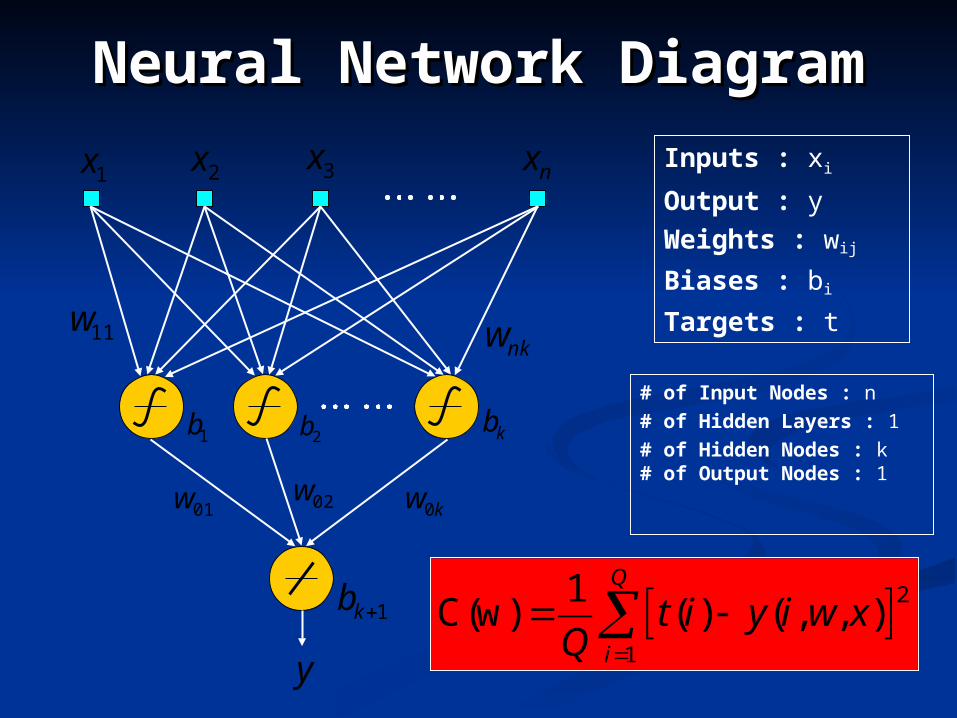
Neural Network DiagramNeural Network DiagramInputs : xi
Output : yWeights : wij
Biases : bi
Targets : t11wnkw
01w 02wkw0
1kb
y
1b 2b kb
nx3x2x1x
# of Input Nodes : n# of Hidden Layers : 1# of Hidden Nodes : k# of Output Nodes : 1
2
1
1C(w) ( ) ( , , )
Q
i
t i y i w xQ
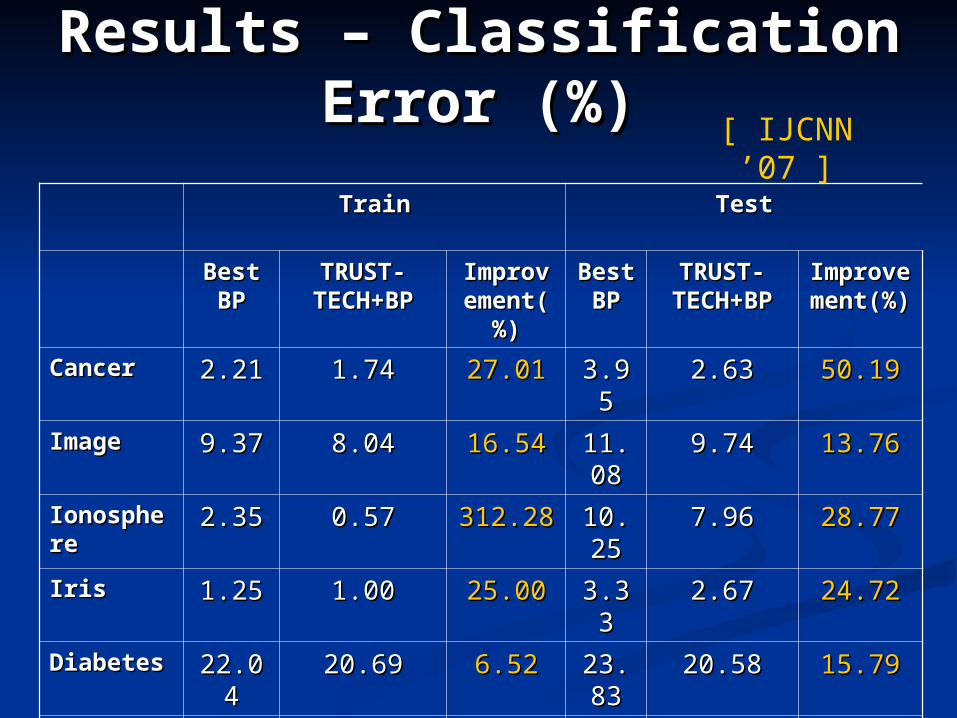
Results – Classification Results – Classification Error (%)Error (%)
TrainTrain TestTest
Best Best BPBP
TRUST-TRUST-TECH+BPTECH+BP
ImprovImprovement(ement(
%)%)
Best Best BPBP
TRUST-TRUST-TECH+BTECH+B
PP
ImprovImprovement(ement(
%)%)
CancerCancer 2.212.21 1.741.74 27.0127.01 3.953.95 2.632.63 50.1950.19
ImageImage 9.379.37 8.048.04 16.5416.54 11.011.088
9.749.74 13.7613.76
IonospheIonospherere
2.352.35 0.570.57 312.28312.28 10.210.255
7.967.96 28.7728.77
IrisIris 1.251.25 1.001.00 25.0025.00 3.333.33 2.672.67 24.7224.72
DiabetesDiabetes 22.0422.04 20.6920.69 6.526.52 23.823.833
20.5820.58 15.7915.79
SonarSonar 1.561.56 0.720.72 116.67116.67 19.119.177
12.9812.98 47.6947.69
WineWine 4.564.56 3.583.58 27.3727.37 14.914.944
6.736.73 121.99121.99
[ IJCNN ’07 ]
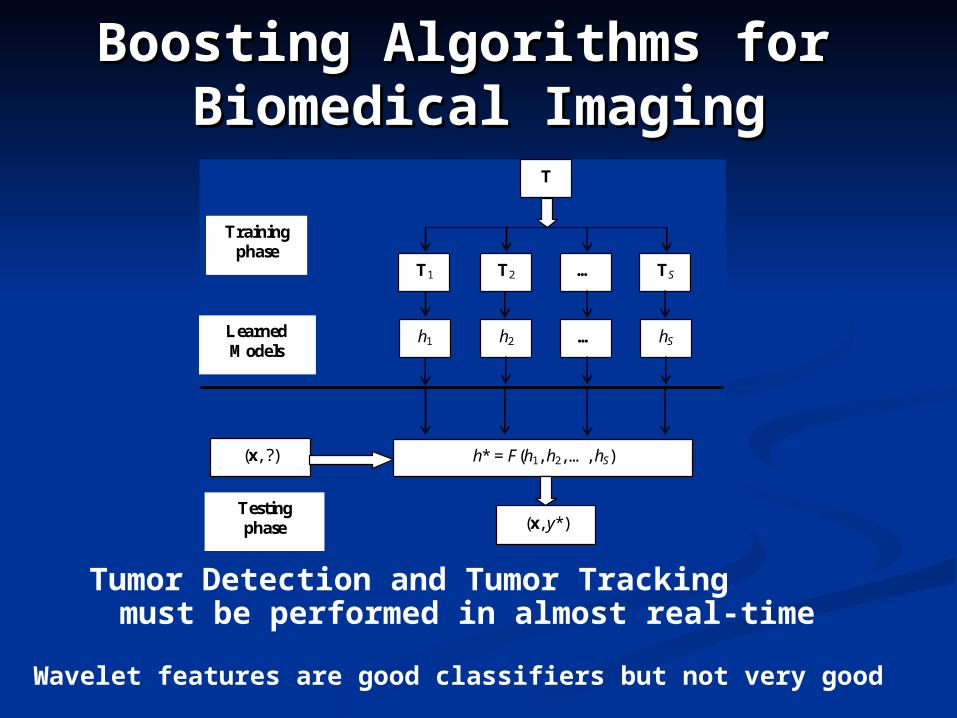
Boosting Algorithms for Boosting Algorithms for Biomedical ImagingBiomedical Imaging
Tumor Detection and Tumor Tracking must be performed in almost real-time
Wavelet features are good classifiers but not very good
Testing phase
T
T1 T2 … TS
(x, ?) h* = F(h1, h2, …, hS)
(x, y*)
Training phase
h1 h2 … hS Learned Models
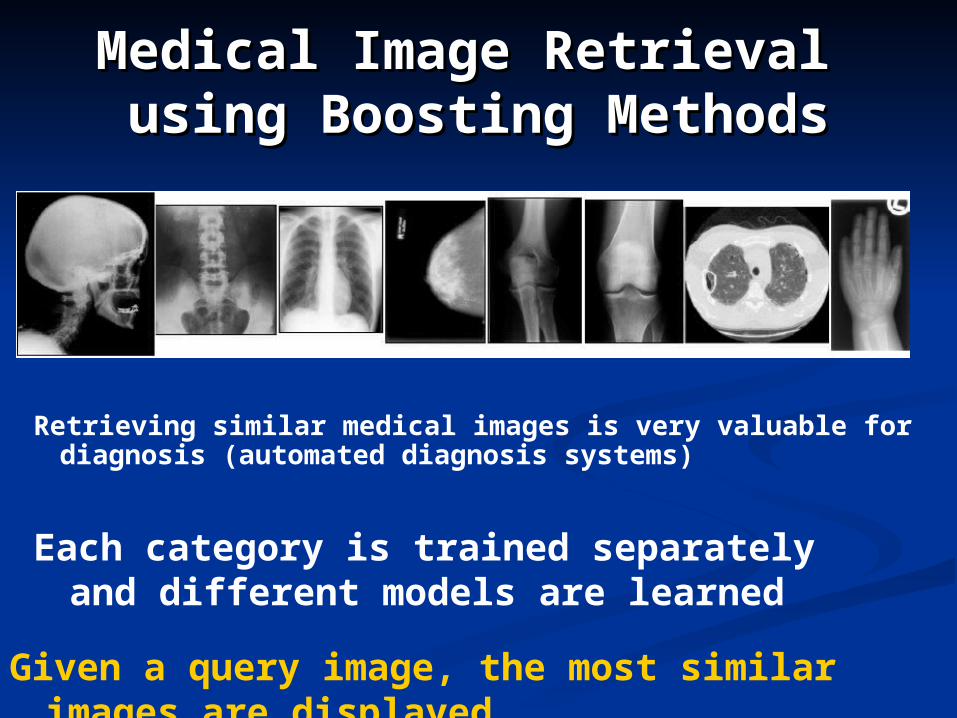
Medical Image Retrieval Medical Image Retrieval using Boosting Methodsusing Boosting Methods
Retrieving similar medical images is very valuable for diagnosis (automated diagnosis systems)
Each category is trained separately and different models are learned
Given a query image, the most similar images are displayed
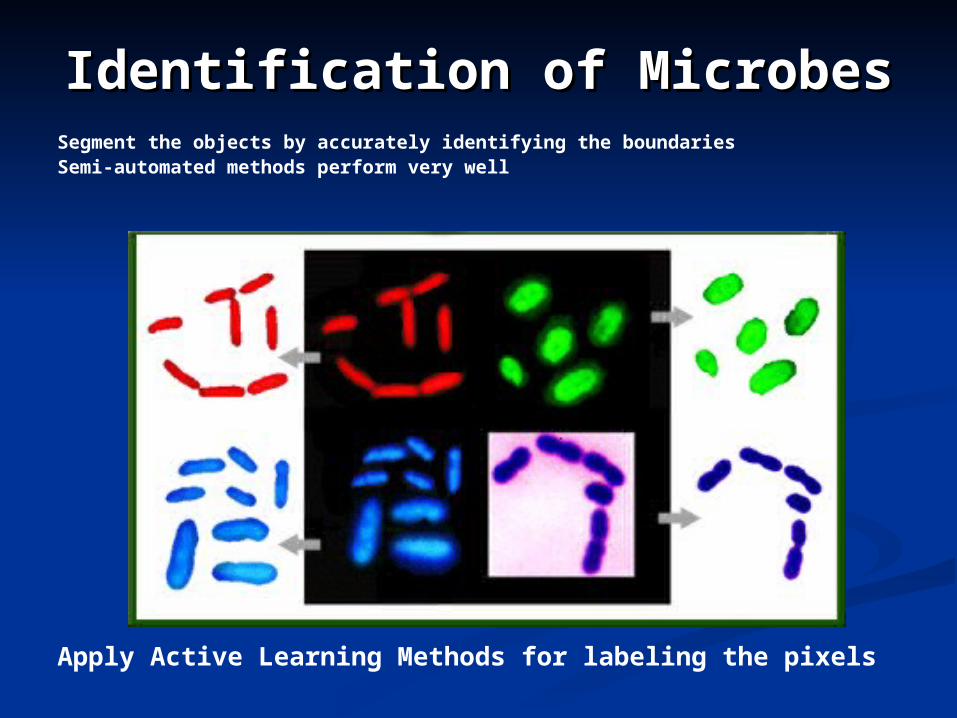
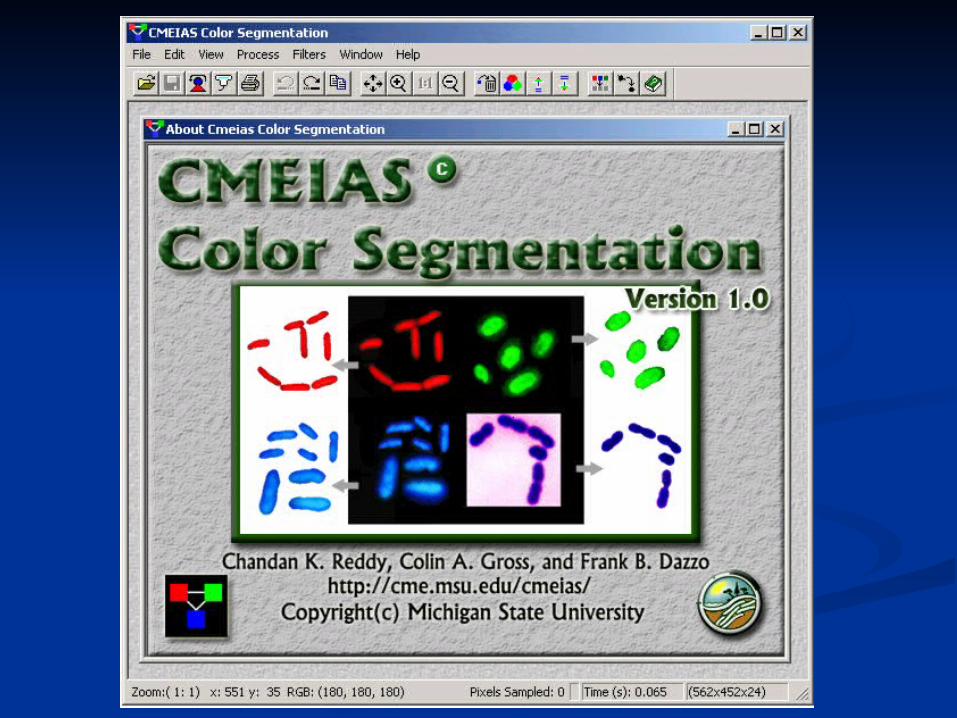
Identification of MicrobesIdentification of MicrobesSegment the objects by accurately identifying the boundariesSemi-automated methods perform very well
Apply Active Learning Methods for labeling the pixels
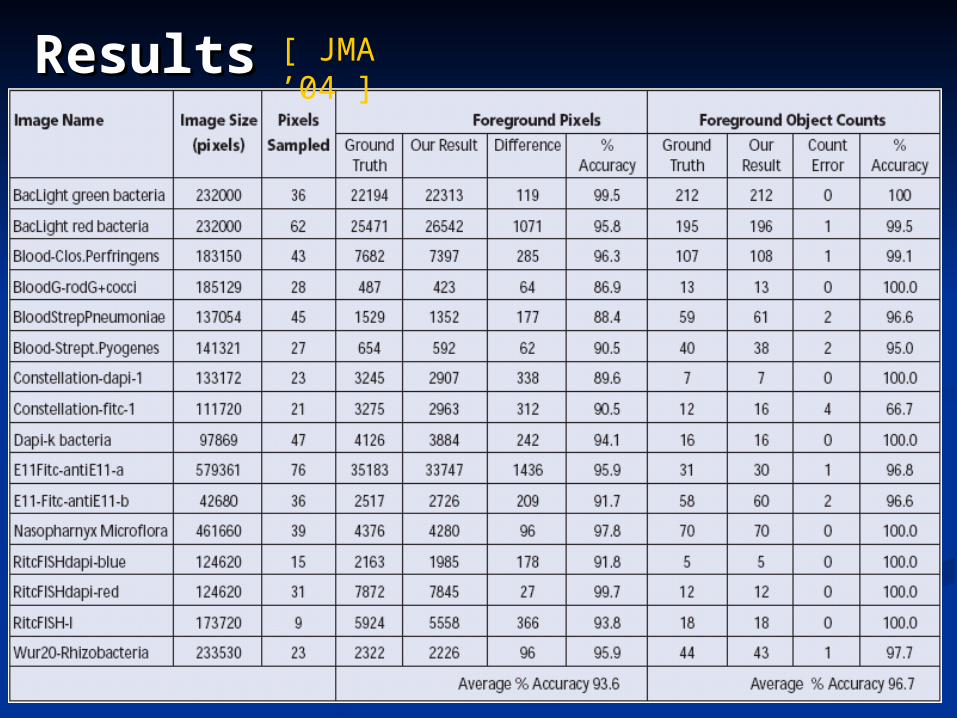
ResultsResults[ JMA ’04 ]
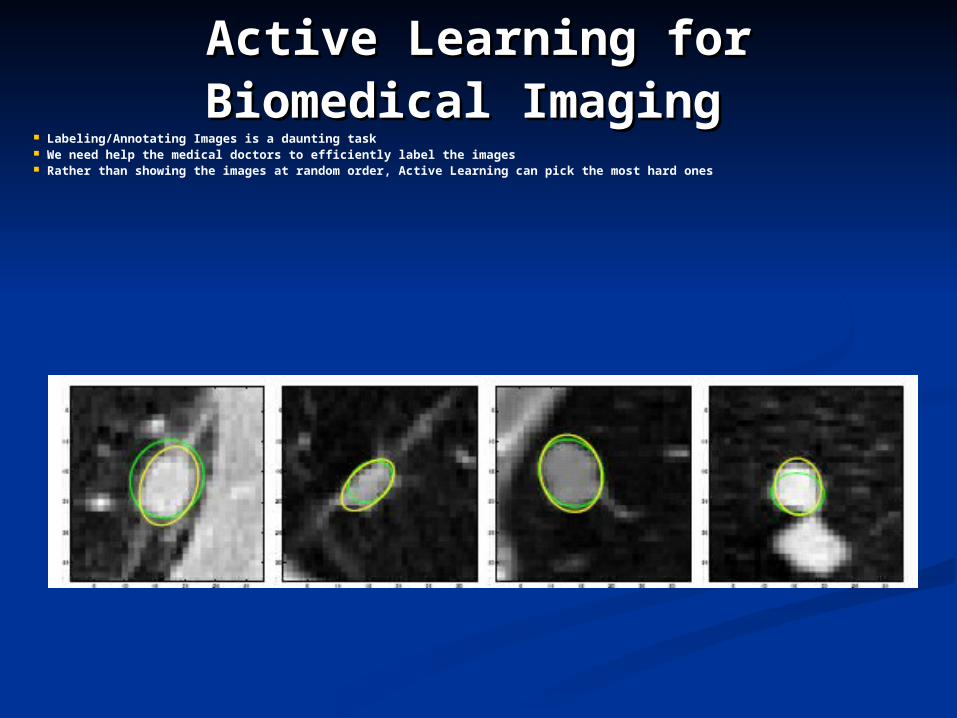
Active Learning for Biomedical Active Learning for Biomedical ImagingImaging
Labeling/Annotating Images is a daunting task We need help the medical doctors to efficiently label the images Rather than showing the images at random order, Active Learning can pick the most hard ones
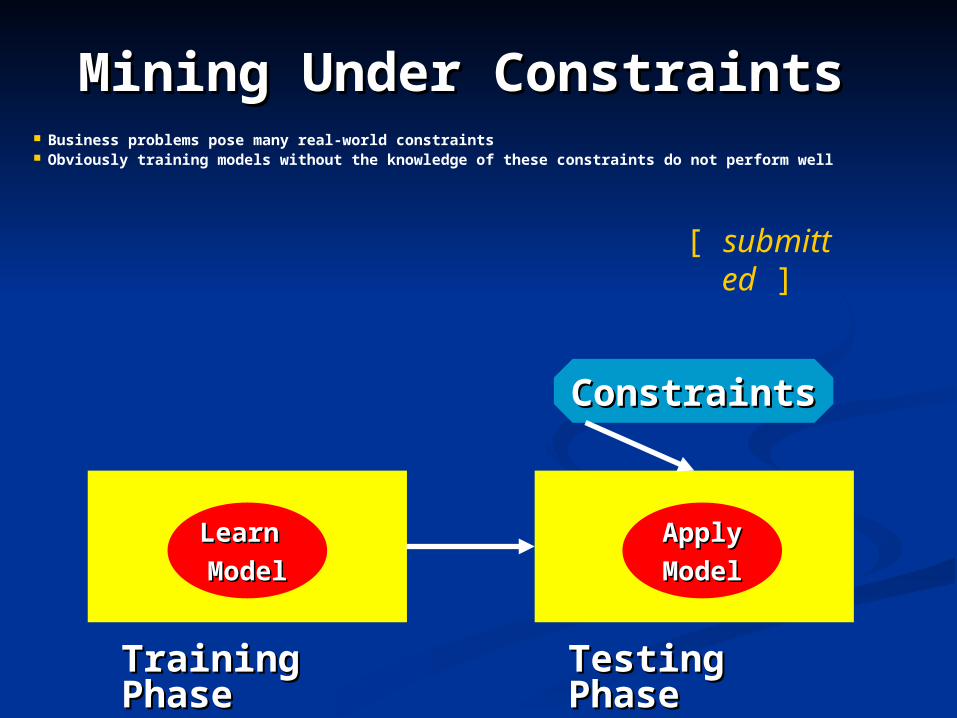
Mining Under ConstraintsMining Under Constraints Business problems pose many real-world constraints Obviously training models without the knowledge of these constraints do not perform well
Learn Learn
ModelModelApplyApply
ModelModel
Training Training PhasePhase
Testing Testing PhasePhase
ConstraintsConstraints
[ submitted ]
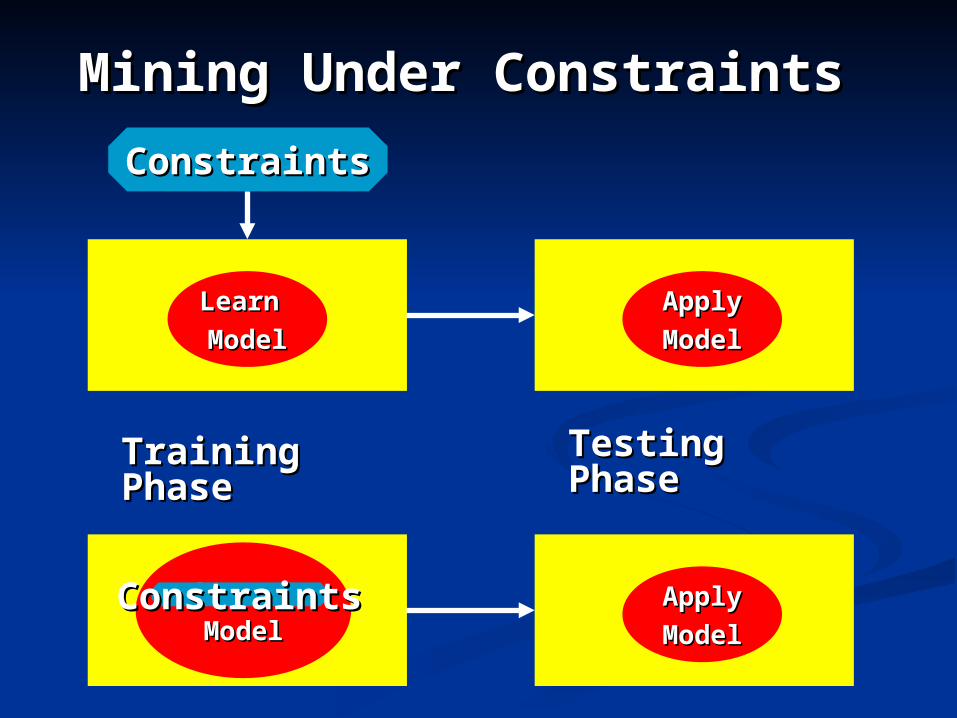
Mining Under ConstraintsMining Under Constraints
Learn Learn
ModelModelApplyApply
ModelModel
Training Training PhasePhase
Testing Testing PhasePhase
ConstraintsConstraints
Learn Learn
ModelModelApplyApply
ModelModelConstraintsConstraints
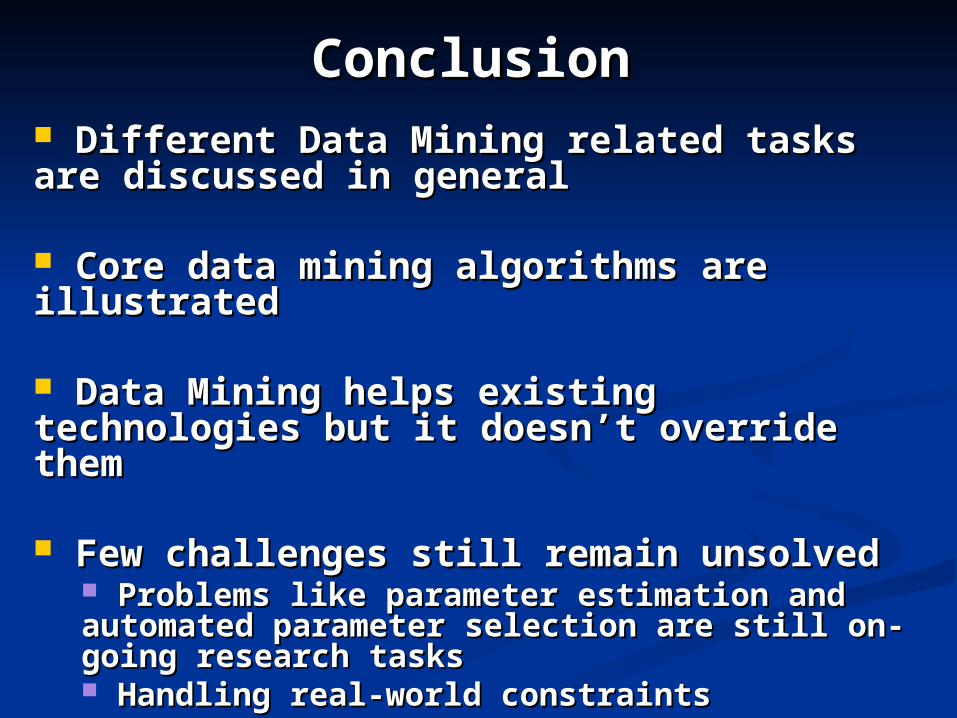
ConclusionConclusion Different Data Mining related tasks are Different Data Mining related tasks are discussed in generaldiscussed in general
Core data mining algorithms are Core data mining algorithms are illustratedillustrated
Data Mining helps existing technologies Data Mining helps existing technologies but it doesn’t override thembut it doesn’t override them
Few challenges still remain unsolved Few challenges still remain unsolved Problems like parameter estimation and Problems like parameter estimation and automated parameter selection are still on-automated parameter selection are still on-going research tasksgoing research tasks Handling real-world constraintsHandling real-world constraints Incorporating domain knowledge during the Incorporating domain knowledge during the training phasetraining phase
TeachingTeaching
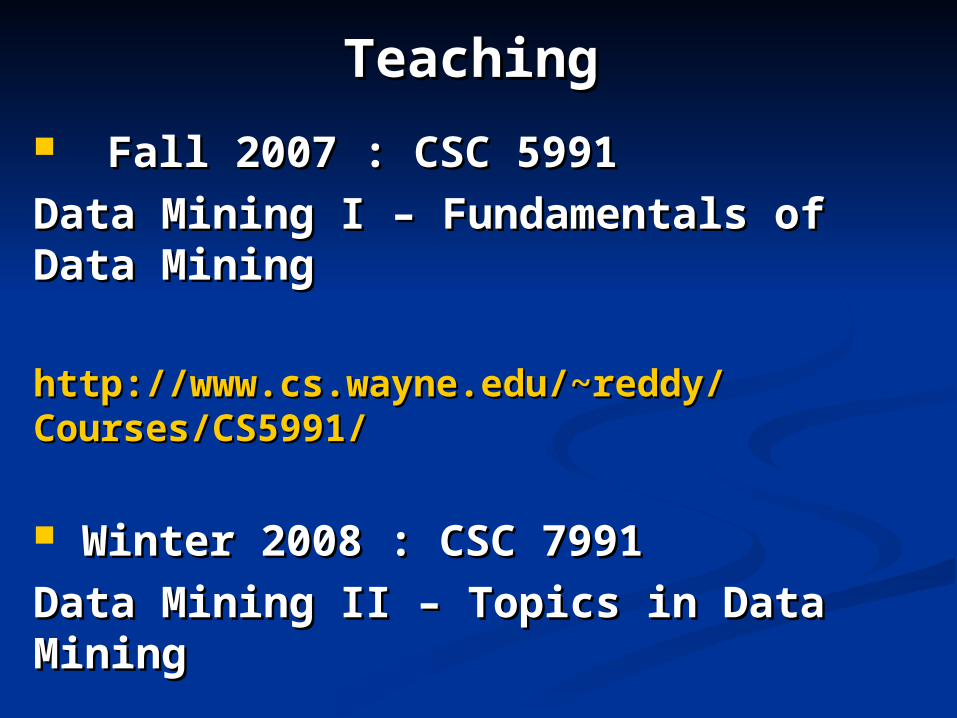
Fall 2007 : CSC 5991 Fall 2007 : CSC 5991
Data Mining I – Fundamentals of Data Mining I – Fundamentals of Data MiningData Mining
http://www.cs.wayne.edu/~reddy/http://www.cs.wayne.edu/~reddy/Courses/CS5991/Courses/CS5991/
Winter 2008 : CSC 7991 Winter 2008 : CSC 7991
Data Mining II – Topics in Data Data Mining II – Topics in Data MiningMining
http://www.cs.wayne.edu/~reddy/http://www.cs.wayne.edu/~reddy/Courses/CSC7991/Courses/CSC7991/

Data Mining I ( Fall Data Mining I ( Fall 2007 )2007 )
This course introduces the fundamental This course introduces the fundamental principles, algorithms and applications of principles, algorithms and applications of data mining.data mining.
Topics covered in this course Topics covered in this course include:include:
data pre-processing data pre-processing data visualizationdata visualization model evaluationmodel evaluation predictive modelingpredictive modeling association analysisassociation analysis clusteringclustering anomaly detection.anomaly detection.
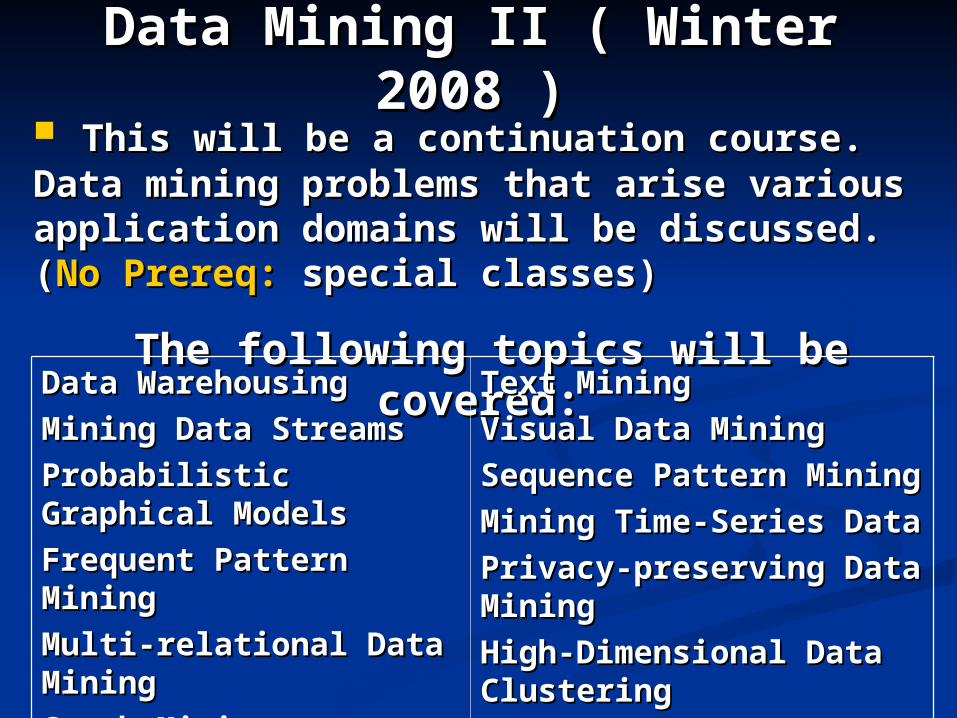
Data Mining II ( Winter Data Mining II ( Winter 2008 )2008 )
This will be a continuation course. Data This will be a continuation course. Data mining problems that arise various mining problems that arise various application domains will be discussed. application domains will be discussed. ((No Prereq: No Prereq: special classes)special classes)
The following topics will be covered:The following topics will be covered:
Data Warehousing Data Warehousing
Mining Data Streams Mining Data Streams
Probabilistic Graphical Probabilistic Graphical Models Models
Frequent Pattern Frequent Pattern Mining Mining
Multi-relational Data Multi-relational Data Mining Mining
Graph Mining Graph Mining
Text Mining Text Mining
Visual Data Mining Visual Data Mining
Sequence Pattern Sequence Pattern Mining Mining
Mining Time-Series Mining Time-Series Data Data
Privacy-preserving Data Privacy-preserving Data Mining Mining
High-Dimensional Data High-Dimensional Data ClusteringClustering
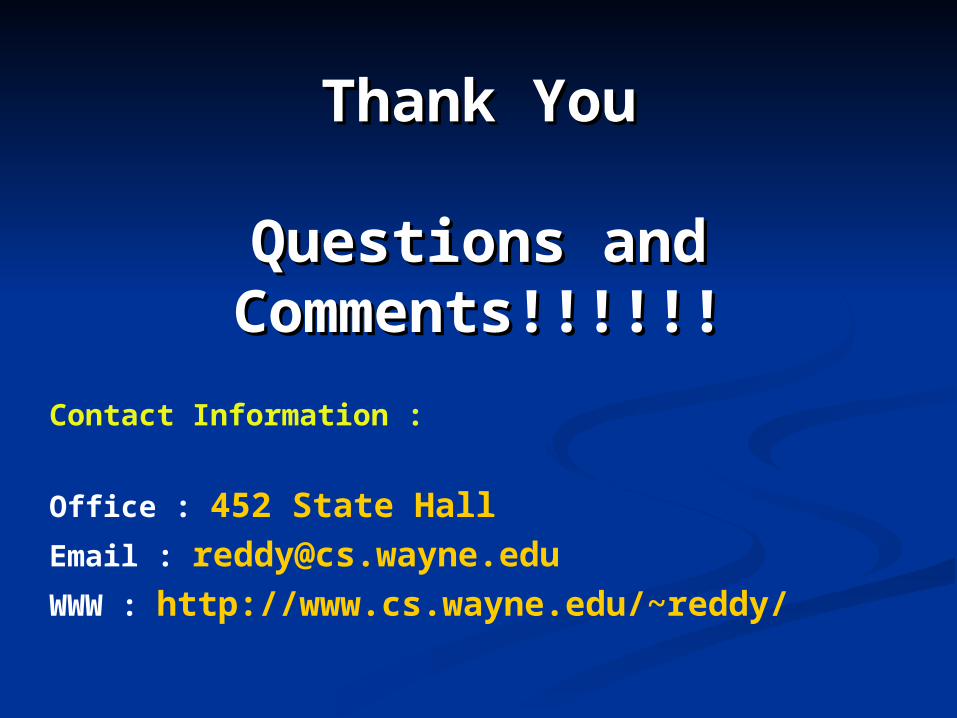
Thank YouThank You
Questions and Questions and Comments!!!!!!Comments!!!!!!
Contact Information :
Office : 452 State HallEmail : [email protected] : http://www.cs.wayne.edu/~reddy/