Embed Size (px)
Citation preview
Hadley Wickham @hadleywickham Chief Scientist, RStudio
Data manipulation with dplyr
June 2014

Data analysis is the process by which data becomes
understanding, knowledge and insight
Data analysis is the process by which data becomes
understanding, knowledge and insight

Data analysis is the process by which data becomes
understanding, knowledge and insight
Data analysis is the process by which data becomes
understanding, knowledge and insight

Transform
Visualise
Model
Surprises, but doesn't scale
Scales, but doesn't (fundamentally) surprise
Tidy
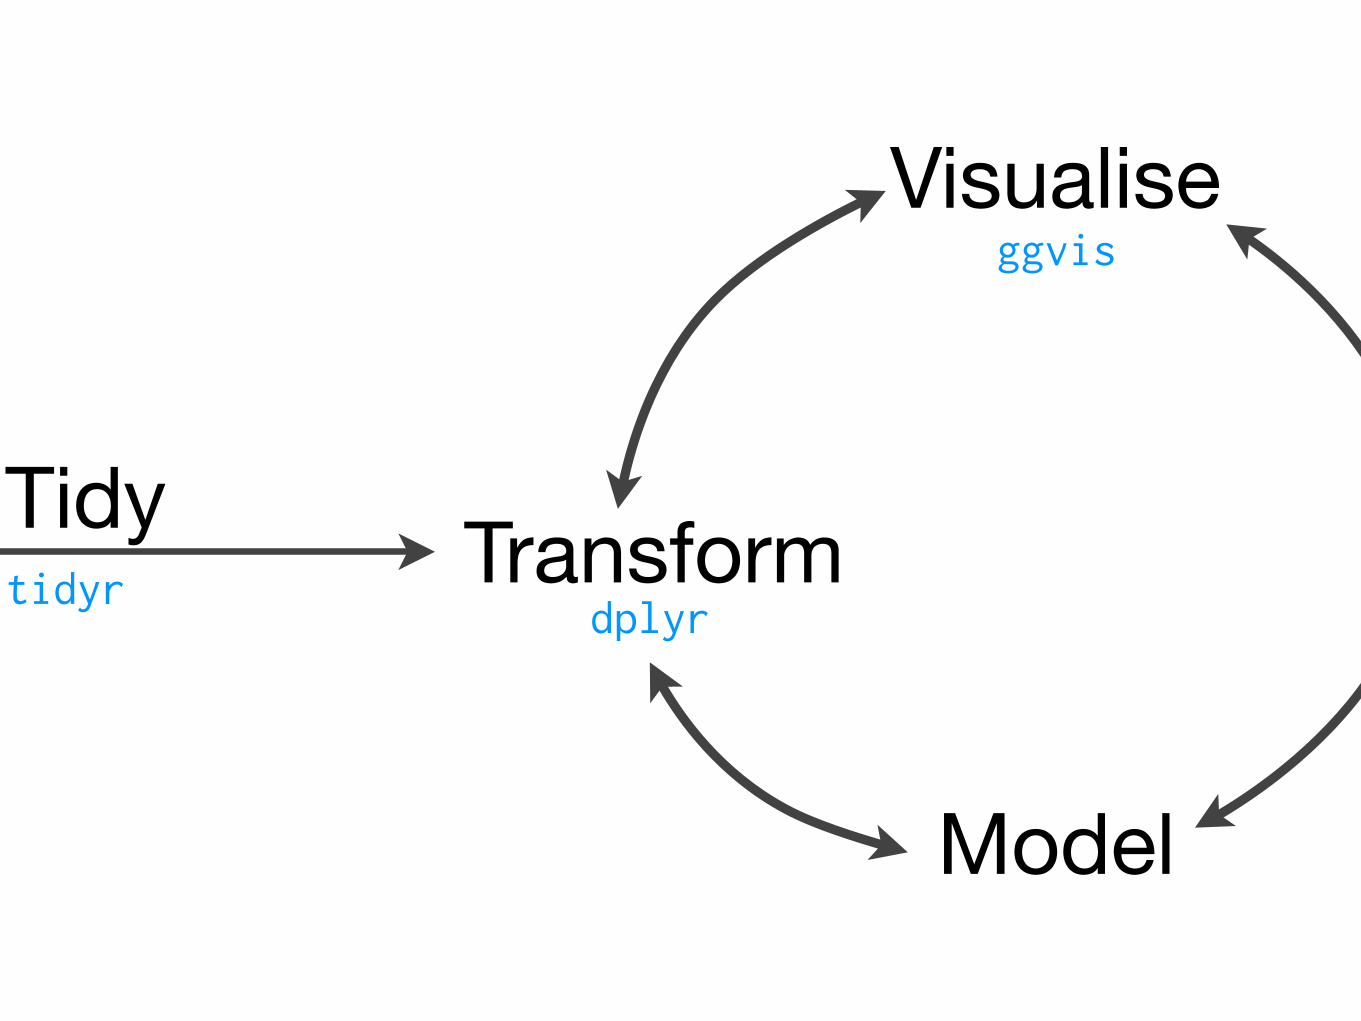
Transform
Visualise
Model
ggvis
tidyrdplyr
Tidy

1. Flights data
2. One table verbs & grouped summaries
3. Data pipelines
4. Grouped mutate/filter & window functions
5. Joins (two table verbs)
6. Do
7. Databases

The bad news: It’s going to be frustrating
http://hyperboleandahalf.blogspot.com/2010/09/four-levels-of-social-entrapment.html
© Allie Brosh

The good news: Frustration is typical and temporary
http://hyperboleandahalf.blogspot.com/2010/06/this-is-why-ill-never-be-adult.html
© Allie Brosh

Flights data

Studio
Rstudio projects
• Isolate code and results from different projects. Restart where you left off.
• Double-click dplyr-tutorial.Rproj file to open. (One R file for each section)
• (If you don’t use RStudio, just change working directories)

Studio
Flights data
• flights [227,496 x 14]. Every flight departing Houston in 2011.
• weather [8,723 x 14]. Hourly weather data.
• planes [2,853 x 9]. Plane metadata.
• airports [3,376 x 7]. Airport metadata.
Studio
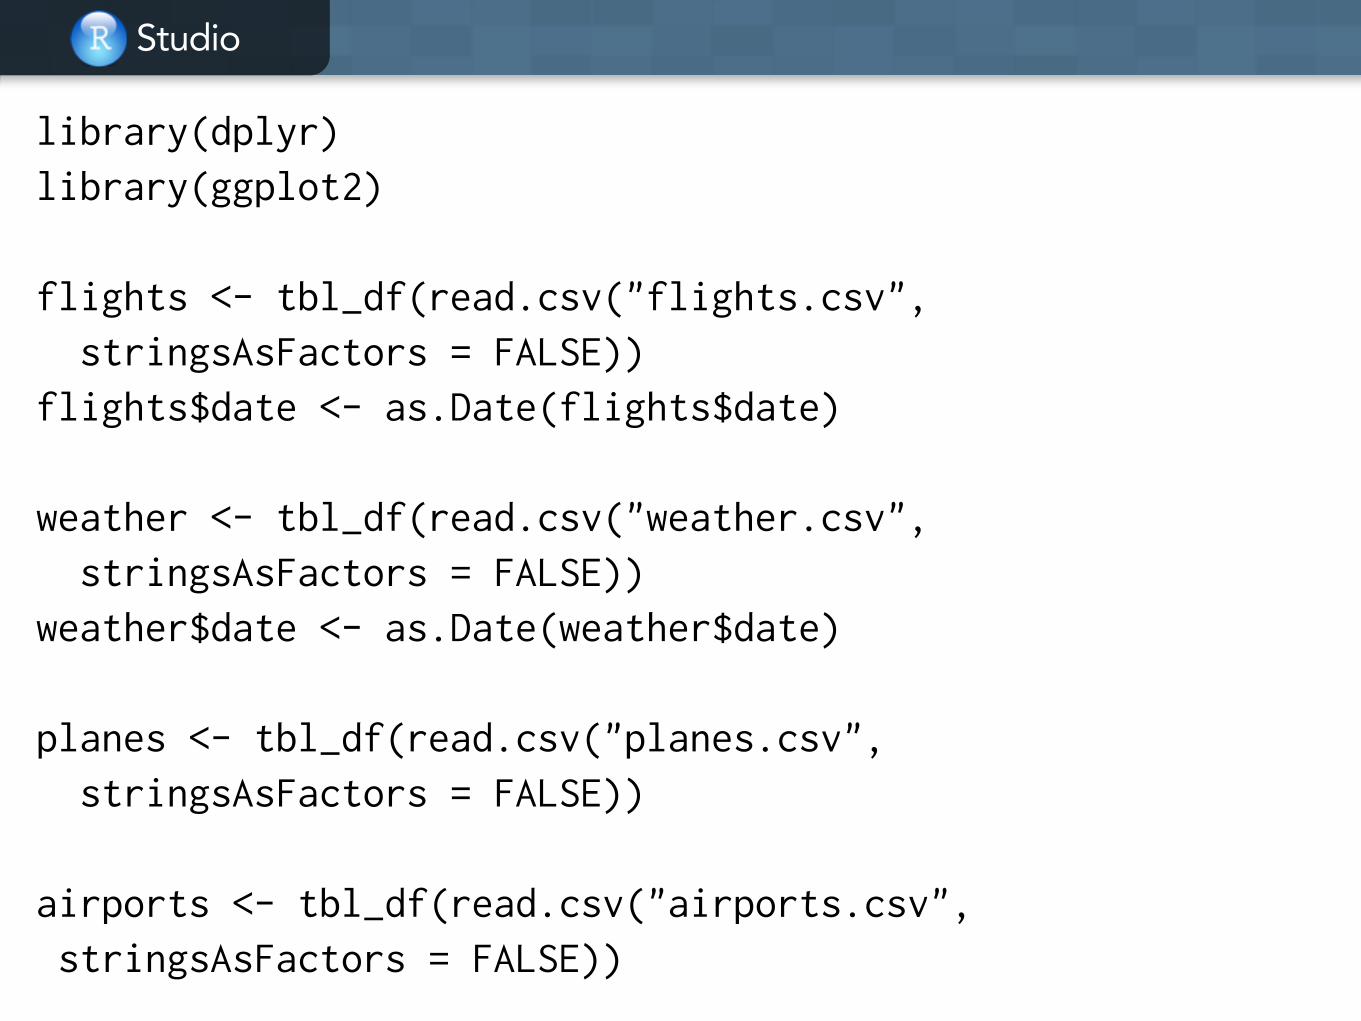
library(dplyr) library(ggplot2) !flights <- tbl_df(read.csv("flights.csv", stringsAsFactors = FALSE)) flights$date <- as.Date(flights$date) !weather <- tbl_df(read.csv("weather.csv", stringsAsFactors = FALSE)) weather$date <- as.Date(weather$date) !planes <- tbl_df(read.csv("planes.csv", stringsAsFactors = FALSE)) !airports <- tbl_df(read.csv("airports.csv", stringsAsFactors = FALSE))

Your turn
Introduce yourself to your neighbour.What questions might you want to answer with this data?

One table verbs

Studio
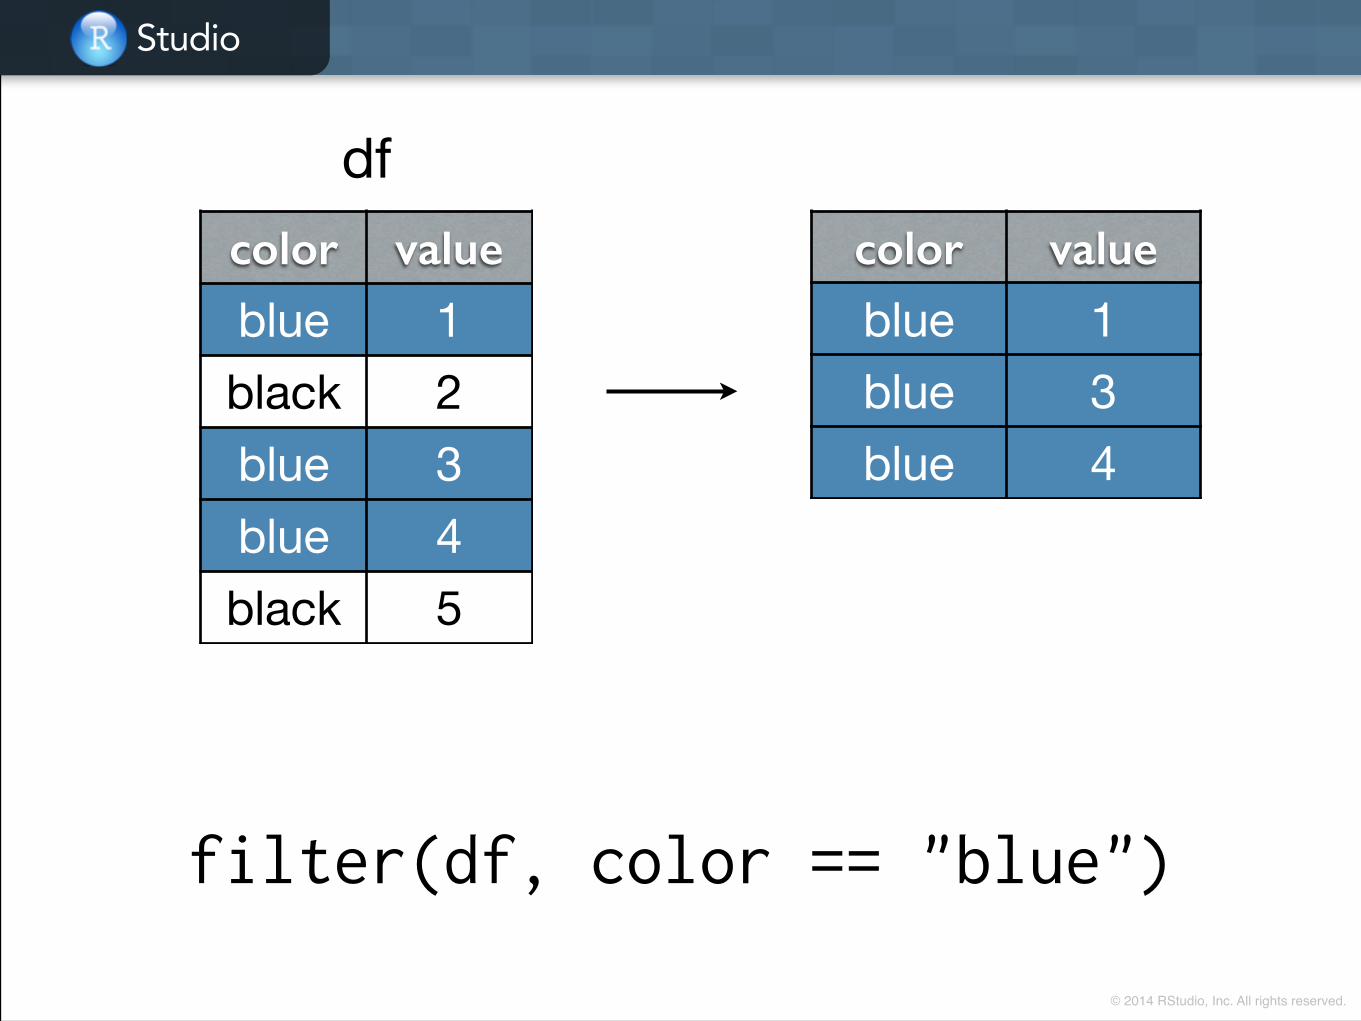
• filter: keep rows matching criteria
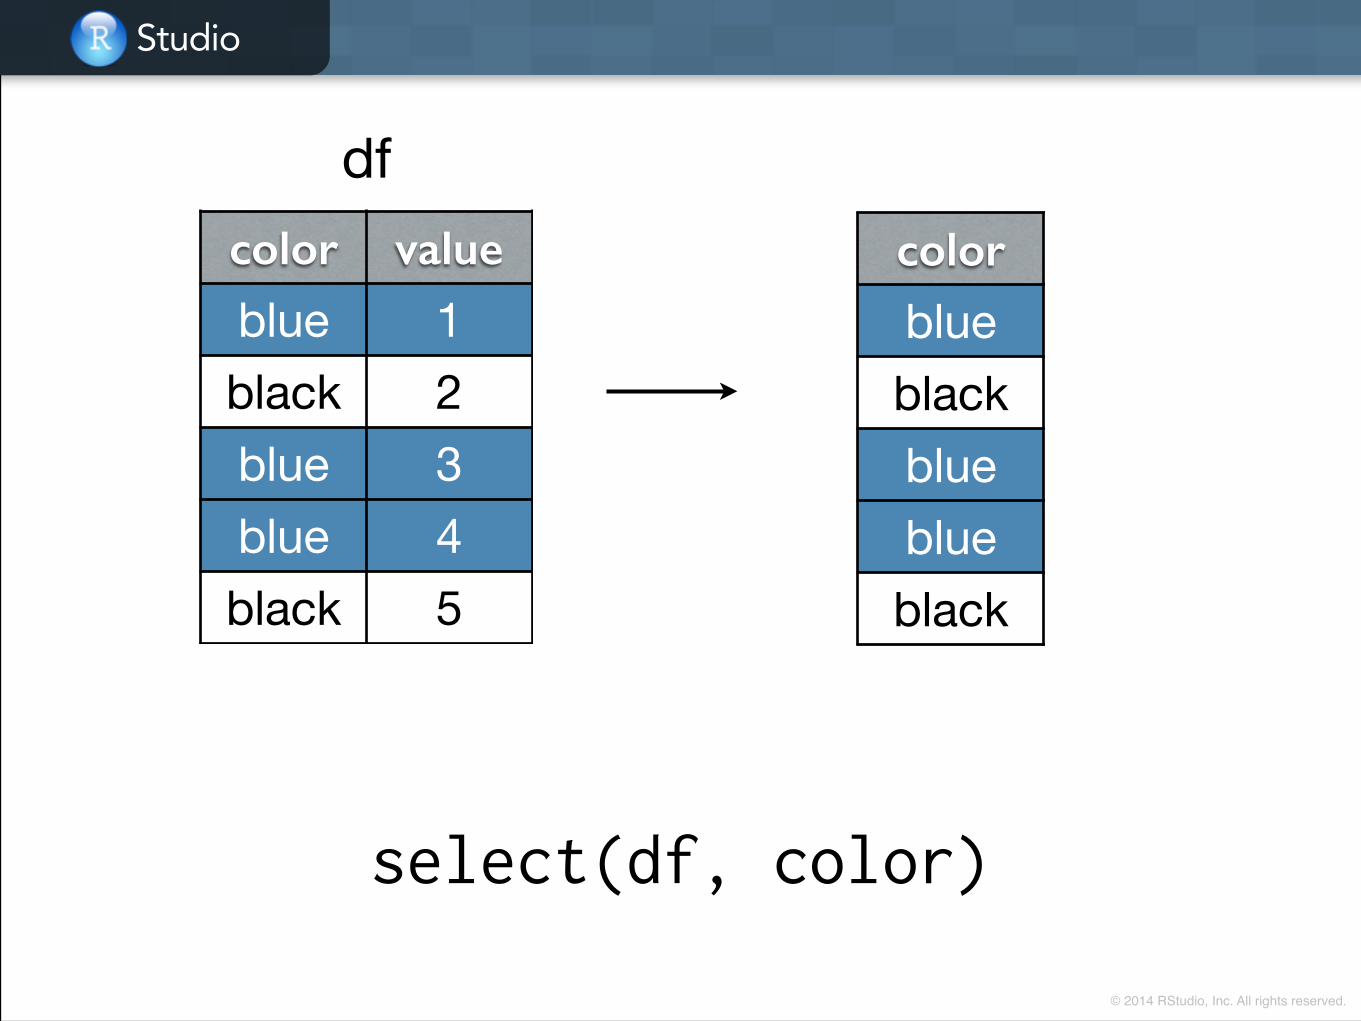
• select: pick columns by name
• arrange: reorder rows
• mutate: add new variables
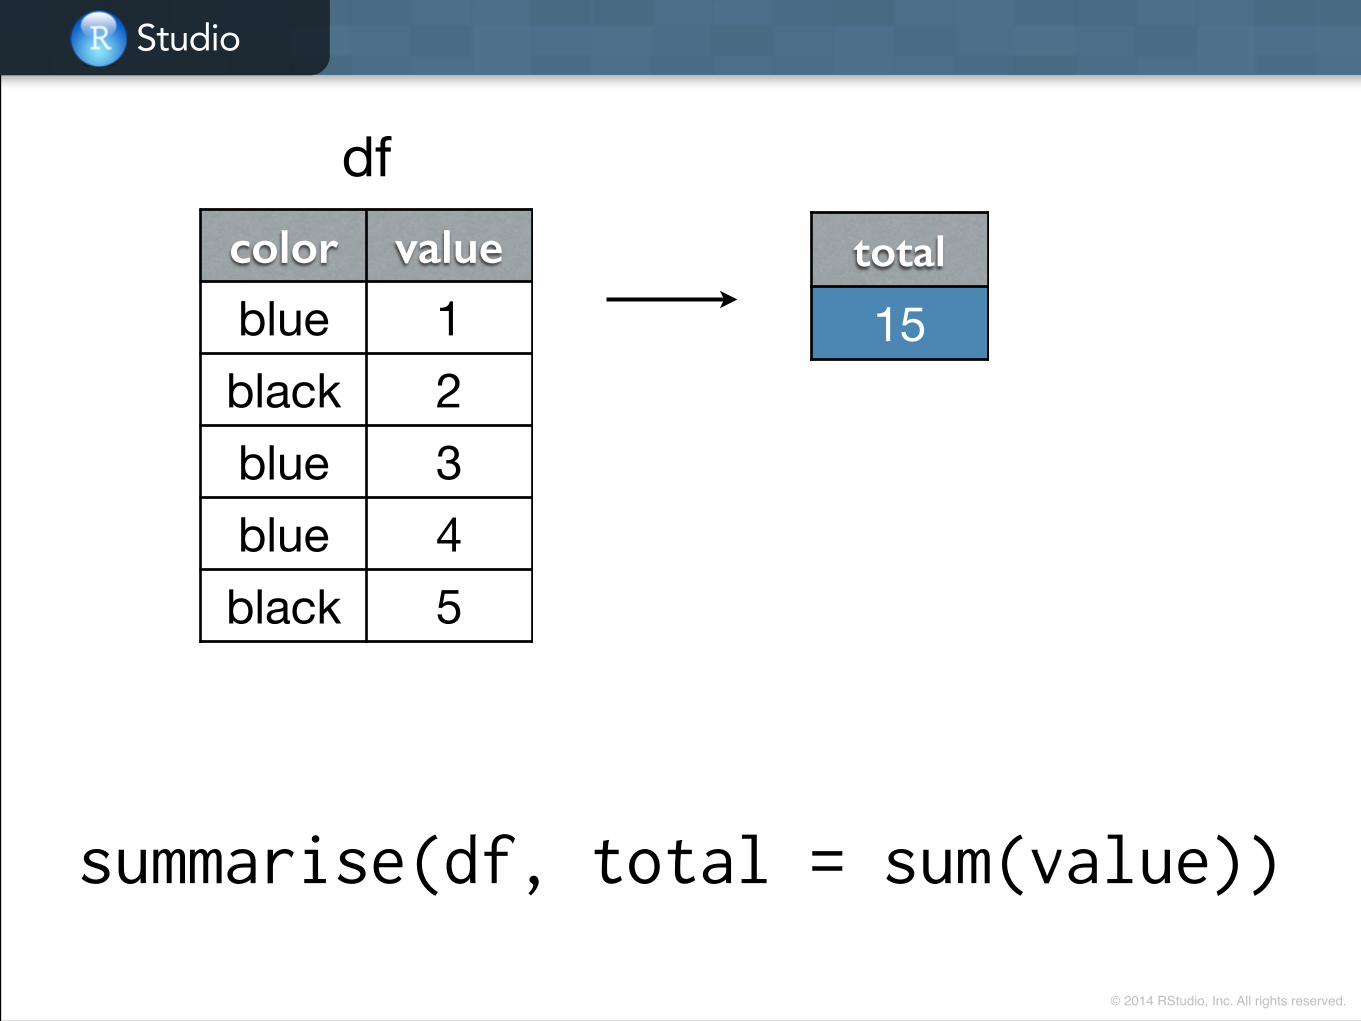
• summarise: reduce variables to values
Studio
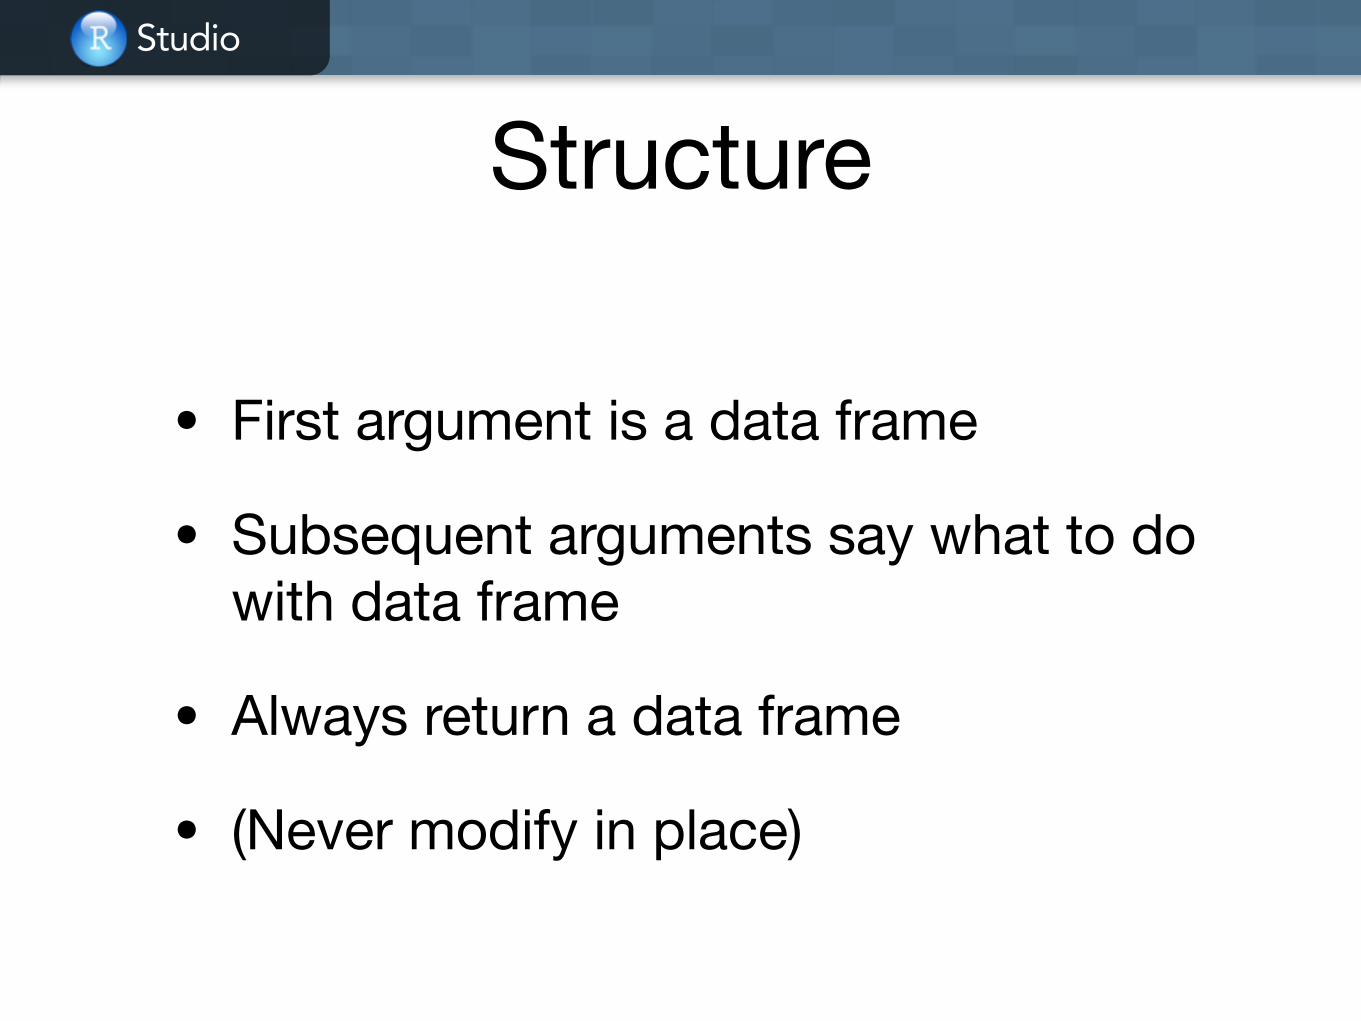
Structure
• First argument is a data frame
• Subsequent arguments say what to do with data frame
• Always return a data frame
• (Never modify in place)

Studio
df <- data.frame( color = c("blue", "black", "blue", "blue", "black"), value = 1:5)
StudioStudio
© 2014 RStudio, Inc. All rights reserved.
filter(df, color == "blue")
color value
blue 1black 2blue 3blue 4black 5
color value
blue 1blue 3blue 4
df

StudioStudio
© 2014 RStudio, Inc. All rights reserved.
filter(df, value %in% c(1, 4))
color value
blue 1black 2blue 3blue 4black 5
dfcolor value
blue 1blue 4

Studio
a
b
a | b
a & b
a & !b
xor(a, b)
x > 1 x >= 1 x < 1 x <= 1 x != 1 x == 1 x %in% ("a", "b")
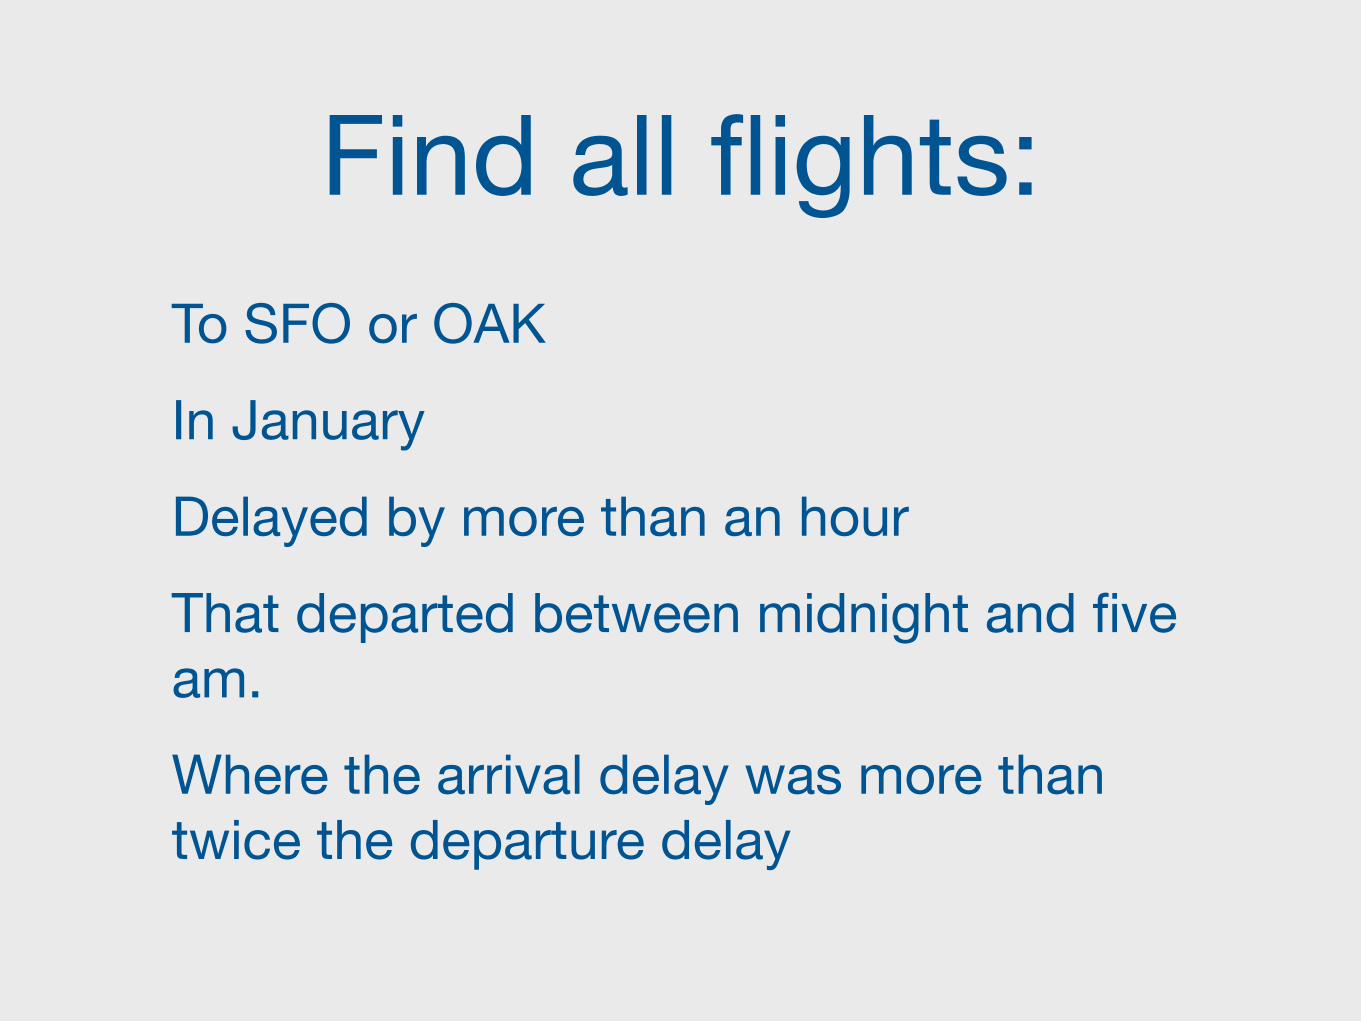
Find all flights:To SFO or OAKIn JanuaryDelayed by more than an hourThat departed between midnight and five am.Where the arrival delay was more than twice the departure delay

Studio
filter(flights, dest %in% c("SFO", "OAK")) filter(flights, dest == "SFO" | dest == "OAK") # Not this! filter(flights, dest == "SFO" | "OAK") !filter(flights, date < "2001-02-01") !filter(flights, hour >= 0, hour <= 5) filter(flights, hour >= 0 & hour <= 5) !filter(flights, dep_delay > 60) filter(flights, arr_delay > 2 * dep_delay)
StudioStudio
© 2014 RStudio, Inc. All rights reserved.
select(df, color)
color value
blue 1black 2blue 3blue 4black 5
dfcolor
blueblackblueblueblack

StudioStudio
© 2014 RStudio, Inc. All rights reserved.
select(df, -color)
color value
blue 1black 2blue 3blue 4black 5
dfvalue
12345
Your turn
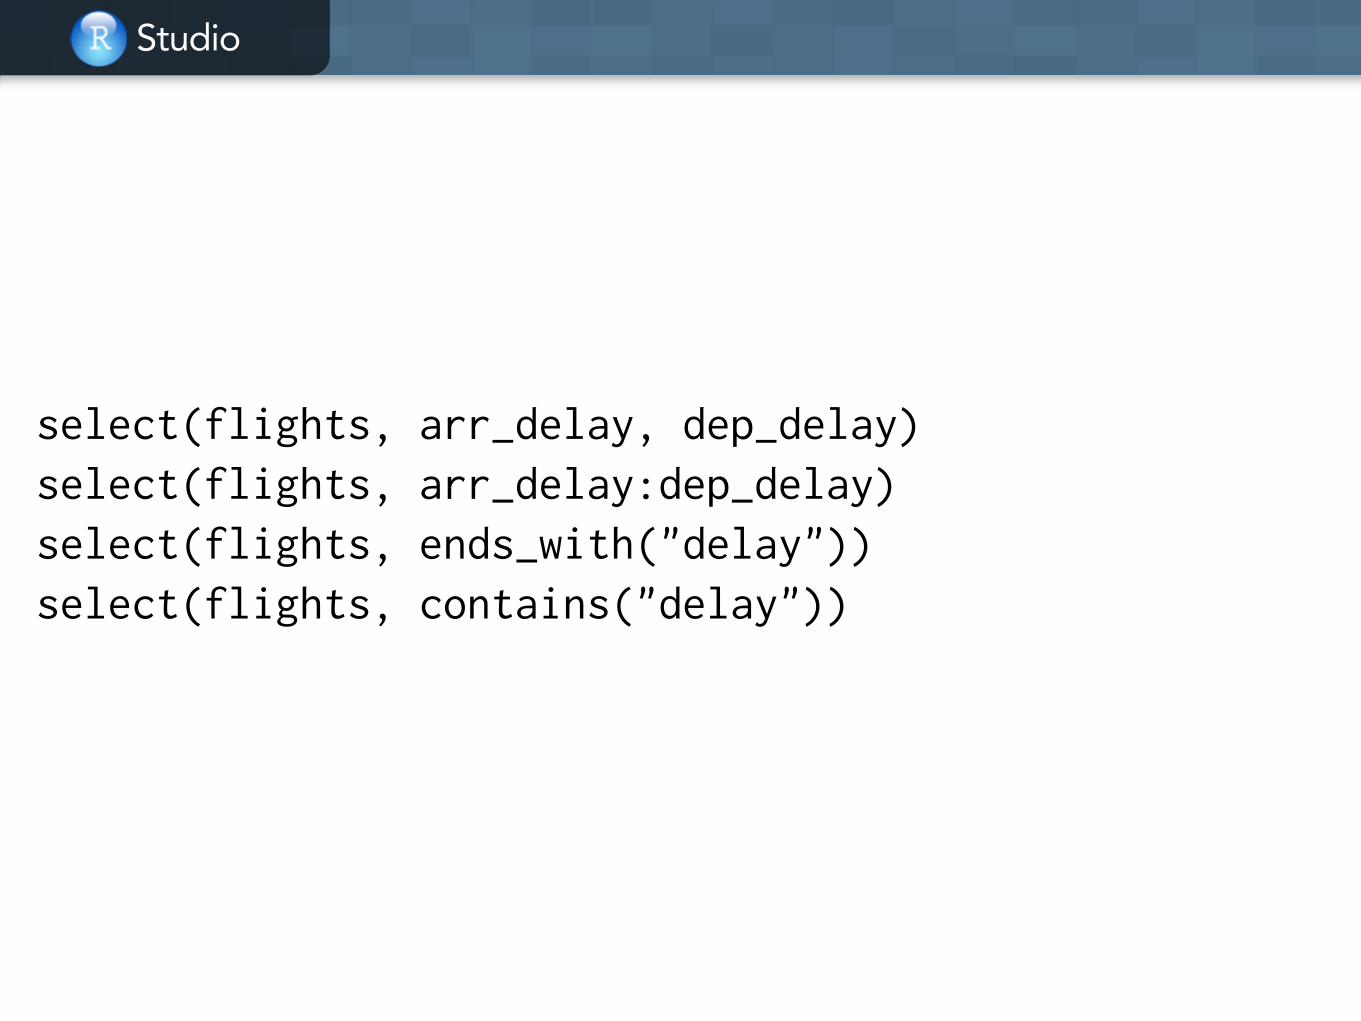
Read the help for select(). What other ways can you select variables?Write down three ways to select the two delay variables.
Studio
select(flights, arr_delay, dep_delay) select(flights, arr_delay:dep_delay) select(flights, ends_with("delay")) select(flights, contains("delay"))

StudioStudio
© 2014 RStudio, Inc. All rights reserved.
arrange(df, color)
color value
4 11 25 33 42 5
color value
1 22 53 44 15 3
df

StudioStudio
© 2014 RStudio, Inc. All rights reserved.
arrange(df, desc(color))
color value
4 11 25 33 42 5
color value
5 34 13 42 51 2
df
Your turn
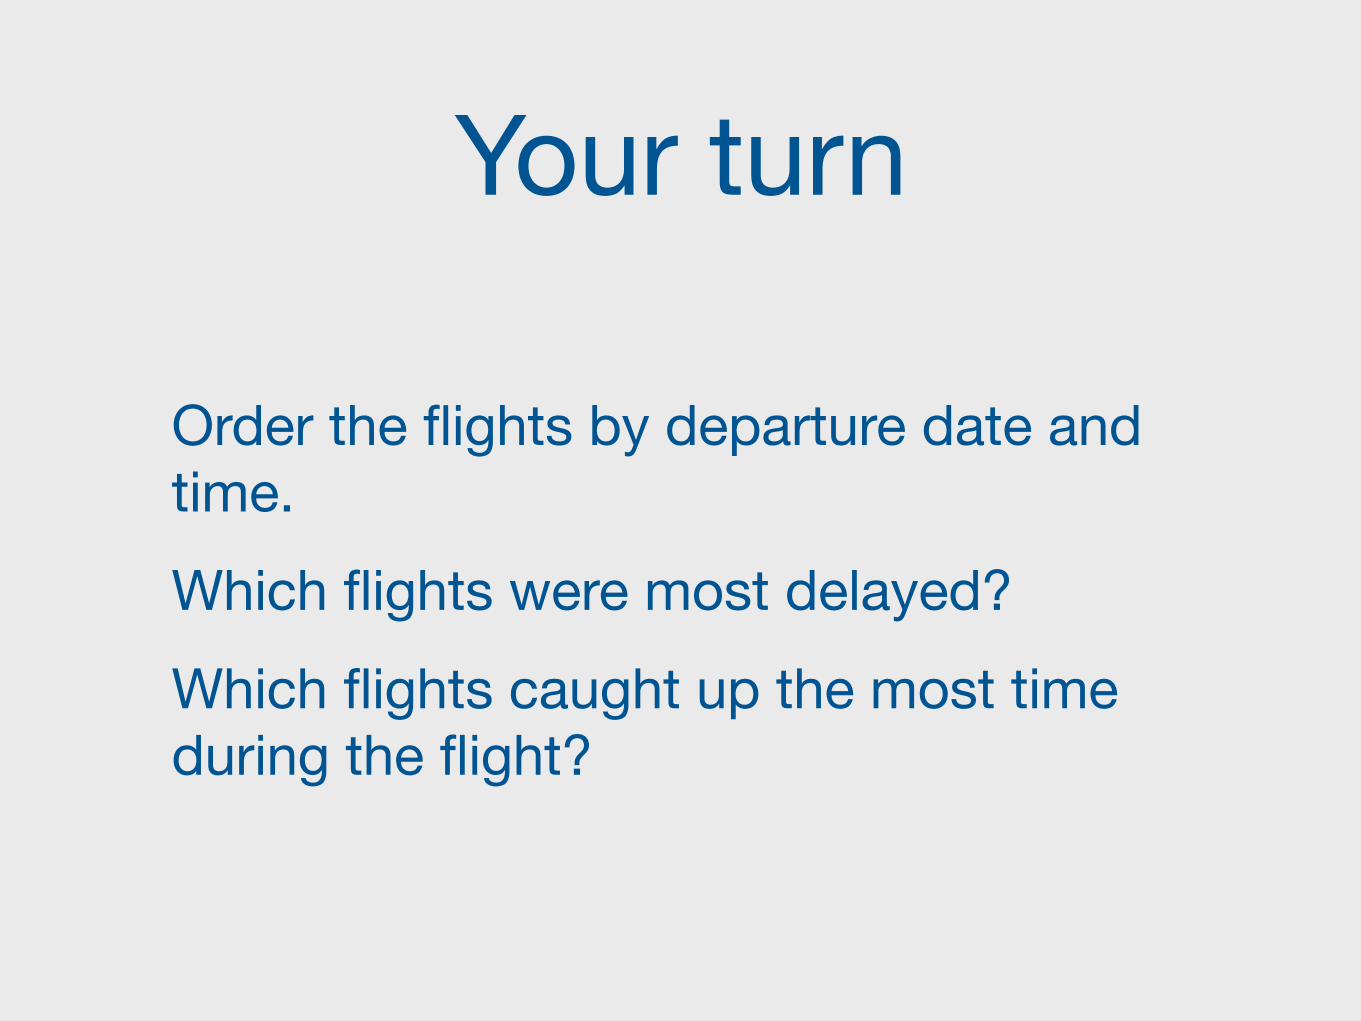
Order the flights by departure date and time.Which flights were most delayed?Which flights caught up the most time during the flight?

Studio
arrange(flights, date, hour, minute) !arrange(flights, desc(dep_delay)) arrange(flights, desc(arr_delay)) !arrange(flights, desc(dep_delay - arr_delay))

StudioStudio
© 2014 RStudio, Inc. All rights reserved.
mutate(df, double = 2 * value)
color valueblue 1black 2blue 3blue 4black 5
color value doubleblue 1 2black 2 4blue 3 6blue 4 8black 5 10
df
StudioStudio
© 2014 RStudio, Inc. All rights reserved.
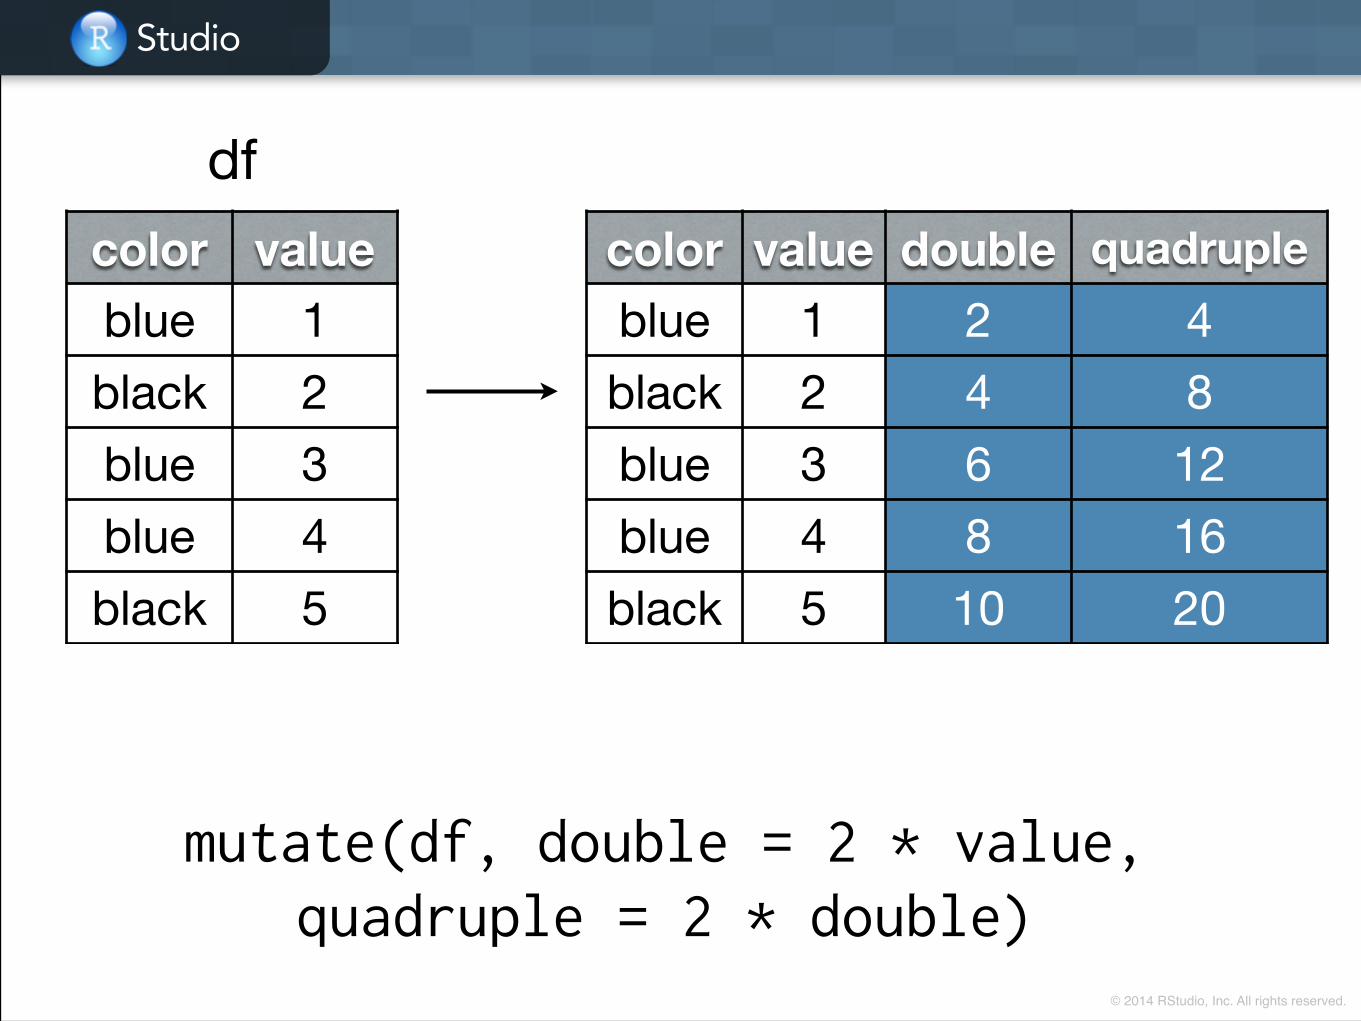
color value double quadrupleblue 1 2 4black 2 4 8blue 3 6 12blue 4 8 16black 5 10 20
mutate(df, double = 2 * value, quadruple = 2 * double)
color valueblue 1black 2blue 3blue 4black 5
df
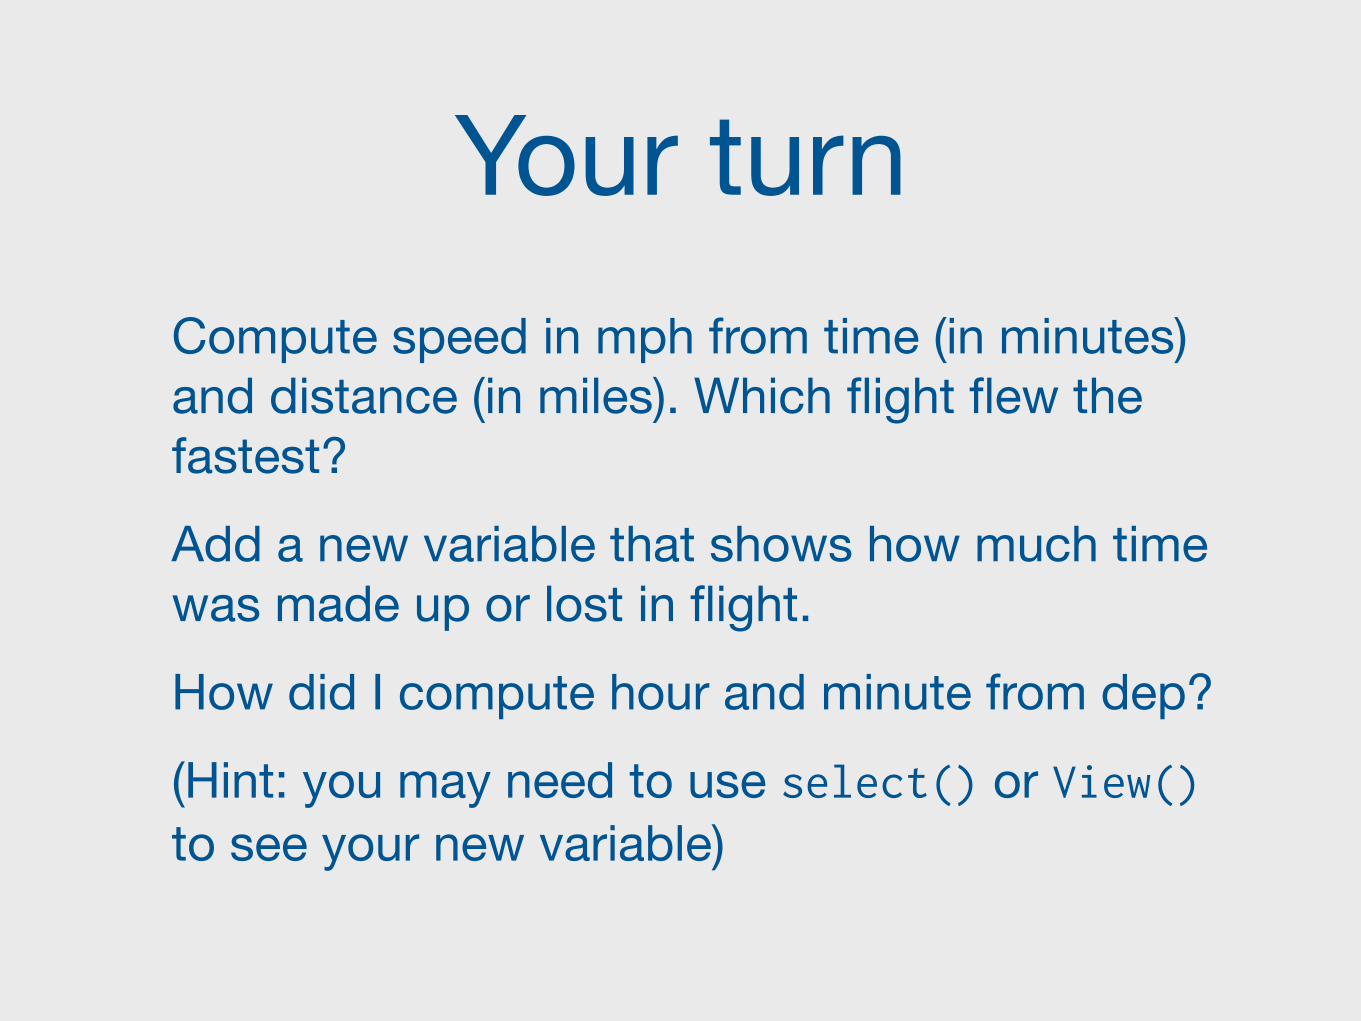
Your turnCompute speed in mph from time (in minutes) and distance (in miles). Which flight flew the fastest?Add a new variable that shows how much time was made up or lost in flight.How did I compute hour and minute from dep?(Hint: you may need to use select() or View() to see your new variable)

Studio
flights <- mutate(flights, speed = dist / (time / 60)) arrange(flights, desc(speed)) !mutate(flights, delta = dep_delay - arr_delay) !mutate(flights, hour = dep %/% 100, minute = dep %% 100)

Grouped summarise
StudioStudio
© 2014 RStudio, Inc. All rights reserved.
summarise(df, total = sum(value))
color value
blue 1black 2blue 3blue 4black 5
total
15
df

StudioStudio
© 2014 RStudio, Inc. All rights reserved.
by_color <- group_by(df, color) summarise(by_color, total = sum(value))
color value
blue 1black 2blue 3blue 4black 5
color total
blue 8black 7
df
Studio
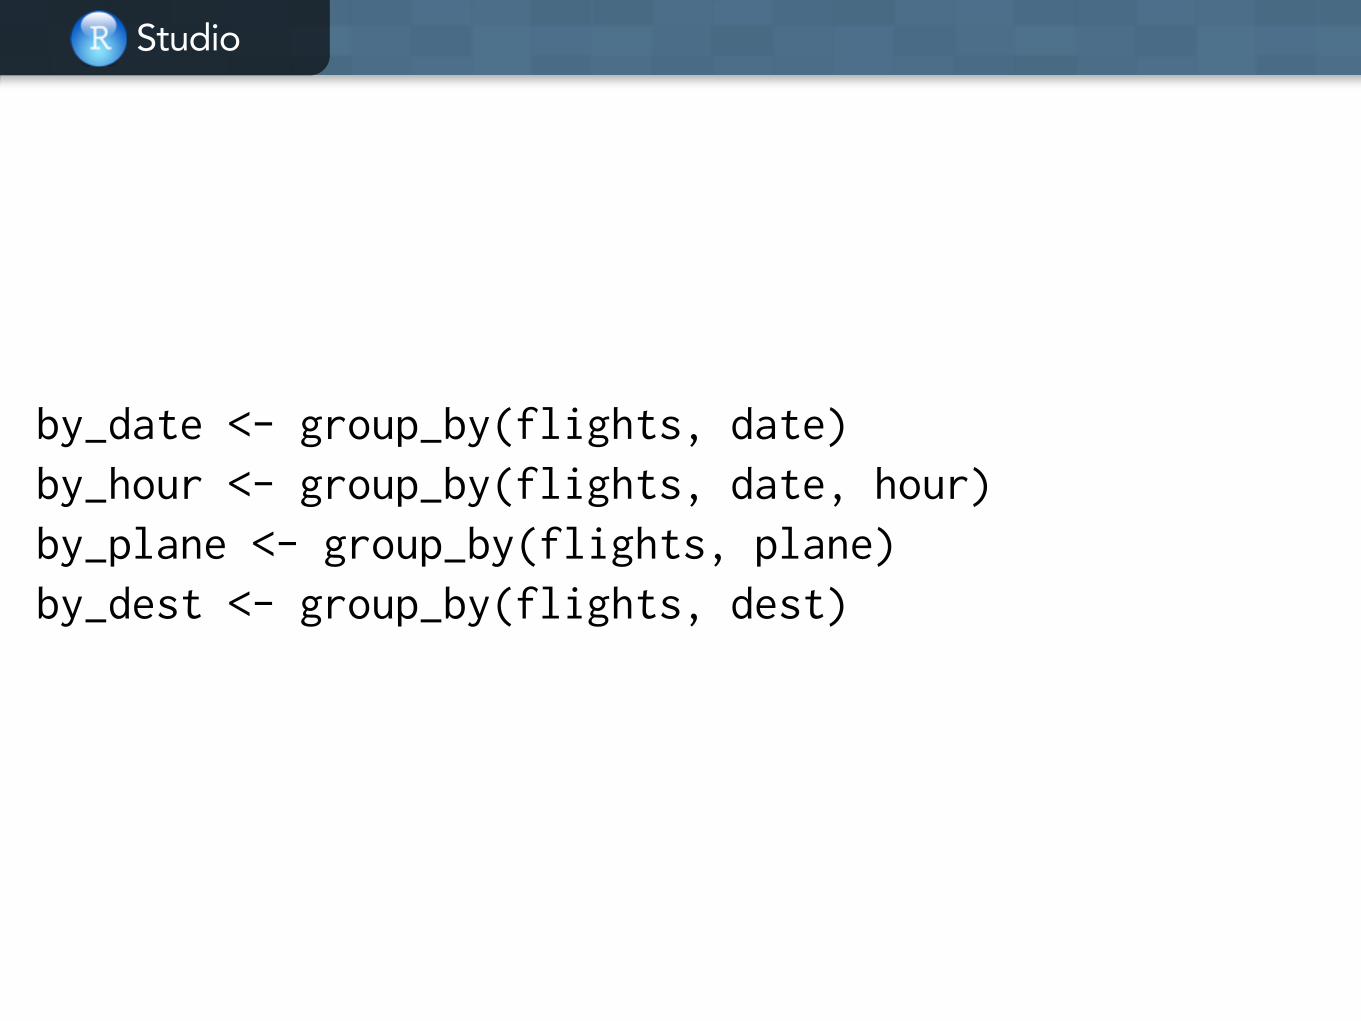
by_date <- group_by(flights, date) by_hour <- group_by(flights, date, hour) by_plane <- group_by(flights, plane) by_dest <- group_by(flights, dest)
Studio
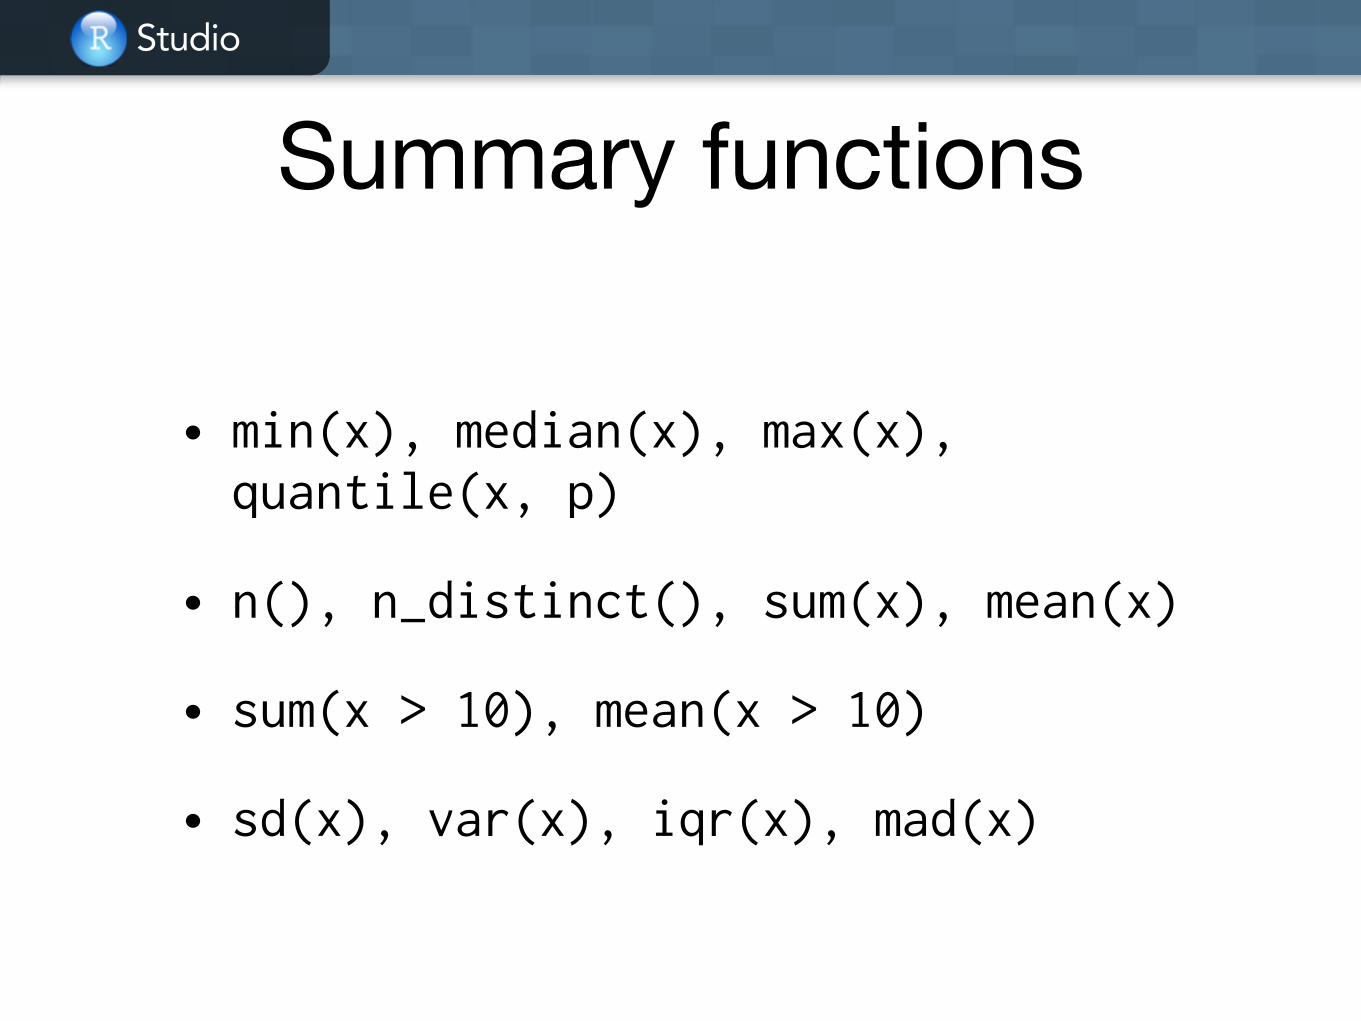
Summary functions
• min(x), median(x), max(x), quantile(x, p)
• n(), n_distinct(), sum(x), mean(x)
• sum(x > 10), mean(x > 10)
• sd(x), var(x), iqr(x), mad(x)

Your turnHow might you summarise dep_delay for each day? Brainstorm for 2 minutes.
0
5000
10000
15000
0 250 500 750 1000dep_delay
count
0
5000
10000
15000
0 25 50 75 100 125dep_delay
count
Studio
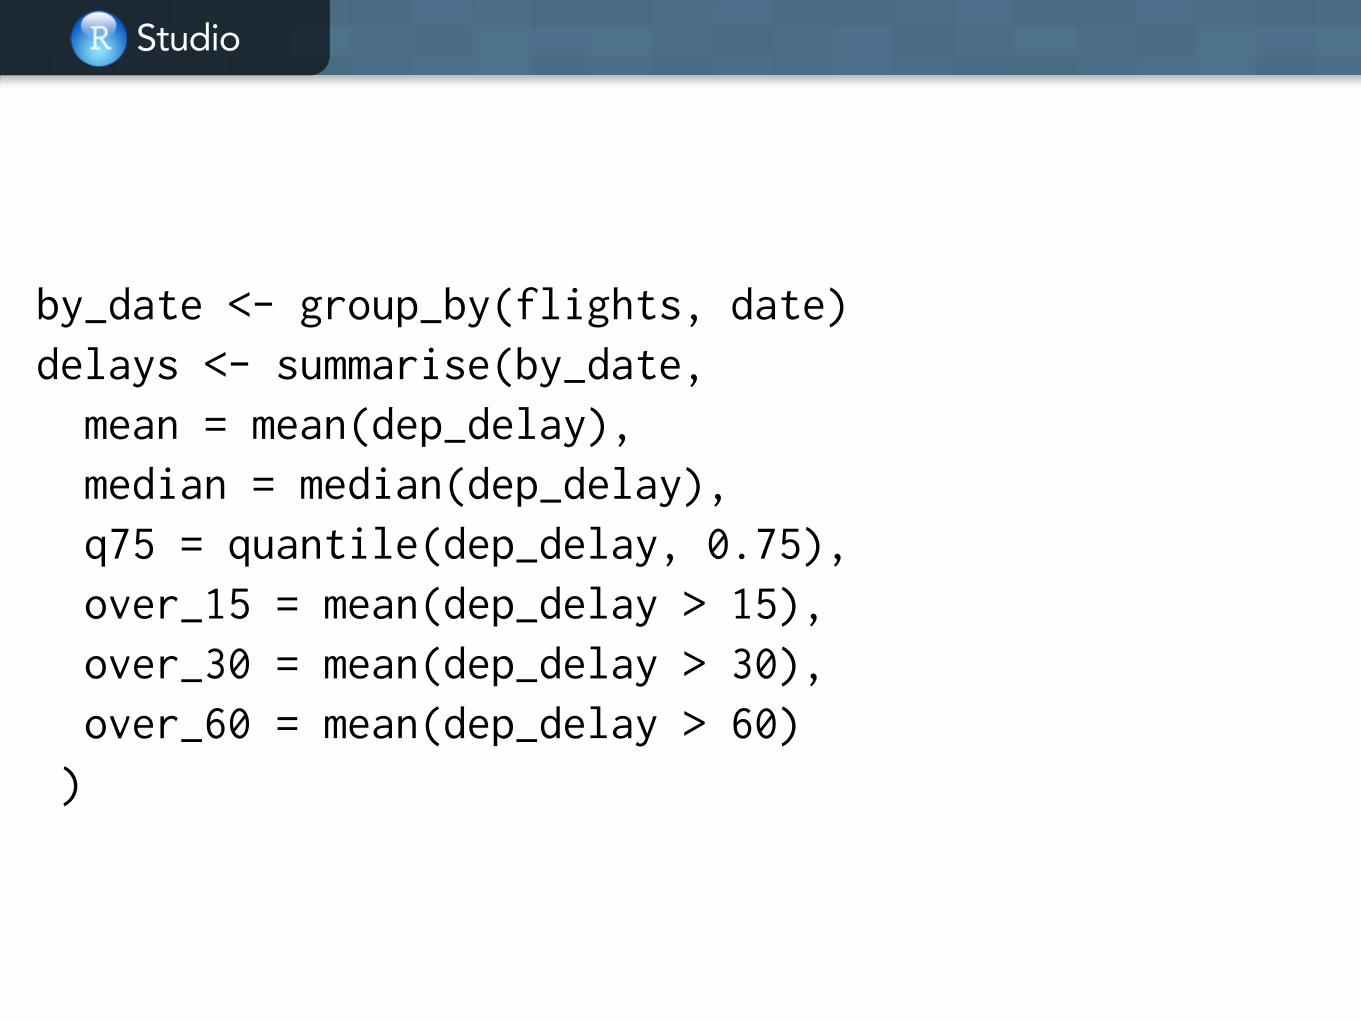
!by_date <- group_by(flights, date) delays <- summarise(by_date, mean = mean(dep_delay), median = median(dep_delay), q75 = quantile(dep_delay, 0.75), over_15 = mean(dep_delay > 15), over_30 = mean(dep_delay > 30), over_60 = mean(dep_delay > 60) )

Studio
!by_date <- group_by(flights, date) delays <- summarise(by_date, mean = mean(dep_delay, na.rm = TRUE), median = median(dep_delay, na.rm = TRUE), q75 = quantile(dep_delay, 0.75, na.rm = TRUE), over_15 = mean(dep_delay > 15, na.rm = TRUE), over_30 = mean(dep_delay > 30, na.rm = TRUE), over_60 = mean(dep_delay > 60, na.rm = TRUE) )
Studio
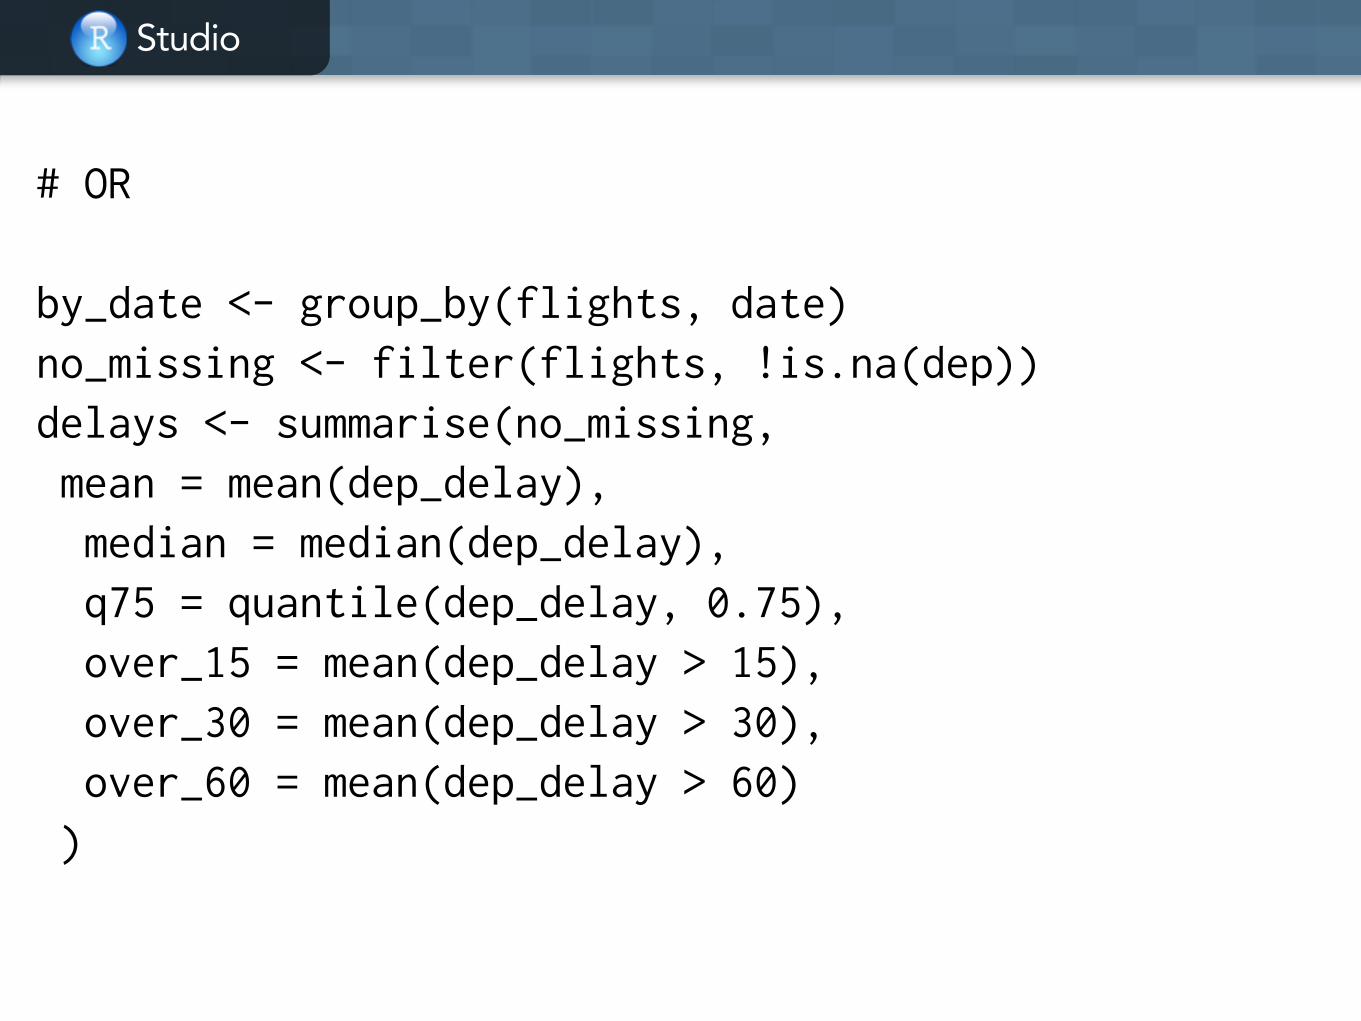
# OR !by_date <- group_by(flights, date) no_missing <- filter(flights, !is.na(dep)) delays <- summarise(no_missing, mean = mean(dep_delay), median = median(dep_delay), q75 = quantile(dep_delay, 0.75), over_15 = mean(dep_delay > 15), over_30 = mean(dep_delay > 30), over_60 = mean(dep_delay > 60) )

Data pipelines
Studio
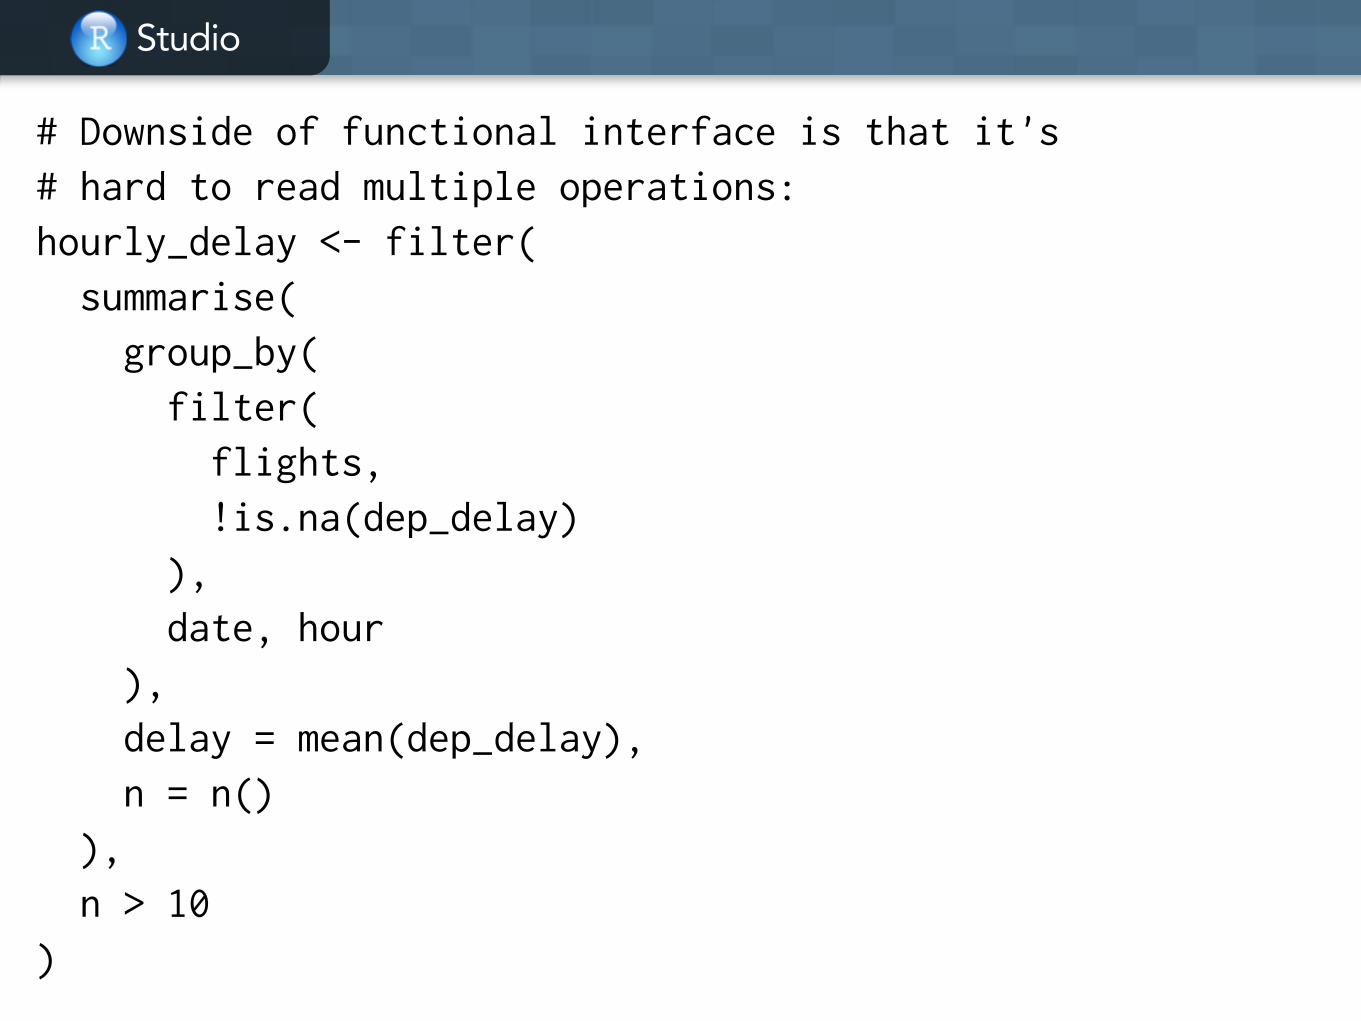
# Downside of functional interface is that it's # hard to read multiple operations: hourly_delay <- filter( summarise( group_by( filter( flights, !is.na(dep_delay) ), date, hour ), delay = mean(dep_delay), n = n() ), n > 10 )

Studio
# Solution: the pipe operator from magrittr # x %>% f(y) -> f(x, y) !hourly_delay <- flights %>% filter(!is.na(dep_delay)) %>% group_by(date, hour) %>% summarise(delay = mean(dep_delay), n = n()) %>% filter(n > 10) !# Hint: pronounce %>% as then

Your turnCreate data pipelines to answer the following questions:Which destinations have the highest average delays? Which flights (i.e. carrier + flight) happen every day? Where do they fly to?On average, how do delays (of non-cancelled flights) vary over the course of a day? (Hint: hour + minute / 60)
Studio
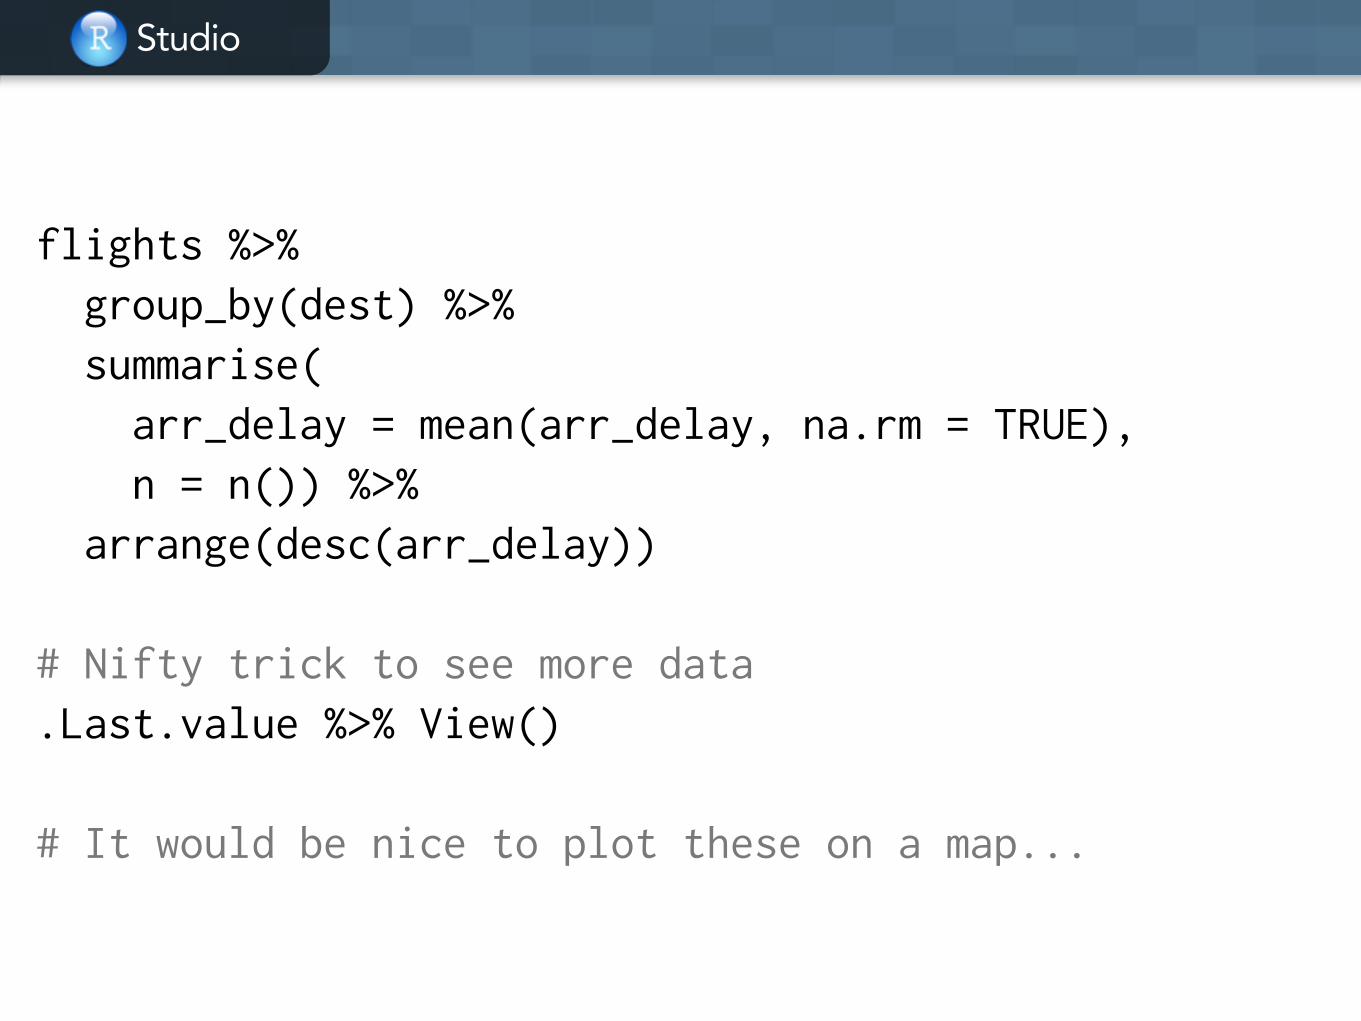
flights %>% group_by(dest) %>% summarise( arr_delay = mean(arr_delay, na.rm = TRUE), n = n()) %>% arrange(desc(arr_delay)) !# Nifty trick to see more data .Last.value %>% View() !# It would be nice to plot these on a map...

Studio
flights %>% group_by(carrier, flight, dest) %>% tally(sort = TRUE) %>% # Save some typing filter(n == 365) !flights %>% group_by(carrier, flight, dest) %>% summarise(n = n()) %>% arrange(desc(n)) %>% filter(n == 365) !# Slightly different answer flights %>% group_by(carrier, flight) %>% filter(n() == 365)
Studio
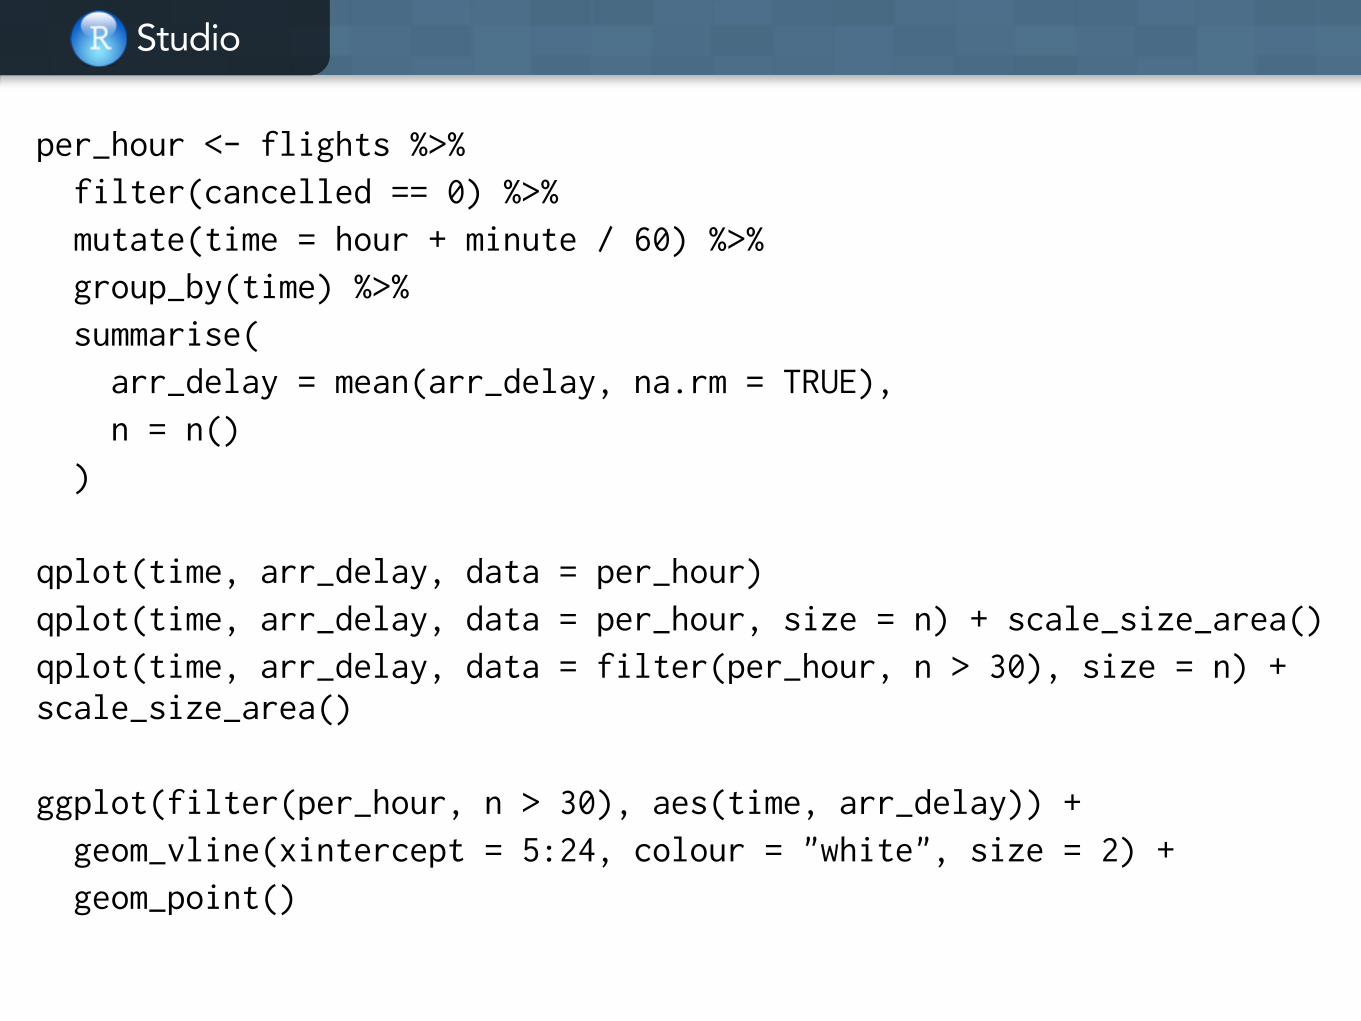
per_hour <- flights %>% filter(cancelled == 0) %>% mutate(time = hour + minute / 60) %>% group_by(time) %>% summarise( arr_delay = mean(arr_delay, na.rm = TRUE), n = n() ) !qplot(time, arr_delay, data = per_hour) qplot(time, arr_delay, data = per_hour, size = n) + scale_size_area() qplot(time, arr_delay, data = filter(per_hour, n > 30), size = n) + scale_size_area() !ggplot(filter(per_hour, n > 30), aes(time, arr_delay)) + geom_vline(xintercept = 5:24, colour = "white", size = 2) + geom_point()

Grouped mutate/filter

Studio
Groupwise variables
• Creating new variables within a group is also often useful.
• Sometime that’s a combination of aggregation and recycling, e.g. z = (x - mean(x)) / sd(x)
• Other times you need a window function
• More details in vignette("window-functions")

Studio
# Example: !planes <- flights %>% filter(!is.na(arr_delay)) %>% group_by(plane) %>% filter(n() > 30) !planes %>% mutate(z_delay = (arr_delay - mean(arr_delay)) / sd(arr_delay)) %>% filter(z_delay > 5) !planes %>% filter(min_rank(arr_delay) < 5)
Studio
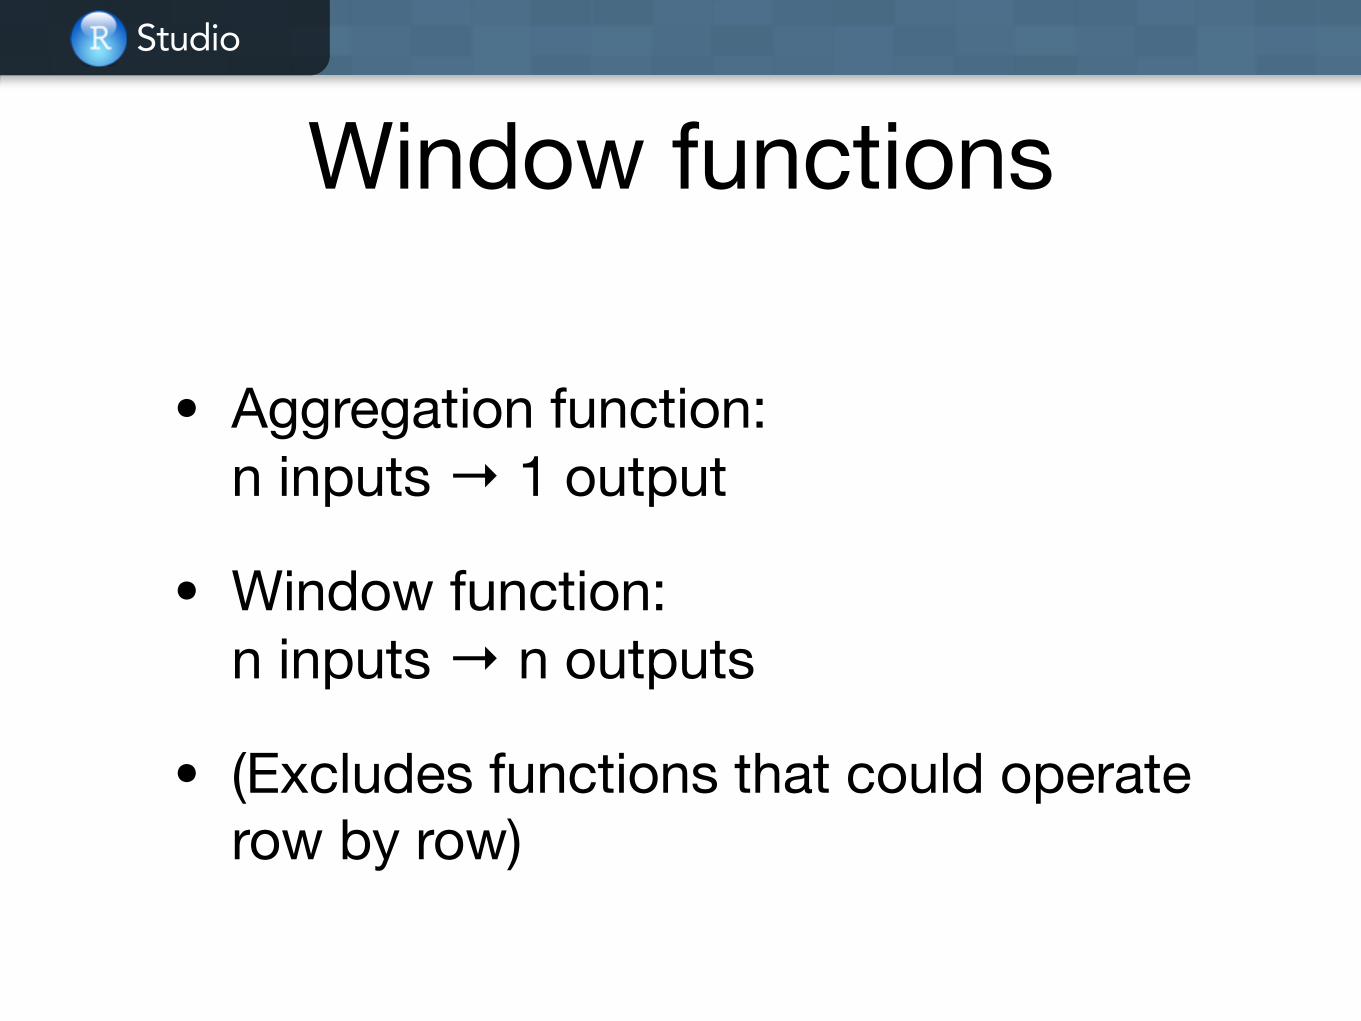
Window functions
• Aggregation function: n inputs → 1 output
• Window function: n inputs → n outputs
• (Excludes functions that could operate row by row)

Studio
Types of window functions
• Ranking and ordering
• Offsets: lead & lag
• Cumulative aggregates
• Rolling aggregates

Your turn
What’s the difference between min_rank(), row_number() and dense_rank()?
For each plane, find the two most delayed flights. Which of the three rank functions is most appropriate?

Studio
min_rank(c(1, 1, 2, 3)) dense_rank(c(1, 1, 2, 3)) row_number(c(1, 1, 2, 3)) !flights %>% group_by(plane) %>% filter(row_number(desc(arr_delay)) <= 2) !flights %>% group_by(plane) %>% filter(min_rank(desc(arr_delay)) <= 2) !flights %>% group_by(plane) %>% filter(dense_rank(desc(arr_delay)) <= 2)
Studio
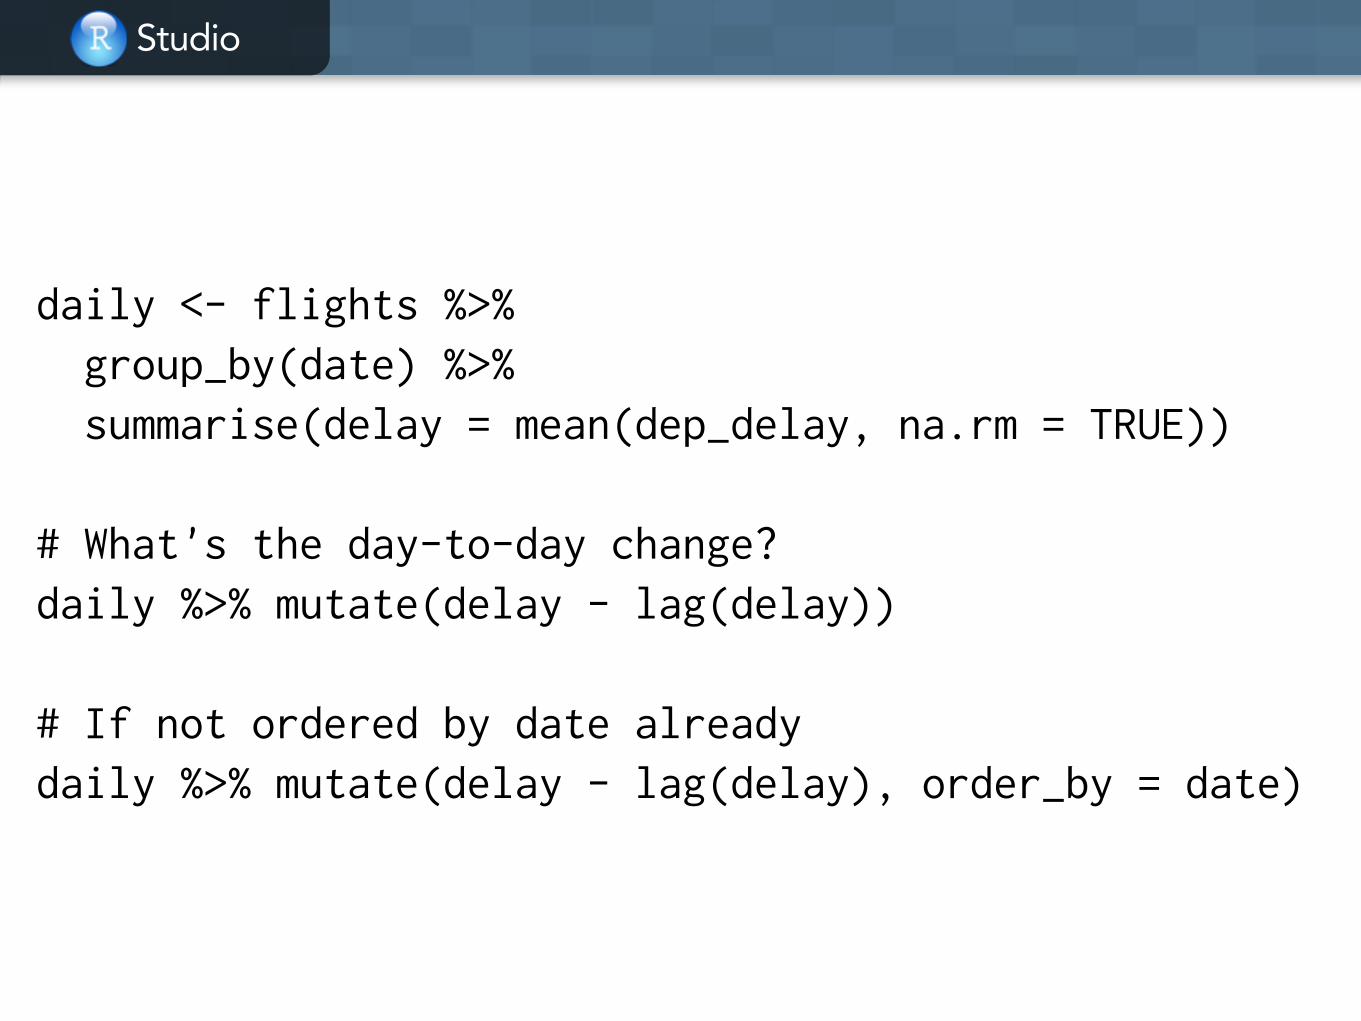
daily <- flights %>% group_by(date) %>% summarise(delay = mean(dep_delay, na.rm = TRUE)) !# What's the day-to-day change? daily %>% mutate(delay - lag(delay)) !# If not ordered by date already daily %>% mutate(delay - lag(delay), order_by = date)

Studio
Other uses
• Was there a change? x != lag(x)
• Percent change? (x - lag(x)) / x
• Fold-change? x / lag(x)
• Previously false, now true? !lag(x) & x

Two table verbs
Studio
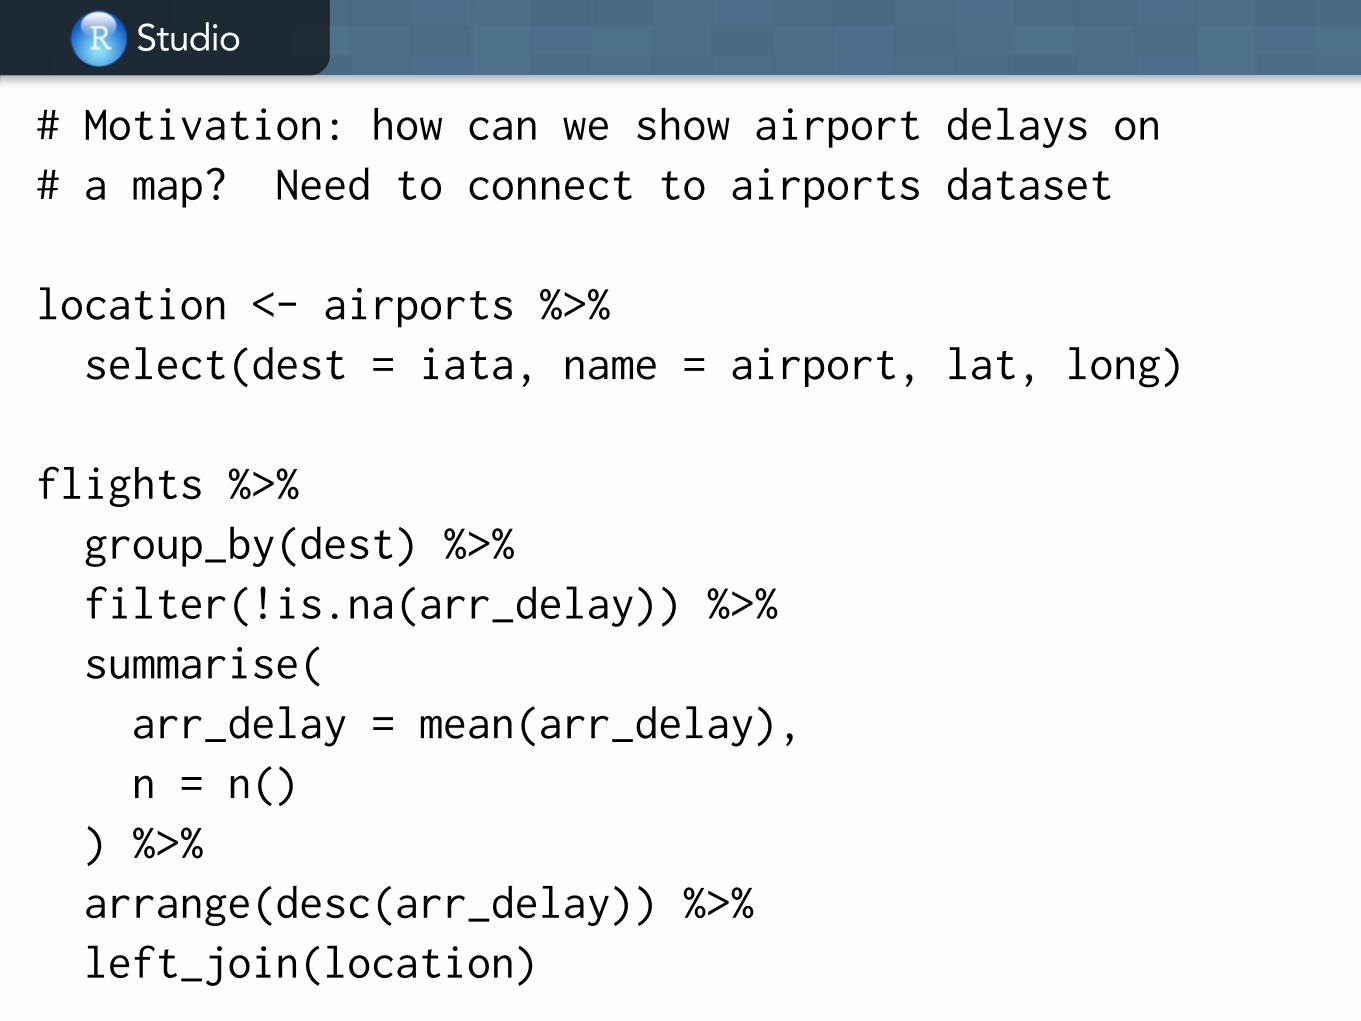
# Motivation: how can we show airport delays on # a map? Need to connect to airports dataset !location <- airports %>% select(dest = iata, name = airport, lat, long) !flights %>% group_by(dest) %>% filter(!is.na(arr_delay)) %>% summarise( arr_delay = mean(arr_delay), n = n() ) %>% arrange(desc(arr_delay)) %>% left_join(location)
StudioStudio
© 2014 RStudio, Inc. All rights reserved.
name bandJohn TPaul T
George TRingo TBrian F
name instrumentJohn guitarPaul bass
George guitarRingo drumsStuart bassPete drums
+ = ?
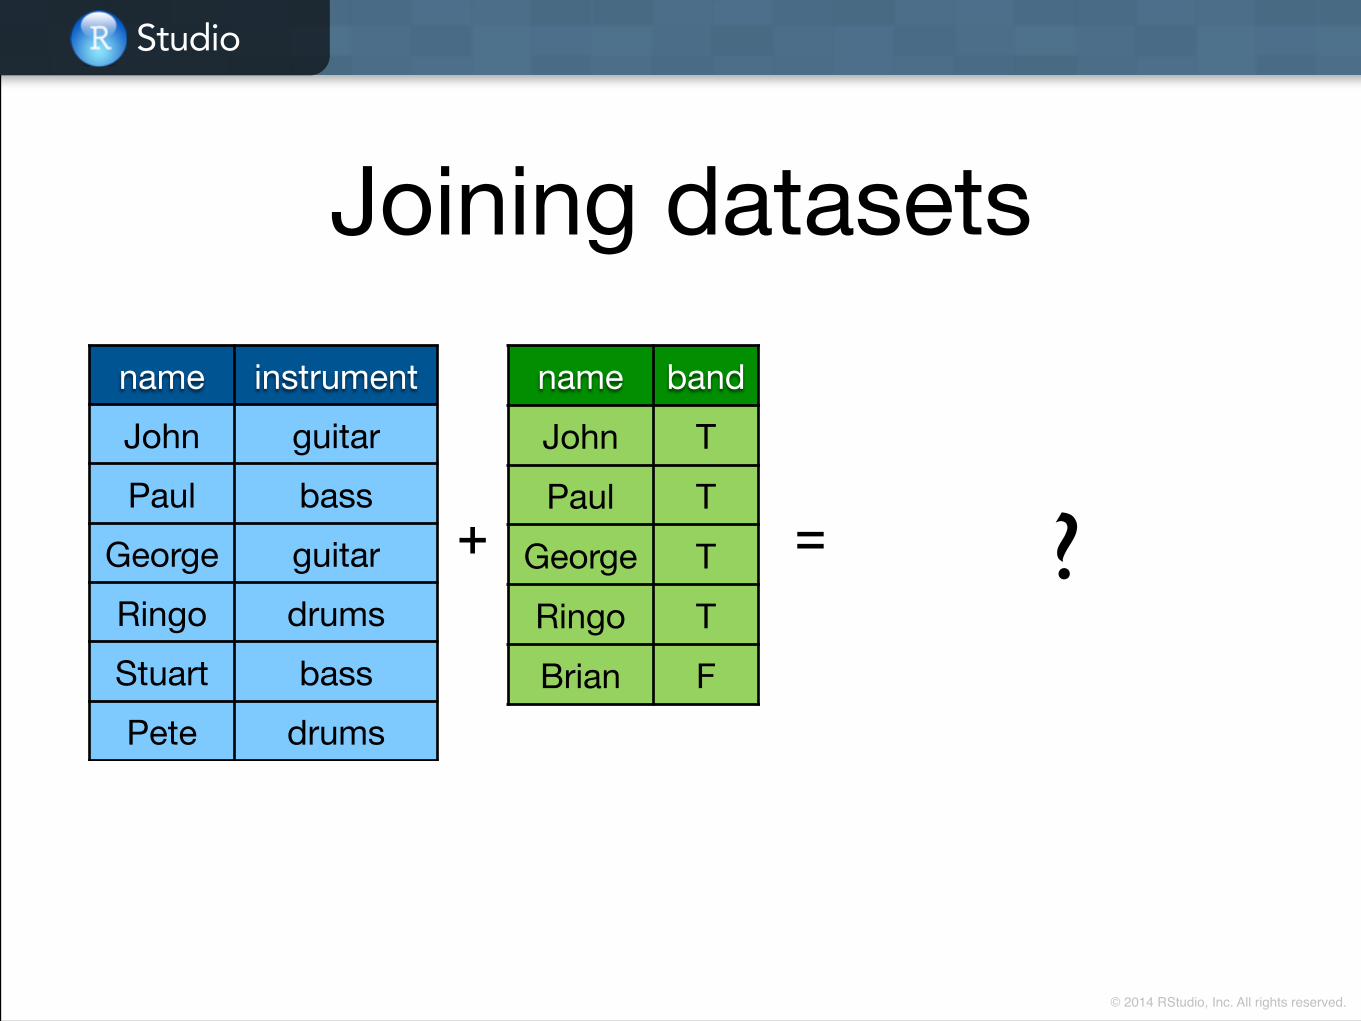
Joining datasets
StudioStudio
© 2014 RStudio, Inc. All rights reserved.
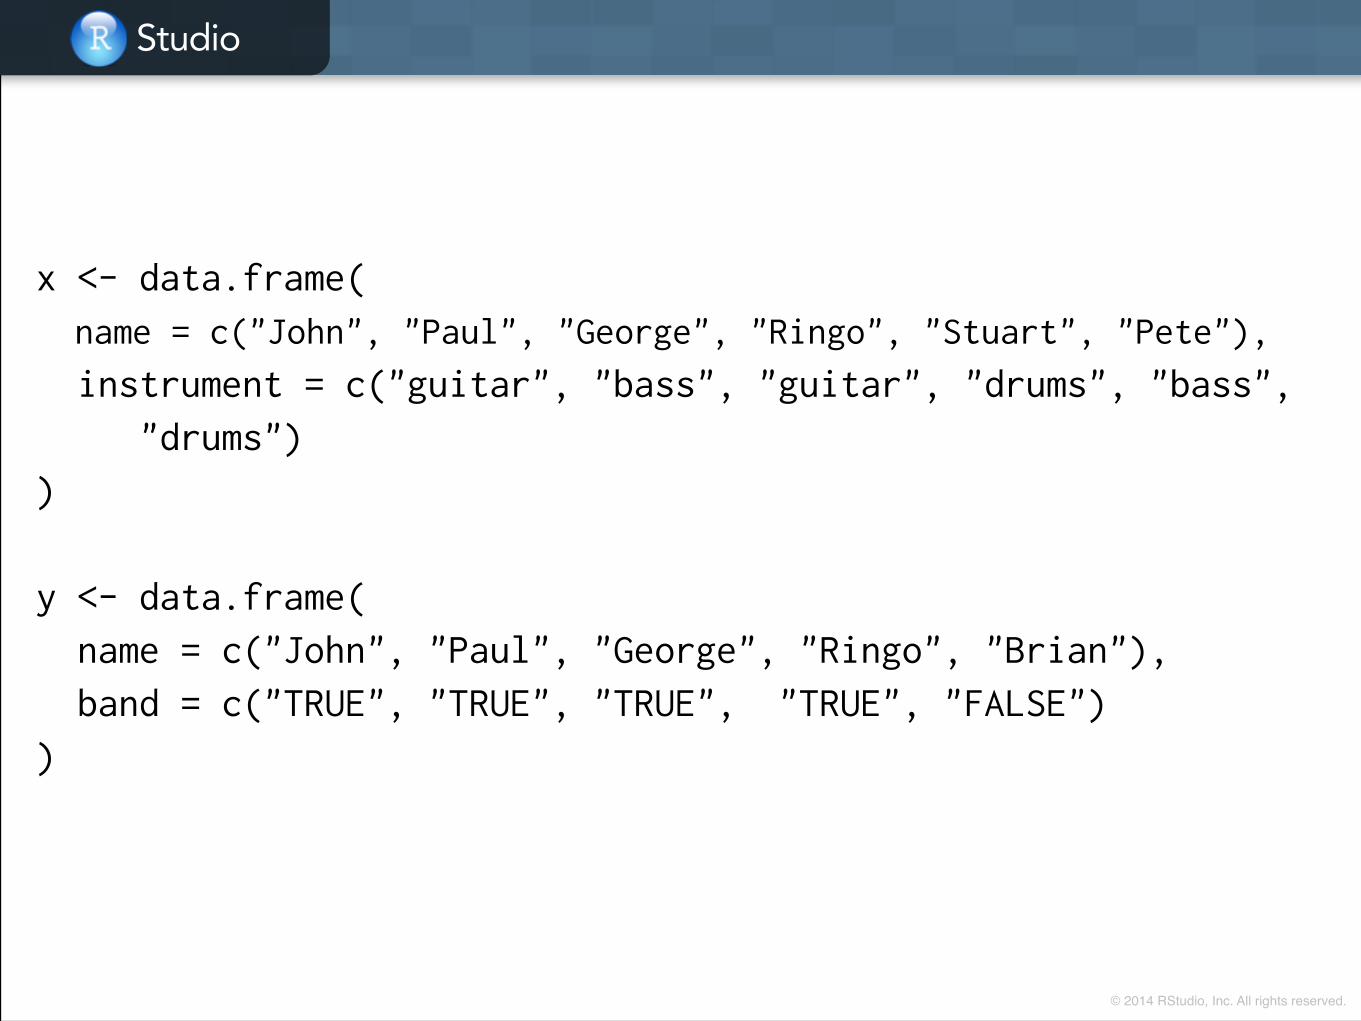
x <- data.frame( name = c("John", "Paul", "George", "Ringo", "Stuart", "Pete"), instrument = c("guitar", "bass", "guitar", "drums", "bass", "drums") ) !y <- data.frame( name = c("John", "Paul", "George", "Ringo", "Brian"), band = c("TRUE", "TRUE", "TRUE", "TRUE", "FALSE") )

StudioStudio
© 2014 RStudio, Inc. All rights reserved.
name instrument bandJohn guitar TPaul bass T
George guitar TRingo drums T
x y
+ =
inner_join(x, y)
name instrumentJohn guitarPaul bass
George guitarRingo drumsStuart bassPete drums
name bandJohn TPaul T
George TRingo TBrian F

StudioStudio
© 2014 RStudio, Inc. All rights reserved.
name instrumentJohn guitarPaul bass
George guitarRingo drumsStuart bassPete drums
name bandJohn TPaul T
George TRingo TBrian F
name instrument bandJohn guitar TPaul bass T
George guitar TRingo drums TStuart bass NAPete drums NA
x y
+ =
left_join(x, y)
StudioStudio
© 2014 RStudio, Inc. All rights reserved.
name instrumentJohn guitarPaul bass
George guitarRingo drums
x y
+ =
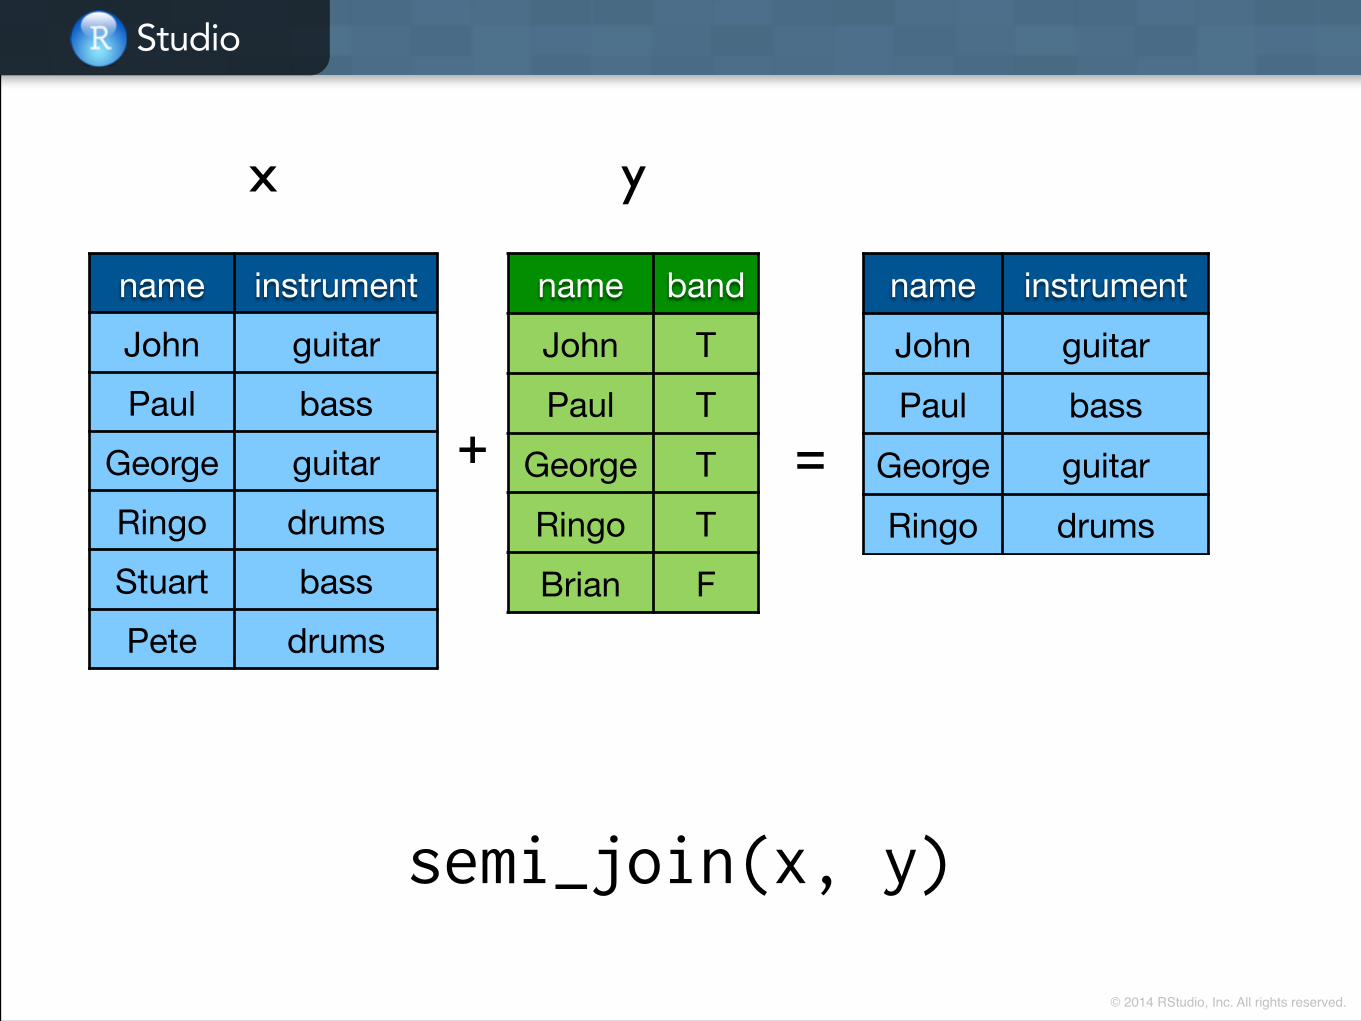
semi_join(x, y)
name instrumentJohn guitarPaul bass
George guitarRingo drumsStuart bassPete drums
name bandJohn TPaul T
George TRingo TBrian F
StudioStudio
© 2014 RStudio, Inc. All rights reserved.
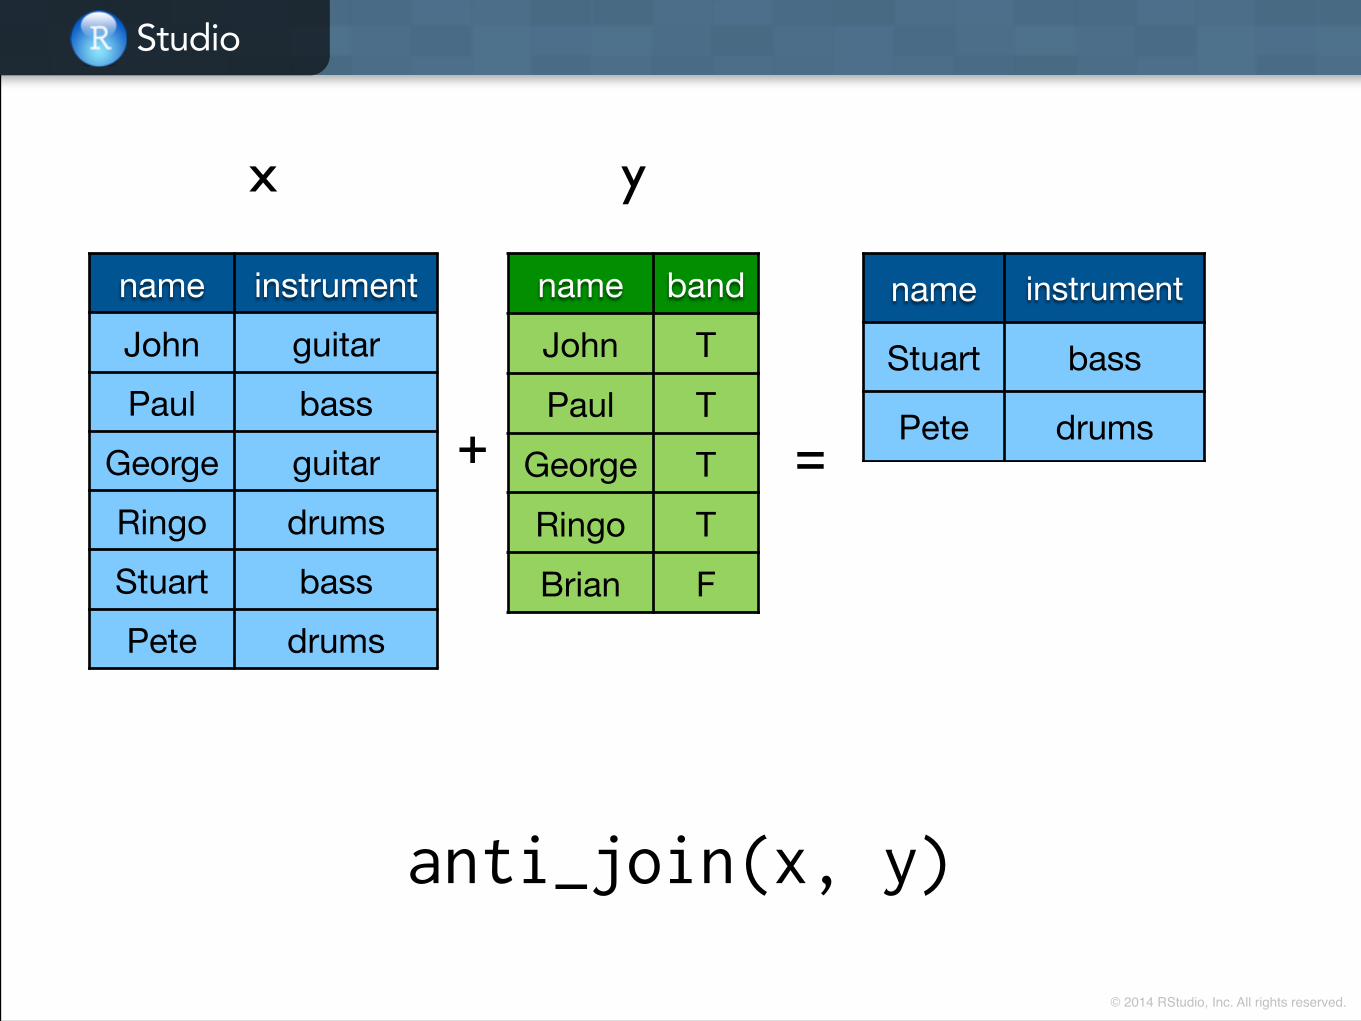
name instrumentJohn guitarPaul bass
George guitarRingo drumsStuart bassPete drums
name bandJohn TPaul T
George TRingo TBrian F
name instrument
Stuart bass
Pete drums
x y
+ =
anti_join(x, y)

© 2014 RStudio, Inc. All rights reserved.
Type Action
inner Include only rows in both x and y
left Include all of x, and matching rows of y
semi Include rows of x that match y
anti Include rows of x that don’t match y

Studio
# Let's combine hourly delay data with weather # information !hourly_delay <- flights %>% group_by(date, hour) %>% filter(!is.na(dep_delay)) %>% summarise( delay = mean(dep_delay), n = n() ) %>% filter(n > 10) delay_weather <- hourly_delay %>% left_join(weather)
Your turn
What weather conditions are associated with delays leaving in Houston?Use graphics to explore.

Studio
qplot(temp, dep, data = delay_weather) qplot(wind_speed, dep, data = delay_weather) qplot(gust_speed, dep, data = delay_weather) qplot(is.na(gust_speed), dep, data = delay_weather, geom = "boxplot") qplot(conditions, dep, data = delay_weather, geom = "boxplot") qplot(events, dep, data = delay_weather, geom = "boxplot")
Your turn
Are older planes more likely to be delayed? Explore the data and answer with a plot.(Hint: I’d recommend by starting with some checking of the plane data)

Do
Studio
The workhorse function
• If one of the specialised verbs doesn’t do what you need, you can use do()
• It’s slower, but general purpose.
• Equivalent to ddply() and dlply(), and is particularly useful in conjunction with models

Studio
How it works
• Two variations: unnamed (for functions that return data frames), and named (for functions that return anything else)
• Uses a pronoun, ., to represent the current group

Studio
# Derived from http://stackoverflow.com/a/23341485/16632 library(dplyr) library(zoo) df <- data.frame( houseID = rep(1:10, each = 10), year = 1995:2004, price = ifelse(runif(10 * 10) > 0.50, NA, exp(rnorm(10 * 10))) ) !df %>% group_by(houseID) %>% do(na.locf(.)) !df %>% group_by(houseID) %>% do(head(., 2)) !df %>% group_by(houseID) %>% do(data.frame(year = .$year[1]))
Studio
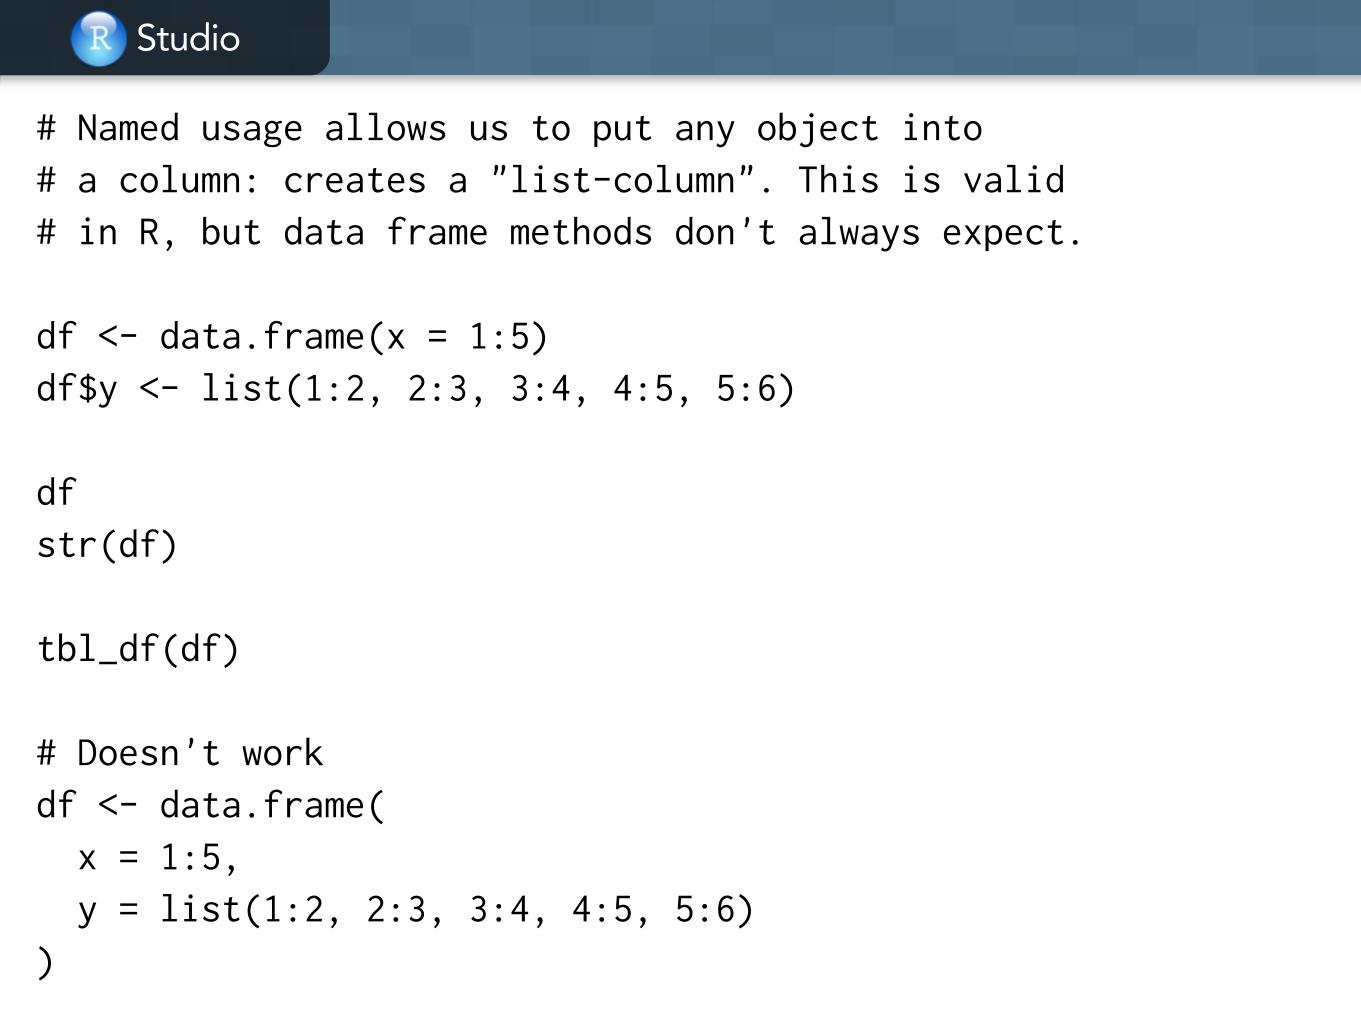
# Named usage allows us to put any object into # a column: creates a "list-column". This is valid # in R, but data frame methods don't always expect. !df <- data.frame(x = 1:5) df$y <- list(1:2, 2:3, 3:4, 4:5, 5:6) !df str(df) !tbl_df(df) !# Doesn't work df <- data.frame( x = 1:5, y = list(1:2, 2:3, 3:4, 4:5, 5:6) )

Studio
# Goal fit a linear model to each day, predicting # delay from time of day !usual <- flights %>% mutate(time = hour + minute / 60) %>% filter(hour >= 5, hour <= 20) !models <- usual %>% group_by(date) %>% do( mod = lm(dep_delay ~ time, data = .) ) !# See 5-do.R for more details
Studio
Future work
• Labelling is still a little wonky
• Parallel? (like plyr)
• Better tools for working with models

Databases
Studio
Other data sources
• PostgreSQL, Greenplum, redshift
• MySQL, MariaDB
• SQLite
• MonetDB, BigQuery
• Oracle, SQL Server, ImpalaDB

Studio
Getting started
• Easiest to dip your toe in database waters with SQLite. No setup required!
• dplyr provides copy_to(), which makes it easy to get data from R into DB
• You can work with database tables just like data frames. dplyr translates the SQL for you.

Studio
hflights_db <- src_sqlite("hflights.sqlite3", create = TRUE) !copy_to( dest = hflights_db, df = as.data.frame(flights), name = "flights", indexes = list( c("date", "hour"), "plane", "dest", "arr" ), temporary = FALSE )
Start with variables needed to join tables
Default is to create temporary tables

Studio
# DEMO

Studio
Learning SQL
• Learn how to use SELECT.
• Learn how indices work. (http://www.sqlite.org/queryplanner.html)
• Learn how SELECT works.(http://tech.pro/tutorial/1555/10-easy-steps-to-a-complete-understanding-of-sql)
• Make friends with an expert
Studio
When to use?
• Obviously, good idea to use if you data already in database. Better to pull from live db than to use static exports.
• If data fits in memory, using local data frame will always be faster. Only use DB for “big” data.
• Correct indexes are key to good filter + join performance. Talk to a DBA!

Where next

Studio
browseVignettes(package = "dplyr") !# Translate plyr to dplyr http://jimhester.github.io/plyrToDplyr/ !# Common questions & answers http://stackoverflow.com/questions/tagged/dplyr?sort=frequent