Embed Size (px)
Citation preview
Paper 1683-2018
Data Management Meets Machine Learning
Gregory S. Nelson ThotWave Technologies Chapel Hill, NC
Abstract
Machine learning, a branch of artificial intelligence, can be described simply as systems that learn from data in
order to make predictions or to act, autonomously or semi-autonomously, in response to what it has learned.
Unlike pre-programmed solutions or business-rules-engines, machine learning can eliminate the need for
someone to continuously code or analyze data themselves to solve a problem.
While there are a variety of applications of machine learning, and the more advanced “deep learning”, most
have been focused on machine learning that trains a computer to perform human-like tasks, such as
recognizing speech, identifying images (or objects and events portrayed therein) and in making predictions.
In this paper, we will explore the use of machine learning as an approach to helping with upstream activities in
data management including classification and feature identification, as well as discuss implications for data
quality, data governance and master data management.
INTRODUCTION...............................................................................................................................................................2UNDERSTANDING THE DATA PIPELINE............................................................................................................................................3
Data value chain.............................................................................................................................................................................................4DATA MANAGEMENT 3.0: THE RISE OF ARTIFICIAL INTELLIGENCE.............................................................4
WHAT DOES ML HAVE TO DO WITH DM?......................................................................................................................................5MACHINELEARNINGFORDATAMANAGEMENT................................................................................................................................6
Data Engineering.............................................................................................................................................................................................7Data Preparation............................................................................................................................................................................................7Data Use...............................................................................................................................................................................................................7Data Operations and Security................................................................................................................................................................7
PRACTICALEXAMPLESOFMACHINELEARNINGFORDATAMANAGEMENT....................................................8OperationalLoadTimes................................................................................................................................................................................8AutomaticDataValueClassification......................................................................................................................................................9IdentificationofDataGaps.......................................................................................................................................................................10Self-OrganizingEnterpriseDataDictionaryforDataDomains............................................................................................11RecommendationofNewPotentialDataSources........................................................................................................................11AnomalyDetection........................................................................................................................................................................................13
SUMMARY.......................................................................................................................................................................14BIOGRAPHY....................................................................................................................................................................14
CONTACT INFORMATION..................................................................................................................................................................15REFERENCES.......................................................................................................................................................................................15
2
Introduction In the 2018 Global Data Management Benchmark Report (Experian, 2018), Experian reported that
95% of C-level executives believe that data is an integral part of forming their business strategy.
While serving as a persistent backdrop for all analytic activities in organizations, the associated tools,
technologies, and processes surrounding the care and feeding of data are often overshadowed by
the sexier aspects of its use. There is a burgeoning interest in real time processing, IoT, and data as
a service (DaaS) and all of these are reliant on modernizing our analytic efforts through
advancements in automated and semi-automated processing. Enter machine learning.
Data management and its constituent parts, data integration, data quality, data governance, and
master data management, are necessary but insufficient to extract full value from the lifeblood of
the modern enterprise. The point is this, just as I wrote in 2015 (Nelson, 2015), precious little
attention is given to how good, clean, usable data gets to us, just that it does.
With the recent attention on machine learning as well as deep learning and artificial intelligence, I
wanted to highlight some potential opportunities for applying the techniques in machine learning
towards solving some of the painful processes that we still encounter in data management.
In that same 2018 Experian benchmark report, “89% percent of C-level executives agree that
inaccurate data is undermining their ability to provide an excellent customer experience.
Furthermore, another 84% of C-level executives agree that the increasing volumes of data make it
difficult to meet their regulatory obligations. “
With data volumes continuing to outpace our ability to manage it in traditional ways, new
methods must be adopted to improve how we collect, ingest, prepare, transform, persist and
experience data. “(?” not sure about whether to do the quotes here… It may be a style thing for
you
Gregory S. Nelson, Author, The Analytics Lifecycle Toolkit
Data continues to grow at unprecedented rates. Intel suggests that the average car will generate
4000 GB of data per hour of driving. Modern multi-player games generate over 50 billion rows of
data per day. Nick Ismail, a reporter for Information Age, recently suggested “Now that those tools
are available, the pendulum will swing back to the demand side of the equation and force
businesses to pay more attention to collection, management and storage of that increasingly
valuable data.” (Ismail, 2017)
“
3
Organizations that utilize machine learning for the automated and semi-automated processing of
data will set the standard, and those that fail to adopt strategies to keep up with the analytics
appetite will lose in this modern-day data arms-race.
Understanding the Data Pipeline While modern data management has been around since the early 1960’s through the late 1980’s. It
wasn’t until the late 1980’s that we began to modernize approaches to truly managing data versus
the previous approach of “sucking its exhaust.” Bill Inmon and Ralph Kimball had competing
approaches to how one should organize data for advantage in reporting and on-line analytical
processing. In his 1996 book (Kimball, 1996), Ralph Kimball highlighted 34 critical subsystems that
form the architecture for every ETL system. This book and the subsequent work formed the basis for
how I think about modern data management activities. While discussions of IoT and sensor data
were not yet part of the daily vernacular in the mid-1990’s, these subsystems are ever-present in the
way that we ingest, manage, and exploit data today.
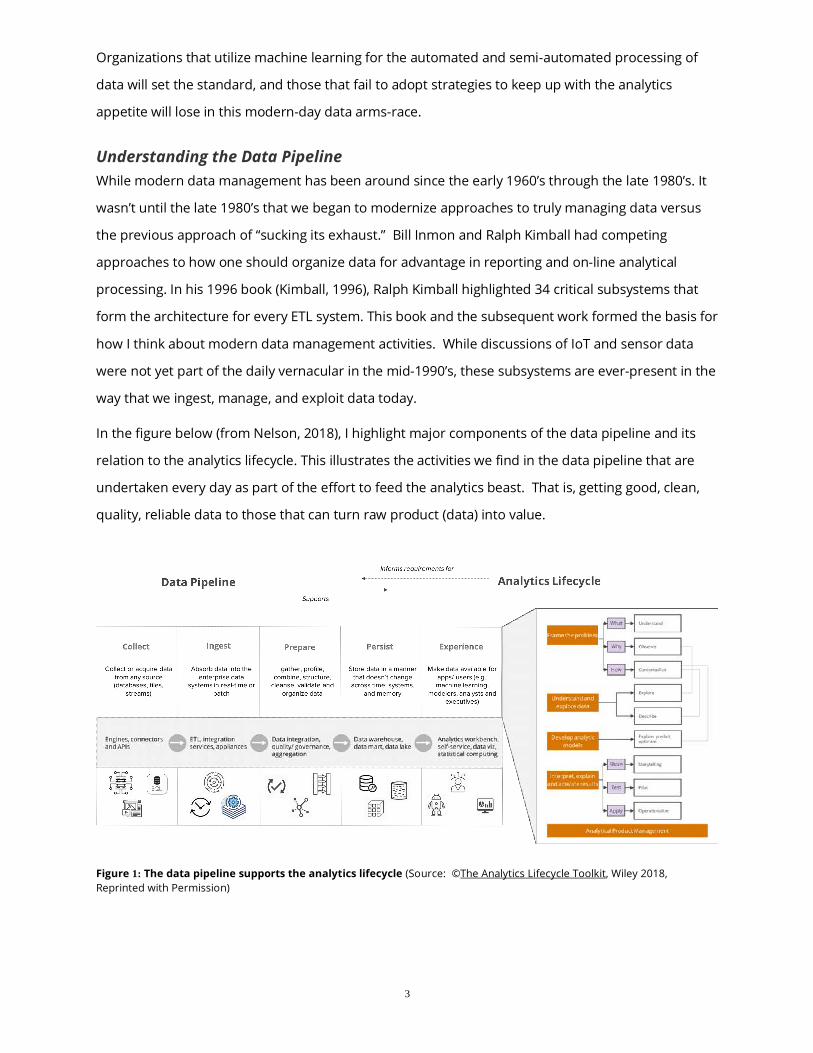
In the figure below (from Nelson, 2018), I highlight major components of the data pipeline and its
relation to the analytics lifecycle. This illustrates the activities we find in the data pipeline that are
undertaken every day as part of the effort to feed the analytics beast. That is, getting good, clean,
quality, reliable data to those that can turn raw product (data) into value.
Figure 1: The data pipeline supports the analytics lifecycle (Source: ©The Analytics Lifecycle Toolkit, Wiley 2018, Reprinted with Permission)
4
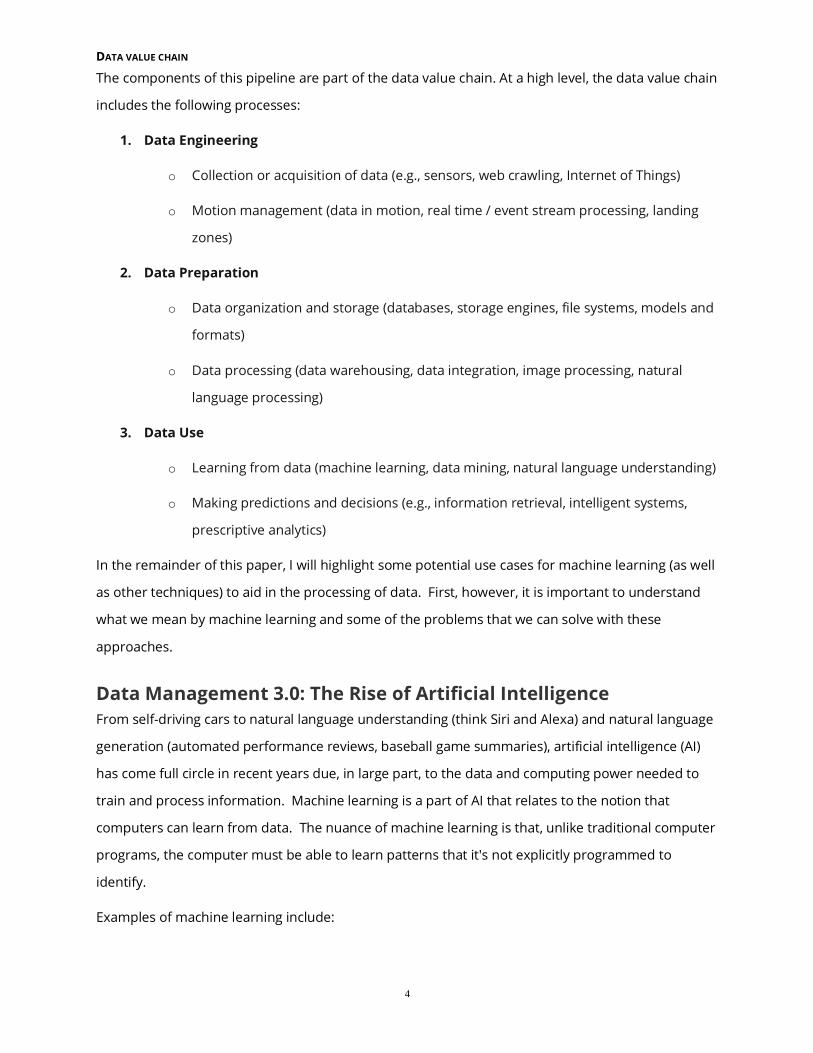
DATA VALUE CHAIN
The components of this pipeline are part of the data value chain. At a high level, the data value chain
includes the following processes:
1. Data Engineering
o Collection or acquisition of data (e.g., sensors, web crawling, Internet of Things)
o Motion management (data in motion, real time / event stream processing, landing
zones)
2. Data Preparation
o Data organization and storage (databases, storage engines, file systems, models and
formats)
o Data processing (data warehousing, data integration, image processing, natural
language processing)
3. Data Use
o Learning from data (machine learning, data mining, natural language understanding)
o Making predictions and decisions (e.g., information retrieval, intelligent systems,
prescriptive analytics)
In the remainder of this paper, I will highlight some potential use cases for machine learning (as well
as other techniques) to aid in the processing of data. First, however, it is important to understand
what we mean by machine learning and some of the problems that we can solve with these
approaches.
Data Management 3.0: The Rise of Artificial Intelligence From self-driving cars to natural language understanding (think Siri and Alexa) and natural language
generation (automated performance reviews, baseball game summaries), artificial intelligence (AI)
has come full circle in recent years due, in large part, to the data and computing power needed to
train and process information. Machine learning is a part of AI that relates to the notion that
computers can learn from data. The nuance of machine learning is that, unlike traditional computer
programs, the computer must be able to learn patterns that it's not explicitly programmed to
identify.
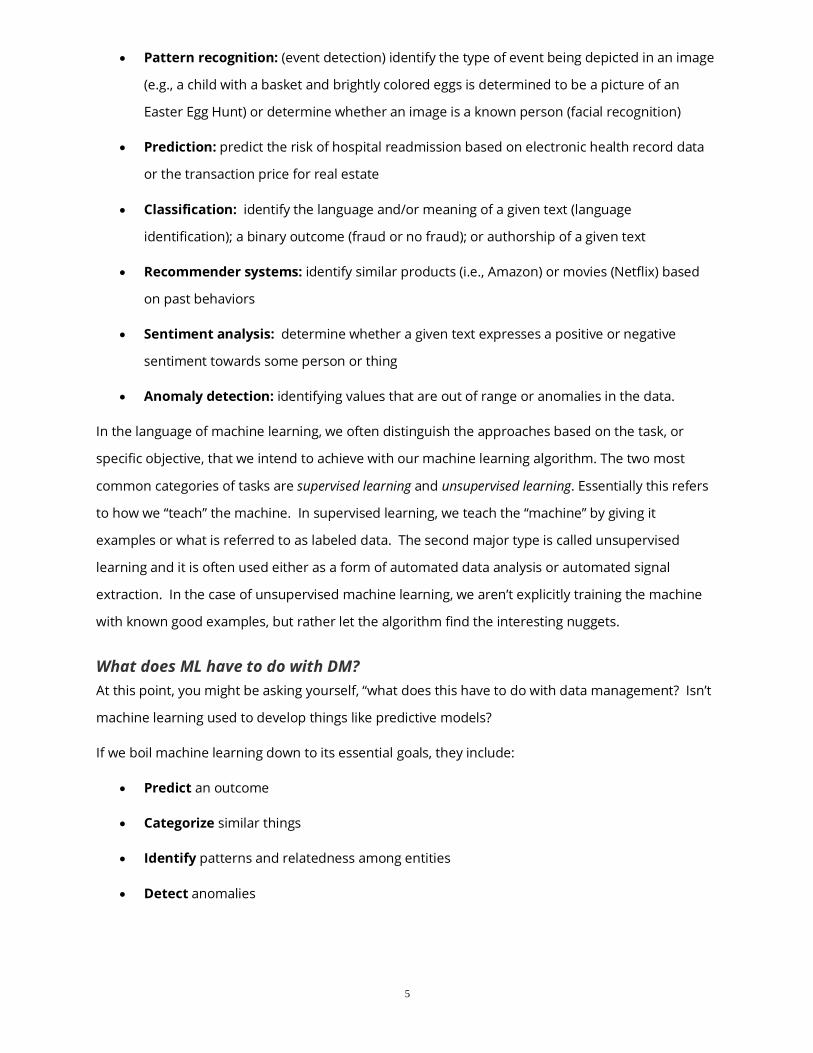
Examples of machine learning include:
5
• Pattern recognition: (event detection) identify the type of event being depicted in an image
(e.g., a child with a basket and brightly colored eggs is determined to be a picture of an
Easter Egg Hunt) or determine whether an image is a known person (facial recognition)
• Prediction: predict the risk of hospital readmission based on electronic health record data
or the transaction price for real estate
• Classification: identify the language and/or meaning of a given text (language
identification); a binary outcome (fraud or no fraud); or authorship of a given text
• Recommender systems: identify similar products (i.e., Amazon) or movies (Netflix) based
on past behaviors
• Sentiment analysis: determine whether a given text expresses a positive or negative
sentiment towards some person or thing
• Anomaly detection: identifying values that are out of range or anomalies in the data.
In the language of machine learning, we often distinguish the approaches based on the task, or
specific objective, that we intend to achieve with our machine learning algorithm. The two most
common categories of tasks are supervised learning and unsupervised learning. Essentially this refers
to how we “teach” the machine. In supervised learning, we teach the “machine” by giving it
examples or what is referred to as labeled data. The second major type is called unsupervised
learning and it is often used either as a form of automated data analysis or automated signal
extraction. In the case of unsupervised machine learning, we aren’t explicitly training the machine
with known good examples, but rather let the algorithm find the interesting nuggets.
What does ML have to do with DM? At this point, you might be asking yourself, “what does this have to do with data management? Isn’t
machine learning used to develop things like predictive models?
If we boil machine learning down to its essential goals, they include:
• Predict an outcome
• Categorize similar things
• Identify patterns and relatedness among entities
• Detect anomalies
6
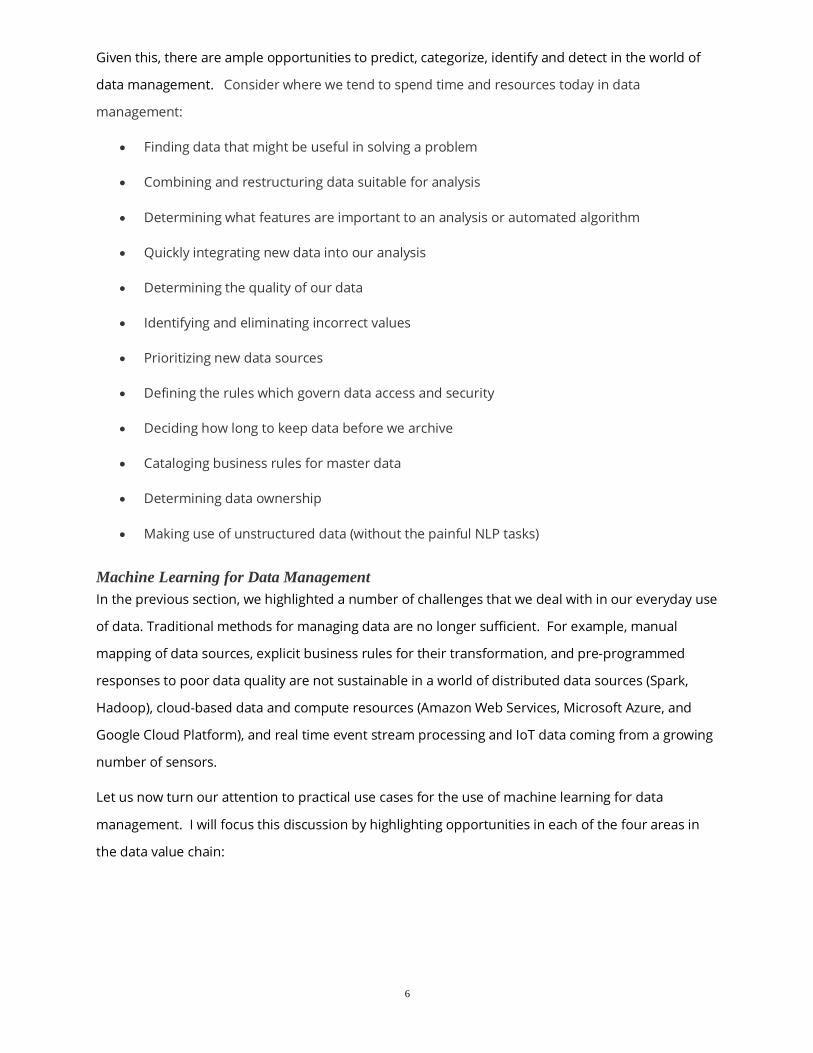
Given this, there are ample opportunities to predict, categorize, identify and detect in the world of
data management. Consider where we tend to spend time and resources today in data
management:
• Finding data that might be useful in solving a problem
• Combining and restructuring data suitable for analysis
• Determining what features are important to an analysis or automated algorithm
• Quickly integrating new data into our analysis
• Determining the quality of our data
• Identifying and eliminating incorrect values
• Prioritizing new data sources
• Defining the rules which govern data access and security
• Deciding how long to keep data before we archive
• Cataloging business rules for master data
• Determining data ownership
• Making use of unstructured data (without the painful NLP tasks)
Machine Learning for Data Management In the previous section, we highlighted a number of challenges that we deal with in our everyday use
of data. Traditional methods for managing data are no longer sufficient. For example, manual
mapping of data sources, explicit business rules for their transformation, and pre-programmed
responses to poor data quality are not sustainable in a world of distributed data sources (Spark,
Hadoop), cloud-based data and compute resources (Amazon Web Services, Microsoft Azure, and
Google Cloud Platform), and real time event stream processing and IoT data coming from a growing
number of sensors.
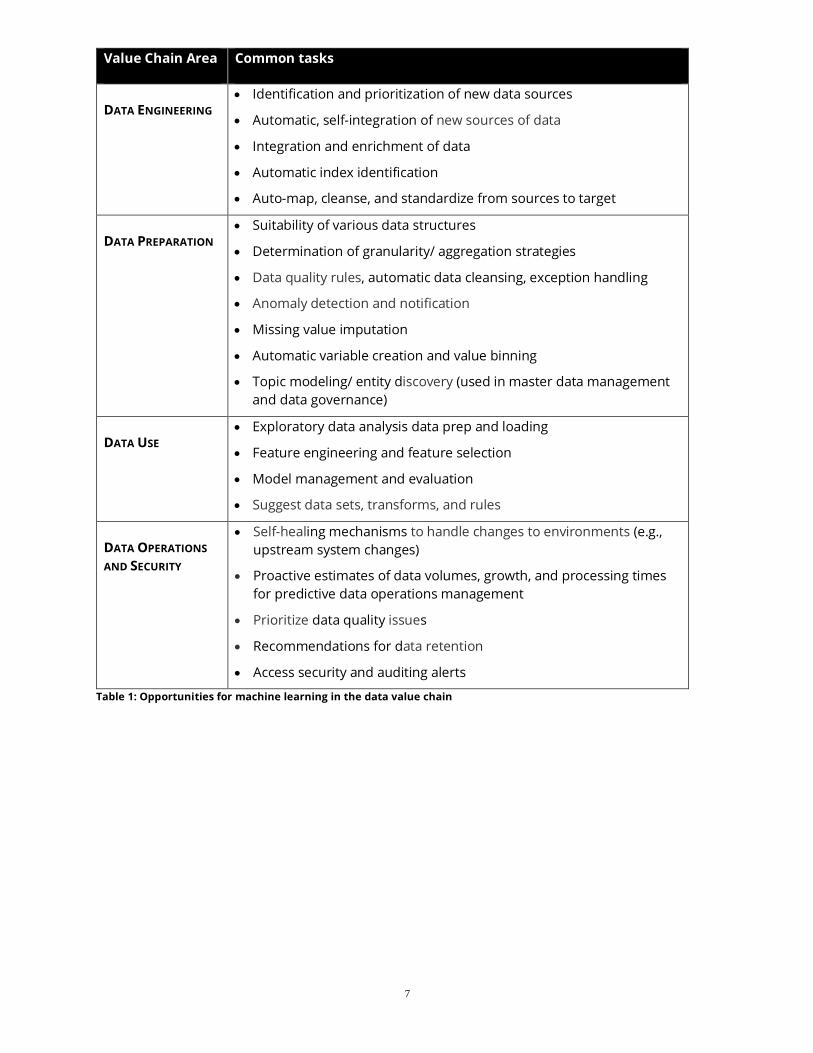
Let us now turn our attention to practical use cases for the use of machine learning for data
management. I will focus this discussion by highlighting opportunities in each of the four areas in
the data value chain:
7
Value Chain Area Common tasks
DATA ENGINEERING • Identification and prioritization of new data sources
• Automatic, self-integration of new sources of data
• Integration and enrichment of data
• Automatic index identification
• Auto-map, cleanse, and standardize from sources to target
DATA PREPARATION • Suitability of various data structures
• Determination of granularity/ aggregation strategies
• Data quality rules, automatic data cleansing, exception handling
• Anomaly detection and notification
• Missing value imputation
• Automatic variable creation and value binning
• Topic modeling/ entity discovery (used in master data management and data governance)
DATA USE • Exploratory data analysis data prep and loading
• Feature engineering and feature selection
• Model management and evaluation
• Suggest data sets, transforms, and rules
DATA OPERATIONS
AND SECURITY
• Self-healing mechanisms to handle changes to environments (e.g., upstream system changes)
• Proactive estimates of data volumes, growth, and processing times for predictive data operations management
• Prioritize data quality issues
• Recommendations for data retention
• Access security and auditing alerts
Table 1: Opportunities for machine learning in the data value chain
8
Practical Examples of Machine Learning for Data Management Most organizations have been using data stored in systems designed for reporting and analysis in
some form or another for at least two decades. The basis for the examples to follow come directly
from the challenges that organizations deal with on a regular basis. These should serve only to
incubate ideas and novel approaches to improving data operations within organizations.
OPERATIONAL LOAD TIMES
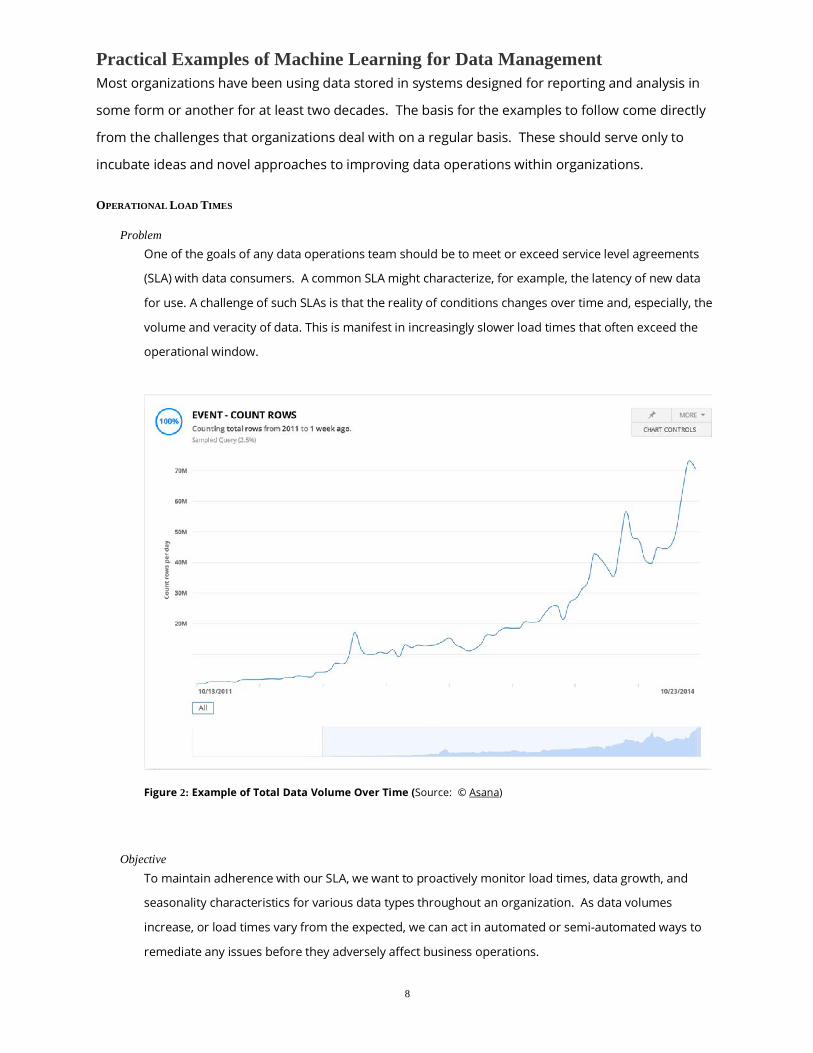
Problem One of the goals of any data operations team should be to meet or exceed service level agreements
(SLA) with data consumers. A common SLA might characterize, for example, the latency of new data
for use. A challenge of such SLAs is that the reality of conditions changes over time and, especially, the
volume and veracity of data. This is manifest in increasingly slower load times that often exceed the
operational window.
Figure 2: Example of Total Data Volume Over Time (Source: © Asana)
Objective To maintain adherence with our SLA, we want to proactively monitor load times, data growth, and
seasonality characteristics for various data types throughout an organization. As data volumes
increase, or load times vary from the expected, we can act in automated or semi-automated ways to
remediate any issues before they adversely affect business operations.
9
Approach One possible approach to predicting daily or weekly data volumes might include the use of regression
to predict the size and/or time to transfer data from a source system to a target system (or the data
flow rate for a real time system.). In this example, we could use a supervised machine learning method
such as regression) to train our data from historical information (load times, data volume) to predict
expected outcomes. Load times or data volumes that differ significantly from the expected value could
be used to instrument an alert for investigation. Segmented regression or time series analysis could
be used to handle varying data types, domains, or to predict seasonal differences in expected
outcomes.
AUTOMATIC DATA VALUE CLASSIFICATION
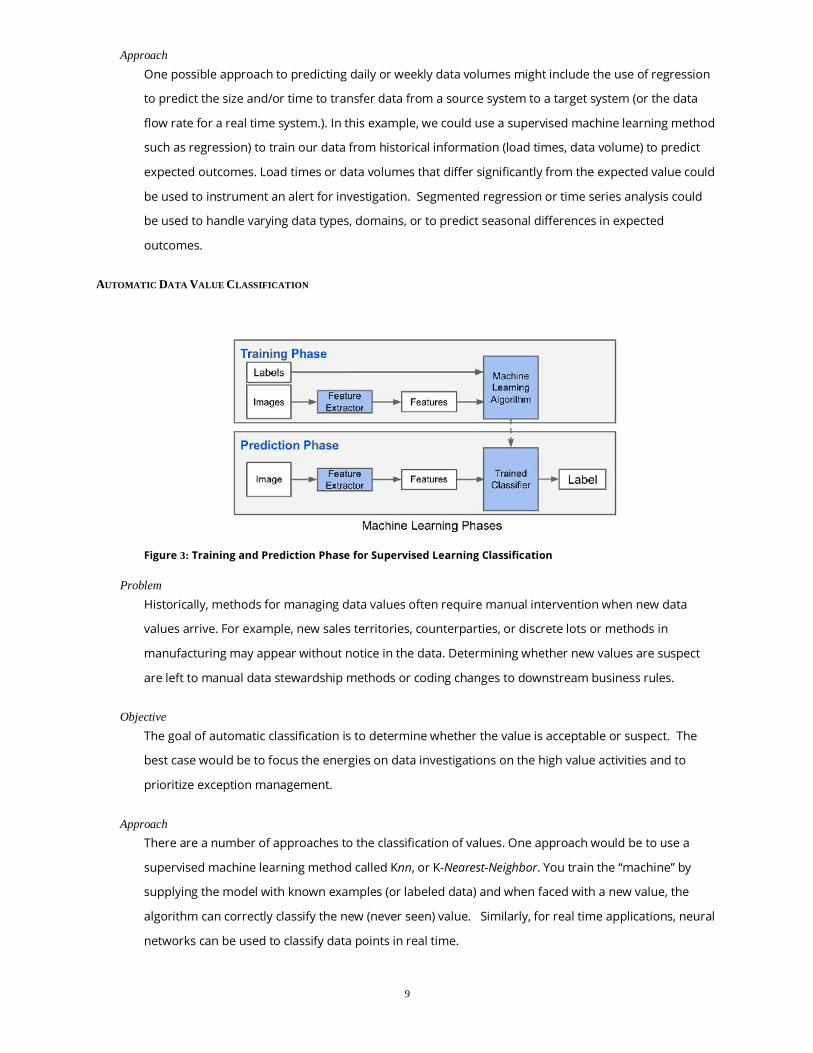
Figure 3: Training and Prediction Phase for Supervised Learning Classification
Problem Historically, methods for managing data values often require manual intervention when new data
values arrive. For example, new sales territories, counterparties, or discrete lots or methods in
manufacturing may appear without notice in the data. Determining whether new values are suspect
are left to manual data stewardship methods or coding changes to downstream business rules.
Objective The goal of automatic classification is to determine whether the value is acceptable or suspect. The
best case would be to focus the energies on data investigations on the high value activities and to
prioritize exception management.
Approach There are a number of approaches to the classification of values. One approach would be to use a
supervised machine learning method called Knn, or K-Nearest-Neighbor. You train the “machine” by
supplying the model with known examples (or labeled data) and when faced with a new value, the
algorithm can correctly classify the new (never seen) value. Similarly, for real time applications, neural
networks can be used to classify data points in real time.
10
For example, we might want to automatically determine the industry code for a new counterparty in a
credit risk application. By looking at the patterns of known values for a company, we can use distance
scores to identify the closest match without having to expressly lookup and code each new value.
IDENTIFICATION OF DATA GAPS
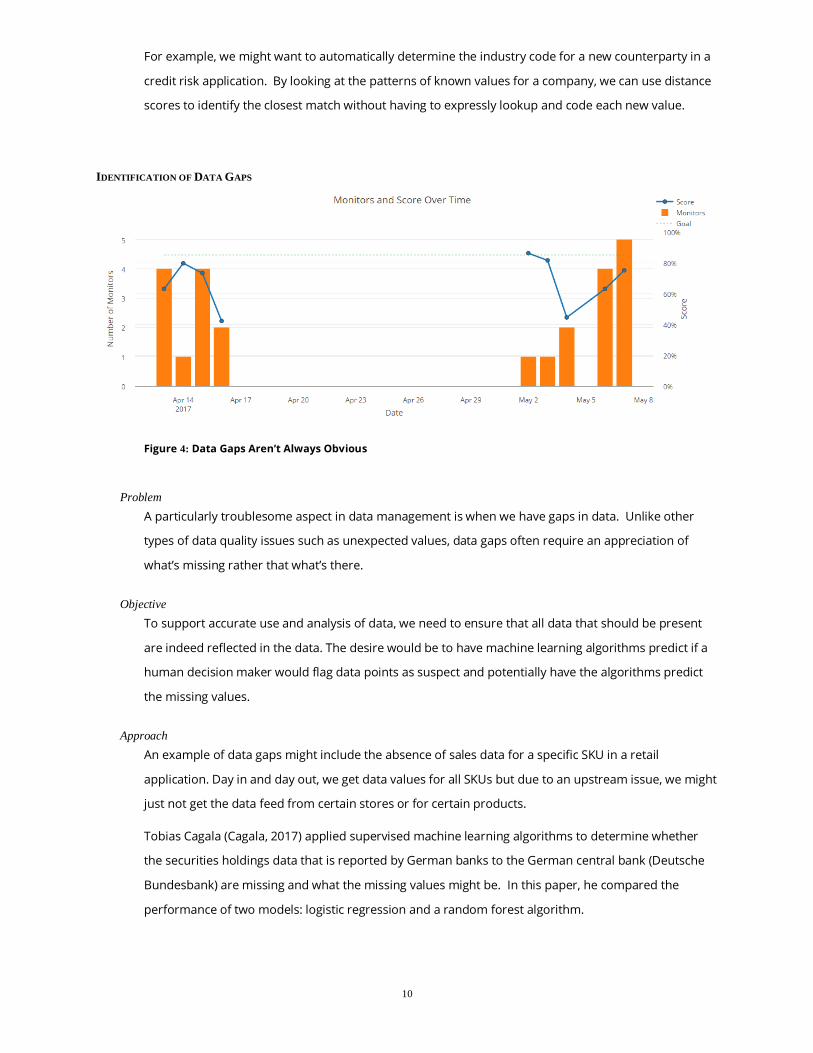
Figure 4: Data Gaps Aren’t Always Obvious
Problem A particularly troublesome aspect in data management is when we have gaps in data. Unlike other
types of data quality issues such as unexpected values, data gaps often require an appreciation of
what’s missing rather that what’s there.
Objective To support accurate use and analysis of data, we need to ensure that all data that should be present
are indeed reflected in the data. The desire would be to have machine learning algorithms predict if a
human decision maker would flag data points as suspect and potentially have the algorithms predict
the missing values.
Approach An example of data gaps might include the absence of sales data for a specific SKU in a retail
application. Day in and day out, we get data values for all SKUs but due to an upstream issue, we might
just not get the data feed from certain stores or for certain products.
Tobias Cagala (Cagala, 2017) applied supervised machine learning algorithms to determine whether
the securities holdings data that is reported by German banks to the German central bank (Deutsche
Bundesbank) are missing and what the missing values might be. In this paper, he compared the
performance of two models: logistic regression and a random forest algorithm.
11
SELF-ORGANIZING ENTERPRISE DATA DICTIONARY FOR DATA DOMAINS
Problem Another challenge in data management is the determination of the content in a data source. Often
when faced with a new dataset or one that is simple novel to an analyst, it requires extensive
exploratory data analysis to figure out the content and its importance.
Objective The goal of self-organizing data domains is to automatically classify new fields and encode them
correctly in an enterprise data dictionary that can be used to quickly search for features that might be
relevant to an analysis.
Approach We can imagine a few ways to automatically interrogate new data: one that is based on brute force
methods of analyzing a dataset and cataloguing its content or an automated self-discovery. In the case
of the latter, imagine a having a set of records automatically encoded to capture the topic or entity. For
example, if we see a test type, date, patient id, and value we might classify this as lab results. Similarly,
if we see constructs such as customer, product, and amounts, then we might consider this to be in the
domain of orders.
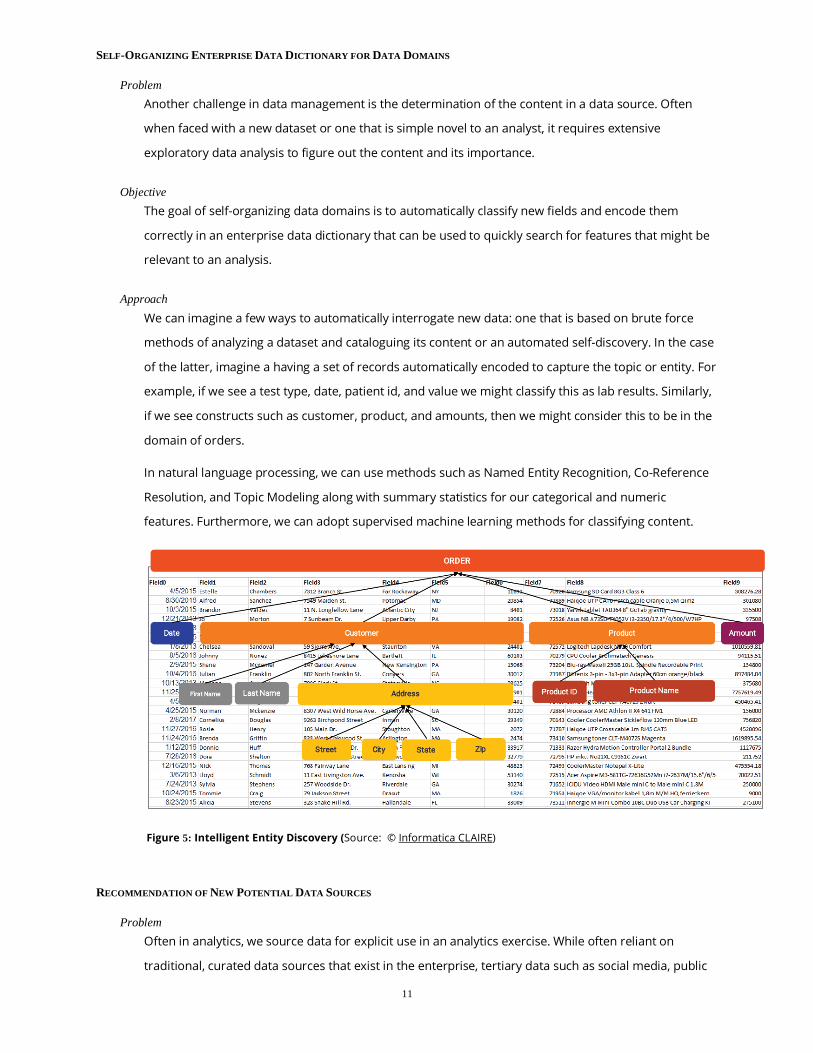
In natural language processing, we can use methods such as Named Entity Recognition, Co-Reference
Resolution, and Topic Modeling along with summary statistics for our categorical and numeric
features. Furthermore, we can adopt supervised machine learning methods for classifying content.
Figure 5: Intelligent Entity Discovery (Source: © Informatica CLAIRE)
RECOMMENDATION OF NEW POTENTIAL DATA SOURCES
Problem Often in analytics, we source data for explicit use in an analytics exercise. While often reliant on
traditional, curated data sources that exist in the enterprise, tertiary data such as social media, public
12
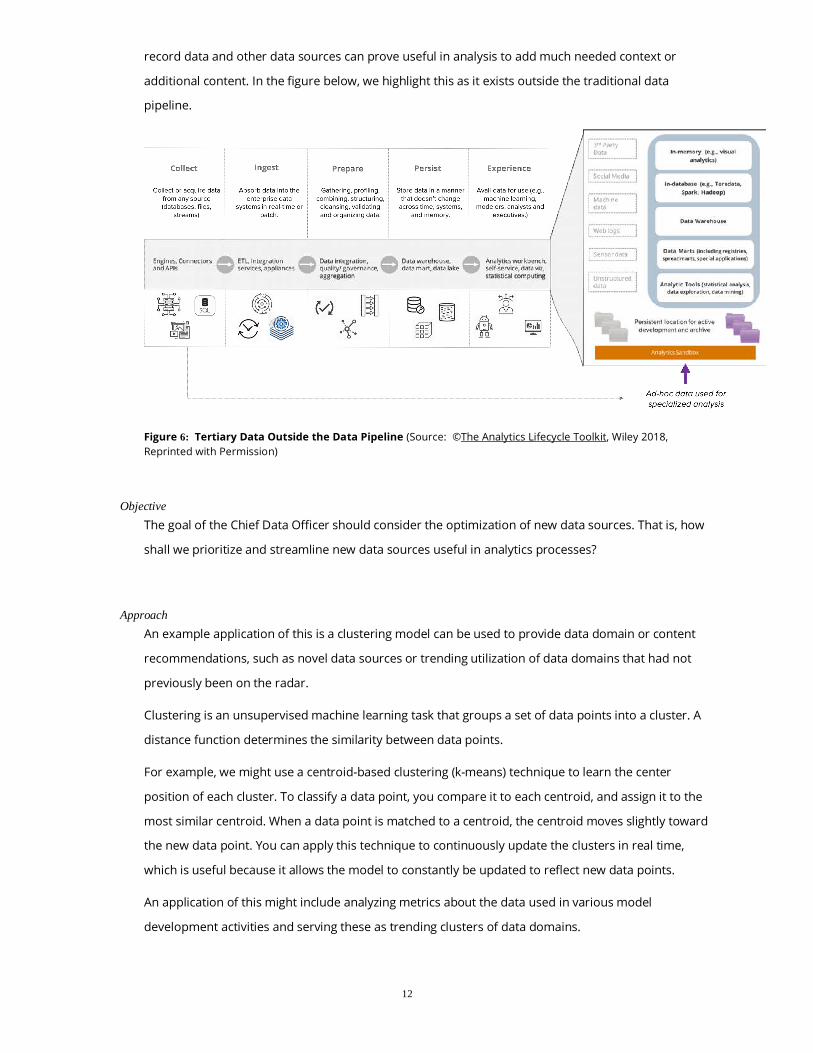
record data and other data sources can prove useful in analysis to add much needed context or
additional content. In the figure below, we highlight this as it exists outside the traditional data
pipeline.
Figure 6: Tertiary Data Outside the Data Pipeline (Source: ©The Analytics Lifecycle Toolkit, Wiley 2018, Reprinted with Permission)
Objective The goal of the Chief Data Officer should consider the optimization of new data sources. That is, how
shall we prioritize and streamline new data sources useful in analytics processes?
Approach An example application of this is a clustering model can be used to provide data domain or content
recommendations, such as novel data sources or trending utilization of data domains that had not
previously been on the radar.
Clustering is an unsupervised machine learning task that groups a set of data points into a cluster. A
distance function determines the similarity between data points.
For example, we might use a centroid-based clustering (k-means) technique to learn the center
position of each cluster. To classify a data point, you compare it to each centroid, and assign it to the
most similar centroid. When a data point is matched to a centroid, the centroid moves slightly toward
the new data point. You can apply this technique to continuously update the clusters in real time,
which is useful because it allows the model to constantly be updated to reflect new data points.
An application of this might include analyzing metrics about the data used in various model
development activities and serving these as trending clusters of data domains.
13
Analysts or data scientists working on various problem domains would be clustered together and
recommendations on data domains or features (as part of various feature engineering efforts) that
have been useful by others can be surfaced as part of a team knowledge management process.
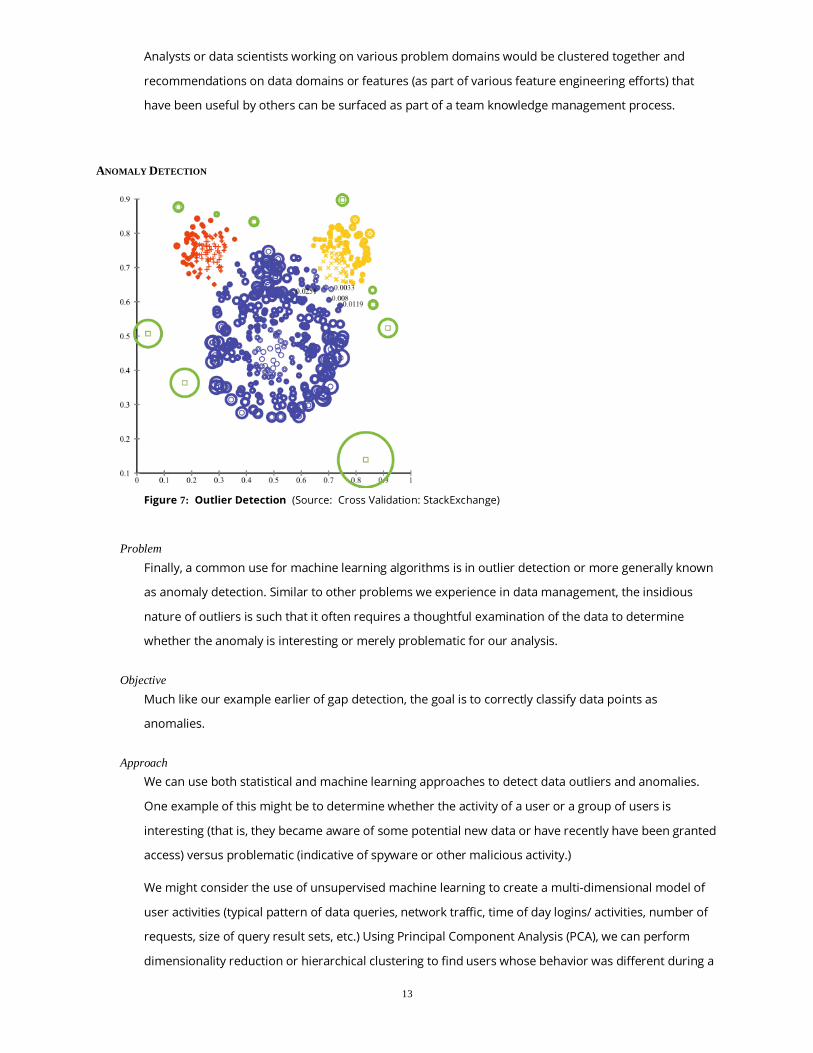
ANOMALY DETECTION
Figure 7: Outlier Detection (Source: Cross Validation: StackExchange)
Problem Finally, a common use for machine learning algorithms is in outlier detection or more generally known
as anomaly detection. Similar to other problems we experience in data management, the insidious
nature of outliers is such that it often requires a thoughtful examination of the data to determine
whether the anomaly is interesting or merely problematic for our analysis.
Objective Much like our example earlier of gap detection, the goal is to correctly classify data points as
anomalies.
Approach We can use both statistical and machine learning approaches to detect data outliers and anomalies.
One example of this might be to determine whether the activity of a user or a group of users is
interesting (that is, they became aware of some potential new data or have recently have been granted
access) versus problematic (indicative of spyware or other malicious activity.)
We might consider the use of unsupervised machine learning to create a multi-dimensional model of
user activities (typical pattern of data queries, network traffic, time of day logins/ activities, number of
requests, size of query result sets, etc.) Using Principal Component Analysis (PCA), we can perform
dimensionality reduction or hierarchical clustering to find users whose behavior was different during a
14
given period. To determine whether actions and actors were malicious, we can use distance and
density-based outlier detection methods to test for outliers.
Summary In this paper, we wanted to highlight some potential applications for modern analytic methods such as
those in machine learning to help solve some of the challenges in data management. Annually,
organizations spend millions of dollars in an attempt to acquire, ingest, transform and store data for
use by data scientists. While I have merely touched on the potential range of applications for data
management including data quality, data stewardship, and data governance, I hope this has spurred
some ideas for how to best deliver on the promise of data for organizational use.
Biography Greg Nelson, President and CEO, ThotWave Technologies, LLC.
Greg Nelson is the founder and Chief Executive Officer of ThotWave, an expert for the International Institute for
Analytics, and adjunct faculty at Duke University’s Fuqua School of Business. He teaches analytics in both the
School of Nursing and at the Fuqua School of Business at Duke University. Greg has authored over 200 papers
and publications and is a regular speaker and keynote presenter at national and international events in both
technology as well as for private companies and events.
Greg, an analytics evangelist and futurist, has brought his 20+ years of analytics advisory work to bear to this
important topic – the people and process side of analytics. Through this pragmatic treatment of the analytics
lifecycle, Greg speaks to both the practical and human-centeredness of analytics in a way that is accessible and
useful for all data champions.
Greg earned his bachelor’s degree from the University of California, Santa Cruz in Psychology, a Masters in
Clinical Informatics from Duke University, and conducted Ph.D. level work in Social and Cognitive Psychology
from the University of Georgia.
Having once flown to Alaska on a one-way ticket with a tent, a sleeping bag, and only $100 to his name to work
on a fishing boat, to raise money to fund his next semester of college, Greg has settled in rural North Carolina,
where he lives with his wife Susan and their four-legged menagerie on a farmlet.

15
You can connect with Greg on twitter @gregorysnelson or on LinkedIn at www.linkedin.com/in/gregorysnelson/.
You can also visit his website, www.analyticslifecycletookit.com.
Contact information Your comments and questions are valued and encouraged. Contact the authors at:
Greg Nelson [email protected]
ThotWave Technologies, LLC
1289 Fordham Boulevard #241
Chapel Hill, NC 27514 (800) 584 2819
http://www.thotwave.com
SAS and all other SAS Institute Inc. product or service names are registered trademarks or
trademarks of SAS Institute Inc. in the USA and other countries. ® indicates USA registration.
thinking data® is registered trademark of ThotWave Technologies, LLC.
Other brand and product names are trademarks of their respective companies.
References
Cagala, Tobias (2017) Improving Data Quality and Closing Data Gaps with Machine Learning. IFC-National Bank of Belgium Workshop on "Data needs and Statistics compilation for macroprudential analysis" Brussels, Belgium, 18-19 May 2017
Experian (2018) The 2018 global data management benchmark report. White paper retrieved from https://www.edq.com/globalassets/white-papers/2018-global-data-management-benchmark-report.pdf
Ismail, Nick (2017) Storage predictions: Will the explosion of data in 2017 be repeated in 2018? Information Age December 6, 2017 Article retrieved from http://www.information-age.com/explosion-data-2017-repeated-2018-123469890/
Kimball, Ralph (1996). The data warehouse toolkit : practical techniques for building dimensional data warehouses. New York: John Wiley & Sons.
Nelson, Gregory S. (2015). Getting Started with Data Governance. paper presented at the annual conference of the SAS Global Users Group, Dallas, TX. April 28, 2015.

16
Nelson, Gregory S. (2018). The Analytics Lifecycle Toolkit : A Practical Guide for an Effective Analytics Capability. New York: John Wiley & Sons.