Embed Size (px)
Citation preview
65
CHAPTER 3
Data Management, Data Analytics, and Business Intelligence
LEARNING OBJECTIVES
3.1 Describe the purpose and benefits of data management and how database technologies help support business processes.
3.2 Describe the di!erences between centralized and distributed database architectures and the importance of creating and maintaining data that can be trusted.
3.3 Understand the concepts of data analytics and data warehousing and evaluate their tactical and strategic benefits.
3.4 Explain benefits of data and text mining and business intelligence and how they benefit an organization.
3.5 Describe electronic records management and how it helps companies to meet their compliance, regulatory, and legal obligations.
CHAPTER OUTLINE
Case 3.1 Opening Case: Coca-Cola Strategically Manages Data to Retain Customers and Reduce Costs
3.1 Data Management and Database Technologies
3.2 Centralized and Distributed Database Architectures
3.3 Data Warehouses
3.4 Data Analytics and Data Discovery
3.5 Business Intelligence and Electronic Records Management
Case 3.2 Business Case: Big Data Analytics is the “Secret Sauce” for Revitalizing McDonald’s
Case 3.3 Video Case: Verizon Improves its Customer Experience with Data-Driven Decision-Making
66 CHAPTER 3 Data Management, Data Analytics, and Business Intelligence
IntroductionAs discussed in Chapter 2, collecting and maintaining trusted data is a critical aspect of any business. Knowing how and where to find data, store it e!iciently, analyze it in new ways to increase the organization’s competitive advantage, and enable the right people to access it at the right time are all fundamental components of managing the ever-increasing amounts of corporate data. Indeed, data analytics is the primary di!erentiator when doing business in the 21st century. Transactional, social, mobile, cloud, Web, and sensor data o!er enormous poten-tial. But without tools to analyze these data types and volumes, there would not be much dif-ference between business in the 20th century and business today—except for mobile access. High-quality data and human expertise are essential to the value of analytics.
Human expertise is necessary because analytics alone cannot explain the reasons for trends or relationships; know what action to take; or provide su!icient context to determine what the numbers represent and how to interpret them.
Database, data warehouse, data analytics, and business intelligence (BI) technologies interact to create a new biz-tech ecosystem. Data analytics and BI discover insights or rela-tionships of interest that otherwise might not have been recognized. They make it possible for managers to make decisions and act with clarity, speed, and confidence. Data analytics is not just about managing more or varied data. Rather, it is about asking new questions, formulating new hypotheses, exploration and discovery, and making data-driven decisions. Ultimately, a big part of data analysis e!orts is the use of new analytics techniques.
Mining data or text taken from day-to-day business operations reveals valuable information, such as customers’ desires, products that are most important, or processes that can be made more e!icient. These insights expand the ability to take advantage of opportu-nities, minimize risks, and control costs.
While you might think that physical pieces of paper are a relic of the past, in most o!ices the opposite is true. Aberdeen Group’s survey of 176 organizations worldwide found that the volume of physical documents is growing by up to 30% per year. Document management tech-nology archives digital and physical data to meet business needs, as well as regulatory and legal requirements (Eisenhauer, 2015).
Case 3.1 Opening Case
© K
athe
rine
Wel
les/
Shut
ters
tock
Fern
ando
Mad
eira
/Shu
tters
tock
guye
rwoo
d/G
etty
Imag
es
Coca-Cola Strategically Manages Data to Retain Customers and Reduce Costs
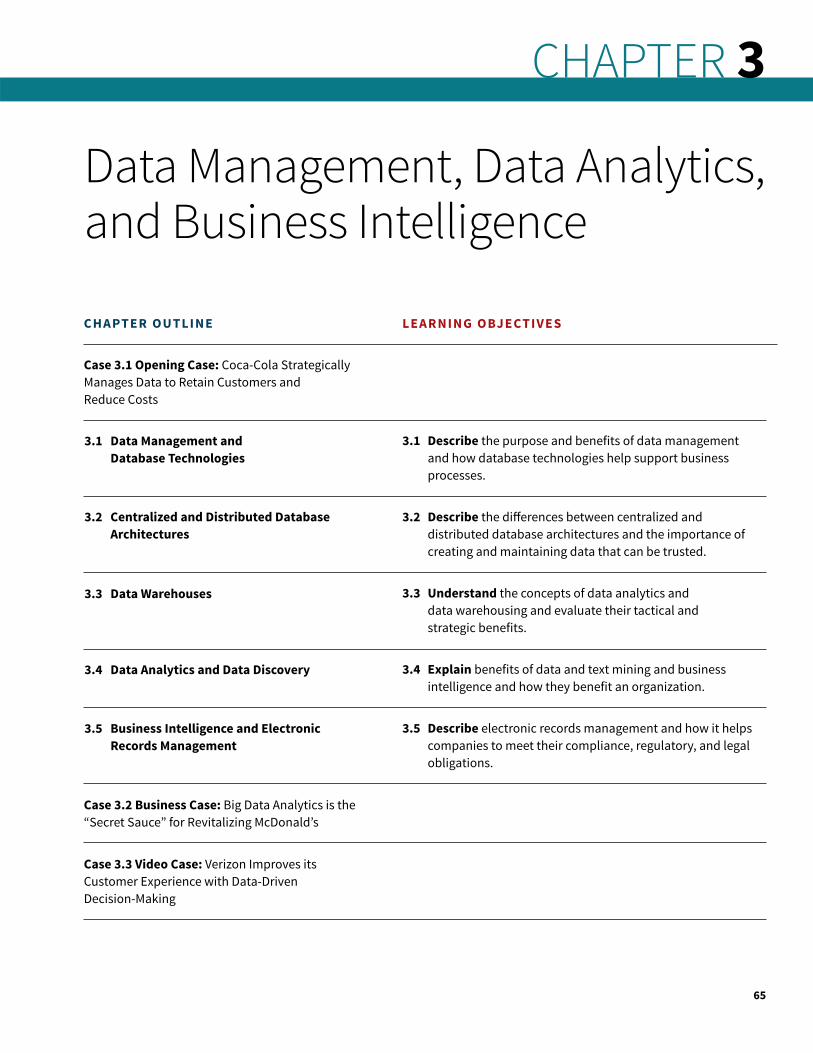
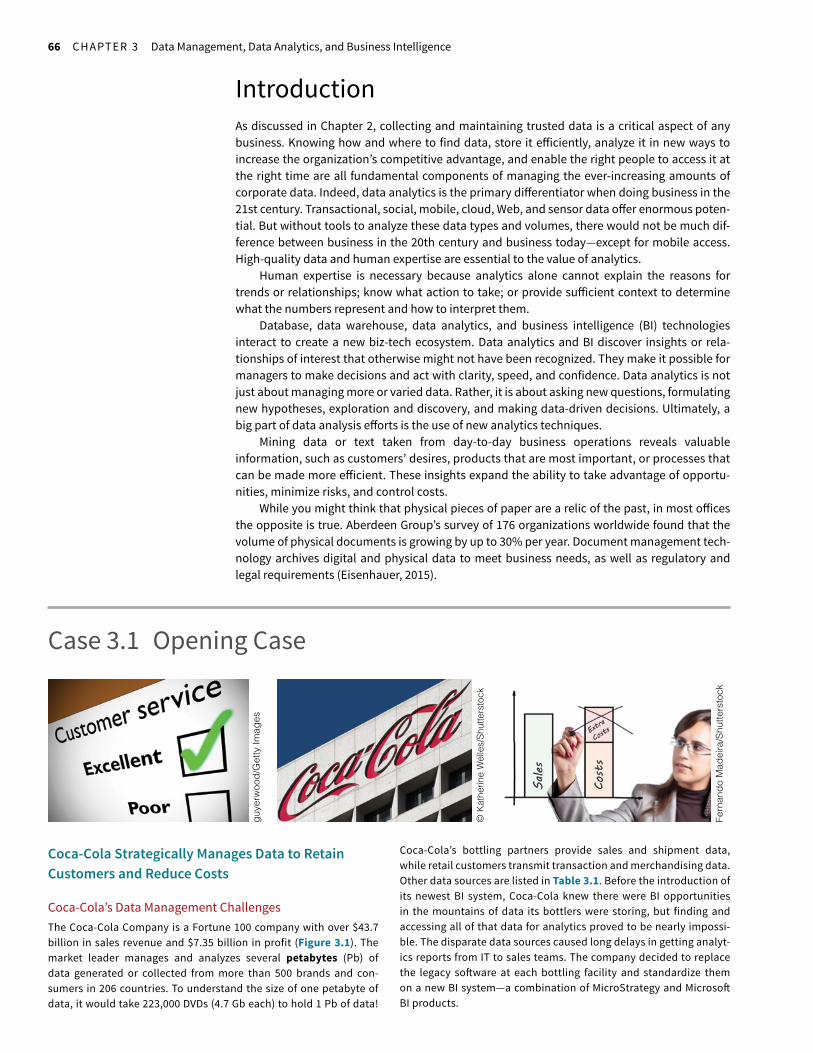
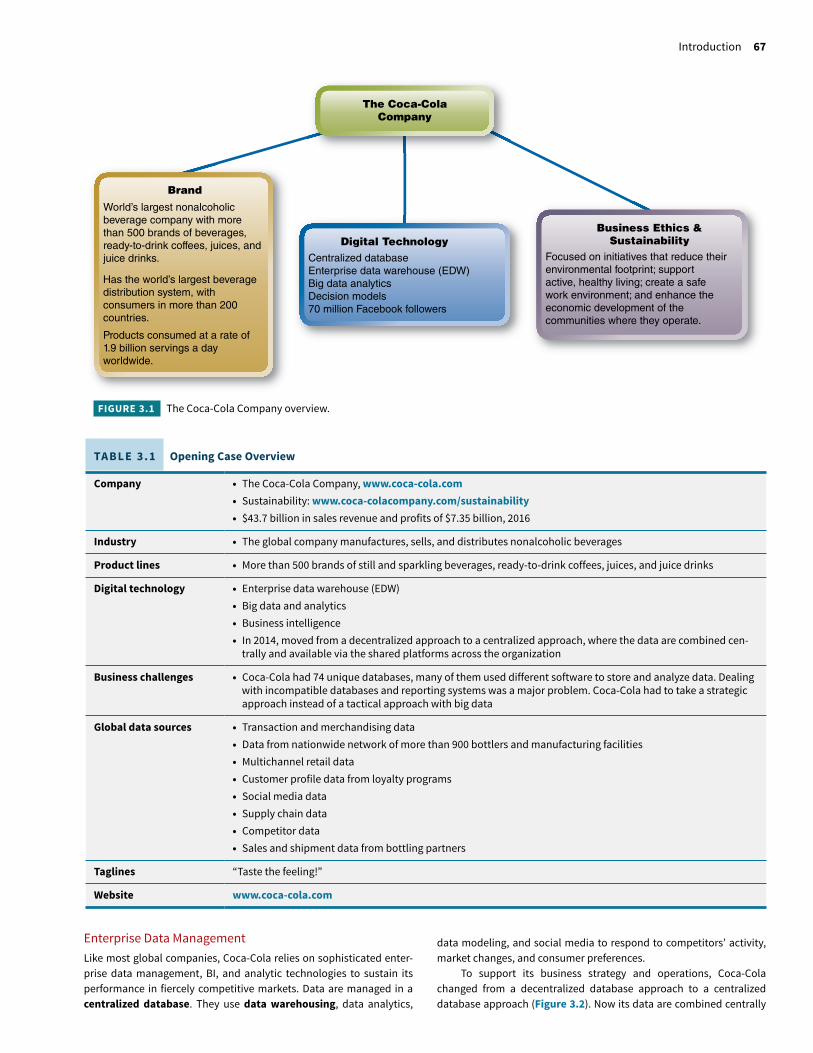
Coca-Cola’s Data Management ChallengesThe Coca-Cola Company is a Fortune 100 company with over $43.7 billion in sales revenue and $7.35 billion in profit (Figure 3.1). The market leader manages and analyzes several petabytes (Pb) of data generated or collected from more than 500 brands and con-sumers in 206 countries. To understand the size of one petabyte of data, it would take 223,000 DVDs (4.7 Gb each) to hold 1 Pb of data!
Coca-Cola’s bottling partners provide sales and shipment data, while retail customers transmit transaction and merchandising data. Other data sources are listed in Table 3.1. Before the introduction of its newest BI system, Coca-Cola knew there were BI opportunities in the mountains of data its bottlers were storing, but finding and accessing all of that data for analytics proved to be nearly impossi-ble. The disparate data sources caused long delays in getting analyt-ics reports from IT to sales teams. The company decided to replace the legacy so#ware at each bottling facility and standardize them on a new BI system—a combination of MicroStrategy and Microso# BI products.
Introduction 67
World’s largest nonalcoholic beverage company with more than 500 brands of beverages,ready-to-drink coffees, juices, and juice drinks.
Has the world’s largest beverage distribution system, with consumers in more than 200 countries.
Products consumed at a rate of 1.9 billion servings a day worldwide.
Brand
Business Ethics &Sustainability
Focused on initiatives that reduce theirenvironmental footprint; support active, healthy living; create a safework environment; and enhance the economic development of the communities where they operate.
Digital TechnologyCentralized databaseEnterprise data warehouse (EDW)Big data analyticsDecision models70 million Facebook followers
The Coca-ColaCompany
FIGURE 3.1 The Coca-Cola Company overview.
TABLE 3.1 Opening Case Overview
Company • The Coca-Cola Company, www.coca-cola.com• Sustainability: www.coca-colacompany.com/sustainability• $43.7 billion in sales revenue and profits of $7.35 billion, 2016
Industry • The global company manufactures, sells, and distributes nonalcoholic beverages
Product lines • More than 500 brands of still and sparkling beverages, ready-to-drink coffees, juices, and juice drinks
Digital technology • Enterprise data warehouse (EDW)• Big data and analytics• Business intelligence• In 2014, moved from a decentralized approach to a centralized approach, where the data are combined cen-
trally and available via the shared platforms across the organization
Business challenges • Coca-Cola had 74 unique databases, many of them used different software to store and analyze data. Dealing with incompatible databases and reporting systems was a major problem. Coca-Cola had to take a strategic approach instead of a tactical approach with big data
Global data sources • Transaction and merchandising data• Data from nationwide network of more than 900 bottlers and manufacturing facilities• Multichannel retail data• Customer profile data from loyalty programs• Social media data• Supply chain data• Competitor data• Sales and shipment data from bottling partners
Taglines “Taste the feeling!”
Website www.coca-cola.com
Enterprise Data ManagementLike most global companies, Coca-Cola relies on sophisticated enter-prise data management, BI, and analytic technologies to sustain its performance in fiercely competitive markets. Data are managed in a centralized database. They use data warehousing, data analytics,
data modeling, and social media to respond to competitors’ activity, market changes, and consumer preferences.
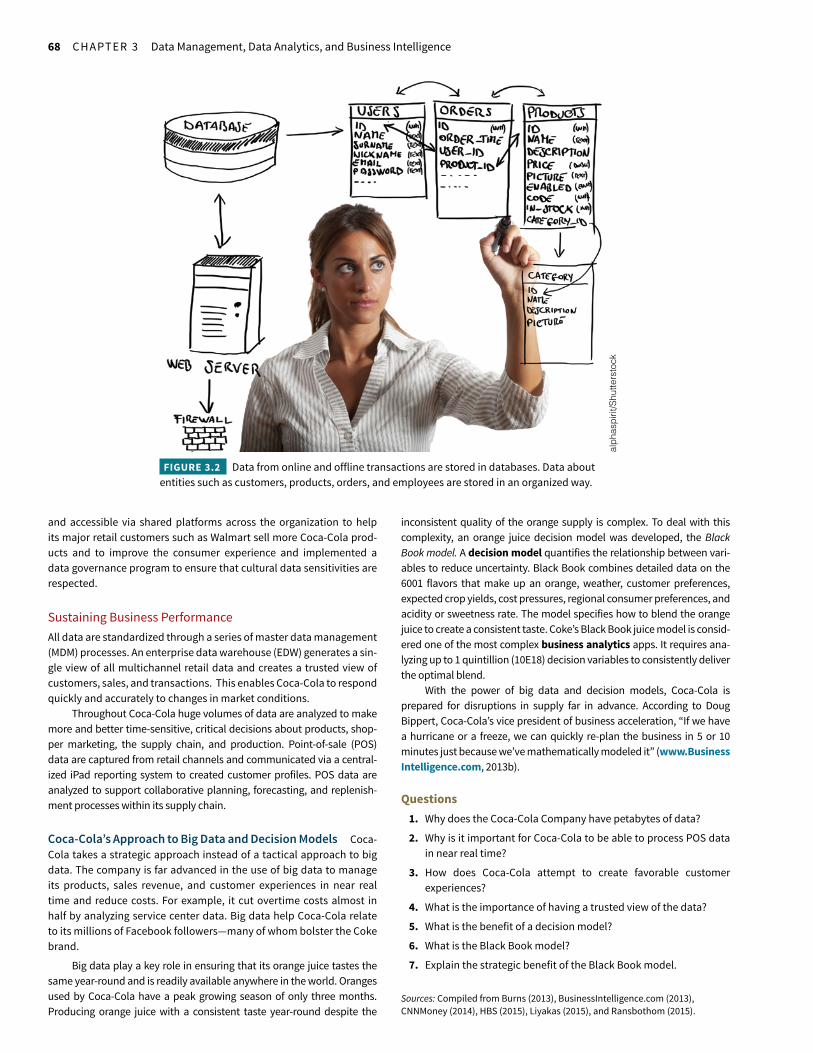
To support its business strategy and operations, Coca-Cola changed from a decentralized database approach to a centralized database approach (Figure 3.2). Now its data are combined centrally
68 CHAPTER 3 Data Management, Data Analytics, and Business Intelligence
and accessible via shared platforms across the organization to help its major retail customers such as Walmart sell more Coca-Cola prod-ucts and to improve the consumer experience and implemented a data governance program to ensure that cultural data sensitivities are respected.
Sustaining Business PerformanceAll data are standardized through a series of master data management (MDM) processes. An enterprise data warehouse (EDW) generates a sin-gle view of all multichannel retail data and creates a trusted view of customers, sales, and transactions. This enables Coca-Cola to respond quickly and accurately to changes in market conditions.
Throughout Coca-Cola huge volumes of data are analyzed to make more and better time-sensitive, critical decisions about products, shop-per marketing, the supply chain, and production. Point-of-sale (POS) data are captured from retail channels and communicated via a central-ized iPad reporting system to created customer profiles. POS data are analyzed to support collaborative planning, forecasting, and replenish-ment processes within its supply chain.
Coca-Cola’s Approach to Big Data and Decision Models Coca-Cola takes a strategic approach instead of a tactical approach to big data. The company is far advanced in the use of big data to manage its products, sales revenue, and customer experiences in near real time and reduce costs. For example, it cut overtime costs almost in half by analyzing service center data. Big data help Coca-Cola relate to its millions of Facebook followers—many of whom bolster the Coke brand.
Big data play a key role in ensuring that its orange juice tastes the same year-round and is readily available anywhere in the world. Oranges used by Coca-Cola have a peak growing season of only three months. Producing orange juice with a consistent taste year-round despite the
inconsistent quality of the orange supply is complex. To deal with this complexity, an orange juice decision model was developed, the Black Book model. A decision model quantifies the relationship between vari-ables to reduce uncertainty. Black Book combines detailed data on the 6001 flavors that make up an orange, weather, customer preferences, expected crop yields, cost pressures, regional consumer preferences, and acidity or sweetness rate. The model specifies how to blend the orange juice to create a consistent taste. Coke’s Black Book juice model is consid-ered one of the most complex business analytics apps. It requires ana-lyzing up to 1 quintillion (10E18) decision variables to consistently deliver the optimal blend.
With the power of big data and decision models, Coca-Cola is prepared for disruptions in supply far in advance. According to Doug Bippert, Coca-Cola’s vice president of business acceleration, “If we have a hurricane or a freeze, we can quickly re-plan the business in 5 or 10 minutes just because we’ve mathematically modeled it” (www.Business Intelligence.com, 2013b).
Questions1. Why does the Coca-Cola Company have petabytes of data?
2. Why is it important for Coca-Cola to be able to process POS data in near real time?
3. How does Coca-Cola attempt to create favorable customer experiences?
4. What is the importance of having a trusted view of the data?
5. What is the benefit of a decision model?
6. What is the Black Book model?
7. Explain the strategic benefit of the Black Book model.
Sources: Compiled from Burns (2013), BusinessIntelligence.com (2013), CNNMoney (2014), HBS (2015), Liyakas (2015), and Ransbothom (2015).
alph
aspi
rit/S
hutte
rsto
ck
FIGURE 3.2 Data from online and offline transactions are stored in databases. Data about entities such as customers, products, orders, and employees are stored in an organized way.
Data Management and Database Technologies 69
3.1 Data Management and Database TechnologiesDue to the incredible volume of data that the typical organization creates, e!ective data manage-ment is vital to prevent storage costs from spiraling out of control and controlling data growth while supporting greater performance. Data management oversees the end-to-end lifecycle of data from creation and initial storage to the time when it becomes obsolete and is deleted.
The objectives of data management include the following:
1. Mitigating the risks and costs of complying with regulations.2. Ensuring legal requirements are met.3. Safeguarding data security.4. Maintaining accuracy of data and availability.5. Certifying consistency in data that come from or go to multiple locations.6. Ensuring that data conform to organizational best practices for access, storage, backup,
and disposal.
Typically, newer data, and data that is accessed more frequently, is stored on faster, but more expensive storage media while less critical data is stored on cheaper, slower media.
The main benefits of data management include greater compliance, higher security, less legal liability, improved sales and marketing strategies, better product classification, and improved data governance to reduce risk. The following data management technologies keep users informed and support the various business demands:
• Databases store data generated by business apps, sensors, operations, and transaction-processing systems (TPS). Data in some databases can be extremely volatile. Medium and large enterprises typically have many databases of various types—centralized and distributed.
• Data warehouses integrate data from multiple databases and data silos across the orga-nization, and organize them for complex analysis, knowledge discovery, and to support decision-making. For example, data are extracted from a database, processed to stan-dardize their format, and then loaded into data warehouses at specific times, such as weekly. As such, data in data warehouses are nonvolatile—and are ready for analysis.
• Data marts are small-scale data warehouses that support a single function or one department. Enterprises that cannot a!ord to invest in data warehousing may start with one or more data marts.
• Business intelligence (BI)—tools and techniques process data and do statistical analysis for insight and discovery—that is, to discover meaningful relationships in the data, keep informed in real time, detect trends, and identify opportunities and risks.
Each of these database management technologies will be discussed in greater detail later in this chapter.
Database Management Systems and SQLData-processing techniques, processing power, and enterprise performance management capabilities have undergone revolutionary advances in recent years for reasons you are already familiar with—big data, mobility, and cloud computing. The last decade, however, has seen the emergence of new approaches, first in data warehousing and, more recently, for transaction processing. Given the huge number of transactions that occur daily in an organization, the data in databases are constantly in use or being updated. The volatility of databases makes it impos-sible to use them for complex decision-making and problem-solving tasks. For this reason, data are extracted from the database, transformed (processed to standardize the data), and then loaded into a data warehouse.
Data management is the management of the flow of data from creation and initial storage to the time when the data become obsolete and are deleted.
Databases are collections of data sets or records stored in a systematic way.
70 CHAPTER 3 Data Management, Data Analytics, and Business Intelligence
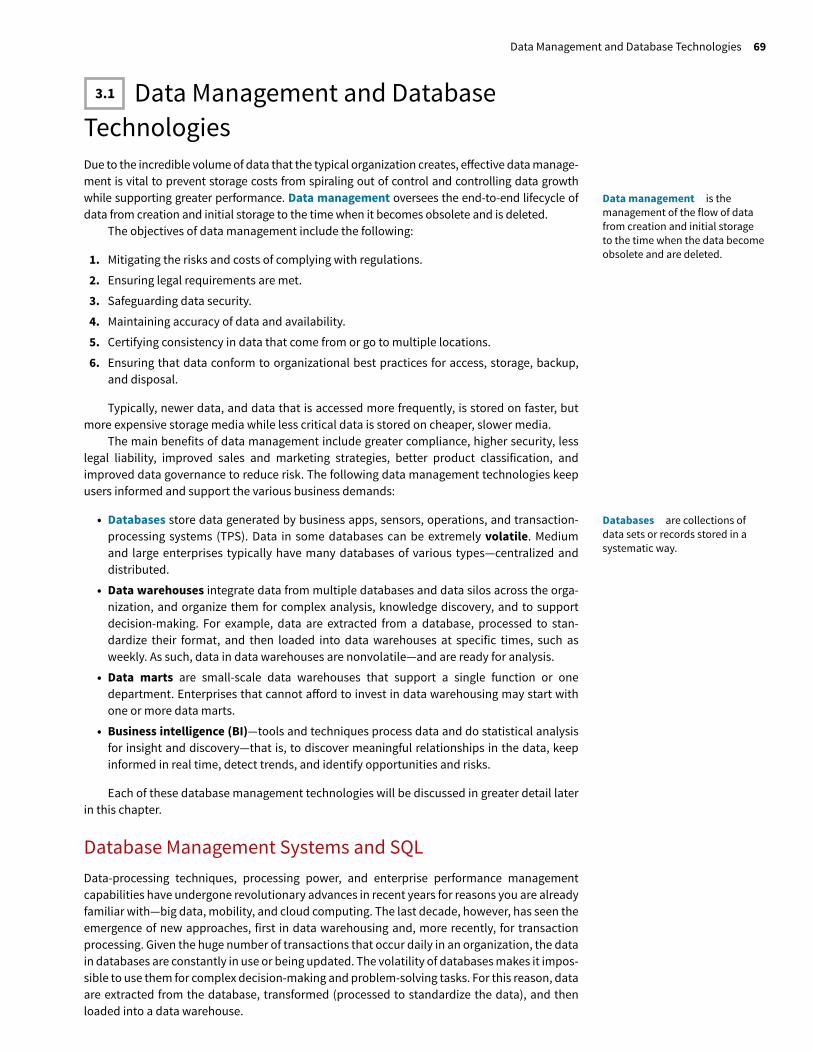
Database management systems (DBMSs) integrate with data collection systems such as TPS and business applications; store the data in an organized way; and provide facilities for accessing and managing that data. Factors to consider when evaluating the performance of a database management system are listed in Tech Note 3.1. Over the past 25 years, the relational database has been the standard database model adopted by most enterprises. Relational data-bases store data in tables consisting of columns and rows, similar to the format of a spreadsheet, as shown in Figure 3.3.
Database management systems (DBMSs) are so#ware used to manage the additions, updates, and deletions of data as transactions occur, and to support data queries and reporting. They are online transaction-processing (OLTP) systems.
© A
lexa
nder
Fed
iach
ov/A
lam
y
FIGURE 3.3 Illustration of structured data format. Numeric and alphanumeric data are arranged into rows and predefined columns similar to those in an Excel spreadsheet.
Tech Note 3.1
Factors That Determine the Performance of a DBMSFactors to consider when evaluating the performance of a database management system include:
• Data latency Latency is the elapsed time (or delay) between when data are created and when they are available for a query or report. Applications have di!erent tolerances for latency. Database systems tend to have shorter latency than data ware-houses. Short latency imposes more restrictions on a system.
• Ability to handle the volatility of the data The database has the processing power to handle the volatility of the data. The rates at which data are added, updated, or deleted deter-mine the workload that the database must be able to control to prevent problems with the response rate to queries.
• Query response time The volume of data impacts response times to queries and data explorations. Many databases
pre-stage data—that is, summarize or precalculate results—so queries have faster response rates.
• Data consistency Immediate consistency means that as soon as data are updated, responses to any new query will return the updated value. With eventual consistency, not all query responses will reflect data changes uniformly. Inconsis-tent query results could cause serious problems for analyses that depend on accurate data.
• Query predictability The greater the number of ad hoc or unpredictable queries, the more flexible the database needs to be. Database or query performance management is more di!i-cult when the workloads are so unpredictable that they cannot be prepared for in advance. The ability to handle the workload is the most important criterion when choosing a database.
• Query processing capabilities Database queries are pro-cessed in real time and results are transmitted via wired or wireless networks to computer screen or handheld devices.
Query are ad hoc (unplanned) user requests for specific data.
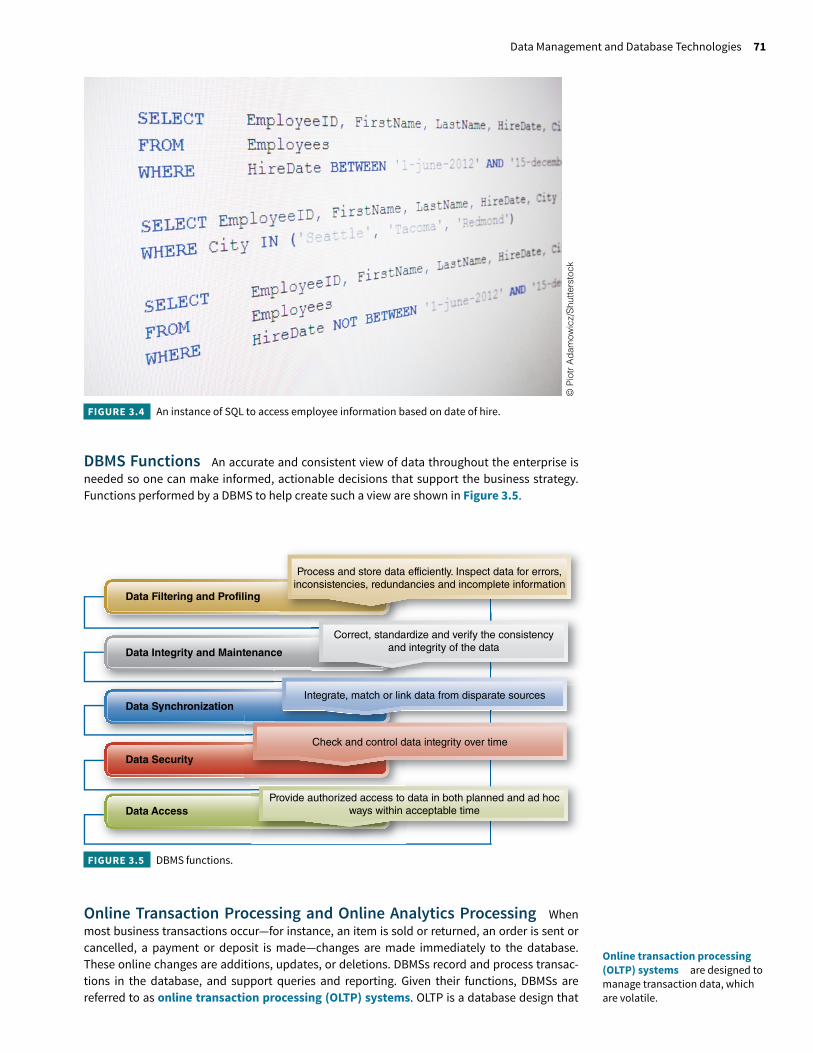
Relational management systems (RDBMSs) provide access to data using a declarative language—structured query language (SQL). Declarative languages simplify data access by requiring that users only specify what data they want to access without defining how access will be achieved. The format of a basic SQL statement is
SELECT column_name(s)FROM table_nameWHERE condition
An instance of SQL is shown in Figure 3.4.
Structured query language (SQL) is a standardized query language for accessing databases.
Data Management and Database Technologies 71
© P
iotr
Ada
mow
icz/
Shut
ters
tock
FIGURE 3.4 An instance of SQL to access employee information based on date of hire.
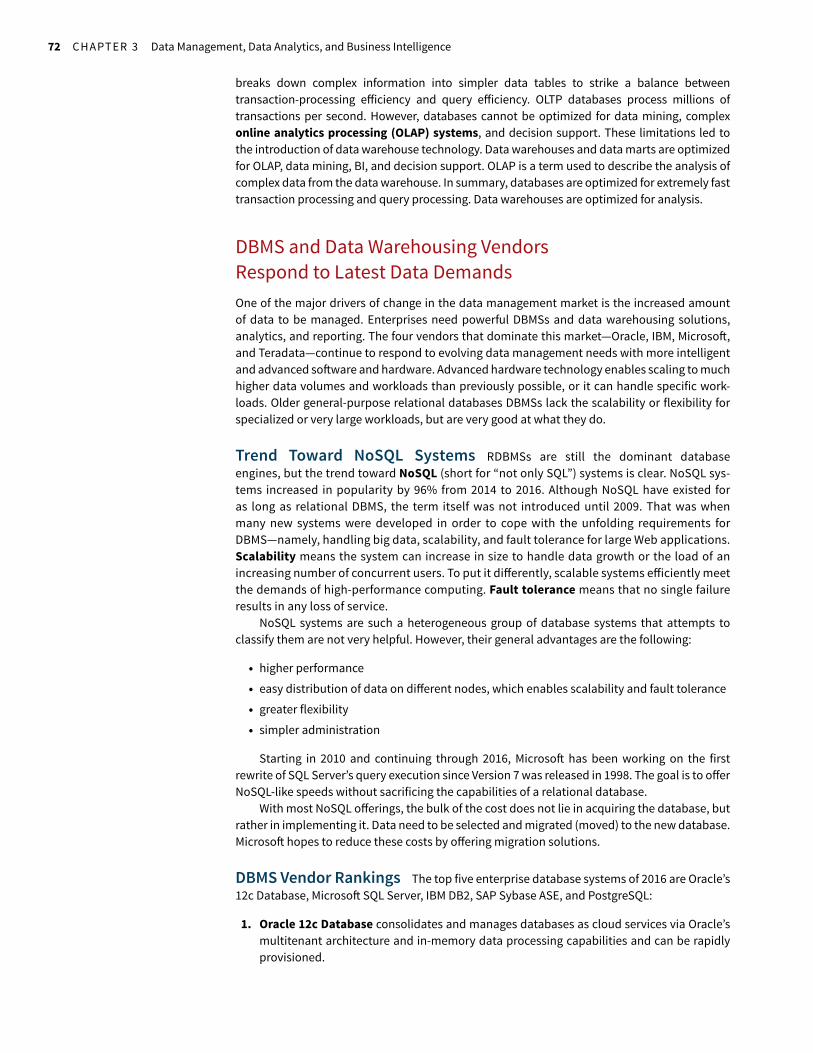
Check and control data integrity over time
Data Filtering and Profiling
Data Integrity and Maintenance
Data Synchronization
Data Security
Data AccessProvide authorized access to data in both planned and ad hoc
ways within acceptable time
Integrate, match or link data from disparate sources
Correct, standardize and verify the consistencyand integrity of the data
Process and store data efficiently. Inspect data for errors,inconsistencies, redundancies and incomplete information
FIGURE 3.5 DBMS functions.
DBMS Functions An accurate and consistent view of data throughout the enterprise is needed so one can make informed, actionable decisions that support the business strategy. Functions performed by a DBMS to help create such a view are shown in Figure 3.5.
Online Transaction Processing and Online Analytics Processing When most business transactions occur—for instance, an item is sold or returned, an order is sent or cancelled, a payment or deposit is made—changes are made immediately to the database. These online changes are additions, updates, or deletions. DBMSs record and process transac-tions in the database, and support queries and reporting. Given their functions, DBMSs are referred to as online transaction processing (OLTP) systems. OLTP is a database design that
Online transaction processing (OLTP) systems are designed to manage transaction data, which are volatile.
72 CHAPTER 3 Data Management, Data Analytics, and Business Intelligence
breaks down complex information into simpler data tables to strike a balance between transaction-processing e!iciency and query e!iciency. OLTP databases process millions of transactions per second. However, databases cannot be optimized for data mining, complex online analytics processing (OLAP) systems, and decision support. These limitations led to the introduction of data warehouse technology. Data warehouses and data marts are optimized for OLAP, data mining, BI, and decision support. OLAP is a term used to describe the analysis of complex data from the data warehouse. In summary, databases are optimized for extremely fast transaction processing and query processing. Data warehouses are optimized for analysis.
DBMS and Data Warehousing Vendors Respond to Latest Data DemandsOne of the major drivers of change in the data management market is the increased amount of data to be managed. Enterprises need powerful DBMSs and data warehousing solutions, analytics, and reporting. The four vendors that dominate this market—Oracle, IBM, Microso#, and Teradata—continue to respond to evolving data management needs with more intelligent and advanced so#ware and hardware. Advanced hardware technology enables scaling to much higher data volumes and workloads than previously possible, or it can handle specific work-loads. Older general-purpose relational databases DBMSs lack the scalability or flexibility for specialized or very large workloads, but are very good at what they do.
Trend Toward NoSQL Systems RDBMSs are still the dominant database engines, but the trend toward NoSQL (short for “not only SQL”) systems is clear. NoSQL sys-tems increased in popularity by 96% from 2014 to 2016. Although NoSQL have existed for as long as relational DBMS, the term itself was not introduced until 2009. That was when many new systems were developed in order to cope with the unfolding requirements for DBMS—namely, handling big data, scalability, and fault tolerance for large Web applications. Scalability means the system can increase in size to handle data growth or the load of an increasing number of concurrent users. To put it di!erently, scalable systems e!iciently meet the demands of high-performance computing. Fault tolerance means that no single failure results in any loss of service.
NoSQL systems are such a heterogeneous group of database systems that attempts to classify them are not very helpful. However, their general advantages are the following:
• higher performance• easy distribution of data on di!erent nodes, which enables scalability and fault tolerance• greater flexibility• simpler administration
Starting in 2010 and continuing through 2016, Microso# has been working on the first rewrite of SQL Server’s query execution since Version 7 was released in 1998. The goal is to o!er NoSQL-like speeds without sacrificing the capabilities of a relational database.
With most NoSQL o!erings, the bulk of the cost does not lie in acquiring the database, but rather in implementing it. Data need to be selected and migrated (moved) to the new database. Microso# hopes to reduce these costs by o!ering migration solutions.
DBMS Vendor Rankings The top five enterprise database systems of 2016 are Oracle’s 12c Database, Microso# SQL Server, IBM DB2, SAP Sybase ASE, and PostgreSQL:
1. Oracle 12c Database consolidates and manages databases as cloud services via Oracle’s multitenant architecture and in-memory data processing capabilities and can be rapidly provisioned.
Centralized and Distributed Database Architectures 73
2. Microsoft SQL Server ease of use, availability, and Windows operating system integration make it an easy choice for firms that choose Microsoft products for their enterprises.
3. IBM DB2 is widely used in large data centers and runs on Linux, UNIX, Windows, IBM iSeries, and mainframes.
4. SAP Sybase ASE is a major force after 25 years of success and improvements. Supports partition locking, relaxed query limits, query plan optimization, and dynamic thread assignment.
5. PostgreSQL is the most advanced open source database, often used by online gaming applications and Skype, Yahoo!, and MySpace. This database runs on a wide variety of operating systems including Linux, Windows, FreeBSD, and Solaris.
Questions
1. Describe a database and a database management system (DBMS).
2. Explain what an online transaction-processing (OLAP) system does.
3. Why are data in databases volatile?
4. Describe the functions of a DBMS.
5. Describe the purpose and benefits of data management.
6. What is a relational database management system?
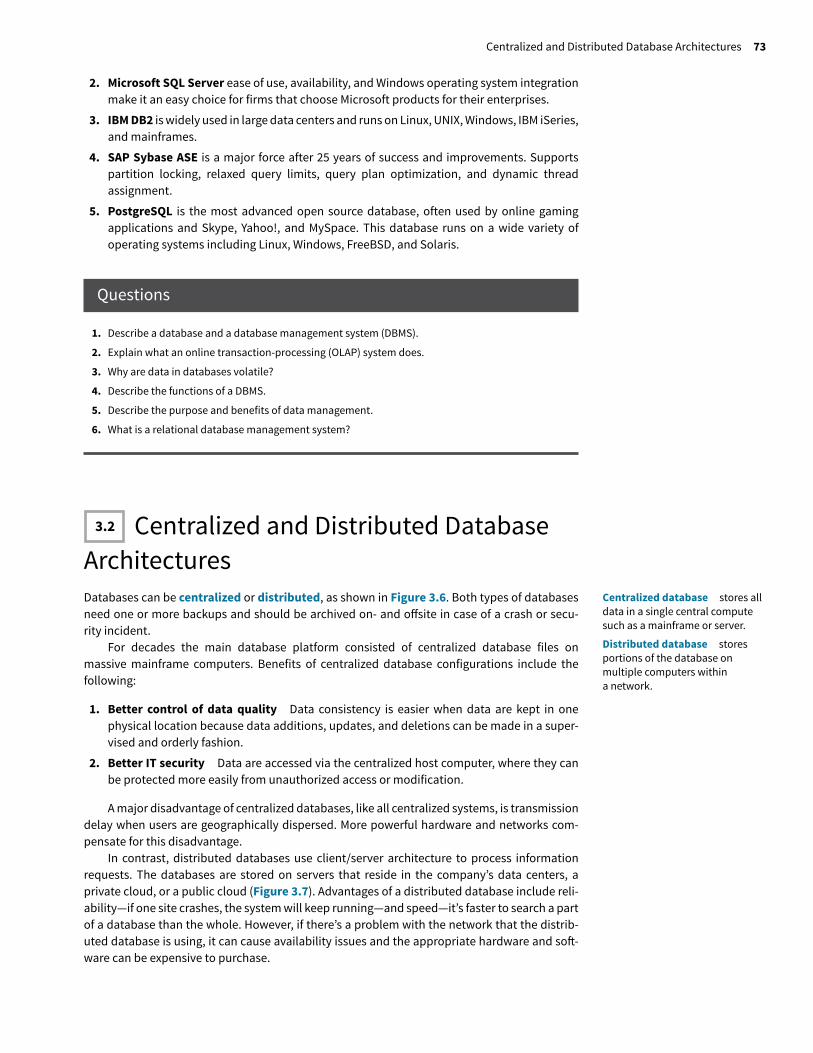
3.2 Centralized and Distributed Database ArchitecturesDatabases can be centralized or distributed, as shown in Figure 3.6. Both types of databases need one or more backups and should be archived on- and o!site in case of a crash or secu-rity incident.
For decades the main database platform consisted of centralized database files on massive mainframe computers. Benefits of centralized database configurations include the following:
1. Better control of data quality Data consistency is easier when data are kept in one physical location because data additions, updates, and deletions can be made in a super-vised and orderly fashion.
2. Better IT security Data are accessed via the centralized host computer, where they can be protected more easily from unauthorized access or modification.
A major disadvantage of centralized databases, like all centralized systems, is transmission delay when users are geographically dispersed. More powerful hardware and networks com-pensate for this disadvantage.
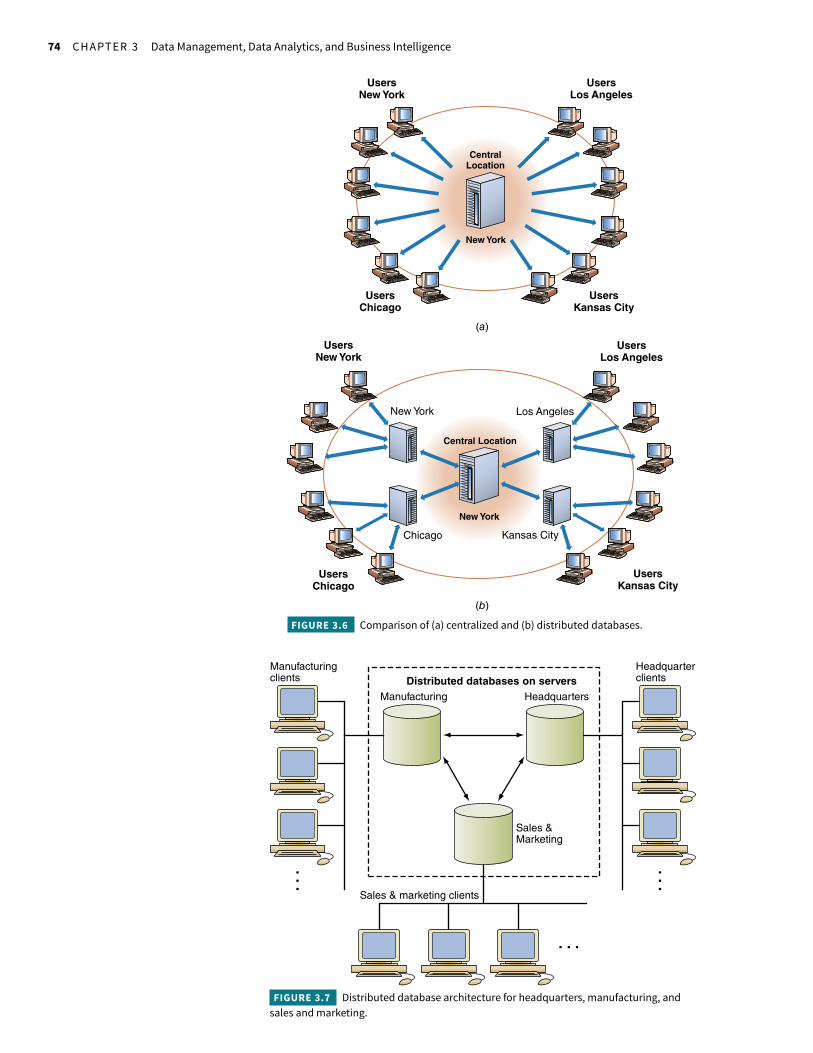
In contrast, distributed databases use client/server architecture to process information requests. The databases are stored on servers that reside in the company’s data centers, a private cloud, or a public cloud (Figure 3.7). Advantages of a distributed database include reli-ability—if one site crashes, the system will keep running—and speed—it’s faster to search a part of a database than the whole. However, if there’s a problem with the network that the distrib-uted database is using, it can cause availability issues and the appropriate hardware and so#-ware can be expensive to purchase.
Centralized database stores all data in a single central compute such as a mainframe or server.Distributed database stores portions of the database on multiple computers within a network.
74 CHAPTER 3 Data Management, Data Analytics, and Business Intelligence
UsersLos Angeles
UsersNew York
UsersKansas City
UsersChicago
New York
UsersLos Angeles
Los Angeles
UsersKansas City
Kansas City
Central Location
CentralLocation
New York
UsersNew York
(a)
(b)
New York
UsersChicago
Chicago
FIGURE 3.6 Comparison of (a) centralized and (b) distributed databases.
Distributed databases on serversManufacturing
Manufacturingclients
Headquarterclients
Headquarters
Sales &Marketing
Sales & marketing clients
FIGURE 3.7 Distributed database architecture for headquarters, manufacturing, and sales and marketing.
Centralized and Distributed Database Architectures 75
Garbage In, Garbage OutData collection is a highly complex process that can create problems concerning the quality of the data being collected. Therefore, regardless of how the data are collected, they need to be validated so users know they can trust them. Classic expressions that sum up the situation are “garbage in, garbage out” (GIGO) and the potentially riskier “garbage in, gospel out.” In the latter case, poor-quality data are trusted and used as the basis for planning. For example, you have probably encountered data safeguards, such as integrity checks, to help improve data quality when you fill in an online form, such as when the form will not accept an e-mail address or a credit card number that is not formatted correctly.
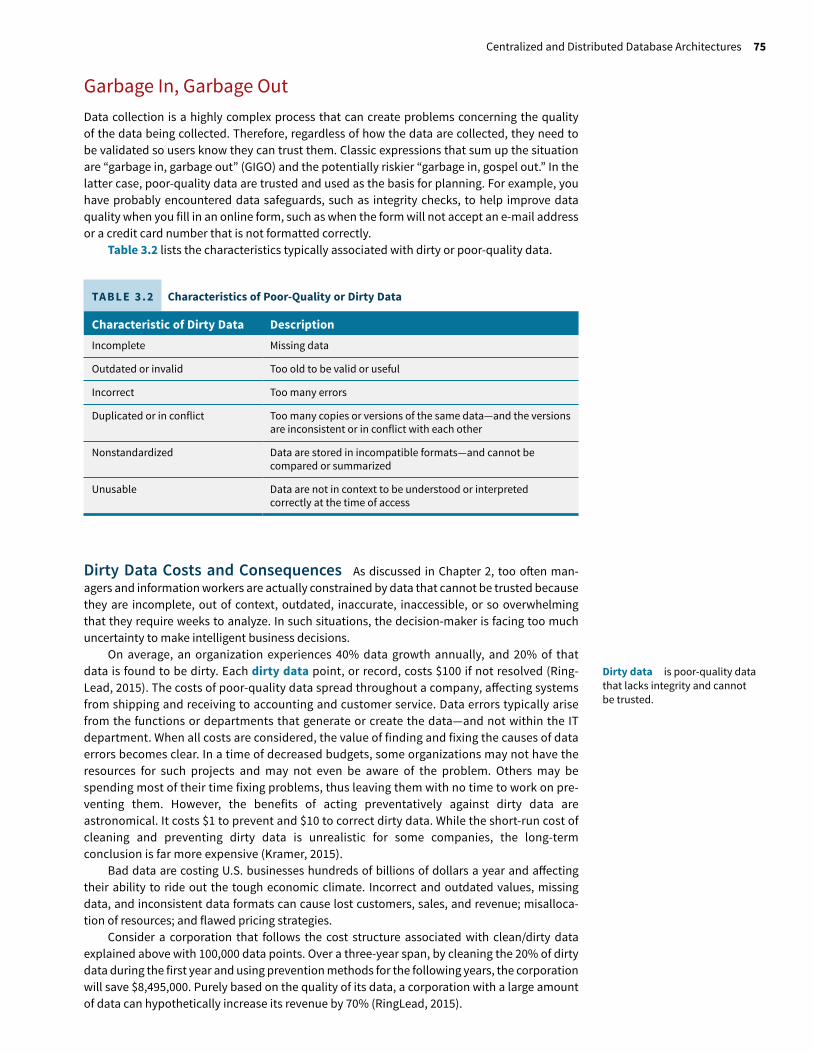
Table 3.2 lists the characteristics typically associated with dirty or poor-quality data.
TABLE 3.2 Characteristics of Poor-Quality or Dirty Data
Characteristic of Dirty Data DescriptionIncomplete Missing data
Outdated or invalid Too old to be valid or useful
Incorrect Too many errors
Duplicated or in conflict Too many copies or versions of the same data―and the versions are inconsistent or in conflict with each other
Nonstandardized Data are stored in incompatible formats―and cannot be compared or summarized
Unusable Data are not in context to be understood or interpreted correctly at the time of access
Dirty Data Costs and Consequences As discussed in Chapter 2, too o#en man-agers and information workers are actually constrained by data that cannot be trusted because they are incomplete, out of context, outdated, inaccurate, inaccessible, or so overwhelming that they require weeks to analyze. In such situations, the decision-maker is facing too much uncertainty to make intelligent business decisions.
On average, an organization experiences 40% data growth annually, and 20% of that data is found to be dirty. Each dirty data point, or record, costs $100 if not resolved (Ring-Lead, 2015). The costs of poor-quality data spread throughout a company, a!ecting systems from shipping and receiving to accounting and customer service. Data errors typically arise from the functions or departments that generate or create the data—and not within the IT department. When all costs are considered, the value of finding and fixing the causes of data errors becomes clear. In a time of decreased budgets, some organizations may not have the resources for such projects and may not even be aware of the problem. Others may be spending most of their time fixing problems, thus leaving them with no time to work on pre-venting them. However, the benefits of acting preventatively against dirty data are astronomical. It costs $1 to prevent and $10 to correct dirty data. While the short-run cost of cleaning and preventing dirty data is unrealistic for some companies, the long-term conclusion is far more expensive (Kramer, 2015).
Bad data are costing U.S. businesses hundreds of billions of dollars a year and a!ecting their ability to ride out the tough economic climate. Incorrect and outdated values, missing data, and inconsistent data formats can cause lost customers, sales, and revenue; misalloca-tion of resources; and flawed pricing strategies.
Consider a corporation that follows the cost structure associated with clean/dirty data explained above with 100,000 data points. Over a three-year span, by cleaning the 20% of dirty data during the first year and using prevention methods for the following years, the corporation will save $8,495,000. Purely based on the quality of its data, a corporation with a large amount of data can hypothetically increase its revenue by 70% (RingLead, 2015).
Dirty data is poor-quality data that lacks integrity and cannot be trusted.

76 CHAPTER 3 Data Management, Data Analytics, and Business Intelligence
The cost of poor-quality data may be expressed as a formula:
Cost of Poor-Quality Data Lost Business Cost to Prevent Errors Cost to Correct Errors
Examples of these costs include the following:
• Lost business Business is lost when sales opportunities are missed, orders are returned because wrong items were delivered, or errors frustrate and drive away customers.
• Time spent preventing errors If data cannot be trusted, then employees need to spend more time and e!ort trying to verify information in order to avoid mistakes.
• Time spent correcting errors Database sta! need to process corrections to the data-base. For example, the costs of correcting errors at U-rent Corporation are estimated as follows:a. Two database staff members spend 25% of their workday processing and verifying
data corrections each day:
2 people * 25% of 8 hours / day 4 hours / day correcting errors b. Hourly salaries are $50 per hour based on pay rate and benefits:
$50 / hour * 4 hours / day $200 / day correcting errors c. 250 workdays per year:
$200 / day * 250 days $50,000 / year to correct errors
For a particular company, it is di!icult to calculate the full cost of poor-quality data and its long-term e!ects. Part of the di!iculty is the time delay between the mistake and when it is detected. Errors can be very di!icult to correct, especially when systems extend across the enterprise. Another concern is that the impacts of errors can be unpredictable, far-reaching, and serious.
Data Ownership and Organizational PoliticsCompliance with numerous federal and state regulations relies on rock-solid data and trusted metrics used for regulatory reporting. Data ownership, data quality, and formally managed data are high priorities on the agenda of CFOs and CEOs who are held personally accountable if their company is found to be in violation of regulations.
Despite the need for high-quality data, organizational politics and technical issues make that di!icult to achieve. The source of the problem is data ownership—that is, who owns or is responsible for the data. Data ownership problems exist when there are no policies defining responsibility and accountability for managing data. Inconsistent data formats of various departments create an additional set of problems as organizations try to combine individual applications into integrated enterprise systems.
The tendency to delegate data-quality responsibilities to the technical teams who have no control over data quality, as opposed to business users who do have such control, is another common pitfall that stands in the way of accumulating high-quality data.
Those who manage a business or part of a business are tasked with trying to improve business performance and retain customers. Compensation is tied to improving profitability, driving revenue growth, and improving the quality of customer service. These key performance indicators (KPIs) are monitored closely by senior managers who want to find and eliminate defects that harm performance. It is strange then that so few managers take the time to under-stand how performance is impacted by poor-quality data. Two examples make a strong case for investment in high-quality data.
Retail banking: For retail bank executives, risk management is the number one issue. Disre-gard for risk contributed to the 2008 financial services meltdown. Despite risk management strat-egies, many banks still incur huge losses. Part of the problem in many banks is that their ISs enable them to monitor risk only at the product level—mortgages, loans, or credit cards. Product-level risk management ISs monitor a customer’s risk exposure for mortgages, or for loans, or for credit cards, and so forth—but not for a customer for all products. With product-level ISs, a bank cannot see the full risk exposure of a customer. The limitations of these siloed product-level risks have serious implications for business performance because bad-risk customers cannot be identified easily,
Centralized and Distributed Database Architectures 77
and customer data in the various ISs may di!er. However, banks are beginning to use big data to analyze risk more e!ectively. Although they are still very limited to credit card, loan, and mort-gage risk data, cheaper and faster computing power allows them to keep better and more inclusive records of customer data. Portfolio monitoring o!ers earlier detection and predictive analytics for potential customers, and more advanced risk models show intricate patterns unseen by the naked eye in large data sets. Also, more fact-based inputs and standardized organizational methods are being implemented to reduce loan and credit o!icer bias to take risks on undesirable customers.
Marketing: Consider what happens when each product-level risk management IS feeds data to marketing ISs. Marketing may o!er bad-risk customers incentives to take out another credit card or loan that they cannot repay. And since the bank cannot identify its best cus-tomers either, they may be ignored and enticed away by better deals o!ered by competitors. This scenario illustrates how data ownership and data-quality management are critical to risk management. Data defects and incomplete data can quickly trigger inaccurate marketing and mounting losses. Banks’ increasing dependence on business modeling requires that risk man-agers understand and manage model risk better. Although losses o#en go unreported, the con-sequences of errors in the model can be extreme. For instance, a large Asia–Pacific bank lost $4 billion when it applied interest-rate models that contained incorrect assumptions and data-entry errors. Risk mitigation will entail rigorous guidelines and processes for developing and val-idating models, as well as the constant monitoring and improvement of them (Harle et al., 2016).
Manufacturing: Many manufacturers are at the mercy of a powerful customer base—large retailers. Manufacturers want to align their processes with those of large retail customers to keep them happy. This alignment makes it possible for a retailer to order centrally for all stores or to order locally from a specific manufacturer. Supporting both central and local ordering makes it di!icult to plan production runs. For example, each manufacturing site has to collect order data from central ordering and local ordering systems to get a complete picture of what to manufacture at each site. Without accurate, up-to-date data, orders may go unfilled, or manu-facturers may have excess inventory. One manufacturer who tried to keep its key retailer happy by implementing central and local ordering could not process orders correctly at each manu-facturing site. No data ownership and lack of control over how order data flowed throughout business operations had negative impacts. Conflicting and duplicate business processes at each manufacturing site caused data errors, leading to mistakes in manufacturing, packing, and shipments. Customers were very dissatisfied.
These examples demonstrate the consequences of a lack of data ownership and data quality. Understanding the impact mismanaged data can have on business performance high-lights the need to make data ownership and data accuracy a high priority.
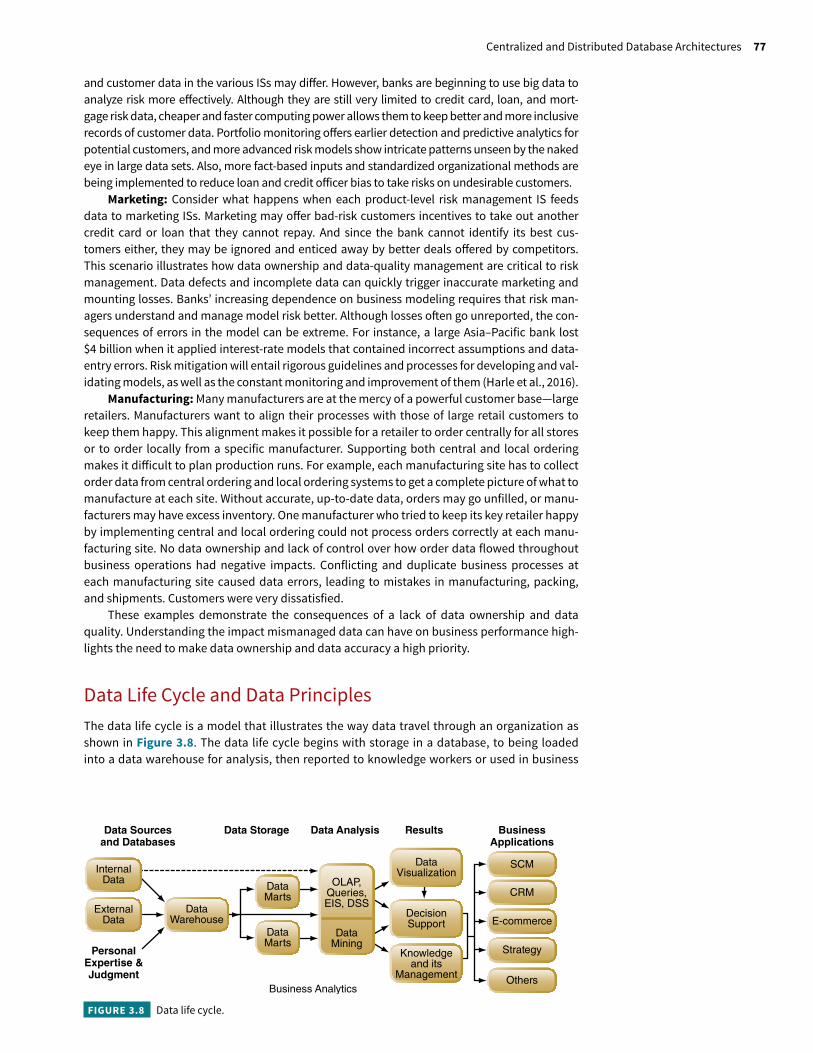
Data Life Cycle and Data PrinciplesThe data life cycle is a model that illustrates the way data travel through an organization as shown in Figure 3.8. The data life cycle begins with storage in a database, to being loaded into a data warehouse for analysis, then reported to knowledge workers or used in business
Data Sourcesand Databases
PersonalExpertise &Judgment
DataVisualization
SCM
E-commerce
Strategy
Others
CRM
Data AnalysisData Storage Results
Business Analytics
BusinessApplications
InternalData
ExternalData
DataWarehouse
DataMarts
DataMarts
OLAP,Queries,EIS, DSS
DataMining
DecisionSupport
Knowledgeand its
Management
FIGURE 3.8 Data life cycle.
78 CHAPTER 3 Data Management, Data Analytics, and Business Intelligence
apps. Supply chain management (SCM), customer relationship management (CRM), and e-commerce are enterprise applications that require up-to-date, readily accessible data to function properly.
Three general data principles relate to the data life cycle perspective and help to guide IT investment decisions:
1. Principle of diminishing data value The value of data diminishes as they age. This is a simple, yet powerful principle. Most organizations cannot operate at peak performance with blind spots (lack of data availability) of 30 days or longer. Global financial services institutions rely on near real-time data for peak performance.
2. Principle of 90/90 data use According to the 90/90 data-use principle, a majority of stored data, as high as 90%, is seldom accessed after 90 days (except for auditing pur-poses). That is, roughly 90% of data lose most of their value after three months.
3. Principle of data in context The capability to capture, process, format, and distribute data in near real time or faster requires a huge investment in data architecture (Chapter 2) and infrastructure to link remote POS systems to data storage, data analysis systems, and reporting apps. The investment can be justified on the principle that data must be inte-grated, processed, analyzed, and formatted into “actionable information.”
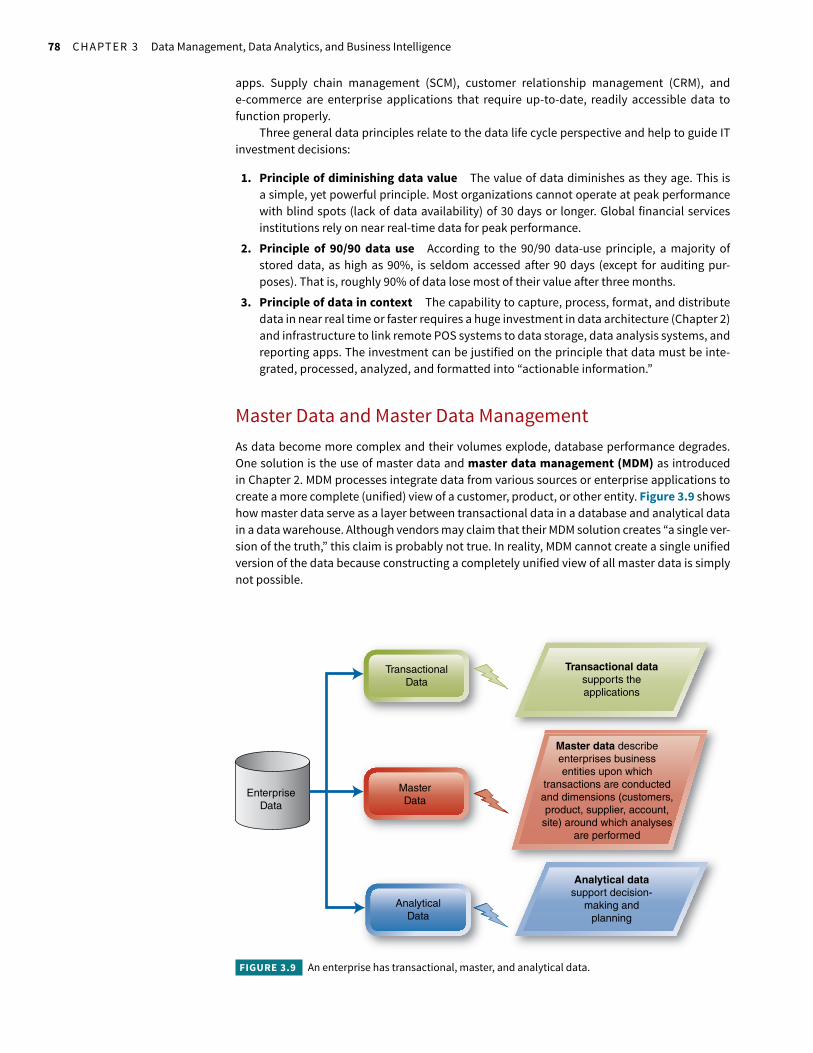
Master Data and Master Data ManagementAs data become more complex and their volumes explode, database performance degrades. One solution is the use of master data and master data management (MDM) as introduced in Chapter 2. MDM processes integrate data from various sources or enterprise applications to create a more complete (unified) view of a customer, product, or other entity. Figure 3.9 shows how master data serve as a layer between transactional data in a database and analytical data in a data warehouse. Although vendors may claim that their MDM solution creates “a single ver-sion of the truth,” this claim is probably not true. In reality, MDM cannot create a single unified version of the data because constructing a completely unified view of all master data is simply not possible.
TransactionalData
MasterData
EnterpriseData
AnalyticalData
Transactional datasupports theapplications
Master data describeenterprises businessentities upon which
transactions are conductedand dimensions (customers,product, supplier, account,
site) around which analysesare performed
Analytical datasupport decision-
making andplanning
FIGURE 3.9 An enterprise has transactional, master, and analytical data.
Data Warehouses 79
Each department has distinct master data needs. Marketing, for example, is concerned with product pricing, brand, and product packaging, whereas production is concerned with product costs and schedules. A customer master reference file can feed data to all enterprise systems that have a customer relationship component, thereby providing a more unified pic-ture of customers. Similarly, a product master reference file can feed data to all the production systems within the enterprise.
An MDM includes tools for cleaning and auditing the master data elements as well as tools for integrating and synchronizing data to make them more accessible. MDM o!ers a solution for managers who are frustrated with how fragmented and dispersed their data sources are.
Questions
1. Describe the data life cycle.
2. What is the function of master data management (MDM)?
3. What are the consequences of not cleaning “dirty data”?
4. Describe the di!erences between centralized and distributed databases.
5. Discuss how data ownership and organizational politics a!ect the quality of an organization’s data.
3.3 Data WarehousesData warehouses are the primary source of cleansed data for analysis, reporting, and business intelligence (BI). O#en the data are summarized in ways that enable quick responses to queries. For instance, query results can reveal changes in customer behavior and drive the decision to redevelop the advertising strategy.
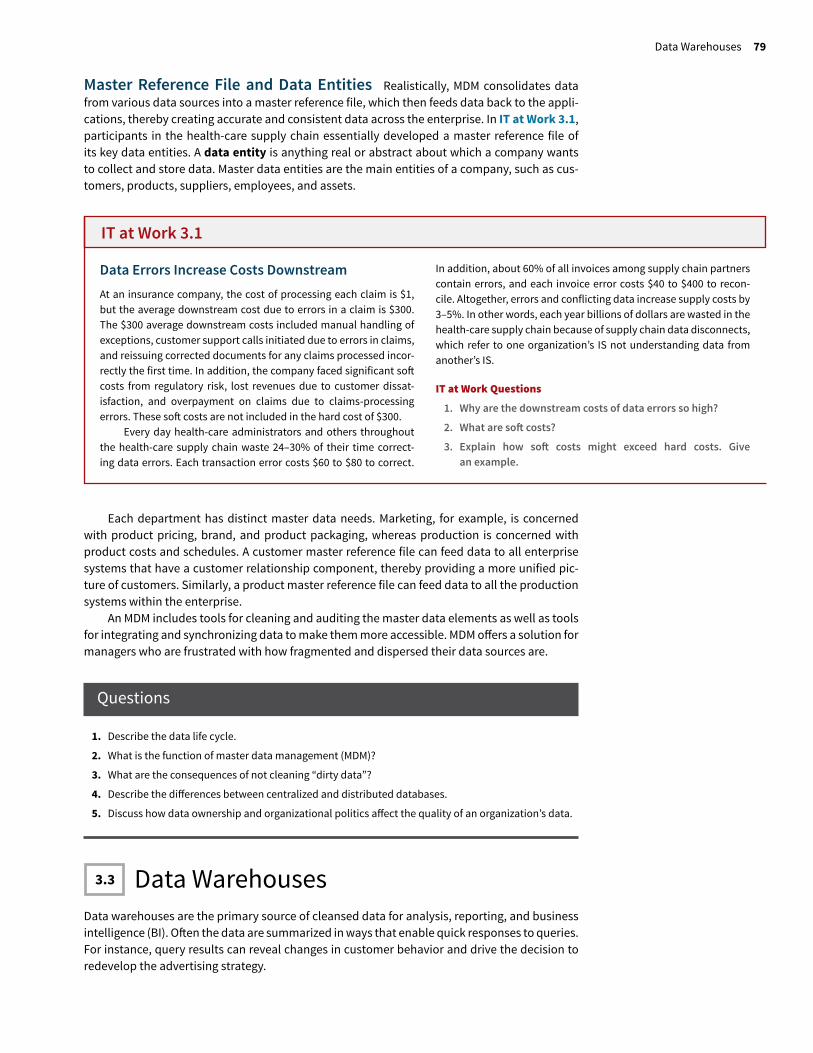
Master Reference File and Data Entities Realistically, MDM consolidates data from various data sources into a master reference file, which then feeds data back to the appli-cations, thereby creating accurate and consistent data across the enterprise. In IT at Work 3.1, participants in the health-care supply chain essentially developed a master reference file of its key data entities. A data entity is anything real or abstract about which a company wants to collect and store data. Master data entities are the main entities of a company, such as cus-tomers, products, suppliers, employees, and assets.
IT at Work 3.1
Data Errors Increase Costs DownstreamAt an insurance company, the cost of processing each claim is $1, but the average downstream cost due to errors in a claim is $300. The $300 average downstream costs included manual handling of exceptions, customer support calls initiated due to errors in claims, and reissuing corrected documents for any claims processed incor-rectly the first time. In addition, the company faced significant so# costs from regulatory risk, lost revenues due to customer dissat-isfaction, and overpayment on claims due to claims-processing errors. These so# costs are not included in the hard cost of $300.
Every day health-care administrators and others throughout the health-care supply chain waste 24–30% of their time correct-ing data errors. Each transaction error costs $60 to $80 to correct.
In addition, about 60% of all invoices among supply chain partners contain errors, and each invoice error costs $40 to $400 to recon-cile. Altogether, errors and conflicting data increase supply costs by 3–5%. In other words, each year billions of dollars are wasted in the health-care supply chain because of supply chain data disconnects, which refer to one organization’s IS not understanding data from another’s IS.
IT at Work Questions1. Why are the downstream costs of data errors so high?2. What are so! costs?3. Explain how so! costs might exceed hard costs. Give
an example.
80 CHAPTER 3 Data Management, Data Analytics, and Business Intelligence
Three technologies involved in preparing raw data for analytics include ETL, change data capture (CDC), and data deduplication (“deduping the data”). CDC processes capture the changes made at data sources and then apply those changes throughout enterprise data stores to keep data synchronized. CDC minimizes the resources required for ETL processes by only dealing with data changes. Deduping processes remove duplicates and standardize data formats, which helps to minimize storage and data synch.
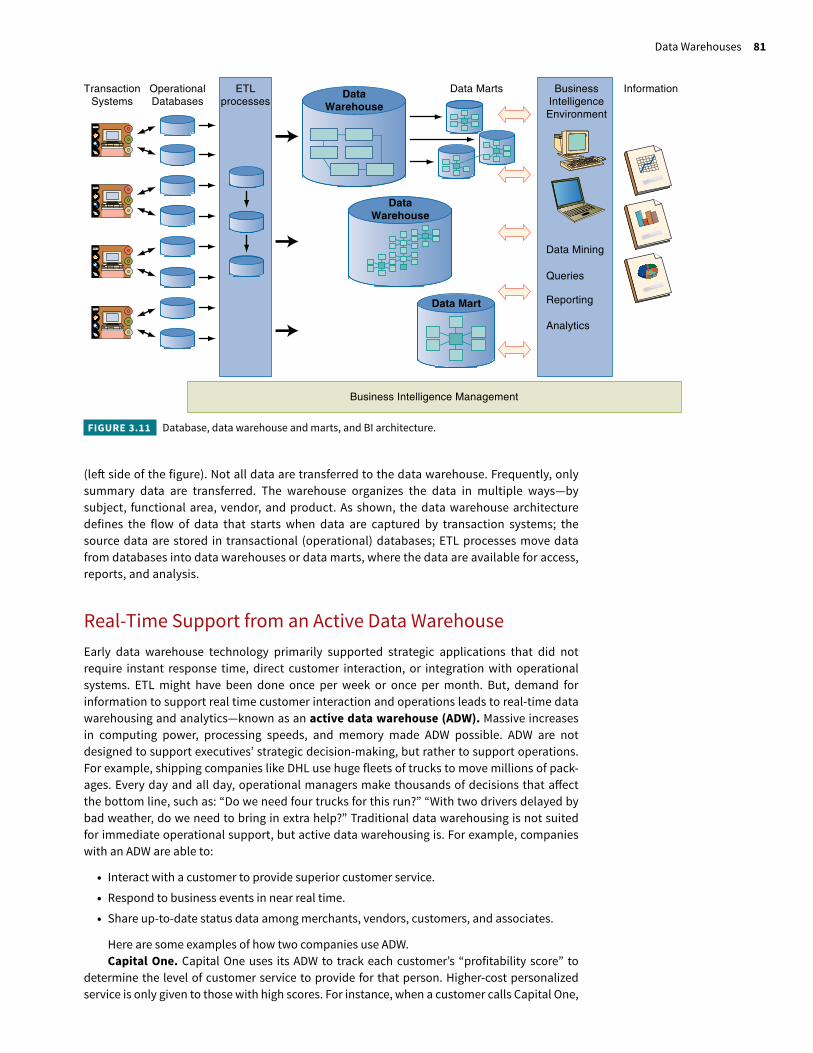
Building a Data WarehouseFigure 3.11 diagrams the process of building and using a data warehouse. The organization’s data from operational transaction processes systems are stored in operational databases
Data warehouses that pull together data from disparate sources and databases across an entire enterprise are called enterprise data warehouses (EDWs).
Data warehouses store data from various source systems and databases across an enterprise in order to run analytical queries against huge datasets collected over long time periods.
The high cost of data warehouses can make them too expensive for a company to imple-ment. Data marts are lower-cost, scaled-down versions of a data warehouse that can be imple-mented in a much shorter time, for example, in less than 90 days. Data marts serve a specific department or function, such as finance, marketing, or operations. Since they store smaller amounts of data, they are faster and easier to use, and navigate.
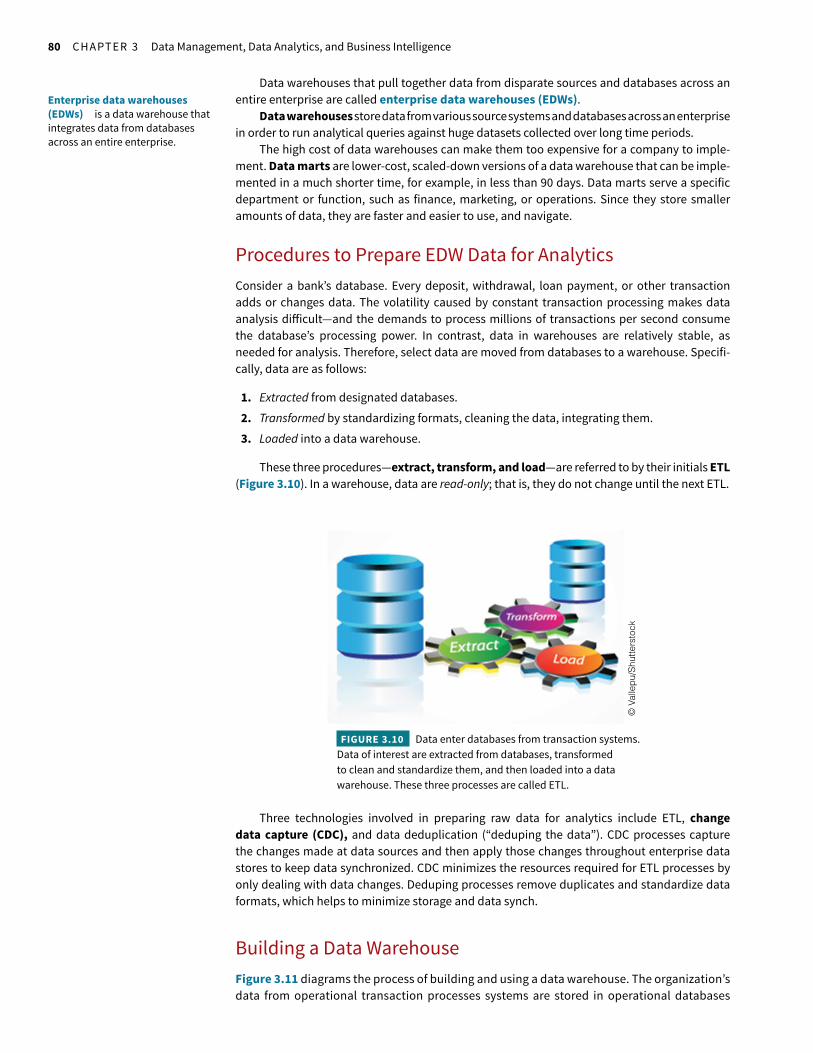
Procedures to Prepare EDW Data for AnalyticsConsider a bank’s database. Every deposit, withdrawal, loan payment, or other transaction adds or changes data. The volatility caused by constant transaction processing makes data analysis di!icult—and the demands to process millions of transactions per second consume the database’s processing power. In contrast, data in warehouses are relatively stable, as needed for analysis. Therefore, select data are moved from databases to a warehouse. Specifi-cally, data are as follows:
1. Extracted from designated databases.2. Transformed by standardizing formats, cleaning the data, integrating them.3. Loaded into a data warehouse.
These three procedures—extract, transform, and load—are referred to by their initials ETL (Figure 3.10). In a warehouse, data are read-only; that is, they do not change until the next ETL.
Enterprise data warehouses (EDWs) is a data warehouse that integrates data from databases across an entire enterprise.
© V
alle
pu/S
hutte
rsto
ck
FIGURE 3.10 Data enter databases from transaction systems. Data of interest are extracted from databases, transformed to clean and standardize them, and then loaded into a data warehouse. These three processes are called ETL.
Data Warehouses 81
Business Intelligence Management
Analytics
Reporting
Queries
Data Mining
InformationData Marts
Data Mart
DataWarehouse
DataWarehouse
BusinessIntelligenceEnvironment
ETLprocesses
TransactionSystems
OperationalDatabases
FIGURE 3.11 Database, data warehouse and marts, and BI architecture.
(le# side of the figure). Not all data are transferred to the data warehouse. Frequently, only summary data are transferred. The warehouse organizes the data in multiple ways—by subject, functional area, vendor, and product. As shown, the data warehouse architecture defines the flow of data that starts when data are captured by transaction systems; the source data are stored in transactional (operational) databases; ETL processes move data from databases into data warehouses or data marts, where the data are available for access, reports, and analysis.
Real-Time Support from an Active Data WarehouseEarly data warehouse technology primarily supported strategic applications that did not require instant response time, direct customer interaction, or integration with operational systems. ETL might have been done once per week or once per month. But, demand for information to support real time customer interaction and operations leads to real-time data warehousing and analytics—known as an active data warehouse (ADW). Massive increases in computing power, processing speeds, and memory made ADW possible. ADW are not designed to support executives’ strategic decision-making, but rather to support operations. For example, shipping companies like DHL use huge fleets of trucks to move millions of pack-ages. Every day and all day, operational managers make thousands of decisions that a!ect the bottom line, such as: “Do we need four trucks for this run?” “With two drivers delayed by bad weather, do we need to bring in extra help?” Traditional data warehousing is not suited for immediate operational support, but active data warehousing is. For example, companies with an ADW are able to:
• Interact with a customer to provide superior customer service.• Respond to business events in near real time.• Share up-to-date status data among merchants, vendors, customers, and associates.
Here are some examples of how two companies use ADW.Capital One. Capital One uses its ADW to track each customer’s “profitability score” to
determine the level of customer service to provide for that person. Higher-cost personalized service is only given to those with high scores. For instance, when a customer calls Capital One,
82 CHAPTER 3 Data Management, Data Analytics, and Business Intelligence
he or she is asked to enter a credit card number, which is linked to a profitability score. Low-profit customers get a voice response unit only; high-profit customers are connected to a live customer service representative (CSR) because the company wants to minimize the risk of los-ing those customers.
Travelocity. If you use Travelocity, an ADW is finding the best travel deals especially for you. The goal is to use “today’s data today” instead of “yesterday’s data today.” The online travel agency’s ADW analyzes your search history and destinations of interest; then predicts travel o!ers that you would most likely purchase. O!ers are both relevant and timely to enhance your experience, which helps close the sale in a very competitive market. For example, when a cus-tomer is searching flights and hotels in Las Vegas, Travelocity recognizes the interest—the cus-tomer wants to go to Vegas. The ADW searches for the best-priced flights from all carriers, builds a few package deals, and presents them in real time to the customer. When customers see a personalized o!er they are already interested in, the ADW helps generate a better customer experience. The real-time data-driven experience increases the conversion rate and sales.
Data warehouse content can be delivered to decision-makers throughout the enterprise via the cloud or company-owned intranets. Users can view, query, and analyze the data and produce reports using Web browsers. These are extremely economical and e!ective data delivery methods.
Data Warehousing Supports Action as well as Decisions Many organiza-tions built data warehouses because they were frustrated with inconsistent data that could not support decisions or actions. Viewed from this perspective, data warehouses are infrastruc-ture investments that companies make to support ongoing and future operations, including the following:
• Marketing Keeps people informed of the status of products, marketing program e!ec-tiveness, and product line profitability; and allows them to take intelligent action to maxi-mize per-customer profitability.
• Pricing and contracts Calculates costs accurately in order to optimize pricing of a contract. Without accurate cost data, prices may be below or too near to cost; or prices may be uncompetitive because they are too high.
• Forecasting Estimates customer demand for products and services.• Sales Calculates sales profitability and productivity for all territories and regions; ana-
lyzes results by geography, product, sales group, or individual.• Financial Provides real-time data for optimal credit terms, portfolio analysis, and
actions that reduce risk or bad debt expense.
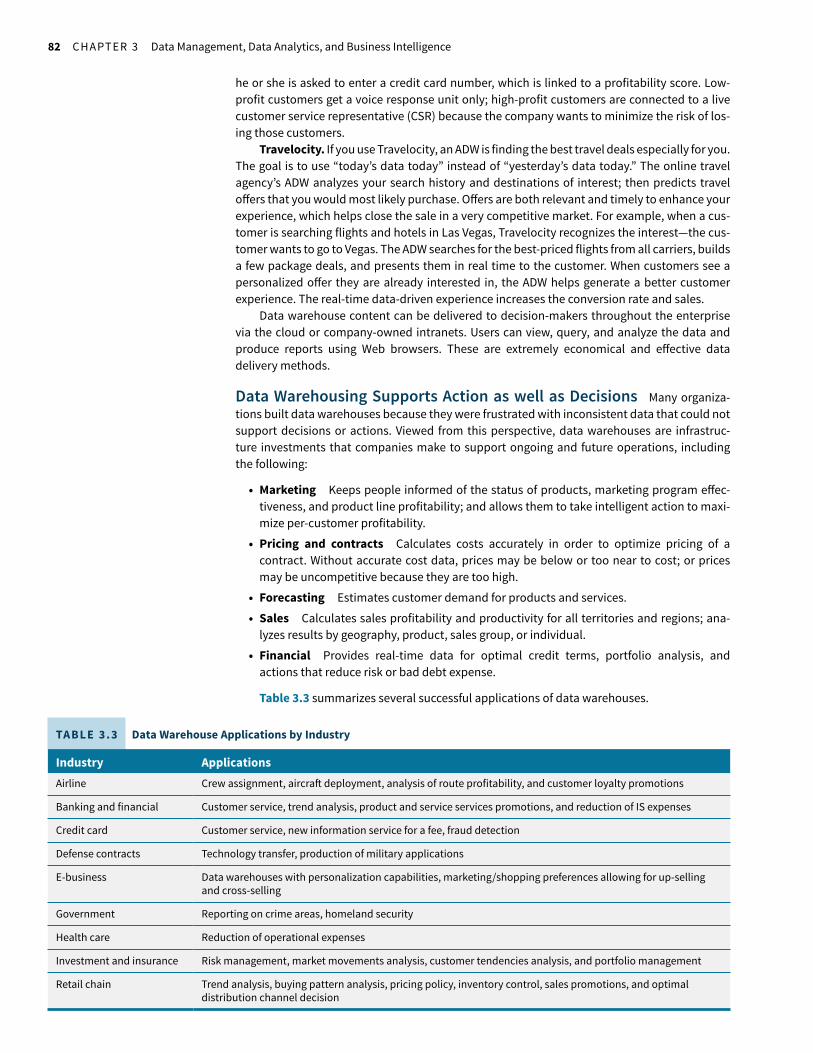
Table 3.3 summarizes several successful applications of data warehouses.
TABLE 3.3 Data Warehouse Applications by Industry
Industry ApplicationsAirline Crew assignment, aircra# deployment, analysis of route profitability, and customer loyalty promotions
Banking and financial Customer service, trend analysis, product and service services promotions, and reduction of IS expenses
Credit card Customer service, new information service for a fee, fraud detection
Defense contracts Technology transfer, production of military applications
E-business Data warehouses with personalization capabilities, marketing/shopping preferences allowing for up-selling and cross-selling
Government Reporting on crime areas, homeland security
Health care Reduction of operational expenses
Investment and insurance Risk management, market movements analysis, customer tendencies analysis, and portfolio management
Retail chain Trend analysis, buying pattern analysis, pricing policy, inventory control, sales promotions, and optimal distribution channel decision
Big Data Analytics and Data Discovery 83
Questions
1. What are the di!erences between databases and data warehouses?
2. What are the di!erences between data warehouses and data marts?
3. Explain ETL.
4. Explain CDC.
5. What is an advantage of an enterprise data warehouse (EDW)?
6. Why might a company invest in a data mart instead of a data warehouse?
7. What types of decisions can benefit from a data warehouse?
3.4 Big Data Analytics and Data DiscoveryLike mobile and cloud, big data and advanced data analytics are reshaping organizations and business processes to increase e!iciency and improve performance. Research firm IDC fore-casts that big data and analytics spending will reach $187 billion in 2019 (Ovalsrud, 2016).
Data analytics is an important tool across organizations, which helps users discover meaningful real-time insights to meet customer expectations, achieve better results and stay competitive. These deeper insights combined with human expertise enable people to recog-nize meaningful relationships more quickly or easily; and furthermore, realize the strategic implications of these situations. Imagine trying to make sense of the fast and vast data gener-ated by social media campaigns on Facebook or by sensors attached to machines or objects. Low-cost sensors make it possible to monitor all types of physical things—while analytics makes it possible to understand those data in order to take action in real time. For example, sensors data can be analyzed in real time:
• To monitor and regulate the temperature and climate conditions of perishable foods as they are transported from farm to supermarket.
• To sni! for signs of spoilage of fruits and raw vegetables and detect the risk of E. coli con-tamination.
• To track the condition of operating machinery and predict the probability of failure.• To track the wear of engines and determine when preventive maintenance is needed.
In this section, you will learn about the value, challenges, and technologies involved in putting data and analytics to use to support decisions and action, together with examples of skill sets currently in high demand by organizations expanding their e!orts to train, hire and retain com-petent data professionals (Career Insight 3.1).
Big data is an extremely large data set that is too large or complex to be analyzed using traditional data processing techniques.
Data analytics is a technique of qualitatively or quantitatively analyzing a data set to reveal patterns, trends, and associations that o#en relate to human behavior and interactions, to enhance productivity and business gain.
Career Insight 3.1
Managing and Interpreting Big Data are High Demand SkillsConcerns about the analytics skills gap have existed for years. It is increasingly clear that the shortage isn’t just in data scientists, but also data engineers, data analysts, and even the executives required to manage data initiatives. As a result, organizations and institu-tions are expanding their e!orts to train, hire, and retain data pro-fessionals. Here are two of those skill sets that are in high demand.
Big data specialists manage and package big data collec-tions, analyze, and interpret trends and present their findings in easy to understand ways to “C”-level executives. Those who can present the data through user-friendly data visualizations will be
particularly sought a#er. Skills required of these big data profes-sionals include big data visualization, statistical analysis, Big Data reporting and presentation, Apache Hadoop, NoSQL Database Skills, and machine learning.
Business intelligence (BI) analysts use tools and techniques to go beyond the numbers of big data and take action based on the findings of the big data analyses. Successful BI professionals use self-service BI platforms, like Tableau, SAP, Oracle BI, Micro-so# BI, and IBM Cognos, to create BI reports and visualizations to streamline the process and reduce reliance on additional sta!. Additional skills of critical thinking, creative problem solving, e!ective communication, and presentations further enhance their attractiveness to employers (Hammond, 2015).
84 CHAPTER 3 Data Management, Data Analytics, and Business Intelligence
When the data set is too large or complex to be analyzed using traditional data processing applications, big data analytics tools are used. One of the biggest sectors of customer rela-tions relative to big data is customer value analytics (CVA). CVA studies the recent phenomenon that customers are more willing to use and purchase innovative products, services, and cus-tomer service channels while demanding an increasing amount of high-quality, personalized products. Companies and producers use big data analytics to capture this combination to transform the information into usable data to track and predict trends. If companies know what customers like, what makes them spend more, and when they are happy, they can leverage the information to keep them happy and provide better products and services.
Companies can also use big data analytics to store and use their data across the supply chain. To maximize the e!ectiveness of data analytics, companies usually complete these objectives throughout their input transformation process:
• Invest heavily in IT to collect, integrate, and analyze data from each store and sales unit.• Link these data to suppliers’ databases, making it possible to adjust prices in real time, to
reorder hot-selling items automatically, and to shi# items from store to store easily.• Constantly test, integrate, and report information instantly available across the organization—
from the store floor to the CFO’s o!ice.
These big data programs enable them to pinpoint improvement opportunities across the supply chain—from purchasing to in-store availability management. Specifically, the companies are able to predict how customers will behave and use that knowledge to be prepared to respond quickly. According to Louis Columbus at Forbes, the market demand for big data analytics is about to hit its largest increase in history. So#ware for business analytics will increase by more than 50% by 2019. Prescriptive analytics so#ware will be worth $1.1B in 2019, compared to its value of $415M in 2014. Since increasing the focus on customer demand trends, e!ectively entering new markets and producing better business models, and enhancing organizational performance are the most important goals for 21st-century companies, business analytics will be needed in almost every instance. Taking advantage of the benefits of business intelligence is allowing sectors like health care to compete in areas they would have not been able to enter before (Columbus, 2016).
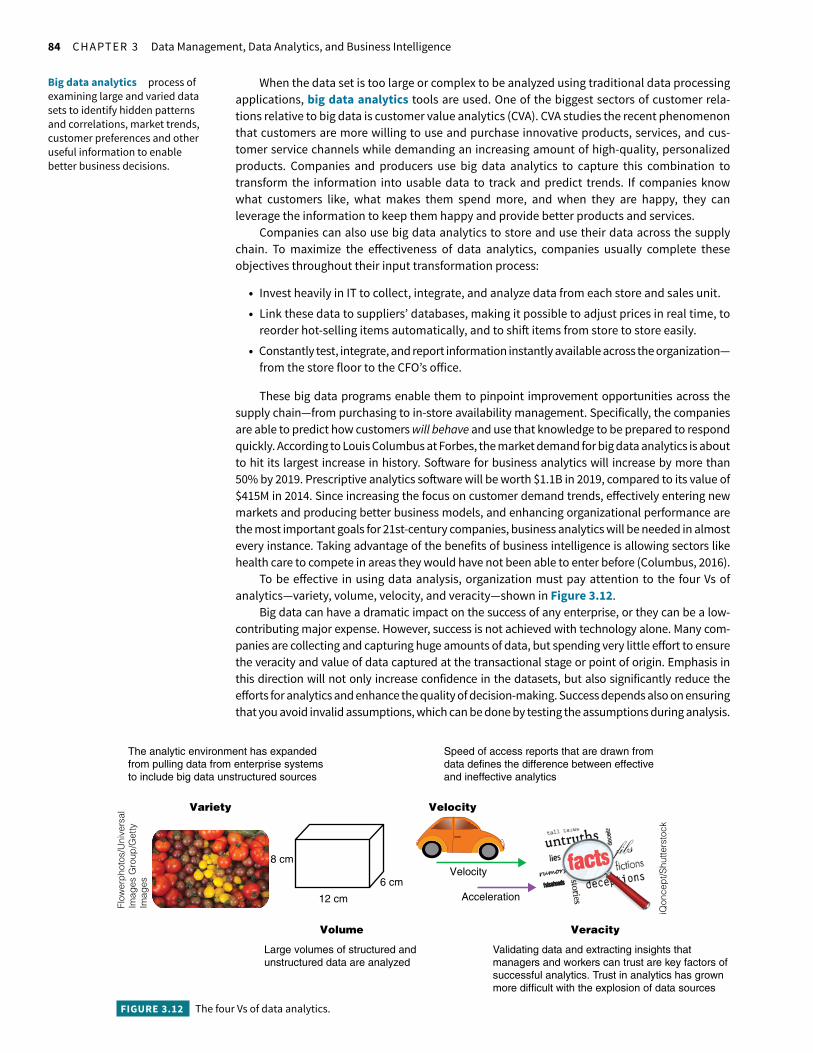
To be e!ective in using data analysis, organization must pay attention to the four Vs of analytics—variety, volume, velocity, and veracity—shown in Figure 3.12.
Big data can have a dramatic impact on the success of any enterprise, or they can be a low-contributing major expense. However, success is not achieved with technology alone. Many com-panies are collecting and capturing huge amounts of data, but spending very little e!ort to ensure the veracity and value of data captured at the transactional stage or point of origin. Emphasis in this direction will not only increase confidence in the datasets, but also significantly reduce the e!orts for analytics and enhance the quality of decision-making. Success depends also on ensuring that you avoid invalid assumptions, which can be done by testing the assumptions during analysis.
Big data analytics process of examining large and varied data sets to identify hidden patterns and correlations, market trends, customer preferences and other useful information to enable better business decisions.
Variety
Volume
Velocity
Veracity
Validating data and extracting insights thatmanagers and workers can trust are key factors of successful analytics. Trust in analytics has grownmore difficult with the explosion of data sources
Speed of access reports that are drawn fromdata defines the difference between effectiveand ineffective analytics
Large volumes of structured and unstructured data are analyzed
The analytic environment has expandedfrom pulling data from enterprise systems to include big data unstructured sources
8 cm
12 cm
Flow
erph
otos
/Uni
vers
alIm
ages
Gro
up/G
etty
Imag
es
iQon
cept
/Shu
tters
tock
6 cmVelocity
Acceleration
FIGURE 3.12 The four Vs of data analytics.
Big Data Analytics and Data Discovery 85
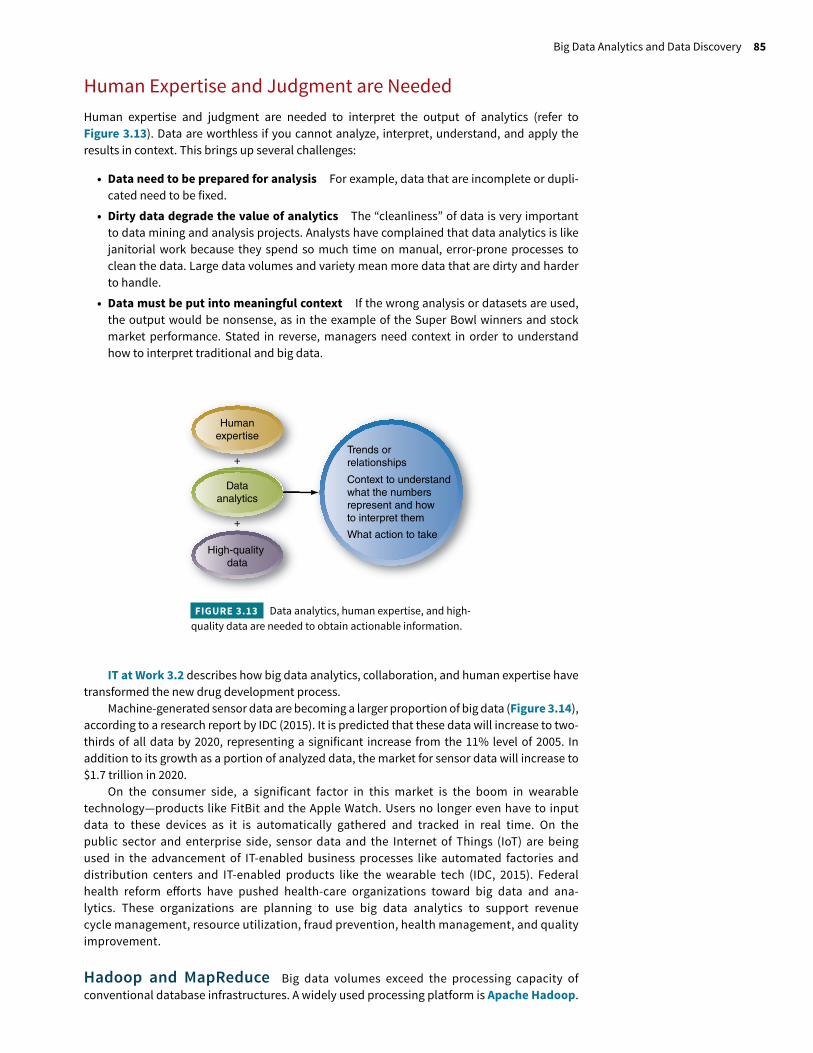
Human Expertise and Judgment are NeededHuman expertise and judgment are needed to interpret the output of analytics (refer to Figure 3.13). Data are worthless if you cannot analyze, interpret, understand, and apply the results in context. This brings up several challenges:
• Data need to be prepared for analysis For example, data that are incomplete or dupli-cated need to be fixed.
• Dirty data degrade the value of analytics The “cleanliness” of data is very important to data mining and analysis projects. Analysts have complained that data analytics is like janitorial work because they spend so much time on manual, error-prone processes to clean the data. Large data volumes and variety mean more data that are dirty and harder to handle.
• Data must be put into meaningful context If the wrong analysis or datasets are used, the output would be nonsense, as in the example of the Super Bowl winners and stock market performance. Stated in reverse, managers need context in order to understand how to interpret traditional and big data.
Humanexpertise
Dataanalytics
High-quality data
Trends orrelationships
Context to understand what the numbersrepresent and howto interpret them
What action to take
+
+
FIGURE 3.13 Data analytics, human expertise, and high-quality data are needed to obtain actionable information.
IT at Work 3.2 describes how big data analytics, collaboration, and human expertise have transformed the new drug development process.
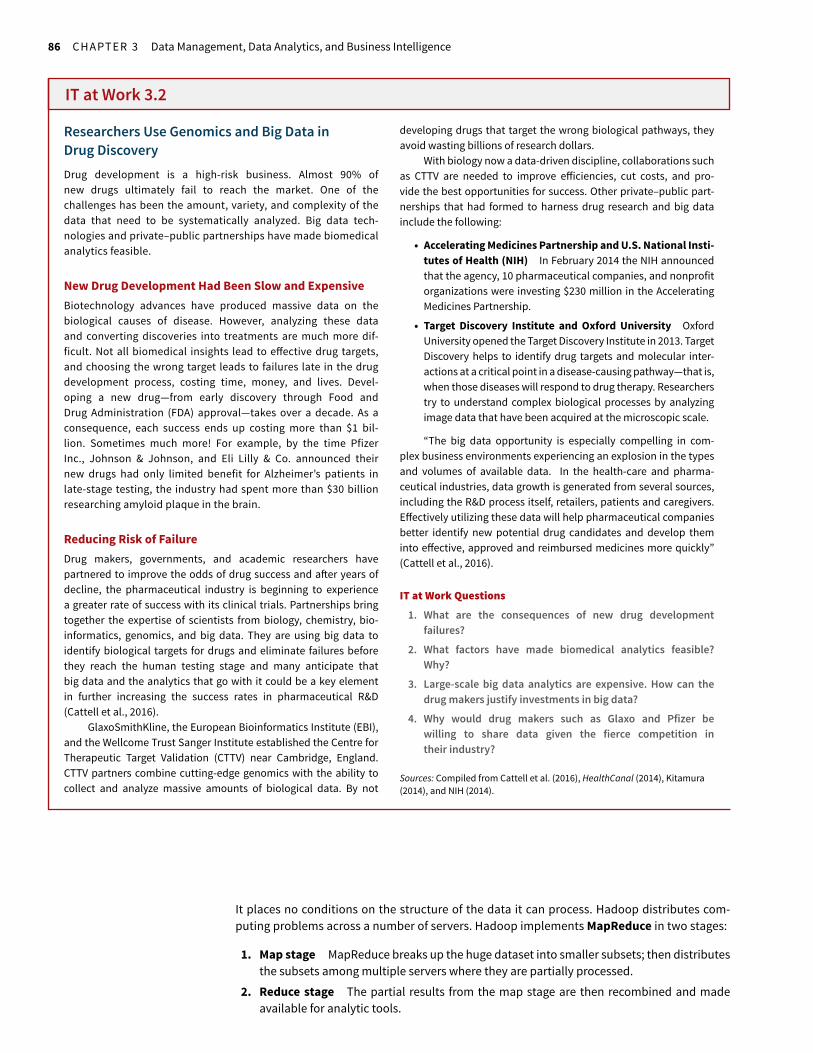
Machine-generated sensor data are becoming a larger proportion of big data (Figure 3.14), according to a research report by IDC (2015). It is predicted that these data will increase to two-thirds of all data by 2020, representing a significant increase from the 11% level of 2005. In addition to its growth as a portion of analyzed data, the market for sensor data will increase to $1.7 trillion in 2020.
On the consumer side, a significant factor in this market is the boom in wearable technology—products like FitBit and the Apple Watch. Users no longer even have to input data to these devices as it is automatically gathered and tracked in real time. On the public sector and enterprise side, sensor data and the Internet of Things (IoT) are being used in the advancement of IT-enabled business processes like automated factories and distribution centers and IT-enabled products like the wearable tech (IDC, 2015). Federal health reform e!orts have pushed health-care organizations toward big data and ana-lytics. These organizations are planning to use big data analytics to support revenue cycle management, resource utilization, fraud prevention, health management, and quality improvement.
Hadoop and MapReduce Big data volumes exceed the processing capacity of conventional database infrastructures. A widely used processing platform is Apache Hadoop.
86 CHAPTER 3 Data Management, Data Analytics, and Business Intelligence
It places no conditions on the structure of the data it can process. Hadoop distributes com-puting problems across a number of servers. Hadoop implements MapReduce in two stages:
1. Map stage MapReduce breaks up the huge dataset into smaller subsets; then distributes the subsets among multiple servers where they are partially processed.
2. Reduce stage The partial results from the map stage are then recombined and made available for analytic tools.
IT at Work 3.2
Researchers Use Genomics and Big Data in Drug DiscoveryDrug development is a high-risk business. Almost 90% of new drugs ultimately fail to reach the market. One of the challenges has been the amount, variety, and complexity of the data that need to be systematically analyzed. Big data tech-nologies and private–public partnerships have made biomedical analytics feasible.
New Drug Development Had Been Slow and ExpensiveBiotechnology advances have produced massive data on the biological causes of disease. However, analyzing these data and converting discoveries into treatments are much more dif-ficult. Not all biomedical insights lead to e!ective drug targets, and choosing the wrong target leads to failures late in the drug development process, costing time, money, and lives. Devel-oping a new drug—from early discovery through Food and Drug Administration (FDA) approval—takes over a decade. As a consequence, each success ends up costing more than $1 bil-lion. Sometimes much more! For example, by the time Pfizer Inc., Johnson & Johnson, and Eli Lilly & Co. announced their new drugs had only limited benefit for Alzheimer’s patients in late-stage testing, the industry had spent more than $30 billion researching amyloid plaque in the brain.
Reducing Risk of FailureDrug makers, governments, and academic researchers have partnered to improve the odds of drug success and a#er years of decline, the pharmaceutical industry is beginning to experience a greater rate of success with its clinical trials. Partnerships bring together the expertise of scientists from biology, chemistry, bio-informatics, genomics, and big data. They are using big data to identify biological targets for drugs and eliminate failures before they reach the human testing stage and many anticipate that big data and the analytics that go with it could be a key element in further increasing the success rates in pharmaceutical R&D (Cattell et al., 2016).
GlaxoSmithKline, the European Bioinformatics Institute (EBI), and the Wellcome Trust Sanger Institute established the Centre for Therapeutic Target Validation (CTTV) near Cambridge, England. CTTV partners combine cutting-edge genomics with the ability to collect and analyze massive amounts of biological data. By not
developing drugs that target the wrong biological pathways, they avoid wasting billions of research dollars.
With biology now a data-driven discipline, collaborations such as CTTV are needed to improve e!iciencies, cut costs, and pro-vide the best opportunities for success. Other private–public part-nerships that had formed to harness drug research and big data include the following:
• Accelerating Medicines Partnership and U.S. National Insti-tutes of Health (NIH) In February 2014 the NIH announced that the agency, 10 pharmaceutical companies, and nonprofit organizations were investing $230 million in the Accelerating Medicines Partnership.
• Target Discovery Institute and Oxford University Oxford University opened the Target Discovery Institute in 2013. Target Discovery helps to identify drug targets and molecular inter-actions at a critical point in a disease-causing pathway—that is, when those diseases will respond to drug therapy. Researchers try to understand complex biological processes by analyzing image data that have been acquired at the microscopic scale.
“The big data opportunity is especially compelling in com-plex business environments experiencing an explosion in the types and volumes of available data. In the health-care and pharma-ceutical industries, data growth is generated from several sources, including the R&D process itself, retailers, patients and caregivers. E!ectively utilizing these data will help pharmaceutical companies better identify new potential drug candidates and develop them into e!ective, approved and reimbursed medicines more quickly” (Cattell et al., 2016).
IT at Work Questions1. What are the consequences of new drug development
failures?2. What factors have made biomedical analytics feasible?
Why?3. Large-scale big data analytics are expensive. How can the
drug makers justify investments in big data?4. Why would drug makers such as Glaxo and Pfizer be
willing to share data given the fierce competition in their industry?
Sources: Compiled from Cattell et al. (2016), HealthCanal (2014), Kitamura (2014), and NIH (2014).
Big Data Analytics and Data Discovery 87
To store data, Hadoop has its own distributed file system, Hadoop File System (HDFS), which functions in three stages:
• Loads data into HDFS.• Performs the MapReduce operations.• Retrieves results from HDFS.
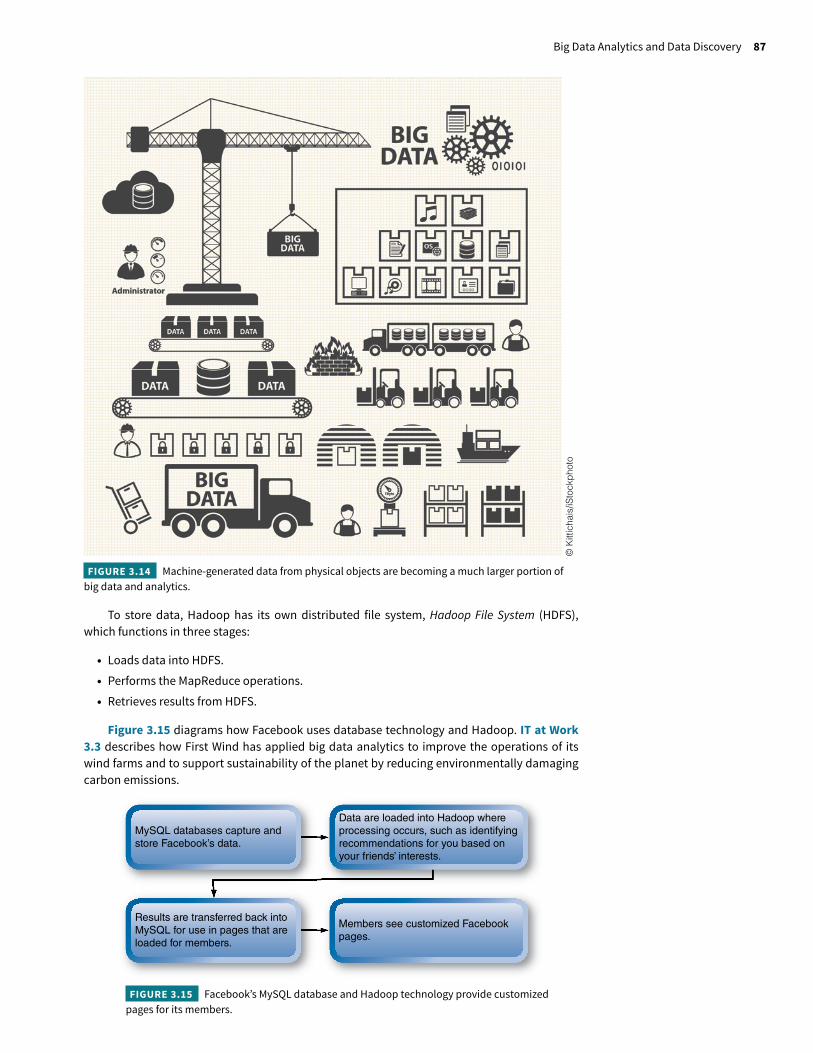
Figure 3.15 diagrams how Facebook uses database technology and Hadoop. IT at Work 3.3 describes how First Wind has applied big data analytics to improve the operations of its wind farms and to support sustainability of the planet by reducing environmentally damaging carbon emissions.
© K
ittic
hais
/iSto
ckph
oto
FIGURE 3.14 Machine-generated data from physical objects are becoming a much larger portion of big data and analytics.
MySQL databases capture andstore Facebook’s data.
Results are transferred back intoMySQL for use in pages that areloaded for members.
Members see customized Facebookpages.
Data are loaded into Hadoop whereprocessing occurs, such as identifyingrecommendations for you based onyour friends’ interests.
FIGURE 3.15 Facebook’s MySQL database and Hadoop technology provide customized pages for its members.
88 CHAPTER 3 Data Management, Data Analytics, and Business Intelligence
Data and Text MiningData and text mining are di!erent from DBMS and data analytics. As you have read earlier in this chapter, a DBMS supports queries to extract data or get answers from huge databases. But, in order to perform queries in a DBMS you must first know the question you want to be answered. You also have read that Data Analytics describes the entire function of applying technologies, algorithms, human expertise, and judgment. Data and text mining are specific analytic tech-niques that allow users to discover knowledge that they didn’t know existed in the databases.
Data mining so#ware enables users to analyze data from various dimensions or angles, cat-egorize them, and find correlations or patterns among fields in the data warehouse. Up to 75% of an organization’s data are nonstructured word-processing documents, social media, text mes-sages, audio, video, images and diagrams, faxes and memos, call center or claims notes, and so on.
IT at Work 3.4 describes one example of how the U.S. government is using data mining so#ware to continuously improve its detection and deterrence systems.
Text mining is a broad category that involves interpreting words and concepts in con-text. Any customer becomes a brand advocate or adversary by freely expressing opinions and attitudes that reach millions of other current or prospective customers on social media. Text mining helps companies tap into the explosion of customer opinions expressed online. Social commentary and social media are being mined for sentiment analysis or to understand consumer intent. Innovative companies know they could be more successful in meeting their customers’ needs, if they just understood them better. Tools and techniques for analyzing text, documents, and other nonstructured content are available from several vendors.
Combining data and text mining can create even greater value. Burns (2016) pointed out that mining text or nonstructural data enables organizations to forecast the future instead of merely reporting the past. He also noted that forecasting methods using existing structured data and non-structured text from both internal and external sources provide the best view of what lies ahead.
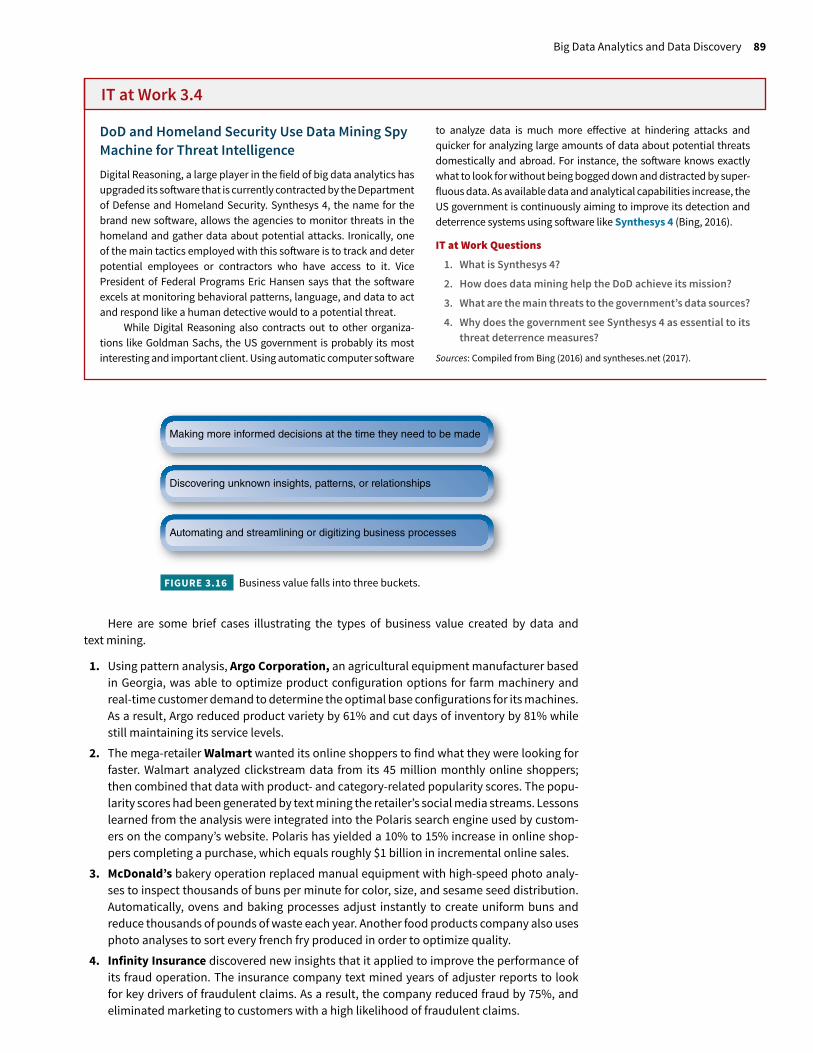
Creating Business ValueEnterprises invest in data mining tools to add business value. Business value falls into three categories, as shown in Figure 3.16.
IT at Work 3.3
Industrial Project Relies on Big Data AnalyticsWind power can play a major role in meeting America’s rising demand for electricity—as much as 20% by 2030. Using more domestic wind power would reduce the nation’s dependence on foreign sources of natural gas and also decrease carbon dioxide (CO2) emissions that contribute to adverse climate change.
First Wind is an independent North American renewable energy company focused on the development, financing, construction, ownership, and operation of utility-scale power projects in the United States. Based in Boston, First Wind has developed and oper-ates 980 megawatts (MW) of generating capacity at 16 wind energy projects in Maine, New York, Vermont, Utah, Washington, and Hawaii. First Wind has a large network of sensors embedded in the wind turbines, which generate huge volumes of data continuously. The data are transmitted in real time and analyzed on a 24/7 real time basis to understand the performance of each wind turbine.
Sensors collect massive amounts of data on the temperature, wind speeds, location, and pitch of the blades. The data are ana-lyzed to study the operation of each turbine in order to adjust them to maximum e!iciency. By analyzing sensor data, highly refined
measurements of wind speeds are possible. In wintry conditions, turbines can detect when they are icing up, and speed up or change pitch to knock o! the ice. In the past, when it was extremely windy, turbines in the entire farm had been turned o! to prevent damage from rotating too fast. Now First Wind can identify the specific por-tion of turbines that need to be shut down. Based on certain alerts, decisions o#en need to be taken within a few seconds.
Upgrades on 123 turbines on two wind farms have improved energy output by 3%, or about 120 megawatt hours per turbine per year. That improvement translates to $1.2 million in additional revenue a year from these two farms.
IT at Work Questions1. What are the benefits of big data analytics to First Wind?2. What are the benefits of big data analytics to the environ-
ment and the nation?3. How do big data analytics impact the performance of
wind farms?
Sources: Compiled from www.FirstWind.com (2014) and U.S. Department of Energy (2015).
Big Data Analytics and Data Discovery 89
Here are some brief cases illustrating the types of business value created by data and text mining.
1. Using pattern analysis, Argo Corporation, an agricultural equipment manufacturer based in Georgia, was able to optimize product configuration options for farm machinery and real-time customer demand to determine the optimal base configurations for its machines. As a result, Argo reduced product variety by 61% and cut days of inventory by 81% while still maintaining its service levels.
2. The mega-retailer Walmart wanted its online shoppers to find what they were looking for faster. Walmart analyzed clickstream data from its 45 million monthly online shoppers; then combined that data with product- and category-related popularity scores. The popu-larity scores had been generated by text mining the retailer’s social media streams. Lessons learned from the analysis were integrated into the Polaris search engine used by custom-ers on the company’s website. Polaris has yielded a 10% to 15% increase in online shop-pers completing a purchase, which equals roughly $1 billion in incremental online sales.
3. McDonald’s bakery operation replaced manual equipment with high-speed photo analy-ses to inspect thousands of buns per minute for color, size, and sesame seed distribution. Automatically, ovens and baking processes adjust instantly to create uniform buns and reduce thousands of pounds of waste each year. Another food products company also uses photo analyses to sort every french fry produced in order to optimize quality.
4. Infinity Insurance discovered new insights that it applied to improve the performance of its fraud operation. The insurance company text mined years of adjuster reports to look for key drivers of fraudulent claims. As a result, the company reduced fraud by 75%, and eliminated marketing to customers with a high likelihood of fraudulent claims.
Making more informed decisions at the time they need to be made
Discovering unknown insights, patterns, or relationships
Automating and streamlining or digitizing business processes
FIGURE 3.16 Business value falls into three buckets.
IT at Work 3.4
DoD and Homeland Security Use Data Mining Spy Machine for Threat IntelligenceDigital Reasoning, a large player in the field of big data analytics has upgraded its so#ware that is currently contracted by the Department of Defense and Homeland Security. Synthesys 4, the name for the brand new so#ware, allows the agencies to monitor threats in the homeland and gather data about potential attacks. Ironically, one of the main tactics employed with this so#ware is to track and deter potential employees or contractors who have access to it. Vice President of Federal Programs Eric Hansen says that the so#ware excels at monitoring behavioral patterns, language, and data to act and respond like a human detective would to a potential threat.
While Digital Reasoning also contracts out to other organiza-tions like Goldman Sachs, the US government is probably its most interesting and important client. Using automatic computer so#ware
to analyze data is much more e!ective at hindering attacks and quicker for analyzing large amounts of data about potential threats domestically and abroad. For instance, the so#ware knows exactly what to look for without being bogged down and distracted by super-fluous data. As available data and analytical capabilities increase, the US government is continuously aiming to improve its detection and deterrence systems using so#ware like Synthesys 4 (Bing, 2016).
IT at Work Questions1. What is Synthesys 4?2. How does data mining help the DoD achieve its mission?3. What are the main threats to the government’s data sources?4. Why does the government see Synthesys 4 as essential to its
threat deterrence measures?
Sources: Compiled from Bing (2016) and syntheses.net (2017).
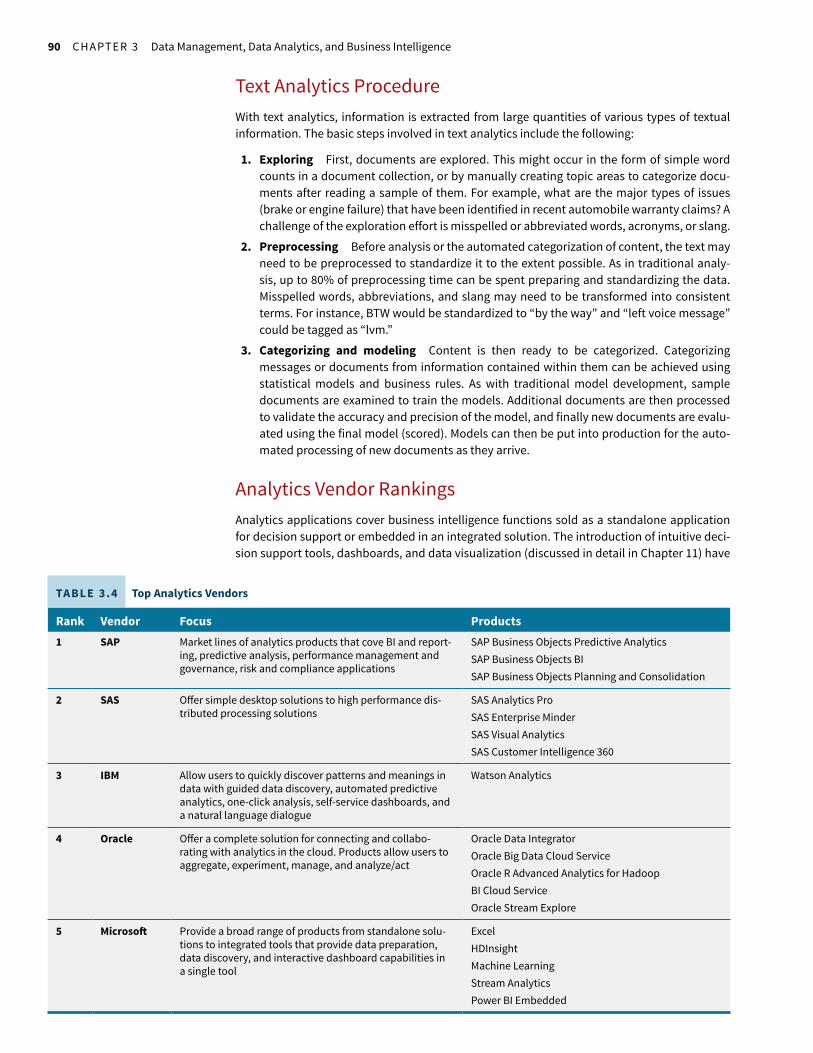
90 CHAPTER 3 Data Management, Data Analytics, and Business Intelligence
Text Analytics ProcedureWith text analytics, information is extracted from large quantities of various types of textual information. The basic steps involved in text analytics include the following:
1. Exploring First, documents are explored. This might occur in the form of simple word counts in a document collection, or by manually creating topic areas to categorize docu-ments after reading a sample of them. For example, what are the major types of issues (brake or engine failure) that have been identified in recent automobile warranty claims? A challenge of the exploration effort is misspelled or abbreviated words, acronyms, or slang.
2. Preprocessing Before analysis or the automated categorization of content, the text may need to be preprocessed to standardize it to the extent possible. As in traditional analy-sis, up to 80% of preprocessing time can be spent preparing and standardizing the data. Misspelled words, abbreviations, and slang may need to be transformed into consistent terms. For instance, BTW would be standardized to “by the way” and “left voice message” could be tagged as “lvm.”
3. Categorizing and modeling Content is then ready to be categorized. Categorizing messages or documents from information contained within them can be achieved using statistical models and business rules. As with traditional model development, sample documents are examined to train the models. Additional documents are then processed to validate the accuracy and precision of the model, and finally new documents are evalu-ated using the final model (scored). Models can then be put into production for the auto-mated processing of new documents as they arrive.
Analytics Vendor RankingsAnalytics applications cover business intelligence functions sold as a standalone application for decision support or embedded in an integrated solution. The introduction of intuitive deci-sion support tools, dashboards, and data visualization (discussed in detail in Chapter 11) have
TABLE 3.4 Top Analytics Vendors
Rank Vendor Focus Products1 SAP Market lines of analytics products that cove BI and report-
ing, predictive analysis, performance management and governance, risk and compliance applications
SAP Business Objects Predictive AnalyticsSAP Business Objects BISAP Business Objects Planning and Consolidation
2 SAS O!er simple desktop solutions to high performance dis-tributed processing solutions
SAS Analytics ProSAS Enterprise MinderSAS Visual AnalyticsSAS Customer Intelligence 360
3 IBM Allow users to quickly discover patterns and meanings in data with guided data discovery, automated predictive analytics, one-click analysis, self-service dashboards, and a natural language dialogue
Watson Analytics
4 Oracle O!er a complete solution for connecting and collabo-rating with analytics in the cloud. Products allow users to aggregate, experiment, manage, and analyze/act
Oracle Data IntegratorOracle Big Data Cloud ServiceOracle R Advanced Analytics for HadoopBI Cloud ServiceOracle Stream Explore
5 Microso" Provide a broad range of products from standalone solu-tions to integrated tools that provide data preparation, data discovery, and interactive dashboard capabilities in a single tool
ExcelHDInsightMachine LearningStream AnalyticsPower BI Embedded
Business Intelligence and Electronic Records Management 91
added some interesting interactive components to big data analytics to bring the data to life and enable nonexperts to use it.
Organizations invest in analytics, BI, and data/text mining applications based on new fea-tures and capabilities beyond those o!ered by their legacy systems. Analytics vendors o!er everything from simple-to-use reporting tools to highly sophisticated so#ware for tackling the most complex data analysis problems. A list of the top five analytics and BI application vendors are shown in Table 3.4.
Questions
1. Why are human expertise and judgment important to data analytics? Give an example.
2. What is the relationship between data quality and the value of analytics?
3. Why do data need to be put into a meaningful context?
4. How can manufacturers and health care benefit from data analytics?
5. How does data mining provide value? Give an example.
6. What is text mining?
7. What are the basic steps involved in text analytics?
3.5 Business Intelligence and Electronic Records ManagementContinuing developments in data analytics and business intelligence (BI) make it increas-ingly necessary for organizations to be aware of the di!erences between these terms and the di!erent ways in which they add value in an organization. The field of BI started in the late 1980s and has been a key to competitive advantage across industries and in enterprises of all sizes. Unlike data analytics that has predictive capabilities, BI is a comprehensive term that refers to analytics and reporting tools that were traditionally used to determine trends in his-torical data.
The key distinction between data analytics and BI is that analytics uses algorithms to statis-tically determine the relationships between data whereas BI presents data insights established by data analytics in reports, easy-to-use dashboards, and interactive visualizations. BI can also make it easier for users to ask data-related questions and obtain results that are presented in a way that they can easily understand.
What started as a tool to support sales, marketing, and customer service departments has widely evolved into an enterprise wide strategic platform. While BI so#ware is used in the operational management of divisions and business processes, they are also used to support strategic corporate decision-making. The dramatic change that has taken e!ect over the last few years is the growth in demand for operational intelligence across multiple systems and businesses—increasing the number of people who need access to increasing amounts of data. Complex and competitive business conditions do not leave much slack for mistakes.
Unfortunately, some companies are not able to use their data e!iciently, creating a higher cost to gather information than the benefits it provides. Luckily, BI so#ware brings decision-making information to businesses in as little as two clicks. Small businesses have a shared interest with large corporations to enlist BI to help with decision-making, but they are usually unequipped to build data centers and use funds to hire analysts and IT consultants. However, small business BI so#ware is rapidly growing in the analytics field, and it is increasingly cheaper to implement it as a decision-making tool. Small businesses do not always have workers spe-cialized in certain areas, but BI so#ware makes it easy for all employees to analyze the data and make decisions (King, 2016).
Business intelligence (BI) is a set of tools and techniques for acquiring and transforming raw data into meaningful and useful information for business analysis purposes in the forms of reports, dashboards, or interactive visualizations.
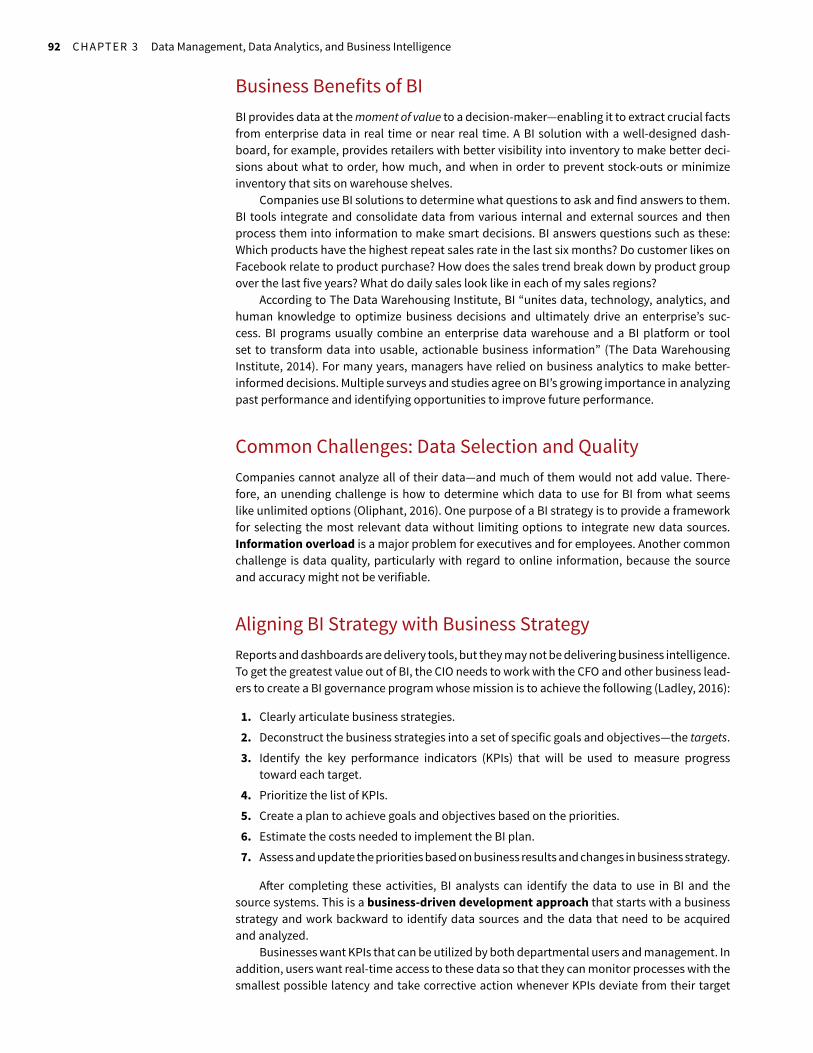
92 CHAPTER 3 Data Management, Data Analytics, and Business Intelligence
Business Benefits of BIBI provides data at the moment of value to a decision-maker—enabling it to extract crucial facts from enterprise data in real time or near real time. A BI solution with a well-designed dash-board, for example, provides retailers with better visibility into inventory to make better deci-sions about what to order, how much, and when in order to prevent stock-outs or minimize inventory that sits on warehouse shelves.
Companies use BI solutions to determine what questions to ask and find answers to them. BI tools integrate and consolidate data from various internal and external sources and then process them into information to make smart decisions. BI answers questions such as these: Which products have the highest repeat sales rate in the last six months? Do customer likes on Facebook relate to product purchase? How does the sales trend break down by product group over the last five years? What do daily sales look like in each of my sales regions?
According to The Data Warehousing Institute, BI “unites data, technology, analytics, and human knowledge to optimize business decisions and ultimately drive an enterprise’s suc-cess. BI programs usually combine an enterprise data warehouse and a BI platform or tool set to transform data into usable, actionable business information” (The Data Warehousing Institute, 2014). For many years, managers have relied on business analytics to make better-informed decisions. Multiple surveys and studies agree on BI’s growing importance in analyzing past performance and identifying opportunities to improve future performance.
Common Challenges: Data Selection and QualityCompanies cannot analyze all of their data—and much of them would not add value. There-fore, an unending challenge is how to determine which data to use for BI from what seems like unlimited options (Oliphant, 2016). One purpose of a BI strategy is to provide a framework for selecting the most relevant data without limiting options to integrate new data sources. Information overload is a major problem for executives and for employees. Another common challenge is data quality, particularly with regard to online information, because the source and accuracy might not be verifiable.
Aligning BI Strategy with Business StrategyReports and dashboards are delivery tools, but they may not be delivering business intelligence. To get the greatest value out of BI, the CIO needs to work with the CFO and other business lead-ers to create a BI governance program whose mission is to achieve the following (Ladley, 2016):
1. Clearly articulate business strategies.2. Deconstruct the business strategies into a set of specific goals and objectives—the targets.3. Identify the key performance indicators (KPIs) that will be used to measure progress
toward each target.4. Prioritize the list of KPIs.5. Create a plan to achieve goals and objectives based on the priorities.6. Estimate the costs needed to implement the BI plan.7. Assess and update the priorities based on business results and changes in business strategy.
A#er completing these activities, BI analysts can identify the data to use in BI and the source systems. This is a business-driven development approach that starts with a business strategy and work backward to identify data sources and the data that need to be acquired and analyzed.
Businesses want KPIs that can be utilized by both departmental users and management. In addition, users want real-time access to these data so that they can monitor processes with the smallest possible latency and take corrective action whenever KPIs deviate from their target
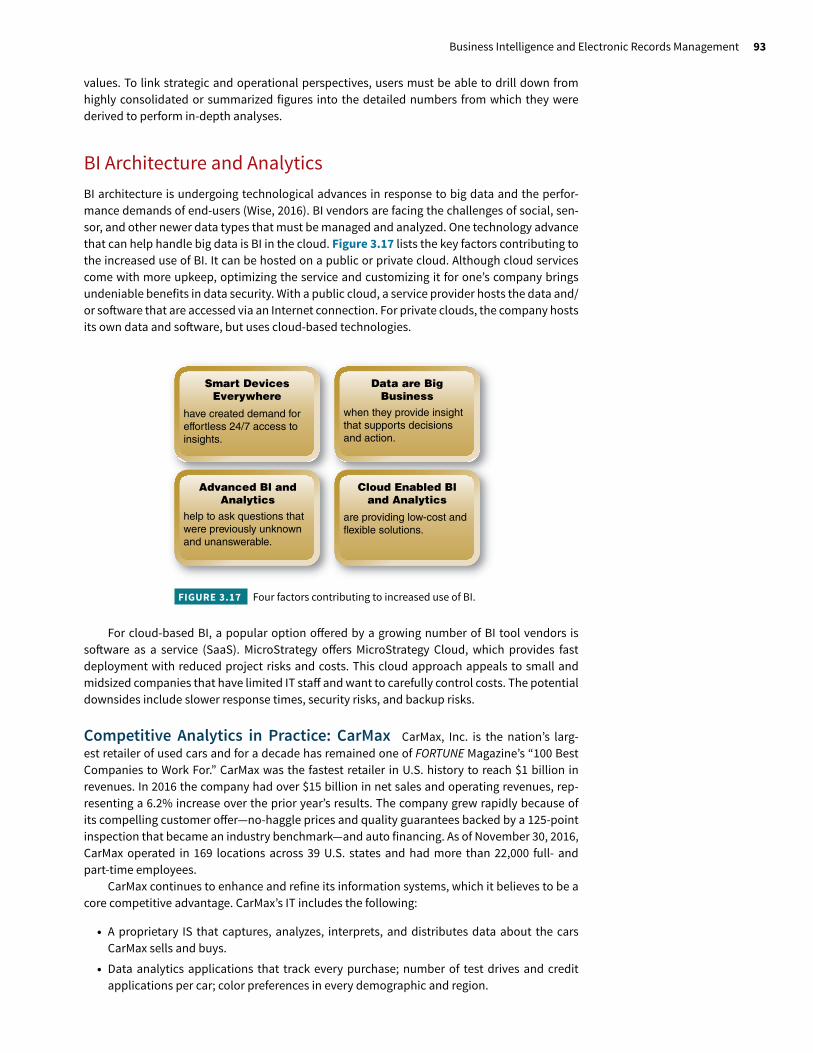
Business Intelligence and Electronic Records Management 93
values. To link strategic and operational perspectives, users must be able to drill down from highly consolidated or summarized figures into the detailed numbers from which they were derived to perform in-depth analyses.
BI Architecture and AnalyticsBI architecture is undergoing technological advances in response to big data and the perfor-mance demands of end-users (Wise, 2016). BI vendors are facing the challenges of social, sen-sor, and other newer data types that must be managed and analyzed. One technology advance that can help handle big data is BI in the cloud. Figure 3.17 lists the key factors contributing to the increased use of BI. It can be hosted on a public or private cloud. Although cloud services come with more upkeep, optimizing the service and customizing it for one’s company brings undeniable benefits in data security. With a public cloud, a service provider hosts the data and/or so#ware that are accessed via an Internet connection. For private clouds, the company hosts its own data and so#ware, but uses cloud-based technologies.
have created demand for effortless 24/7 access toinsights.
Smart DevicesEverywhere
when they provide insightthat supports decisionsand action.
Data are BigBusiness
help to ask questions thatwere previously unknownand unanswerable.
Advanced Bl andAnalytics
are providing low-cost and!exible solutions.
Cloud Enabled Bland Analytics
FIGURE 3.17 Four factors contributing to increased use of BI.
For cloud-based BI, a popular option o!ered by a growing number of BI tool vendors is so#ware as a service (SaaS). MicroStrategy o!ers MicroStrategy Cloud, which provides fast deployment with reduced project risks and costs. This cloud approach appeals to small and midsized companies that have limited IT sta! and want to carefully control costs. The potential downsides include slower response times, security risks, and backup risks.
Competitive Analytics in Practice: CarMax CarMax, Inc. is the nation’s larg-est retailer of used cars and for a decade has remained one of FORTUNE Magazine’s “100 Best Companies to Work For.” CarMax was the fastest retailer in U.S. history to reach $1 billion in revenues. In 2016 the company had over $15 billion in net sales and operating revenues, rep-resenting a 6.2% increase over the prior year’s results. The company grew rapidly because of its compelling customer o!er—no-haggle prices and quality guarantees backed by a 125-point inspection that became an industry benchmark—and auto financing. As of November 30, 2016, CarMax operated in 169 locations across 39 U.S. states and had more than 22,000 full- and part-time employees.
CarMax continues to enhance and refine its information systems, which it believes to be a core competitive advantage. CarMax’s IT includes the following:
• A proprietary IS that captures, analyzes, interprets, and distributes data about the cars CarMax sells and buys.
• Data analytics applications that track every purchase; number of test drives and credit applications per car; color preferences in every demographic and region.
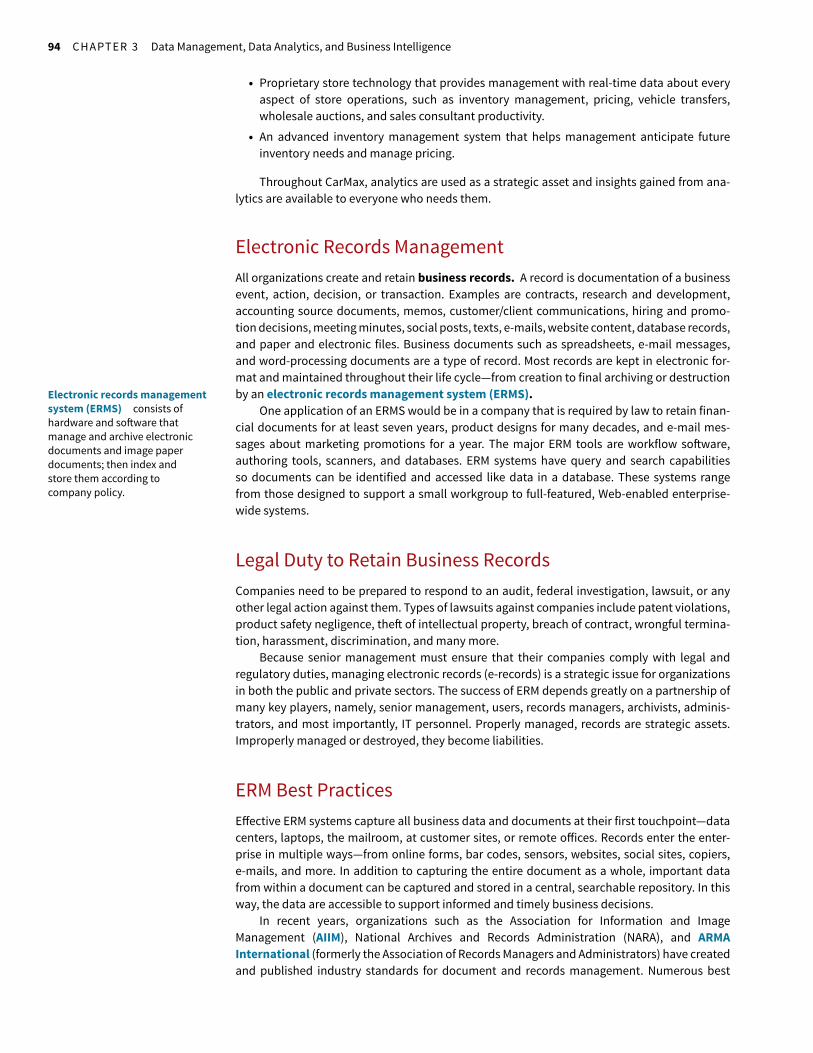
94 CHAPTER 3 Data Management, Data Analytics, and Business Intelligence
• Proprietary store technology that provides management with real-time data about every aspect of store operations, such as inventory management, pricing, vehicle transfers, wholesale auctions, and sales consultant productivity.
• An advanced inventory management system that helps management anticipate future inventory needs and manage pricing.
Throughout CarMax, analytics are used as a strategic asset and insights gained from ana-lytics are available to everyone who needs them.
Electronic Records ManagementAll organizations create and retain business records. A record is documentation of a business event, action, decision, or transaction. Examples are contracts, research and development, accounting source documents, memos, customer/client communications, hiring and promo-tion decisions, meeting minutes, social posts, texts, e-mails, website content, database records, and paper and electronic files. Business documents such as spreadsheets, e-mail messages, and word-processing documents are a type of record. Most records are kept in electronic for-mat and maintained throughout their life cycle—from creation to final archiving or destruction by an electronic records management system (ERMS).
One application of an ERMS would be in a company that is required by law to retain finan-cial documents for at least seven years, product designs for many decades, and e-mail mes-sages about marketing promotions for a year. The major ERM tools are workflow so#ware, authoring tools, scanners, and databases. ERM systems have query and search capabilities so documents can be identified and accessed like data in a database. These systems range from those designed to support a small workgroup to full-featured, Web-enabled enterprise-wide systems.
Legal Duty to Retain Business RecordsCompanies need to be prepared to respond to an audit, federal investigation, lawsuit, or any other legal action against them. Types of lawsuits against companies include patent violations, product safety negligence, the# of intellectual property, breach of contract, wrongful termina-tion, harassment, discrimination, and many more.
Because senior management must ensure that their companies comply with legal and regulatory duties, managing electronic records (e-records) is a strategic issue for organizations in both the public and private sectors. The success of ERM depends greatly on a partnership of many key players, namely, senior management, users, records managers, archivists, adminis-trators, and most importantly, IT personnel. Properly managed, records are strategic assets. Improperly managed or destroyed, they become liabilities.
ERM Best PracticesE!ective ERM systems capture all business data and documents at their first touchpoint—data centers, laptops, the mailroom, at customer sites, or remote o!ices. Records enter the enter-prise in multiple ways—from online forms, bar codes, sensors, websites, social sites, copiers, e-mails, and more. In addition to capturing the entire document as a whole, important data from within a document can be captured and stored in a central, searchable repository. In this way, the data are accessible to support informed and timely business decisions.
In recent years, organizations such as the Association for Information and Image Management (AIIM), National Archives and Records Administration (NARA), and ARMA International (formerly the Association of Records Managers and Administrators) have created and published industry standards for document and records management. Numerous best
Electronic records management system (ERMS) consists of hardware and so#ware that manage and archive electronic documents and image paper documents; then index and store them according to company policy.
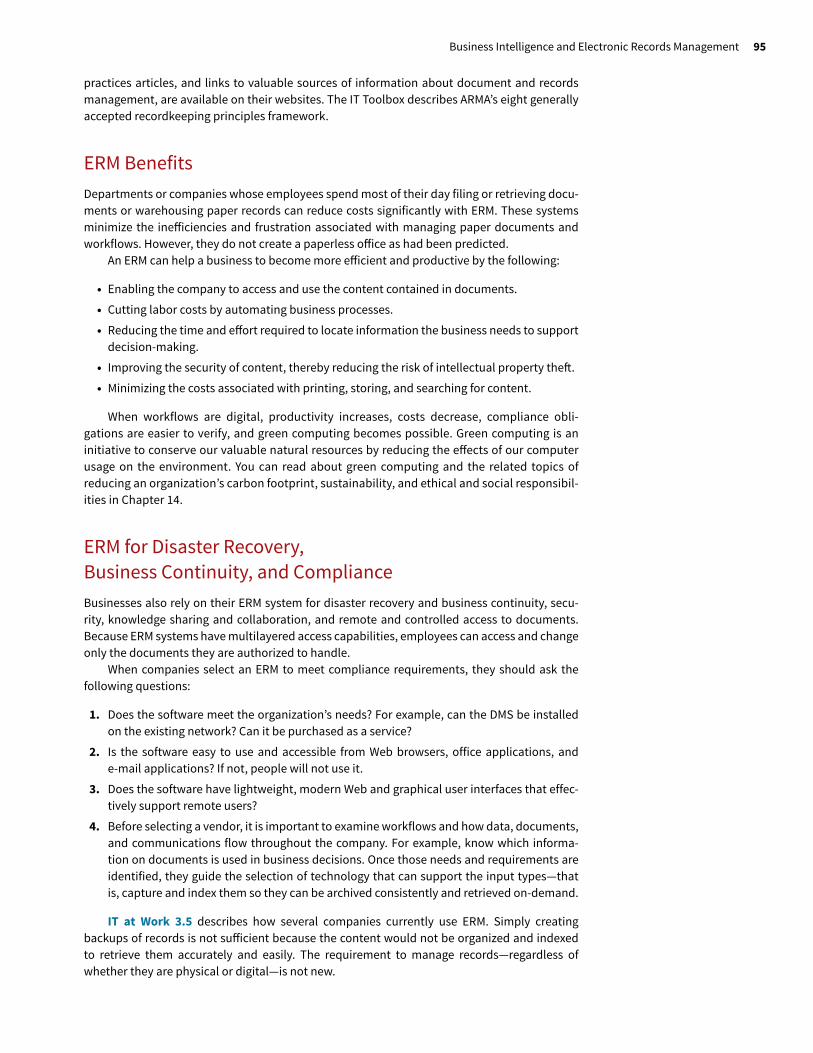
Business Intelligence and Electronic Records Management 95
practices articles, and links to valuable sources of information about document and records management, are available on their websites. The IT Toolbox describes ARMA’s eight generally accepted recordkeeping principles framework.
ERM BenefitsDepartments or companies whose employees spend most of their day filing or retrieving docu-ments or warehousing paper records can reduce costs significantly with ERM. These systems minimize the ine!iciencies and frustration associated with managing paper documents and workflows. However, they do not create a paperless o!ice as had been predicted.
An ERM can help a business to become more e!icient and productive by the following:
• Enabling the company to access and use the content contained in documents.• Cutting labor costs by automating business processes.• Reducing the time and e!ort required to locate information the business needs to support
decision-making.• Improving the security of content, thereby reducing the risk of intellectual property the#.• Minimizing the costs associated with printing, storing, and searching for content.
When workflows are digital, productivity increases, costs decrease, compliance obli-gations are easier to verify, and green computing becomes possible. Green computing is an initiative to conserve our valuable natural resources by reducing the e!ects of our computer usage on the environment. You can read about green computing and the related topics of reducing an organization’s carbon footprint, sustainability, and ethical and social responsibil-ities in Chapter 14.
ERM for Disaster Recovery, Business Continuity, and ComplianceBusinesses also rely on their ERM system for disaster recovery and business continuity, secu-rity, knowledge sharing and collaboration, and remote and controlled access to documents. Because ERM systems have multilayered access capabilities, employees can access and change only the documents they are authorized to handle.
When companies select an ERM to meet compliance requirements, they should ask the following questions:
1. Does the software meet the organization’s needs? For example, can the DMS be installed on the existing network? Can it be purchased as a service?
2. Is the software easy to use and accessible from Web browsers, office applications, and e-mail applications? If not, people will not use it.
3. Does the software have lightweight, modern Web and graphical user interfaces that effec-tively support remote users?
4. Before selecting a vendor, it is important to examine workflows and how data, documents, and communications flow throughout the company. For example, know which informa-tion on documents is used in business decisions. Once those needs and requirements are identified, they guide the selection of technology that can support the input types—that is, capture and index them so they can be archived consistently and retrieved on-demand.
IT at Work 3.5 describes how several companies currently use ERM. Simply creating backups of records is not su!icient because the content would not be organized and indexed to retrieve them accurately and easily. The requirement to manage records—regardless of whether they are physical or digital—is not new.
96 CHAPTER 3 Data Management, Data Analytics, and Business Intelligence
Key Termsactive data warehouse (ADW) 81big data 83big data analytics 84business analytics 68business intelligence (BI) 91business record 94business-driven development approach 92centralized database 73change data capture (CDC) 80data analytics 83data entity 79data management 69data marts 80data mining 88data warehouse 67database 69
database management system (DBMS) 70decision model 68declarative language 70dirty data 75distributed database 73electronic records management system (ERMS) 94extract, transform and load (ETL) 80enterprise data warehouses (EDWs) 80eventual consistency 70fault tolerance 72Hadoop 85information overload 92immediate consistency 70latency 70MapReduce 86
master data management (MDM) 78NoSQL 72online transaction processing (OLTP) systems 71online analytical processing (OLAP) systems 72petabyte 66query 70relational database 70relational management systems (RDBMSs) 70sentiment analysis 88scalability 72structured query language (SQL) 70text mining 88
IT at Work 3.5
ERM ApplicationsHere some examples of how companies use ERM in the health-care, finance, and education sectors:
• The Surgery Center of Baltimore stores all medical records electronically, providing instant patient information to doc-tors and nurses anywhere and at any time. The system also routes charts to the billing department, which can then scan and e-mail any relevant information to insurance providers and patients. The ERM system helps maintain the required audit trail, including the provision of records when they are needed for legal purposes. How valuable has ERM been to the center? Since it was implemented, business processes have been expedited by more than 50%, the costs of these processes have been significantly reduced, and the morale of o!ice employees in the center has improved noticeably.
• American Express (AMEX) uses TELEform, developed by Alchemy and Cardi! So#ware, to collect and process more than 1 million customer satisfaction surveys every year. The data are collected in templates that consist of more than 600 di!erent survey forms in 12 languages and 11 countries. AMEX integrated TELEform with AMEX’s legacy system, which enables it to distribute processed results to many managers. Because the survey forms are now readily accessible, AMEX has reduced the number of sta! who process these forms from 17 to 1, thereby saving the company more than $500,000 a year.
• The University of Cincinnati provides authorized access to the personnel files of 12,000 active employees and tens of thou-sands of retirees. The university receives more than 75,000 queries about personnel records every year and then must search more than 3 million records to answer these queries. Using a microfilm system to find answers took days. The solution was an ERM that digitized all paper and microfilm documents, without help from the IT department, making them available via the Internet and the university’s intranet. Authorized employees access files using a browser.
IT at Work Questions1. What are the business benefits of BI?2. What are two-related challenges that must be resolved for BI
to produce meaningful insights?3. What are the steps in a BI governance program?4. What does it mean to drill down into data, and why is it
important?5. What four factors are contributing to increased use of BI?6. Why is ERM a strategic issue rather than simply an IT issue?7. Why might a company have a legal duty to retain records?
Give an example.8. Why is creating backups an insu"icient way to manage an
organization’s documents?
Assuring Your Learning 97
Assuring Your Learning
Discuss: Critical Thinking Questions
1. What are the functions of databases and data warehouses?
2. How does data quality impact business performance?
3. List three types of waste or damages that data errors can cause.
4. What is the role of a master reference file?
5. Give three examples of business processes or operations that would benefit significantly from having detailed real-time or near real-time data and identify the benefits.
6. What are the tactical and strategic benefits of big data analytics?
7. Explain the four Vs of data analytics.
8. Select an industry. Explain how an organization in that indus-try could improve consumer satisfaction through the use of data warehousing.
9. Explain the principle of 90/90 data use.
10. Why is master data management (MDM) important in companies with multiple data sources?
11. Why would a company invest in a data mart instead of a data warehouse?
12. Why is data mining important?
13. What are the operational benefits and competitive advantages of business intelligence?
14. How can ERM decrease operating costs?
Explore: Online and Interactive Exercises
1. Visit www.YouTube.com and search for SAS Enterprise Miner So#ware Demo in order to assess the features and benefits of SAS Enterprise Miner. The URL is https://www.youtube.com/watch?v= Nj4L5RFvkMg.
a. View the SAS Enterprise Miner So#ware demo, which is about seven minutes long.
b. Based on what you learn in the demo, what skills or expertise are needed to build a predictive model?
c. At the end of the demo, you hear the presenter say that “SAS Enterprise Miner allows end-users to easily develop predictive models and to generate scoring to make better decisions about future business events.” Do you agree that SAS Enterprise Miner makes it easy to develop such models? Explain.
d. Do you agree that if an expert develops predictive models, it will help managers make better decisions about future business events? Explain.
e. Based on your answers to (c), (d), and (e), under what condi-tions would you recommend SAS Enterprise Miner?
2. Research two electronic records management vendors, such as Iron Mountain.
a. What are the retention recommendations made by the vendors? Why?
b. What services or solutions does each vendor o!er?
3. View the “Edgenet Gain Real time Access to Retail Product Data with In-Memory Technology” video on YouTube. Explain the benefit of in-memory technology.
Analyze & Decide: Apply IT Concepts to Business Decisions
1. Visit www.Oracle.com. Click the Solutions tab to open the menu; then click Data Warehousing under Technology Solutions.
a. Scroll down to view “Procter & Gamble Drives 30X Performance Gains with Oracle Exadata.”
b. Describe the Procter & Gamble’s challenges, why it selected Oracle Exadata, and how that solution met their challenge.
2. Visit www.Teradata.com. Click Resources and open “Videos.” Select one of the videos related to data analytics. Explain the benefits of the solution chosen.
3. Spring Street Company (SSC) wanted to reduce the “hidden costs” associated with its paper-intensive processes. Employees jokingly pre-dicted that if the windows were open on a very windy day, total chaos
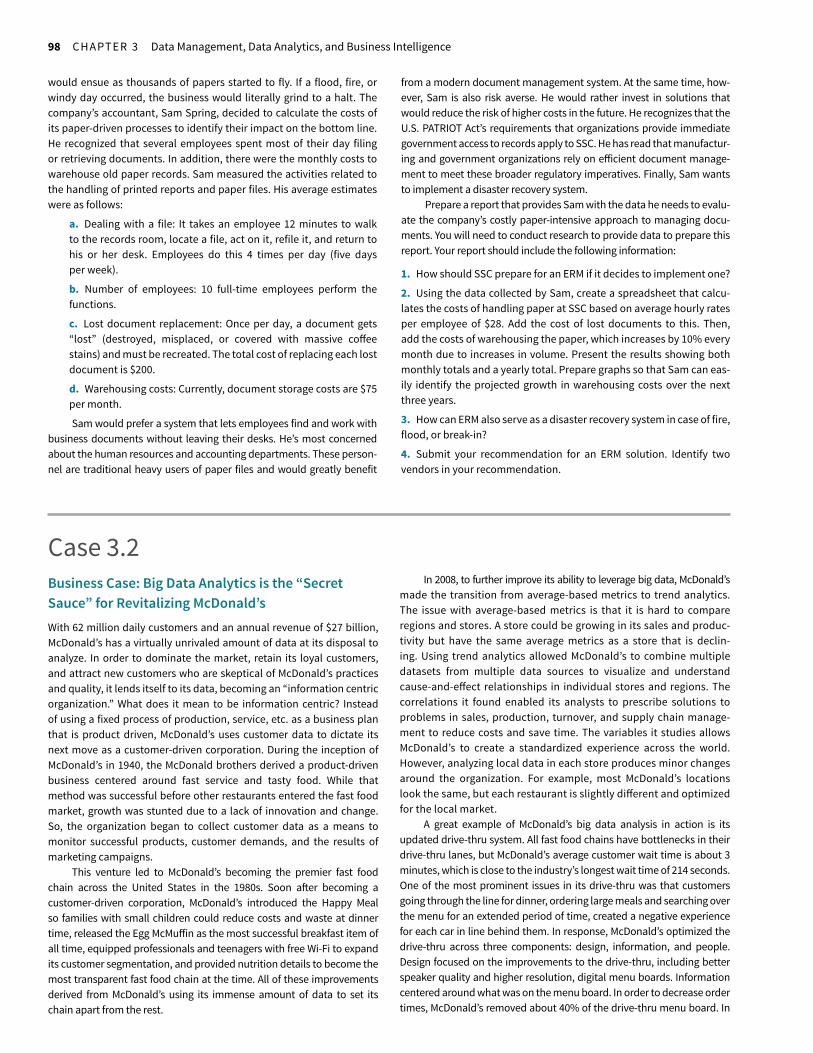
98 CHAPTER 3 Data Management, Data Analytics, and Business Intelligence
would ensue as thousands of papers started to fly. If a flood, fire, or windy day occurred, the business would literally grind to a halt. The company’s accountant, Sam Spring, decided to calculate the costs of its paper-driven processes to identify their impact on the bottom line. He recognized that several employees spent most of their day filing or retrieving documents. In addition, there were the monthly costs to warehouse old paper records. Sam measured the activities related to the handling of printed reports and paper files. His average estimates were as follows:
a. Dealing with a file: It takes an employee 12 minutes to walk to the records room, locate a file, act on it, refile it, and return to his or her desk. Employees do this 4 times per day (five days per week).
b. Number of employees: 10 full-time employees perform the functions.
c. Lost document replacement: Once per day, a document gets “lost” (destroyed, misplaced, or covered with massive co!ee stains) and must be recreated. The total cost of replacing each lost document is $200.
d. Warehousing costs: Currently, document storage costs are $75 per month.
Sam would prefer a system that lets employees find and work with business documents without leaving their desks. He’s most concerned about the human resources and accounting departments. These person-nel are traditional heavy users of paper files and would greatly benefit
from a modern document management system. At the same time, how-ever, Sam is also risk averse. He would rather invest in solutions that would reduce the risk of higher costs in the future. He recognizes that the U.S. PATRIOT Act’s requirements that organizations provide immediate government access to records apply to SSC. He has read that manufactur-ing and government organizations rely on e!icient document manage-ment to meet these broader regulatory imperatives. Finally, Sam wants to implement a disaster recovery system.
Prepare a report that provides Sam with the data he needs to evalu-ate the company’s costly paper-intensive approach to managing docu-ments. You will need to conduct research to provide data to prepare this report. Your report should include the following information:
1. How should SSC prepare for an ERM if it decides to implement one?
2. Using the data collected by Sam, create a spreadsheet that calcu-lates the costs of handling paper at SSC based on average hourly rates per employee of $28. Add the cost of lost documents to this. Then, add the costs of warehousing the paper, which increases by 10% every month due to increases in volume. Present the results showing both monthly totals and a yearly total. Prepare graphs so that Sam can eas-ily identify the projected growth in warehousing costs over the next three years.
3. How can ERM also serve as a disaster recovery system in case of fire, flood, or break-in?
4. Submit your recommendation for an ERM solution. Identify two vendors in your recommendation.
Case 3.2 Business Case: Big Data Analytics is the “Secret Sauce” for Revitalizing McDonald’sWith 62 million daily customers and an annual revenue of $27 billion, McDonald’s has a virtually unrivaled amount of data at its disposal to analyze. In order to dominate the market, retain its loyal customers, and attract new customers who are skeptical of McDonald’s practices and quality, it lends itself to its data, becoming an “information centric organization.” What does it mean to be information centric? Instead of using a fixed process of production, service, etc. as a business plan that is product driven, McDonald’s uses customer data to dictate its next move as a customer-driven corporation. During the inception of McDonald’s in 1940, the McDonald brothers derived a product-driven business centered around fast service and tasty food. While that method was successful before other restaurants entered the fast food market, growth was stunted due to a lack of innovation and change. So, the organization began to collect customer data as a means to monitor successful products, customer demands, and the results of marketing campaigns.
This venture led to McDonald’s becoming the premier fast food chain across the United States in the 1980s. Soon a#er becoming a customer-driven corporation, McDonald’s introduced the Happy Meal so families with small children could reduce costs and waste at dinner time, released the Egg McMu!in as the most successful breakfast item of all time, equipped professionals and teenagers with free Wi-Fi to expand its customer segmentation, and provided nutrition details to become the most transparent fast food chain at the time. All of these improvements derived from McDonald’s using its immense amount of data to set its chain apart from the rest.
In 2008, to further improve its ability to leverage big data, McDonald’s made the transition from average-based metrics to trend analytics. The issue with average-based metrics is that it is hard to compare regions and stores. A store could be growing in its sales and produc-tivity but have the same average metrics as a store that is declin-ing. Using trend analytics allowed McDonald’s to combine multiple datasets from multiple data sources to visualize and understand cause-and-e!ect relationships in individual stores and regions. The correlations it found enabled its analysts to prescribe solutions to problems in sales, production, turnover, and supply chain manage-ment to reduce costs and save time. The variables it studies allows McDonald’s to create a standardized experience across the world. However, analyzing local data in each store produces minor changes around the organization. For example, most McDonald’s locations look the same, but each restaurant is slightly di!erent and optimized for the local market.
A great example of McDonald’s big data analysis in action is its updated drive-thru system. All fast food chains have bottlenecks in their drive-thru lanes, but McDonald’s average customer wait time is about 3 minutes, which is close to the industry’s longest wait time of 214 seconds. One of the most prominent issues in its drive-thru was that customers going through the line for dinner, ordering large meals and searching over the menu for an extended period of time, created a negative experience for each car in line behind them. In response, McDonald’s optimized the drive-thru across three components: design, information, and people. Design focused on the improvements to the drive-thru, including better speaker quality and higher resolution, digital menu boards. Information centered around what was on the menu board. In order to decrease order times, McDonald’s removed about 40% of the drive-thru menu board. In
Case 3.3 99
its third aspect, people, the fast food chain attempted to reduce the negative experiences for those in line by creating a second drive-thru line with a designated order taker for each line, a third drive-thru win-dow, and two production lines.
Another example showing McDonald’s commitment to being a customer-driven corporation is its introduction of all day breakfast, which was the highest priority for customers across the United States. Being the corporation with by far the largest share of the fast food market, McDonald’s will continue to use its growing data sets to provide the best experience and food to its customers (van Rijmenam, 2016).
Questions1. Explain McDonald’s mission and responsibilities.
2. What limitation did McDonald’s face in gaining data that wasmeaningful to decision-making?
3. Describe trend analytics.
4. Is McDonald’s product oriented or customer oriented?
5. Why is the ability to identify patterns and relationships critical to McDonald’s operations?
Case 3.3 Video Case: Verizon Improves Its Customer Experience with Data Driven Decision-MakingVerizon leverages Teradata’s data analytics platform to shi# its opera-tions from qualitative decision-making to evidence-based and data-driven decision-making to improve the customer experience. Visit www.Teradata.com and search for the video “Verizon: Using Advanced Analytics to Deliver on Their Digital Promise to Help Customers Inno-vate Their Lifestyle.”
1. How does Verizon use Teradata to make decisions?2. How do the three sectors of Verizon work together to create value
for the customer?3. How does Verizon use data analytics to “penetrate the market”?4. What impact does customer behavior data have on Verizon’s
marketing strategy?
“IT Matters” Discussion BoardResearch the concept of Big Data. Find at least one company that main-tains a “Big Data” database.
1. What is Big Data? Give at least three examples of organizationsthat have Big Data sets. What are the applications?
2. Discuss one of the organizations that you identified that uses Big Data and briefly describe the use of Big Data in the organization.
3. Discuss as much as you can find about the amount of data theyhave and how they process it.
4. What did you learn or what lessons did you take away fromthis research?
Provide at least two hyperlinked references to back up your findings (one for the organization you chose to discuss and one for the concept of big data in general). Post your findings and respond to at least two comments posted by your fellow students.
IT Toolbox
Framework for Generally Accepted Recordkeeping PrinciplesThe Framework for generally accepted recordkeeping principles is a useful tool for managing business records to ensure that they support an enterprise’s current and future regulatory, legal, risk mitigation, environmental, and operational requirements.
The framework consists of eight principles or best practices, which also support data governance. These principles were created by ARMA International and legal and IT professionals.
1. Principle of accountability Assign a senior executive tooversee a recordkeeping program; adopt policies and proce-dures to guide personnel; and ensure program audit ability.
2. Principle of transparency Document processes andactivities of an organization’s recordkeeping program in anunderstandable manner and available to all personnel andappropriate parties.
3. Principle of integrity Ensure recordkeeping program isable to reasonably guarantee the authenticity and reliabilityof records and data.
4. Principle of protection Construct the recordkeepingprogram to ensure a reasonable level of protection to records and information that are private, confidential, privileged,secret, or essential to business continuity.
5. Principle of compliance Ensure recordkeeping programcomplies with applicable laws, authorities, and the organiza-tion’s policies.
6. Principle of availability Maintain records in a manner that ensures timely, e!icient, and accurate retrieval of neededinformation.
7. Principle of retention Maintain records and data for anappropriate time based on legal, regulatory, fiscal, opera-tional, and historical requirements.
8. Principle of disposition Securely disposed of records when they are no longer required to be maintained by laws or orga-nizational policies.
Sources: Compiled from Van Rijmenam (2016) and McDonald’s (2017).
100 CHAPTER 3 Data Management, Data Analytics, and Business Intelligence
ReferencesBing, C. “Data Mining So#ware Used by Spy Agencies just got more
Powerful.” FedScoop, June 21, 2016.Burns, E. “Coca-Cola Overcomes Challenges to Seize BI Opportuni-
ties.” TechTarget.com. August 2013.Burns, E. “Text Analysis Tool Helps Lenovo Zero in on the Customer.”
Business Analytics, April 8, 2016.BusinessIntelligence.com. “Coca-Cola’s Juicy Approach to Big Data.”
July 29, 2013b. http://businessintelligence.com/bi-insights/coca-colas-juicy-approach-to-big-data
Cattell, J., S. Chilukuri, and M. Levy. “How Big Data Can Revolutionize Pharmaceutical R&D.” 2016. http://www.mckinsey.com/industries/ pharmaceuticals-and-medical-products/our-insights/how-big- data-can-revolutionize-pharmaceutical-r-and-d
CNNMoney, The Coca-Cola Co (NYSE:KO) 2014.Columbus, L. “Ten Ways Big Data Is Revolutionizing Marketing and
Sales.” Forbes, May 9, 2016.Eisenhauer, T. “The Undeniable Benefits of Having a Well-Designed
Document Management System.” Axero Solutions, August 5, 2015.FirstWind website www.firstwind.com, 2017.Forbes. “Betting on Big Data.” 2015.Hammond, T. “Top IT Job Skills for 2014: Big Data, Mobile, Cloud,
Security.” TechRepublic.com, January 31, 2014.Harle, P., A. Havas, and H. Samandari. “The Future of Bank Risk
Management.” McKinsey & Company, July 2016.Harvard Business School. “How Coca-Cola Controls Nature’s Oranges.”
November 22, 2015.HealthCanal. “Where Do You Start When Developing a New Medicine?”
March 27, 2014.IDC. “Explosive Internet of Things Spending to Reach $1.7 Trillion in
2020, According to IDC.” June 02, 2015.King, L. “How Business Intelligence Helps Small Businesses Make
Better Decisions.” Hu!ington Post, July 28, 2016.
Kitamura, M. “Big Data Partnerships Tackle Drug Development Failures.” Bloomberg News, March 26, 2014.
Kramer, S. “The High Costs of Dirty Data.” Digitalist, May 1, 2015.Ladley, J. “Business Alignment Techniques for Successful and
Sustainable Analytics.” CIO, May 13, 2016.Liyakasa, K. “Coke Opens Data-Driven Happiness, Builds Out Market-
ing Decision Engine.” Ad Exchanger, October 14, 2015.McDonald’s website 2017. https://www.mcdonalds.com/us/en-us/
about-us/our-history.htmlNIH (National Institute of Health). “Accelerating Medicines Partner-
ship.” February 2014. http://www.nih.gov/science/amp/index.htmOliphant, T. “How to Make Big Data Insights Work for You.” Business
Intelligence, February 24, 2016.Ovalsrud, T. “Big Data and Analytics Spending to Hit $1.87 billion”
CIO, May 24, 2016.Ransbothom, S. “Coca-Cola’s Unique Challenge: Turning 250
Datasets into One.” MIT Sloan Management Review, May 27, 2015.RingLead, Inc. “The True Cost of Bad (And Clean) Data.” July 17, 2015.syntheses.net 2017.The Data Warehousing Institute (TDWI). tdwi.org/portals/business-
intelligence.asp. 2014U.S. Department of Energy. “Wind Vision: A New Era for Wind Power in
the United States.” http://energy.gov/eere/wind/maps/wind-vision, March 12, 2015.
Van Rijmenam, M. “From Big Data to Big Mac; how McDonalds lever-ages Big Data.” DataFloq.com, August 15, 2016.
Van Rijmenam, M. “How Coca-Cola Takes a Refreshing Approach on Big Data.” DataFloq, July 18, 2016.
Wise, L. “Evaluating Business Intelligence in the Cloud.” CIO, March 9, 2016.