Embed Size (px)
Citation preview
Data Linkages to Improve Health Outcomes
An End User Perspective
Deborah Schrag MD Department of Epidemiology and Biostatistics
Department of MedicineMemorial Sloan-Kettering Cancer Center
Overview
• Types of research questions
• Examples of linkage attempts
• Challenges encountered
• Wish list
Health Services Research
• Examines relationships between need, demand, supply, delivery and outcomes of health care:• Disparities in care
• Access/barriers to care
• Technology dissemination
• Quality measurement
• Efficiency of care delivery
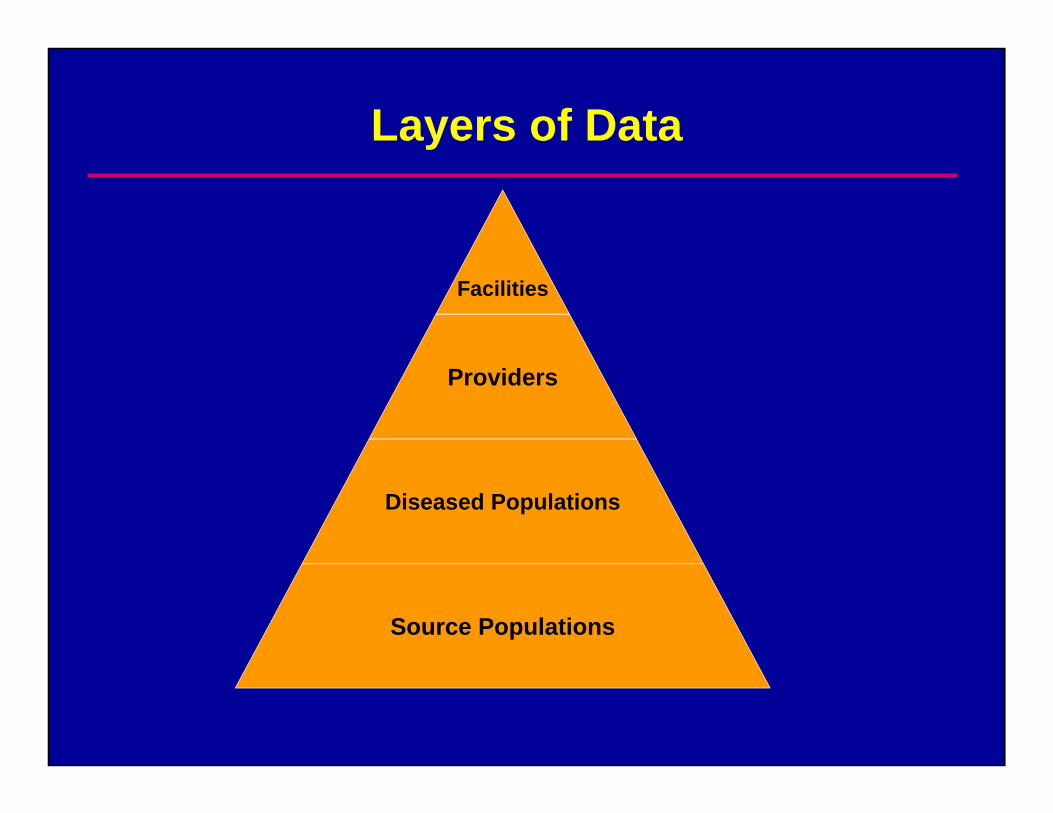
Layers of Data
Facilities
Providers
Diseased Populations
Source Populations

Evaluating the Quality of Health Care
Person Attributes
Process of Care
Structure of DeliverySystems
Health Risksand Behaviors
Community Attributes
Health Outcomes
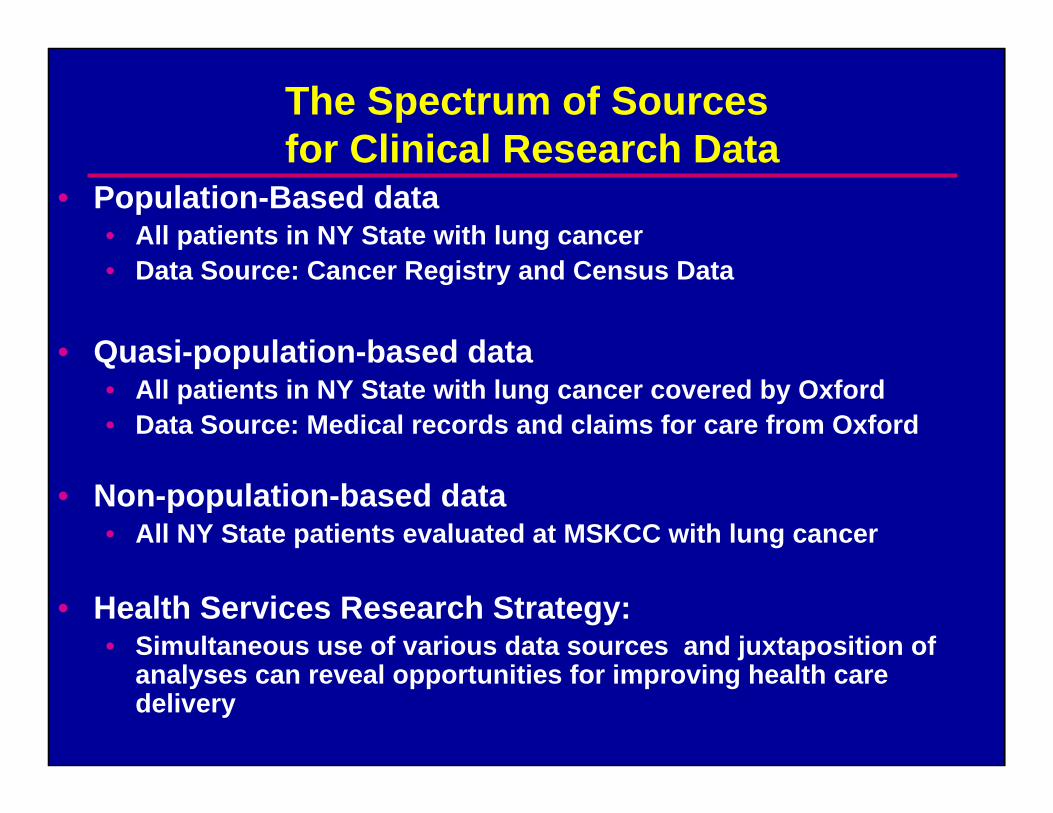
The Spectrum of Sourcesfor Clinical Research Data
• Population-Based data• All patients in NY State with lung cancer • Data Source: Cancer Registry and Census Data
• Quasi-population-based data• All patients in NY State with lung cancer covered by Oxford • Data Source: Medical records and claims for care from Oxford
• Non-population-based data• All NY State patients evaluated at MSKCC with lung cancer
• Health Services Research Strategy: • Simultaneous use of various data sources and juxtaposition of
analyses can reveal opportunities for improving health care delivery
Implementation Gap
• Efficacy – Effectiveness = Implementation Gap• Need to understand reasons for gaps• Identify important and remediable sources of variation
• Endogenous to patients
• Endogenous to MDs
• Endogenous to health care system

Adjuvant Chemotherapy Use By AgeStage III Colon Cancer in SEER-Medicare
78 7358
34
11
57
0
20
40
60
80
100
Total 65-69 70-74 75-79 80-84 85-89
Age
% T
reat
ed
P (adj) < .001

Stage III Adjuvant Chemotherapy By Marital Status
5765
4150
0
20
40
60
80
100
Total Married Widowed Single
Income
% T
reat
ed
(p adj <0.001 HR for single vs. married 0.62, 95% CI 0.54-0.72)
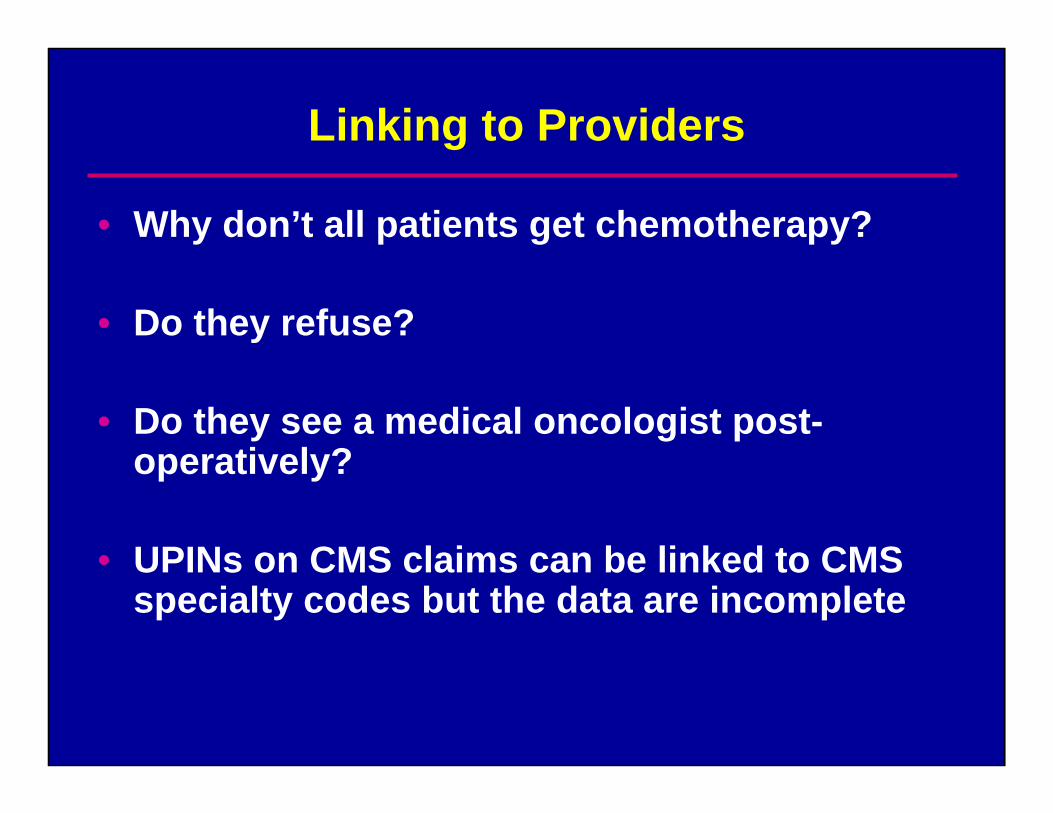
Linking to Providers
• Why don’t all patients get chemotherapy?
• Do they refuse?
• Do they see a medical oncologist post-operatively?
• UPINs on CMS claims can be linked to CMS specialty codes but the data are incomplete
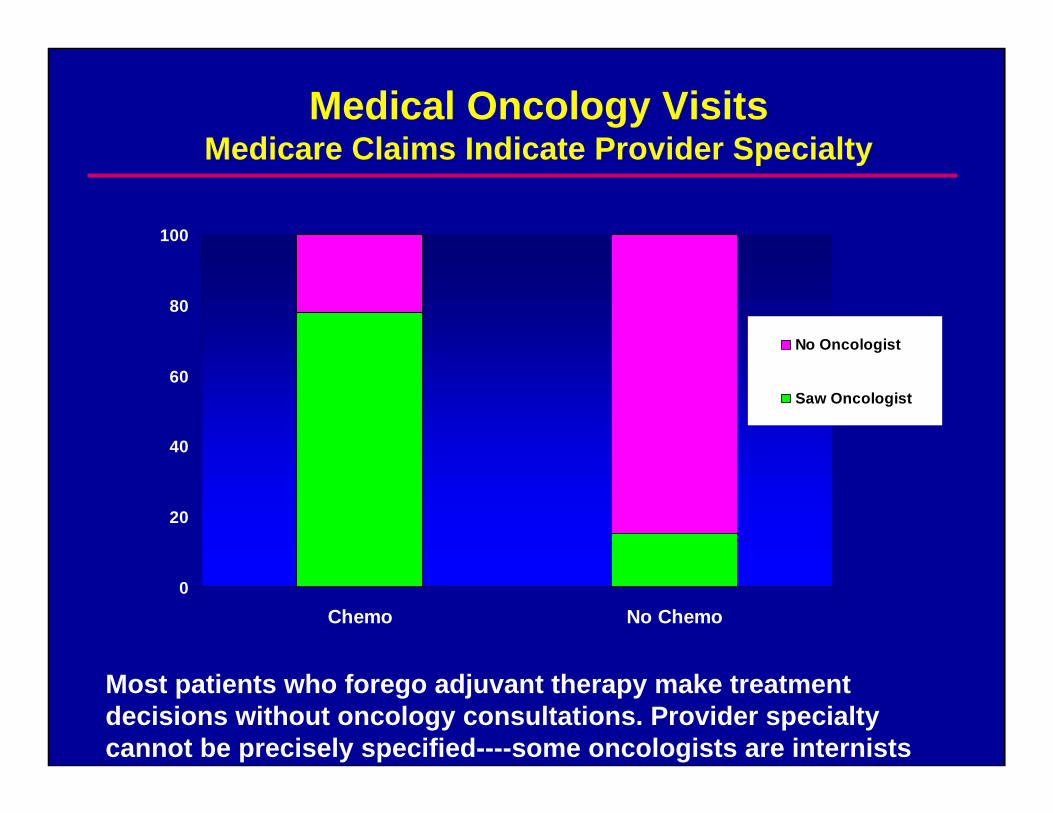
Medical Oncology VisitsMedicare Claims Indicate Provider Specialty
0
20
40
60
80
100
Chemo No Chemo
No Oncologist
Saw Oncologist
Most patients who forego adjuvant therapy make treatment decisions without oncology consultations. Provider specialty cannot be precisely specified----some oncologists are internists
Wish List: Provider Characteristics
• Linkage of UPINs on claims data to files describing physician characteristics
• AMA data is better than CMS data
• ABIM/ACS is better than AMA
• State-level data is most complete and most difficult to obtain
Pharmacy Claims
• Oral chemotherapy?• Anti nausea medications?• Adherence to therapy• Pain control
• Wish list:
• Part D data
• Medicaid data
• Private claims data sets
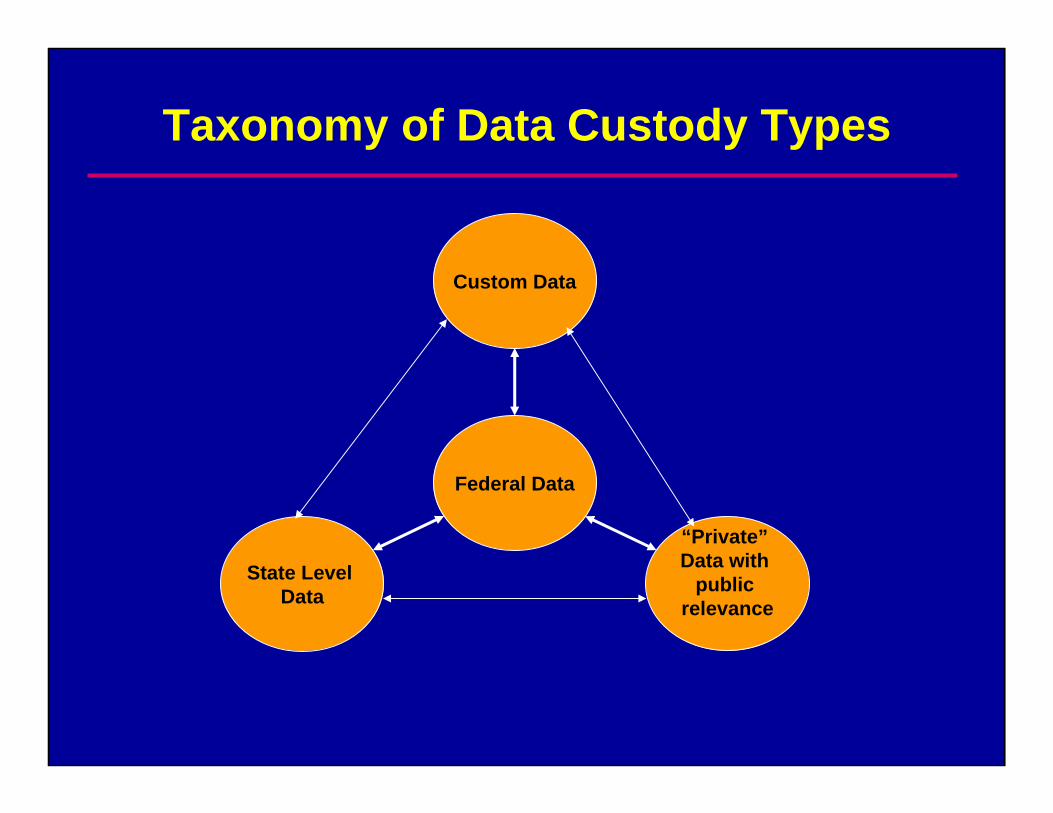
Taxonomy of Data Custody Types
State Level Data
“Private”Data with
public relevance
Custom Data
Federal Data
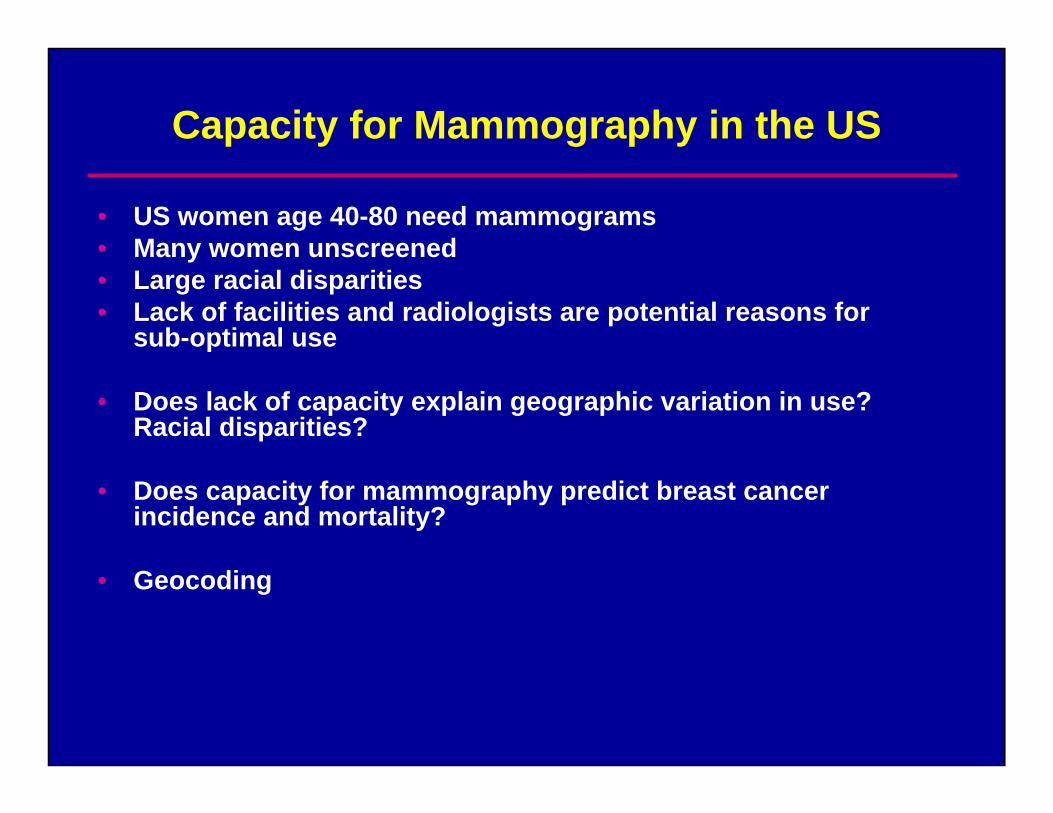
Capacity for Mammography in the US
• US women age 40-80 need mammograms• Many women unscreened• Large racial disparities• Lack of facilities and radiologists are potential reasons for
sub-optimal use
• Does lack of capacity explain geographic variation in use? Racial disparities?
• Does capacity for mammography predict breast cancer incidence and mortality?
• Geocoding
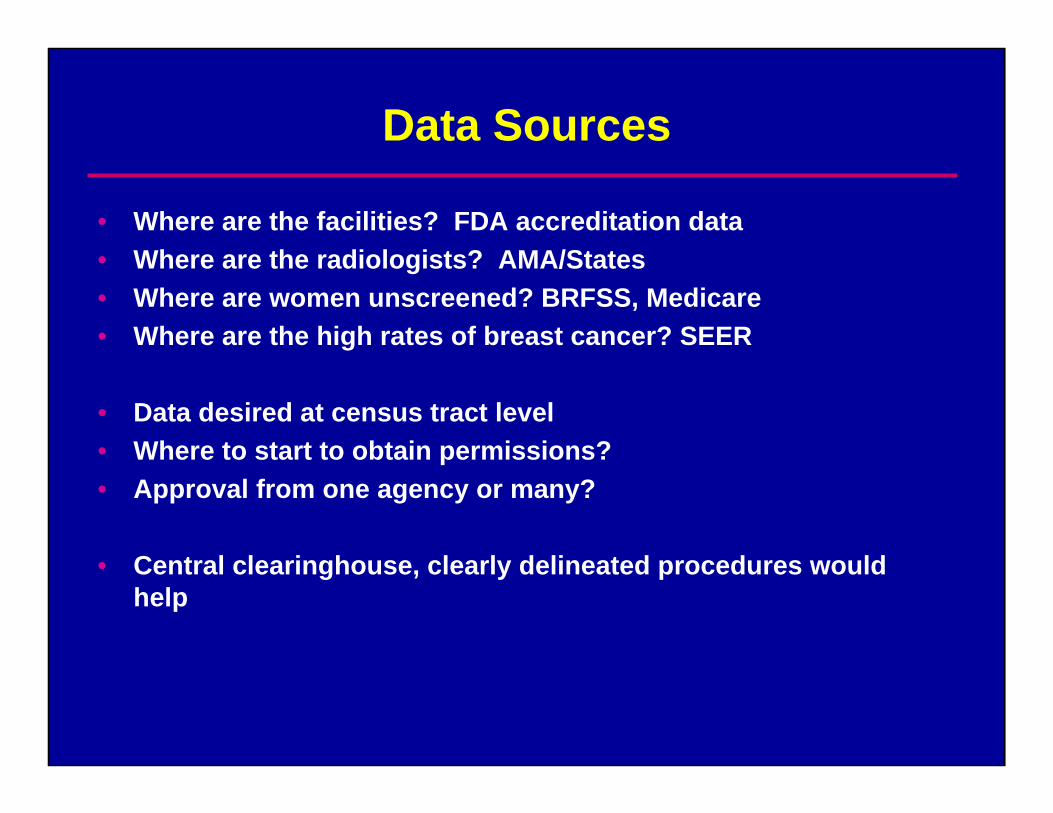
Data Sources
• Where are the facilities? FDA accreditation data• Where are the radiologists? AMA/States• Where are women unscreened? BRFSS, Medicare• Where are the high rates of breast cancer? SEER
• Data desired at census tract level• Where to start to obtain permissions?• Approval from one agency or many?
• Central clearinghouse, clearly delineated procedures would help
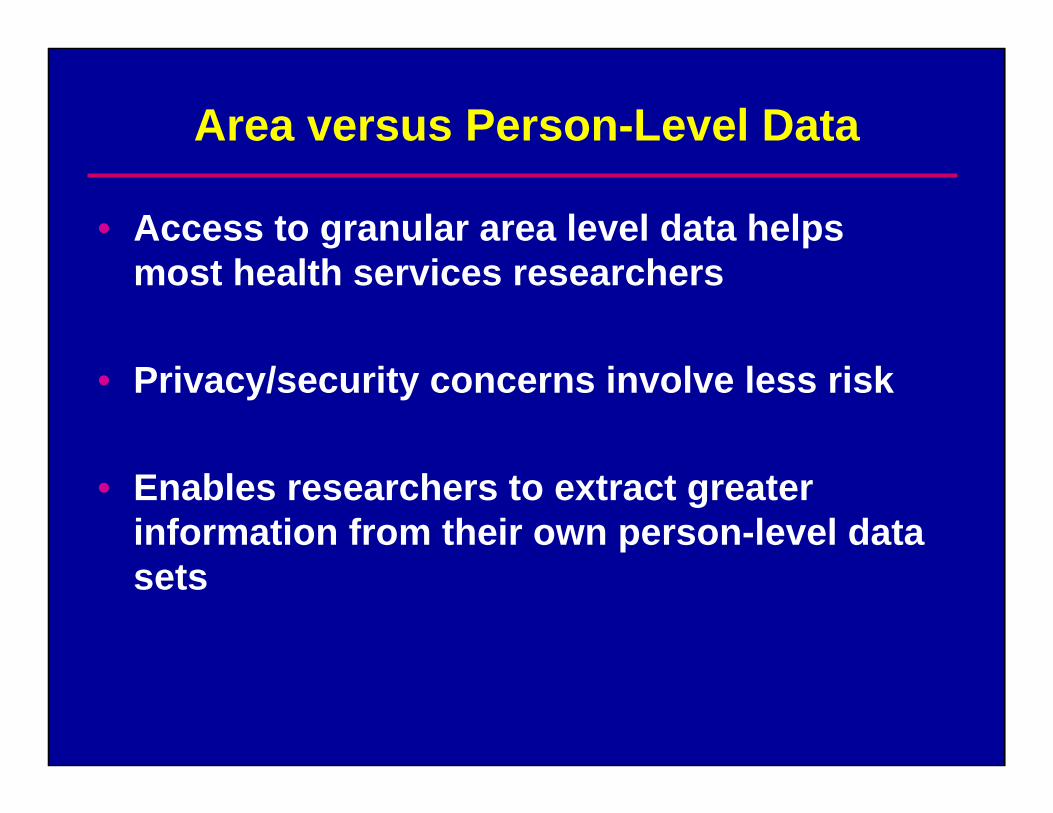
Area versus Person-Level Data
• Access to granular area level data helps most health services researchers
• Privacy/security concerns involve less risk
• Enables researchers to extract greater information from their own person-level data sets
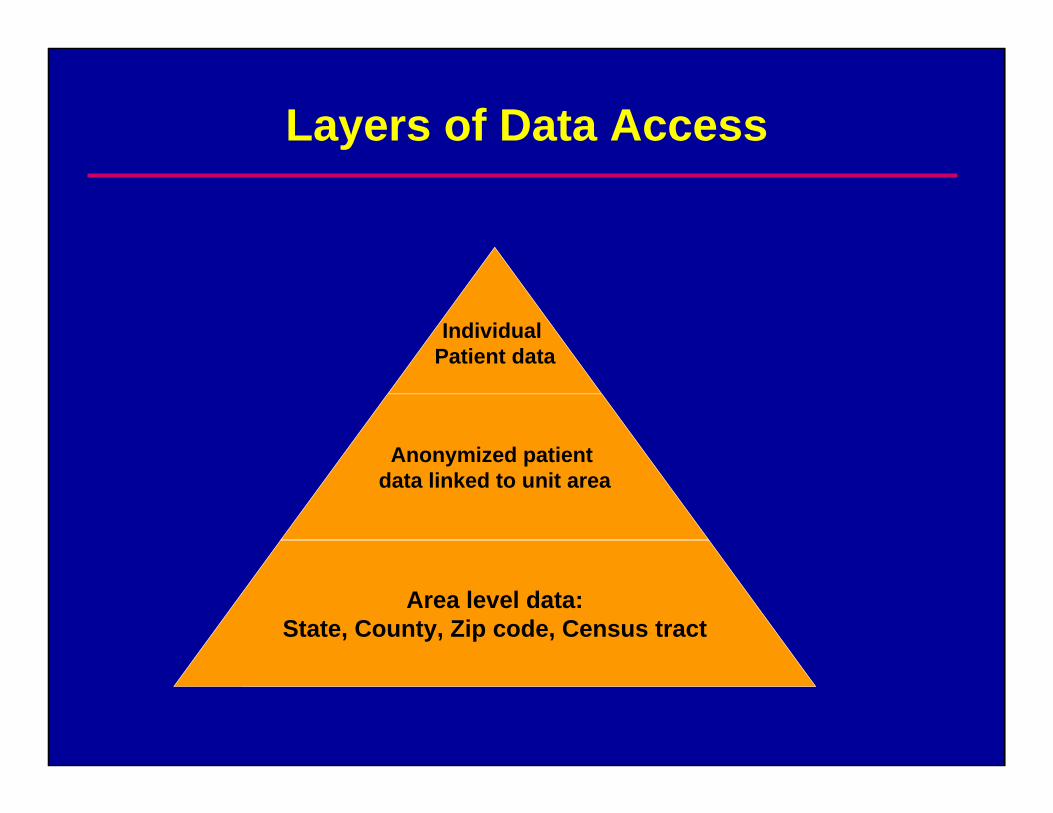
Layers of Data Access
Individual Patient data
Anonymized patient data linked to unit area
Area level data:State, County, Zip code, Census tract

Repetitive Common Tasks
• Geographic variation:• Where are? :
• Patients• Providers/services• Disparities• Mortality rates
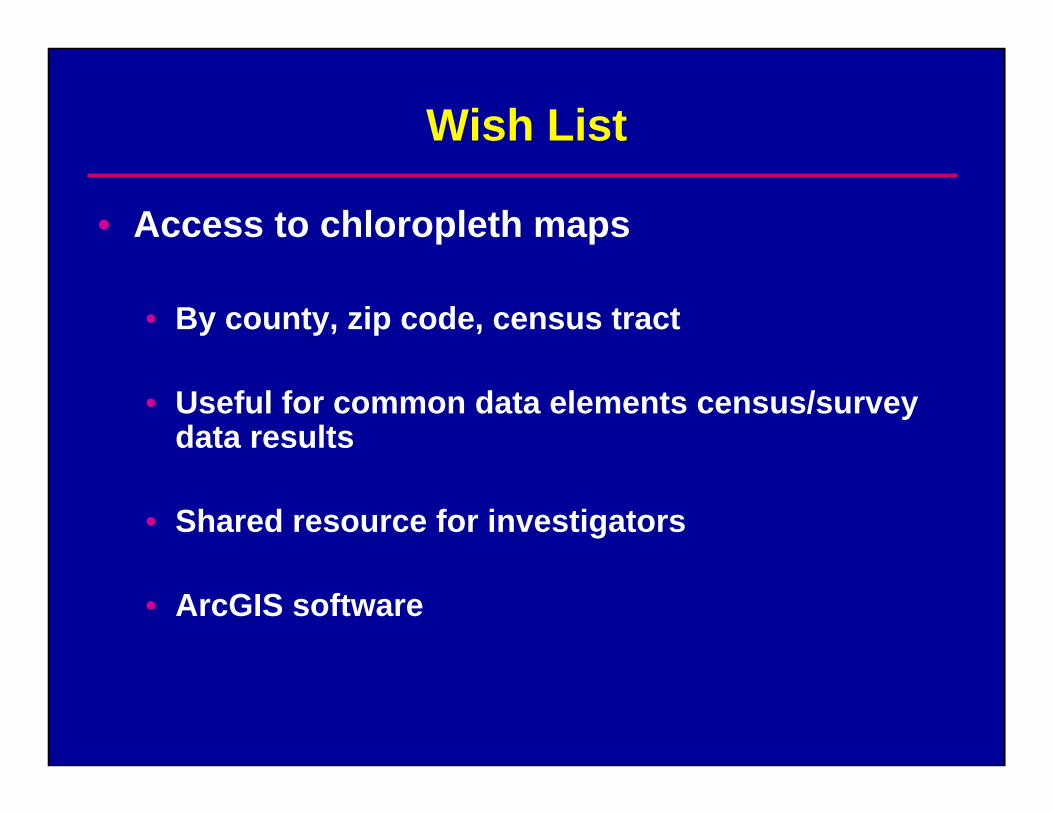
Wish List
• Access to chloropleth maps
• By county, zip code, census tract
• Useful for common data elements census/survey data results
• Shared resource for investigators
• ArcGIS software

Fragmentation of Care
• Do patients with chronic conditions in NY State where there are many hospitals consolidate their care or is it fragmented across multiple institutions?
• Is fragmentation higher in the Medicaid program?
• SPARCS: statewide discharge database• Available from states• Some states have data available from NCHS
• State discharge data not linked to patient residence/census data
• Medicaid enrollment data
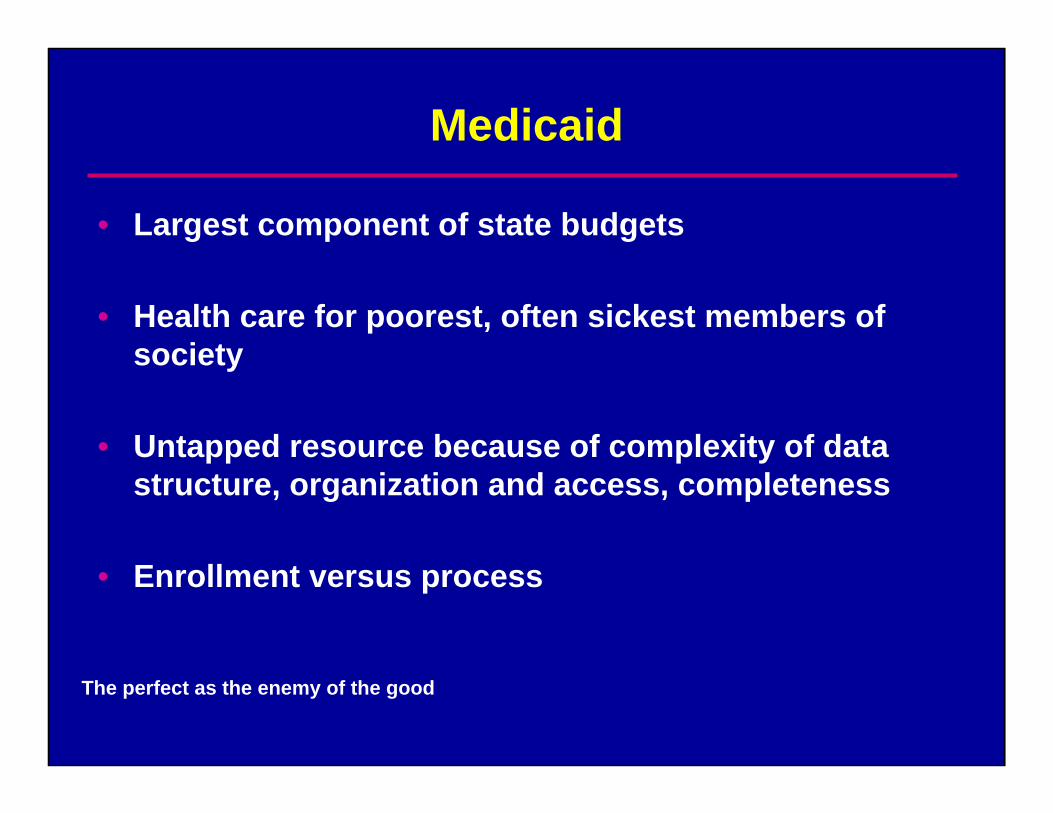
Medicaid
• Largest component of state budgets
• Health care for poorest, often sickest members of society
• Untapped resource because of complexity of data structure, organization and access, completeness
• Enrollment versus process
The perfect as the enemy of the good
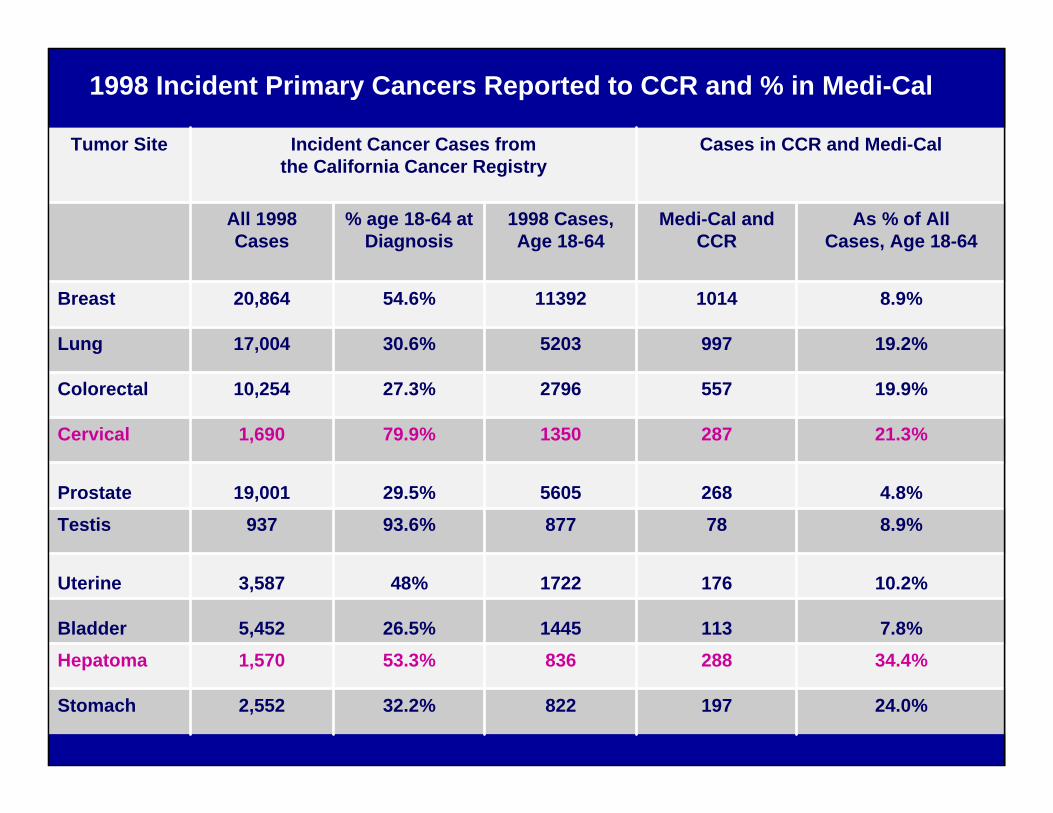
24.0%19782232.2%2,552Stomach
34.4%28883653.3%1,570Hepatoma7.8%113144526.5%5,452Bladder
10.2%176172248%3,587Uterine
8.9%7887793.6%937Testis4.8%268560529.5%19,001Prostate
21.3%287135079.9%1,690Cervical
19.9%557279627.3%10,254Colorectal
19.2%997520330.6%17,004Lung
8.9%10141139254.6%20,864Breast
As % of AllCases, Age 18-64
Medi-Cal and CCR
1998 Cases,Age 18-64
% age 18-64 at Diagnosis
All 1998 Cases
Cases in CCR and Medi-CalIncident Cancer Cases fromthe California Cancer Registry
Tumor Site
1998 Incident Primary Cancers Reported to CCR and % in Medi-Cal
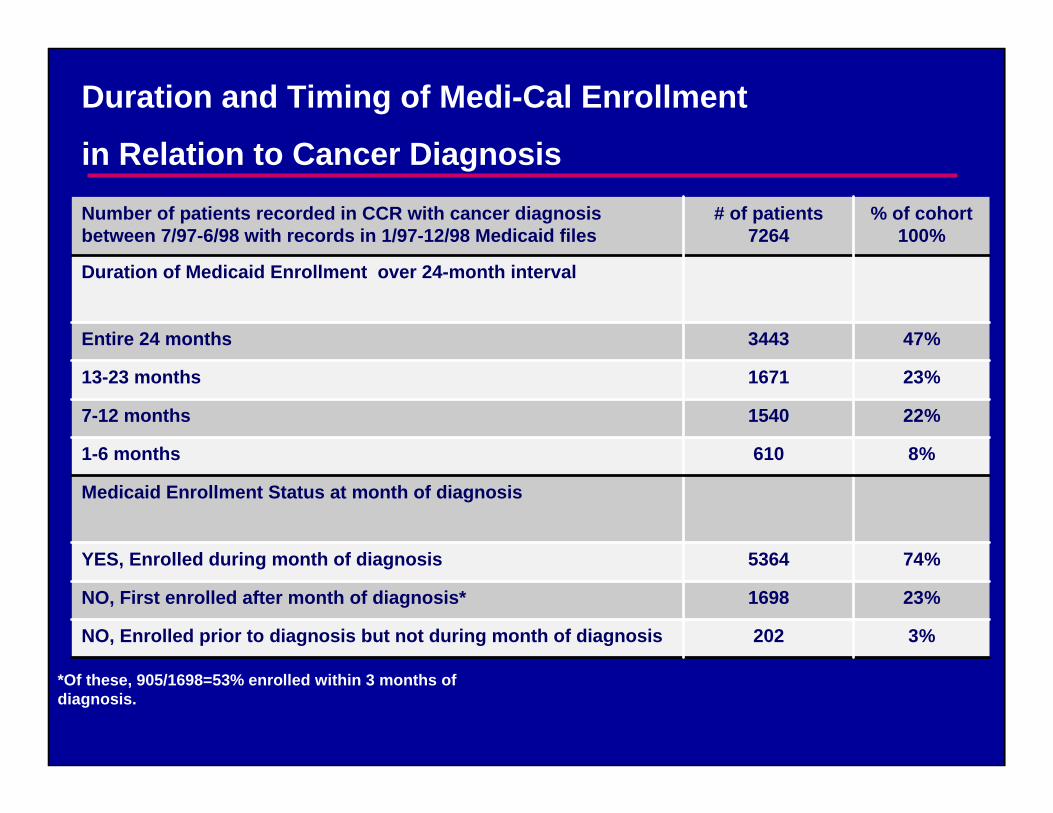
3%202NO, Enrolled prior to diagnosis but not during month of diagnosis
23%1698NO, First enrolled after month of diagnosis*
74%5364YES, Enrolled during month of diagnosis
Medicaid Enrollment Status at month of diagnosis
8%6101-6 months
22%15407-12 months
23%167113-23 months
47%3443Entire 24 months
Duration of Medicaid Enrollment over 24-month interval
% of cohort100%
# of patients7264
Number of patients recorded in CCR with cancer diagnosis between 7/97-6/98 with records in 1/97-12/98 Medicaid files
*Of these, 905/1698=53% enrolled within 3 months of diagnosis.
Duration and Timing of Medi-Cal Enrollment
in Relation to Cancer Diagnosis
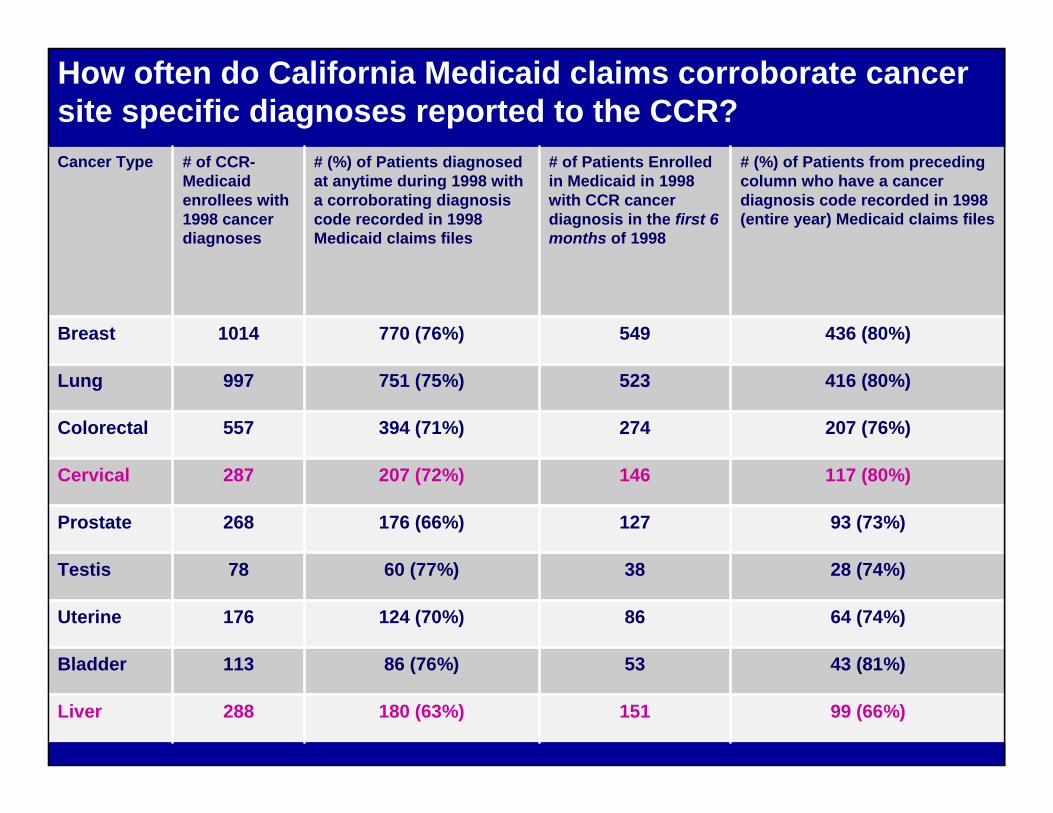
99 (66%)151180 (63%)288Liver
43 (81%)5386 (76%)113Bladder
64 (74%)86124 (70%)176Uterine
28 (74%)3860 (77%)78Testis
93 (73%)127176 (66%)268Prostate
117 (80%)146207 (72%)287Cervical
207 (76%)274394 (71%)557Colorectal
416 (80%)523751 (75%)997 Lung
436 (80%)549770 (76%)1014Breast
# (%) of Patients from preceding column who have a cancer diagnosis code recorded in 1998 (entire year) Medicaid claims files
# of Patients Enrolled in Medicaid in 1998 with CCR cancer diagnosis in the first 6 months of 1998
# (%) of Patients diagnosed at anytime during 1998 with a corroborating diagnosis code recorded in 1998 Medicaid claims files
# of CCR-Medicaid enrollees with 1998 cancer diagnoses
Cancer Type
How often do California Medicaid claims corroborate cancer site specific diagnoses reported to the CCR?
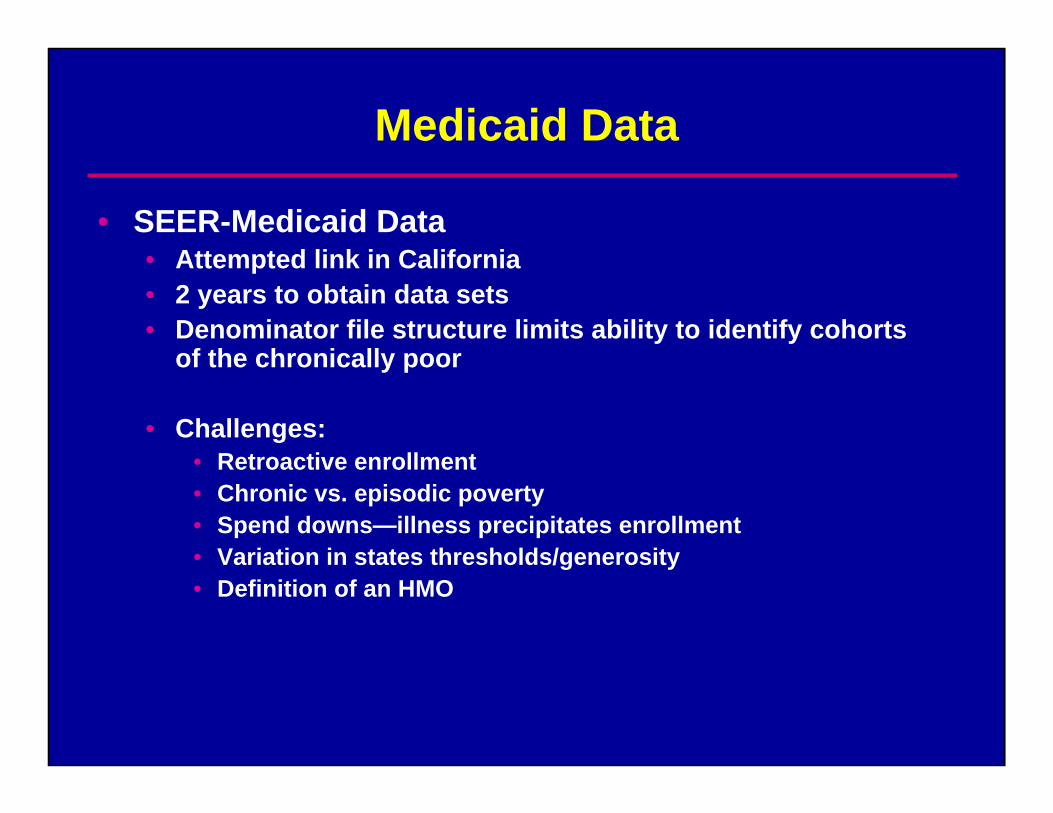
Medicaid Data
• SEER-Medicaid Data• Attempted link in California• 2 years to obtain data sets• Denominator file structure limits ability to identify cohorts
of the chronically poor
• Challenges: • Retroactive enrollment• Chronic vs. episodic poverty• Spend downs—illness precipitates enrollment• Variation in states thresholds/generosity • Definition of an HMO
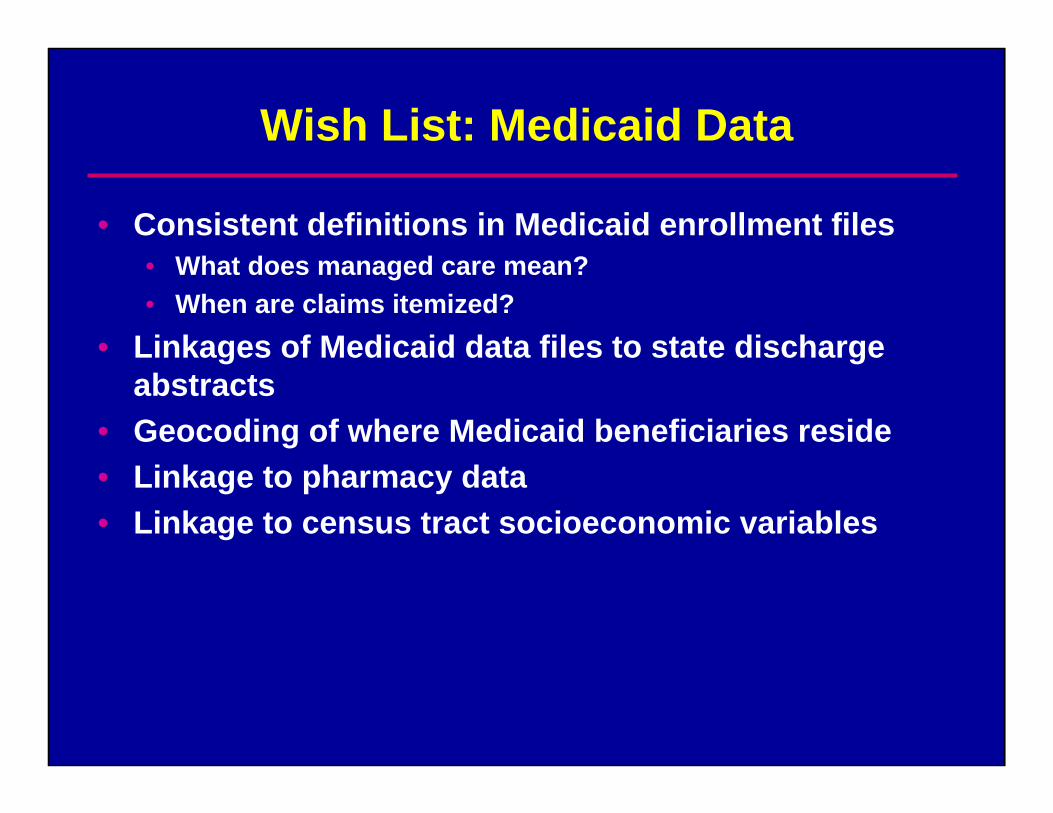
Wish List: Medicaid Data
• Consistent definitions in Medicaid enrollment files• What does managed care mean?• When are claims itemized?
• Linkages of Medicaid data files to state discharge abstracts
• Geocoding of where Medicaid beneficiaries reside• Linkage to pharmacy data• Linkage to census tract socioeconomic variables
Priorities
• Coordination of procedures for obtaining access to data and the review process
• Standardization of reporting rules (e.g. N must not be less than 10)
• Develop categorization schema for types of linkages• Central clearinghouse/index describing linkages
that exist as well as those that are possible• Facilitate federation of state data• Chloropleth maps for use in commons based
systems • Work with states to facilitate analyses of Medicaid
enrollment and claims files