Embed Size (px)
Citation preview

DATA FOR DECISION MAKING:AN M&E FRAMEWORK FOR ASIA
David WilsonGlobal HIV/AIDS Monitoring Team (GAMET)
Global HIV/AIDS Program (GHAP)
15 September, 2005

INTRODUCTION (1)M&E decision frameworks historically reflect the
logic of generalized epidemics
They typically:
Assess HIV infection in the general population, including age and geographic sub-strata
Assess behavioral factors contributing to overall HIV prevalence and sub-strata variations
Assess overall scope and coverage of program services
Triangulate HIV, behavioral and program data, to assess trends

INTRODUCTION (2)
Concentrated epidemics require a framework that seeks to better understand vulnerable groups
These include what may be termed universal vulnerable groups, specifically IDU, SW and MSM. They are universally vulnerable because of behavioral and biological factors
In addition, their immediate sexual partners have elevated vulnerability, including clients of SW
They also include what may be termed situation-specific vulnerable groups, such as prisoners

INTRODUCTION (3)Historically, epidemics generalized if they
exceeded arbitrary threshold, such as 1% of general population
However, formulaic definitions inhibit understanding – need alternative definition
Epidemics concentrated if transmission mostly among vulnerable groups and if protecting vulnerable groups would protect wider society
Conversely, epidemics generalized if transmission mainly outside vulnerable groups and would continue despite effective vulnerable group interventions

INTRODUCTION (4)
Improved population surveillance shows more concentrated epidemics than realized – generalized epidemics the exception

ANTENATAL AND POPULATION HIV ESTIMATES
Sources: NAC/NAP, 2001-2003, ORC/MACRO
0
5
10
15
20
25
So
uth
Afric
a
Bo
tsw
an
a
Za
mb
ia
Ke
ny
a
Ta
nza
nia
Ug
an
da
Bu
rkin
a
Sie
rra L
eo
ne
Ca
me
roo
n
Gh
an
a
Ma
li
DR
ANC POPSouthern Africa LACWest AfricaEast Africa

INTRODUCTION (5)Major reason – male circumcision
Generalized heterosexual transmission limited in highly circumcised populations
Other lethal ingredient – concurrent sexual partnerships
Male circumcision and concurrent partnerships - the lethal cocktail that ignited Southern Africa’s explosive epidemics – the fuel and match

INTRODUCTION (6)Concentrated epidemics ARE important
Consider these official estimates of the size of IDU and SW communities
Even if half of these communities and their immediate sexual partners become infected, we’ll still have epidemics comparable to African countries – because of the size of overall and vulnerable populations
Through the immediate sexual partners of vulnerable groups alone, the epidemic will make inroads into wider society

ESTIMATED NUMBERS OF IDU AND SW
Country IDU SW
China 1-3 million 3-4 million
Russia 1-3 million 50,000-100,000
India 500,000-1 million 3-4 million
Indonesia 200,000-1 million 190,000-270,000
Ukraine 200,000-500,000 30,000-50,000
Burma >200,000 >100,000
Indonesia >200,000 100,000
Sources: UNAIDS, UNODC, UNDP, UNESCAP

INTRODUCTION (7)
Concentrated epidemics also preventable, with proven, relatively inexpensive, prevention responses
Effective, early action works – can really change shape of epidemic

0
2
4
6
8
10
Cur
rent
HIV
Infe
ctio
ns in
mill
ions
Baseline No Intervention
Without behavior change
Infectionsprevented
EARLY, EFFECTIVE ACTION IN THAILAND
With behavior change
Sources: Brown, 2004

OVERVIEW (1)The steps in a concentrated epidemic model are to
assess:
The problem
Prevalence
Size estimates
Interactions
Estimated proportion of infections
The response
Program services
Coverage
Outcomes
Impacts

HIV INFECTION (1)HIV infection fundamental – the bedrock of
M&E
HIV infection only takes place if there is EXPOSURE - fluid exchange with infected person
It doesn’t matter how many sexual partners or shared needles we have if we’re all uninfected
EXPOSURE is everything – which is why HIV infection is fundamental
Using behavioral without HIV data single greatest cause of bad programming

HIV INFECTION (2)HIV infection assessed by prevalence surveys - may include
other pathogens - STIs among SW or BBVs among IDU
Bio-surveys may be combined with behavioral surveys – second generation surveillance
But HIV paramount – multiple sexual partnerships including sex work may occur without HIV infection – for example, SW in Sri Lanka, Pakistan, Bangladesh, Philippines, Australia, Fiji
This doesn’t mean we don’t have to keep SW, IDU, MSM safe – WE MUST. For behavioral and biological reasons, wherever SW, IDU, MSM exist, some risk exists and we must program to prevent it
Nevertheless, HIV infection first step in M&E chain – without growing or significant HIV infection - other steps less relevant

HIV INFECTION (3)In concentrated epidemics, HIV occurs primarily in
hidden populations - IDU, SW and MSM
HIV testing methods now more diverse, rapid, affordable
But hidden populations lack sampling frames and often prefer to remain concealed, because their behaviors are illegal or unpopular
Meaningful surveillance depends crucially on representative sampling – for example, HIV among IDU in Russia or SW in China
Sampling greatest impediment to sound surveillance of vulnerable groups
Following analysis based on CDC, FHI, WB and other efforts to improve sampling

HIV INFECTION (4)Routine surveillance
Based on disease care reporting from health and social services, including hospitals, health centres, private doctors and drug treatment facilities

Routine surveillanceAdvantages
Relatively simple and inexpensive, as it relies on routine, ongoing case reporting
DisadvantagesRequires excellent health and social services and functioning reportingMajority of vulnerable groups must be in regular contact with health system – which is rare
HIV INFECTION (5)

HIV INFECTION (6)
Facility sampling
Involves recruiting samples from facilities used by members, including STI clinics, SW clinics, needle exchange programs, treatment centres and correctional services

Facility sampling
AdvantagesTakes advantage of existing facilities and services
DisadvantagesFew facilities for many vulnerable groups, especially in developing countriesThose using services often atypical - unrepresentative
HIV INFECTION (7)

HIV INFECTION (8)Chain referral or snowball sampling
Involves identifying initial numbers of vulnerable groups as seed participants, who help to identify and recruit other participants, who in turn identify and recruit others, until sample size reached or sample is saturated

Chain referral or snowball sampling
AdvantagesHistorically effective way of reaching hidden communitiesStill useful in situation assessment and problem definition
DisadvantagesInitial seeds hardly ever randomly chosen – thus non-random convenience sampling methodHeavily influenced by initial seedsFavors cooperative rather than randomly chosen participants
HIV INFECTION (9)
HIV INFECTION (10)Targeted sampling
Uses initial ethnographic analysis to identify discrete sub-groups and networks of vulnerable groups
The different sub-groups are then treated as separate strata and quota samples chosen within each stratum

Target sampling
AdvantagesIf ethnographic sample is thorough, produces more representative sample and reduces bias
DisadvantagesInitial ethnographic assessment lengthy and costlyRemains non-probability, convenience sample
HIV INFECTION (11)
HIV INFECTION (12)Time-location sampling
Based on tendency of some vulnerable group members to gather at certain locations – for example, IDU in shooting galleries or dealing areas, SW in brothels, massage parlors, red light districts, certain streets, MSM in gay bars or cruising areas
Different sites are enumerated in ethnographic and mapping studies
List of sites then used as sampling frame from which to select probability sample of sites
Interviews then done at randomly chosen 3 hour interval on randomly chosen day of week

Target samplingAdvantages
Because inclusion probabilities may be calculated, this approximates a probability sampling method
DisadvantagesUnless high proportion of members visit selected sites and unless high proportion of all such sites are identified during enumeration, significant bias existsAs gathering places change over time, enumeration must be repeated before each survey roundMembers who do not visit enumerated sites are major source of biasMany people at recruitment sites may be reluctant to participate in surveys – for example, IDU buying drugs, sex workers at street corners, MSM at beats
HIV INFECTION (13)

HIV INFECTION (14)Respondent driven sampling (RDS)
RDS analysis drawn from Magnani et al
RDS resembles snowball sampling in that it begins with chain referral sampling
However recruitment is done in a way that allows for calculation of selection probabilities, thus qualifying it as a probability method
In RDS, seeds are recruited as temporary recruiters. They each receive a limited number of coupons (usually 3-4) with unique serial numbers to enroll peers
HIV INFECTION (15)Respondent driven sampling (RDS)
If the recruited peer is eligible, the recruiter receives modest compensation
Each referred participant, and their referred participants, continue to receive coupons and compensation, until the sample reaches saturation
RDS thus uses a dual recruitment system of peer influence and financial incentives, which may broaden participation
Because participants must present themselves to enroll, recruitment is wholly voluntary and anonymous

HIV INFECTION (16)Respondent driven sampling (RDS)
In RDS, coupons limit the number of participants each seed can recruit, dampening recruitment bias and encouraging diverse recruitment chains, which reach into more concealed populations
Relationship between recruiter and recruits is documented, so recruitment biases can be assessed and adjusted for during analysis
Information of network size is collected to permit weighted analysis through post-stratification
In RDS, sampling frames are constructed during sampling processes, obviating the need for extensive preparatory ethnography and mapping
RDS samples proceed through successive cycles until the sample reaches equilibrium, usually within six waves

HIV INFECTION (17)Respondent driven sampling (RDS)
Four prerequisites are:
Recruitment chains are documented, usually through coupons
Recruitment rationed to 3-4 coupons per seed
Personal network information collected
Recruiters and participants must know each other
HIV INFECTION (18)
RDS new but recent studies support its use:
Increased estimated size of IDU population in Connecticut 10-fold
Increased estimated size of MSM population in three US cities by 50%
Revealed hidden overlap between IDU and SW networks in Vietnam

Respondent driven samplingAdvantages
Qualifies as probability methodDampens recruitment bias from long chainsUse of multiple diverse chains enables sample to reach more deeply into hidden populationsReducing masking bias by self-referral and anonymityIncreases participation, by offering dual incentives, including financial incentivesHas demonstrated ability to reach larger samples of hidden populations
DisadvantagesLimited documentation and professional experience with RDS in developing countriesNot yet clear RDS yields comparable samples at different time periods
HIV INFECTION (19)

SIZE ESTIMATION (1)
HIV infection only meaningful when supported by size estimation
For example, HIV prevalence among IDU in the South Asian island of Imagineri (population 300,000) is 50%. The public health implications are vital if there are 1,000 IDU, but less critical if there are 10 IDU
Prevalence and size estimation are inseparable in sound analysis

SIZE ESTIMATION (2)How do we estimate the size of vulnerable populations –
usually hidden populations?
Following analysis based on WHO and draft MARP manual which describes several methods, including:
Delphi
Census
Enumeration
Population survey
Multiplier methods
Capture-recapture
RDS

SIZE ESTIMATION (3)
Delphi
We ask experts to estimate – IDU in San Francisco
Basically how first global coverage estimates were done

SIZE ESTIMATION (4)
Delphi
AdvantagesQuick and cheapIf genuine experts are chosen, can delineate orders of magnitude and provide an informed starting point for programs
DisadvantagesNot an empirical method, mainly used as a starting point until there are data

SIZE ESTIMATION (5)
Census
Census methods basically try to count every member of a population
Example – 6,500 sex workers counted one Saturday night in all city bars in Bulawayo, Zimbabwe in 1998

SIZE ESTIMATION (6)
Census
AdvantagesSimple and cheap
DisadvantagesMust be done very quickly, to avoid double countsUnsuited to concealed populations

SIZE ESTIMATION (7)Enumeration
Enumeration methods start with a sampling frame, choose a sample of units, count all people in those units, then multiply by the sampling frame
Example – From 90 known gay bars, health workers visit 30 and count 100 patrons. They multiply this number by 3 to obtain an estimate of 300 gay men (100 x 3 = 300)

SIZE ESTIMATION (8)
AdvantagesEven simpler and cheaper than census methodsMathematically straightforward
DisadvantagesAlso unsuited to concealed populationsSampling frame not always available
Enumeration
SIZE ESTIMATION (9)Population surveys
Population surveys start with sampling frame, ideally households and administer behavioral questionnaires. The prevalence of risk behaviors - including buying or selling sex, men having sex with men and injecting drugs - is then assessed
Example – In household survey, 50% of representative sample of men in city with 1 million adult men report having paid for sex in the last year, which suggests a minimum of 500,000 men are clients of sex workers (0.5 x 1,000,000 = 500,000)

SIZE ESTIMATION (10)Population surveys
AdvantagesGive excellent results for behaviors which are found in general population and are relatively acceptable
DisadvantagesRequires representative sampling frame, not sample selected for probable high risk behavior, such as soldiers or prisonersUnsuited for behaviors that are rare at household level, occur largely among hidden populations or socially undesirable, such as injecting drug use

SIZE ESTIMATION (11)Multiplier methods
Multiplier methods use information from two overlapping sources, such as (i) a service the population uses and (ii) the population at risk. The number using the service is then multiplied by the inverse proportion of those attending the service
Example – 500 registered sex workers attend a compulsory city STI clinic. A behavioral survey shows that 50% of sex workers reported attending the clinic, suggesting the city may have 1,000 sex workers (500 / 0.5 = 1,000)
Example – Behavioral surveys show that 50% of 1 million adult men nationwide visit sex workers on average 10 times a year. Behavioral surveys suggest that sex workers have an average of 50 clients a year, suggesting that the country may have 1,000 sex workers ([1,000,000 x 0.5 x 0.10] / 50 = 1,000)
SIZE ESTIMATION (12)Advantages
Straightforward
DisadvantagesRequire good service and behavioral dataRequire data from services and populations that correspond with other, in which the population have a chance of being included in the service and population data collectionTime periods, age ranges and catchment areas must be aligned

SIZE ESTIMATION (13)Capture-recapture
Originated among naturalists, trying to estimate size of fish or elephant populations by tagging, releasing and re-tagging creatures. The number tagged is multiplied by the inverse proportion re-tagged to estimate the total population
Example – Survey team visit all known IDU shooting galleries, count 500 IDU, administer a short questionnaire, give them a token denoting date and site and return one week later and interview 400 IDU. They obtain 100 double counts or re-tags. The estimated IDU population is 2,000 (500 * 400 / 100)
Example – 1,000 IDU are enrolled in an opiate treatment program and 600 IDU are detained by police . 400 IDU appear on both the treatment and police lists. The estimated IDU population is 1,500 (1,000 * 600 / 400)

SIZE ESTIMATION (14)
AdvantagesUseful for estimating size of hidden populations in regular contact with two facilities or servicesMultiple recaptures greatly improve accuracy
DisadvantagesOnly highly reliable when (a) samples are uncorrelated (b) each member has an equal probability of capture (c) recaptures are correctly identified and (d) there are closed populations with no major migration in or out between captures. These conditions are rarely metPositively correlated samples underestimate and negatively correlated samples overestimate true size

SIZE ESTIMATION (15)
Respondent Driven Sampling (RDS)
RDS, described above, is genuinely independent of the above methods and can significantly improve the accuracy of size estimates
INTERACTIONS (1)HIV infection and size estimates for
vulnerable populations are important steps to estimate potential HIV prevalence
But we need more – we need to know the interactions among vulnerable groups including IDU, sex workers and MSM and between these groups and the wider community
Historically great debate – are concentrated epidemics, especially IDU epidemics, sequestered (isolated) epidemics or overlapping epidemics?

INTERACTIONS (2)
Interactions among vulnerable groups
Do IDU serve as male or female sex workers – perhaps for money for drugs?
Do male or female sex workers inject drugs – perhaps to dull their consciousness?
Do sex workers have sexual partners from other vulnerable groups, such as injecting drug users?
INTERACTIONS (3)Interactions between vulnerable groups and general population
Do male sex workers have boyfriends – with whom they may be less likely to use condoms?
Do male sex workers have girlfriends – with whom they may be less likely to use condoms?
Do female sex workers have boyfriends – with whom they may be less likely to use condoms?
Do clients of sex workers have spouses or girlfriends?

INTERACTIONS (4)
A key principle - while a minority of people in Asia may be at risk for HIV, those at risk often have multiple risks

SEX WORKERS WHO INJECT DRUGSIN CENTRAL ASIA
67
914
6 8
56
6459
0
10
20
30
40
50
60
70
80
90
100
Almaty, Kazakhstan Karaganda, Kazakhstan Tashkent, Uzbekistan Osh, Kyrgyzstan
Per
cen
t
Female IDU who sell sexFemale sex workers who inject drugs
Sources: MEASURE Evaluation, 2004

IDU IN INDONESIA WHO SHARE NEEDLES AND HAVE UNPROTECTED SEX
32
36
5432
0% 10% 20% 30% 40% 50% 60% 70% 80% 90% 100%
Female sex worker
Non commercialpartner
Either
No sex Always used condoms
Unprotected sex, but no injecting risk Unprotected sex and shared needles
Sources: MAP, 2004

SEXUAL PARTNERS OF MSM IN CAMBODIA
0102030405060708090
Had sex with Sold sex to Bought sex from Multiple partnersof this sex (last
month)
Man WomanSources: Brown, 2004
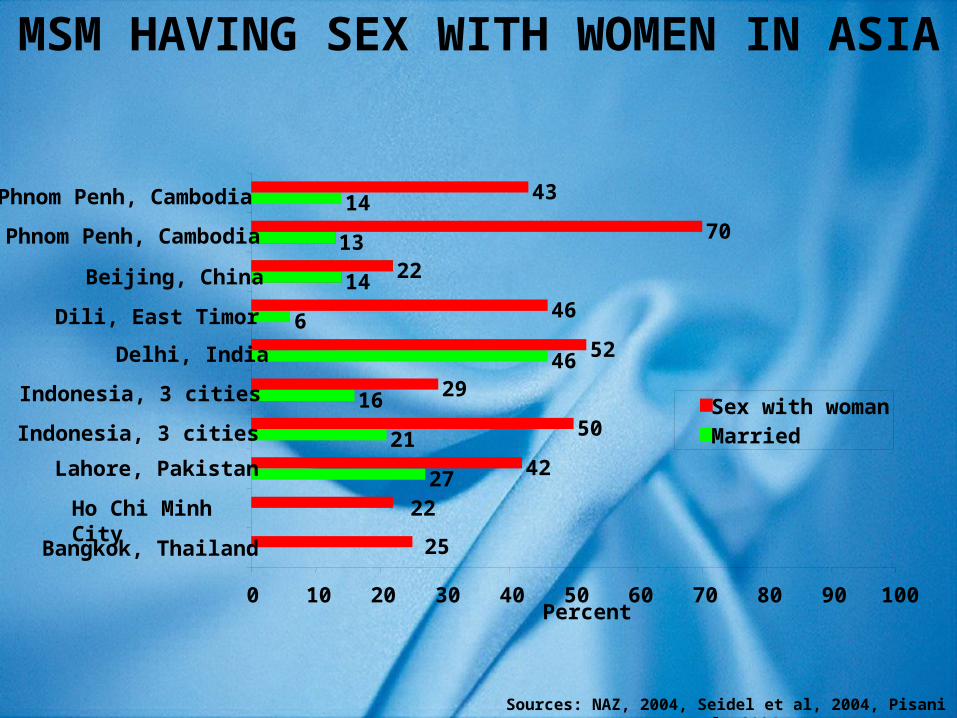
MSM HAVING SEX WITH WOMEN IN ASIA
27
21
16
46
6
14
13
14
42
50
29
52
46
22
70
43
22
25
0 10 20 30 40 50 60 70 80 90 100
Bangkok, Thailand
Ho Chi Minh City
Lahore, Pakistan
Indonesia, 3 cities
Indonesia, 3 cities
Delhi, India
Dili, East Timor
Beijing, China
Phnom Penh, Cambodia
Phnom Penh, Cambodia
Percent
Sex with womanMarried
Sources: NAZ, 2004, Seidel et al, 2004, Pisani et al, 2004

ESTIMATED PROPORTIONOF INFECTIONS (1)
The next step is to estimate the proportion of infections attributable to different forms of exposure
This is vital to ensure effort and resources reflect transmission dynamics

HIV INFECTION IN RUSSIAMaternal
2% MSM1%
IDU92%
Hetero5%
Source: Russian Federal AIDS Center, 2002

HIV INFECTION IN GHANA
SEX WORK
85%
GENERAL POPULATION
15%
Sources: Cote et al, 2004

HIV INFECTION IN MEXICO
Homo-bisexual
55%Hetero- sexual32%
Perinatal2%
Blood transfusion
6%
IDU1%
Hemophilia/coag.4%
Sources: Padian and Bertozzi, 2005

HIV INFECTION IN ZAMBIA
Sources: Shields et al, 2004
GENERAL POPULATION–92%
SEX WORKERS–6% SOLDIERS–2%

ESTIMATED PROPORTIONOF INFECTIONS (2)
How do we estimate proportion of infections from different sources?
Intuitive
If HIV prevalence is 80% among sex workers and 1% in the general population, we can deduce sex work is the major source of HIV infection

ESTIMATED PROPORTIONOF INFECTIONS (3)
Delphi
We ask experts for estimates

ESTIMATED PROPORTIONOF INFECTIONS (4)
Risk factor studies
We ask HIV-positive people their risk factors and classify accordingly
More complex risk factor studies use multiple regression on HIV status to estimate effect sizes for different risk factors

ESTIMATED PROPORTIONOF INFECTIONS (5)
Population attributable fraction (PAF) studies
PAF studies estimate the fraction of infections attributable to different sources, using epidemiological and behavioral data
For example, recent PAF study in Accra, Ghana concluded 76% of adult male infections attributable to sex work
In stark contrast, similar Zimbabwean and Zambian studies suggest 1-9%

ESTIMATED PROPORTIONOF INFECTIONS (6)
Computer models
There are several computer models to estimate the proportion of infections from different sources, including the Asian Epidemic Model (AEM) and LSHTM’s HIVTOOLS
ESTIMATED PROPORTIONOF INFECTIONS (7)
Molecular epidemiology
Molecular epidemiology uses genetic characterization of HIV to assign subtypes and calculate relatedness between isolates
For example, over 90% of HIV-positive Vietnamese IDU in Melbourne, Australia acquired HIV while injecting during visits to Vietnam
Other studies show clear viral overlap between IDU and SW in Denpaser, Bali
Kobe – explosive Burma study

FROM PROBLEM TO RESPONSE (1)
Having assessed the problem in previous steps, we now assess the response in the following steps
PROGRAM SERVICES (1)
Program monitoring is the first essential step in monitoring the HIV response. For example:
Injecting drug user programs promote safe injecting equipment and practices, condom use and drug substitution therapy
Sex worker programs promote improved sexual health, condom use, solidarity and group empowerment and legislative and policy reform
MSM programs promote safe sexual practices and legislative and policy reform

PREVENTION PROGRAM FOR IDU IN UKRAINEMinimum package
•Personal protective equipment (syringes, condoms)•Information materials•Outreach and prevention counseling
Larger package
•Above, plus•HIV counseling and testing•Specialist counseling•Referrals to STI/hepatitis diagnosis/treatment)•Referral to programs for drug addiction•Referral to substitution therapy programs•Self-help groups
Sources: Ukraine MOH, 2004

PROGRAM SERVICES (2)Regular program monitoring, using structured reporting forms, by service providers is especially relevant in smaller epidemics
In larger epidemics, program monitoring has a role, but the emphasis on structural rather than individual interventions, particularly in larger countries with higher prevalence, poses challenges
Examples of structural interventions include legislating 100% condom use in sex establishments, socially marketing condoms in red light districts or providing free or subsidized needles through retail outlets
Structural interventions may require surveys as well as program reporting

COVERAGE (1)
Coverage is a critical measure of program performance and a prerequisite for risk reduction
How do we estimate coverage?

COVERAGE (2)
Program monitoring
If we have an estimated 1,000 IDU in a city and our program monitoring records show we have enrolled 500, our estimated coverage is 50%

COVERAGE (3)
Service statistics
AdvantagesDoes not require special survey
DisadvantagesNo real denominatorLimited accuracyHard to prevent double-counts
COVERAGE (4)
Behavioral surveys – coverage items
We can – and should - include items on program coverage, including exposure to different intervention components and frequency of exposure in behavioral surveys

COVERAGE (5)
Behavioral surveys – coverage items
AdvantagesProduces more accurate coverage estimatesMay be included in existing behavioral surveys
DisadvantagesRequires surveyRequires effective sampling strategy, especially with hidden populations

COVERAGE (6)
Achieving coverage vital – but difficult – our core challenge and performance goal in Asia in next decade

OUTCOMES (1)
The key outcomes in concentrated epidemics are reduced unsafe sexual and injecting practices
We measure outcomes using behavioral surveys

IMPACTS (1)
The key impacts in concentrated epidemics are reduced HIV transmission and AIDS morbidity and mortality
We measure impacts using HIV prevalence surveys and AIDS clinical records

HIV PREVALENCE IN THAILAND
0
0.5
1
1.5
2
2.5
3
3.5
89 90 91 92 93 94 95 96 97 98
ANC CONSCRIPTS
Sources: Peerapatanapokin et al, 2004

HIV PREVALENCE IN CAMBODIA
Sources: Cambodia Surveillance Unit, National Center for HIV/AIDS, Dermatology and STDs (NCHADS), 2004
Brothel-based sex workers
Non-brothel-based sex workers
Urban police0
10
20
30
40
50
1998 1999 2000 2001 2002
% H
IV p
revale
nce
Year

CONCLUSIONS (1)THE PRIMACY OF SECONDARY PREVENTIONPrimary prevention focuses mainly on the uninfected and secondary prevention focuses mainly on the infected
Monitoring and evaluation focuses mainly on primary prevention in generalized epidemics and on secondary prevention in concentrated epidemics
This creates invaluable opportunities for intensive, integrated prevention, treatment and support in the context of secondary prevention, as this simple example shows

0
200,000
400,000
600,000
800,000
1,000,000
1,200,000
USA China
Know HIV Status Don't Know HIV Status
SECONDARY HIV PREVENTION:THE DIFFERENCE BETWEEN USA AND CHINA
Sources: Yip, 2005

CONCLUSIONS (2)THE LOGIC OF CONCENTRATED EPIDEMICS
Concentrated epidemics require a particular logic, in which we progressively estimate HIV infection, population size and interactions to assess the problem, then assess program services, coverage, outcomes and impacts, to assess the response
Concentrated epidemics are preventable – we have the knowledge and M&E tools to stem transmission

CONCLUSIONS (3)DO THE RIGHT THING, DO IT RIGHT, DO ENOUGH OF IT
Are we doing the right thing?

HIV TRANSMISSION AND PREVENTION PRIORITIES IN GHANA
Infections from high risk partnerships
Resources for high risk interventions
Sources: MAP review, , 2004, GARFUND, 2004

CONCLUSIONS (4)DO THE RIGHT THING, DO IT RIGHT, DO ENOUGH OF IT
Are we doing it right?

.
3
11
49
56
0.5
0.3
0 10 20 30 40 50 60 70 80 90 100
Free needles
Free STI treatment
Free condoms
HIV counseling
IEC materials
Methadone detoxification
Percent
One person
IDU IN YUNNAN, CHINA CAN’TINJECT SAFELY WITH A PAMPHLET
Sources: UK-China AIDS Programme, 2003, MAP, 2004

CONCLUSIONS (5)DO THE RIGHT THING, DO IT RIGHT, DO ENOUGH OF IT
Are we doing enough of it?

COVERAGE OF VULNERABLE GROUPS IN ASIA
Sources: UNAIDS, 2005
0
20
40
60
80
100
MSM IDU SW

CONCLUSIONS (6)MONITORING AND EVALUATION IS CENTRAL1. Understand, but don’t overcomplicate. Delineate and address major drivers
of transmission
2. Have courage to recognize transmission is primarily among vulnerable groups and to protect them
3. Ensure vulnerable group prevention funding is broadly commensurate with proportion of infections attributable to vulnerable groups
4. Identify best proven approaches for context and key determinants of success
5. Identify all sites with many vulnerable group members
6. Enumerate the size of vulnerable groups in each site
7. Routinely track coverage, to ensure all/most vulnerable group members are reached
8. Routinely track quality, to ensure key determinants of success are delivered
9. Selectively assess biological impact, to ensure approaches remain effective and for advocacy