Embed Size (px)
Citation preview

DATA FLOW CONTROL AND PERFORMANCE
EVALUATION OF IEC 61850 SUBSTATION
AUTOMATION SYSTEM
A thesis submitted to The University of Manchester for the degree of
Doctor of Philosophy
in the Faculty of Science and Engineering
2018
FANGFANG DONG
SCHOOL OF ELECTRICAL AND ELECTRONIC ENGINEERING

Page | 1
LIST OF CONTENTS
LIST OF CONTENTS ................................................................................................... 1
LIST OF FIGURES ....................................................................................................... 6
LIST OF TABLES ......................................................................................................... 9
LIST OF ABBREVIATIONS ...................................................................................... 10
LIST OF PUBLICATIONS ......................................................................................... 12
ABSTRACT ................................................................................................................. 13
DECLARATION ......................................................................................................... 14
COPYRIGHT STATEMENT ...................................................................................... 15
ACKNOWLEDGEMENT ........................................................................................... 16
CHAPTER 1 INTRODUCTION .............................................................................. 17
1.1 Background ................................................................................................... 17
1.2 Substation automation system ....................................................................... 20
1.3 Issues affecting the substation ....................................................................... 23
1.4 Motivation ..................................................................................................... 25
1.5 Research objectives ....................................................................................... 26
1.6 List of Main Contributions to Work .............................................................. 27
1.7 Thesis outline ................................................................................................ 28
CHAPTER 2 LITERATURE REVIEW ................................................................... 30
2.1 Introduction ................................................................................................... 30
2.2 IEC 61850 communication network .............................................................. 30
2.3 Advantages of IEC 61850 ............................................................................. 32
2.4 Implementations of IEC 61850 ..................................................................... 34
2.5 Performance evaluation methods for IEC 61850-based substation automation
system ....................................................................................................................... 37
2.5.1 Analytical methods .................................................................................... 37

Page | 2
2.5.2 Experimental methods ............................................................................... 38
2.5.3 Network simulation methods ..................................................................... 39
2.6 Data flow modelling and control ................................................................... 40
2.6.1 Dataflow analysis of substation automation system network .................... 40
2.6.2 Data flow modelling .................................................................................. 42
2.7 Rate control for MMS messages ................................................................... 44
2.8 Data management of Ethernet-based networks ............................................. 44
2.9 Considerations for VLANs and MAC address filtering ................................ 46
2.9.1 VLANs ....................................................................................................... 47
2.9.2 MAC address filtering ............................................................................... 48
2.9.3 Network bandwidth considerations ........................................................... 48
2.10 Summary .................................................................................................... 48
CHAPTER 3 FUNDAMENTALS ........................................................................... 50
3.1 Introduction ................................................................................................... 50
3.2 IEC 61850 standards ..................................................................................... 50
3.3 Hierarchy function and interfaces of IEC 61850 ........................................... 51
3.4 Functions and logical nodes .......................................................................... 53
3.5 Abstract Communication Service Interface (ACSI) ...................................... 55
3.6 Profiles and protocols stack ........................................................................... 58
3.7 Specific Communication Service Mapping (SCSM) .................................... 59
3.8 IEC 61850 message types .............................................................................. 60
3.8.1 GOOSE ...................................................................................................... 61
3.8.2 Sampled Values (SV)................................................................................. 62
3.8.3 IEC 61850 MMS ........................................................................................ 63
CHAPTER 4 METHODOLOGY ............................................................................. 67
4.1 Introduction ................................................................................................... 67
4.2 Research methodology .................................................................................. 67

Page | 3
4.3 The AS3 Architecture and data flow .............................................................. 69
4.4 Simulation of the SAS network ..................................................................... 73
4.5 Data flow control method .............................................................................. 74
4.5.1 First-in-first-out queuing............................................................................ 75
4.5.2 Priority queueing........................................................................................ 75
4.5.3 Weighted Fair Queuing .............................................................................. 76
4.6 Summary ....................................................................................................... 77
CHAPTER 5 MODELLING OF THE SAS NETWORK USING OPNET ............. 78
5.1 Introduction ................................................................................................... 78
5.2 OPNET network simulator ............................................................................ 78
5.2.1 Introduction ................................................................................................ 78
5.2.2 OPNET simulation mechanism ................................................................. 79
5.2.3 Network model .......................................................................................... 82
5.2.4 Node model ................................................................................................ 83
5.2.5 Process model ............................................................................................ 83
5.2.6 Modelling of IEDs and devices ................................................................. 84
5.3 Data flow analysis between process bus and station bus .............................. 85
5.3.1 Design of the IEC 61850 MMS models..................................................... 86
5.4 Detail double bus bar applications ................................................................ 94
5.5 Simulation of Process Bus ............................................................................. 96
5.5.1 SV traffic estimation .................................................................................. 98
5.5.2 GOOSE traffic estimation .......................................................................... 99
5.5.3 Analysis simulation results for process bus ............................................. 101
5.6 Simulation of station bus ............................................................................. 102
5.6.1 MMS traffic estimation ............................................................................ 103
5.6.2 Analysis simulation results for station bus .............................................. 105
5.7 Summary ..................................................................................................... 106

Page | 4
CHAPTER 6 Implementation of the Data Flow Control the SAS ......................... 107
6.1 Introduction ................................................................................................. 107
6.2 Implementation of the selected substation .................................................. 107
6.3 Modelling and implementation ................................................................... 109
6.4 Results and discussions ............................................................................... 111
6.4.1 Comparison of FIFO, PQ and WFQ ........................................................ 111
6.4.2 Capacity assessment for FIFO, PQ and WFQ ......................................... 115
6.5 Summary ..................................................................................................... 117
CHAPTER 7 PERFORMANCE EVALUATION AND RESULTS ANALYSIS . 119
7.1 Introduction ................................................................................................. 119
7.2 IEC 61850 performance requirements......................................................... 119
7.3 Process Bus Performance ............................................................................ 120
7.3.1 Fixed SV and fixed GOOSE .................................................................... 121
7.3.2 Fixed SV with random GOOSE............................................................... 123
7.3.3 Random SV with fixed GOOSE .............................................................. 124
7.3.4 Random SV and random GOOSE ........................................................... 126
7.4 Station bus performance .............................................................................. 127
7.5 Summary ..................................................................................................... 131
CHAPTER 8 Probability Study of IEC 61850-based Substation Automation System
132
8.1 Introduction ................................................................................................. 132
8.2 Mathematical modelling of IEC 61850 SAS ............................................... 132
8.2.1 Modelling of cyclic data flow .................................................................. 133
8.2.2 Modelling of stochastic data flow ............................................................ 134
8.2.3 Modelling of burst data flow ................................................................... 135
8.3 Data flow analysis in a substation ............................................................... 137
8.4 Simulation and analysis ............................................................................... 138

Page | 5
8.4.1 Scenario 1 ................................................................................................ 138
8.4.2 Scenario 2 ................................................................................................ 142
8.5 Laboratory Investigation of IEC 61850 traffic Behaviour .......................... 145
8.5.1 Experiment Setup ..................................................................................... 146
8.5.2 Case Study 1: Breaker Failure Protection Scenario ................................. 148
8.5.3 Case Study 2: Differential protection scenario ........................................ 152
8.6 Summary ..................................................................................................... 154
CHAPTER 9 CONCLUSIONS .............................................................................. 155
9.1 Conclusions ................................................................................................. 155
9.2 Suggestion for Future Work ........................................................................ 157
REFERENCES ........................................................................................................... 159
APPENDICES A: A National Grid 400kV Substation .............................................. 167
Appendix B: IEC 61850 Message Formats ................................................................ 168
9.3 B.1 GOOSE Message APDU ...................................................................... 168
9.4 B.2 SV Message APDU ............................................................................. 171

Page | 6
LIST OF FIGURES
Figure 1-1 Total UK greenhouse gas emissions, 1990-2015 (MtCO2e) [7] ................ 18
Figure 1-2 Greenhouse gas emissions by sector, UK, 2015 [7] ................................... 19
Figure 2-1 A Simple Design of Substation Automation System with Data Flow
Requirements................................................................................................................ 41
Figure 3-1 Hierarchy structure and interface model of a substation automation system
[95] ............................................................................................................................... 52
Figure 3-2 Relationship between IEC 61850 Data Models [83] .................................. 54
Figure 3-3 A basic Class Model of the ACSI [83] ....................................................... 55
Figure 3-4 Two Group of ACSI Service, (1) Client-Server Model[83] ....................... 57
Figure 3-5 Two Group of ACSI Service, (2) Peer-to-Peer Model[83] ........................ 57
Figure 3-6 Overview of functionality and profiles [100] ............................................. 58
Figure 3-7 Mapping ACSI to GOOSE, SV, and MMS to the Communication Profiles
...................................................................................................................................... 59
Figure 3-8 Transmission time for events[18] ............................................................... 61
Figure 3-9 MMS Stack over TCP/IP ............................................................................ 66
Figure 4-1: Methodology of data flow management.................................................... 68
Figure 4-2 Generic architecture of AS3 ....................................................................... 69
Figure 4-3 Generic architecture applied across two bays ............................................ 70
Figure 4-4 Filter switch mechanism ............................................................................. 71
Figure 4-5 Generic architecture applied to numbers of bays ....................................... 72
Figure 4-6 High-level views of the process bus architecture for double bus bar
substation ..................................................................................................................... 72
Figure 4-7 Flowchart model of SAS network performance research .......................... 73
Figure 4-8 First-in-first-out queuing algorithm ........................................................... 75
Figure 4-9 Priority Queuing (PQ) algorithm ................................................................ 76
Figure 4-10 WFQ queuing algorithm ........................................................................... 76
Figure 5-1 Hierarchical modelling ............................................................................... 80
Figure 5-2 Summary of the typical OPNET traffic model hierarchy........................... 81
Figure 5-3 OPNET Custom application hierarchy ....................................................... 81
Figure 5-4Network model in project editor. ................................................................ 82
Figure 5-5 Node model in node editor ......................................................................... 83
Figure 5-6 Process model in the Process Editor........................................................... 84

Page | 7
Figure 5-7 Point-to-point communication within SAS ................................................ 85
Figure 5-8 TCP Three-Way Handshake ....................................................................... 86
Figure 5-9 MMS Message Transfer between Different Phase during the Connection of
MMS Client and Server ............................................................................................... 87
Figure 5-10 Application Attributes .............................................................................. 88
Figure 5-11 Http Attribute Table ................................................................................. 89
Figure 5-12 Configuration of the Transport Connection Setup in OPNET ................. 90
Figure 5-13 MMS Association in OPNET ................................................................... 90
Figure 5-14 OPNET model for protection and control IED ........................................ 91
Figure 5-15 OPNET model for circuit breaker IED..................................................... 92
Figure 5-16 MU IED model ......................................................................................... 93
Figure 5-17 Double bus bar single breaker with bus tie arrangement ......................... 94
Figure 5-18 Detailed double bus bar substation application ........................................ 95
Figure 5-19 Detailed double bus coupler bay substation application .......................... 96
Figure 5-20 OPNET modelling for bus coupler bay process bus network .................. 97
Figure 5-21 Switch default settings.............................................................................. 98
Figure 5-22 MU SV message setting ........................................................................... 99
Figure 5-23 GOOSE setting in the MP ...................................................................... 100
Figure 5-24 GOOSE setting on CBC ......................................................................... 100
Figure 5-25 Consumption of communication channel bandwidth between the switch
and MP ....................................................................................................................... 101
Figure 5-26 ETE time delay in process bus ............................................................... 102
Figure 5-27 Station bus model with one bay in OPNET ........................................... 103
Figure 5-28 MMS traffic setting in OPNET .............................................................. 104
Figure 5-29 FTP traffic setting in OPNET ................................................................. 104
Figure 5-30 Time delay of station bus ....................................................................... 105
Figure 6-1 Single-line diagram of the National Grid 400kV substation .................... 108
Figure 6-2 Station Bus Structure of the SAS network for the double bus-bar
Substation ................................................................................................................... 108
Figure 6-3 Implementation of the SAS network using OPNET ................................ 110
Figure 6-4 GOOSE message delays for FIFO algorithm ........................................... 112
Figure 6-5 GOOSE message delays for PQ algorithm .............................................. 112
Figure 6-6 GOOSE message delays for WFQ algorithm. .......................................... 113
Figure 6-7 Comparison of the GOOSE time delay between using FIFO, PQ, and WFQ
.................................................................................................................................... 114

Page | 8
Figure 6-8 GOOSE message delays for FIFO ........................................................... 115
Figure 6-9 GOOSE message delays for WFQ algorithm. .......................................... 116
Figure 6-10 GOOSE message delays for WFQ algorithm. ........................................ 117
Figure 7-1 Definition of transmission time (Reference form IEC 61850-5 [110]) .... 120
Figure 7-2 ETE time delay for 10 MUs, 13 MUs, 17MUs, and 18MUs ................... 122
Figure 7-3 ETE time delay for 10 MUs, 13 MUs, 17MUs, and 18MUs ................... 124
Figure 7-4 ETE time delay for 10 MUs, 13 MUs, 17MUs, and 18MUs, .................. 125
Figure 7-5 ETE time delay for 10 MUs, 13 MUs, 17MUs, and 18MUs ................... 127
Figure 7-6 Station bus model contains five bays using ring topology in OPNET ..... 128
Figure 7-7 ETE time delay for 15, 18, 19, 20, 21, 22 bays in the station bus network
.................................................................................................................................... 129
Figure 7-8 ETE time delay comparison of 22 bays and 23 bays ............................... 129
Figure 7-9 Time Delay of Bays .................................................................................. 130
Figure 8-1 Generation of data packets for cyclic data flow[76] ................................ 134
Figure 8-2 Generation of data packets for the stochastic data flow [76] ................... 135
Figure 8-3 Generation of data packets for burst data flow[82] .................................. 136
Figure 8-4 Single-line diagram of the National Grid 400kV substation .................... 137
Figure 8-5The SAS network architecture .................................................................. 138
Figure 8-6 Time Delay on the station bus in Scenario 1 with 1/s Update Rate ......... 141
Figure 8-7 End-to-end Time Delay of Station bus in Scenario 1 ............................... 141
Figure 8-8 Station Bus Time Delay of Scenario 2 with 1/s Update Rate .................. 144
Figure 8-9 End-to-end Time Delay of Station Bus in Scenario 2 .............................. 145
Figure 8-10 Single line diagram of the substation model .......................................... 147
Figure 8-11The RTDS test platform .......................................................................... 148
Figure 8-12 GOOSE message sent from MP1 during steady-state and fault event ... 151
Figure 8-13 GOOSE messages send by MP2 ............................................................ 151
Figure 8-14 GOOSE sent from MP 1, instant fault .................................................... 152
Figure 8-15 GOOSE sent from MP 1, permanent fault ............................................. 154

Page | 9
LIST OF TABLES
Table 3-1 IEC 61850 ACSI Objects and MMS Objects[103]...................................... 64
Table 3-2 Example of Mapping of ACSI Services to MMS Services[104] ................. 65
Table 5-1 Messages configuration for process bus .................................................... 101
Table 5-2 Messages configuration for station bus ..................................................... 105
Table 6-1 SAS Message Type and Tag Values .......................................................... 111
Table 6-2 Comparison of the GOOSE time delay between FIFO, PQ, and WFQ
methods with 11 bays ................................................................................................. 114
Table 7-1 IEC 61850 MESSAGE TYPES AND PERFORMANCE ......................... 120
Table 7-2 Performance of fixed GOOSE and fixed SV ............................................. 122
Table 7-3 Performance of fixed SV and random GOOSE ......................................... 124
Table 7-4 Performance of random SV and fixed GOOSE ......................................... 126
Table 7-5 Performance of random SV and random GOOSE ..................................... 127
Table 7-6 Data analysis of the time delay performance in station bus ...................... 130
Table 8-1 Summary of data flow in the SAS network for Scenario 1 ....................... 140
Table 8-2 Summary of data flow in the SAS network for Scenario 2 ....................... 143
Table 8-3 Data flow for Case Study 1, Breaker Failure Protection ........................... 149

Page | 10
LIST OF ABBREVIATIONS
Abbreviations
ACSI Abstract Communication Service Interface
AIS Air Insulated Substation
ARP Address Resolution Protocol
AS3 The Architecture of Substation Secondary System
CB Circuit Breaker
CCC Committee on Climate Change
CID Configured IED Description
CO2 Carbon Dioxide
CO2E/kWh Carbon Dioxide Equivalent per kiloWatt-hour
CT Current Transformer
DG Distributed Generation
DNP3 Distributed Network Protocol 3
ETE End-to-End
HSR High-availability Seamless Redundancy
GHG Greenhouse Gas
GOOSE Generic Object-Oriented Substation Event
GPS Global Positioning System
GSSE Generic Substation State Events
GVRP GARP VLAN Registration Protocol ICT
HMI Human Machine Interface
ICT Information and Communication Technology
IEC International Electrotechnical Commission
IED Intelligent Electronic Device
IEEE Institute of Electrical and Electronics |Engineers
I/O Input/output
IP Internet Protocol
IRIG-B Inter-Range Instrumentation Group – Code B
Page | 11
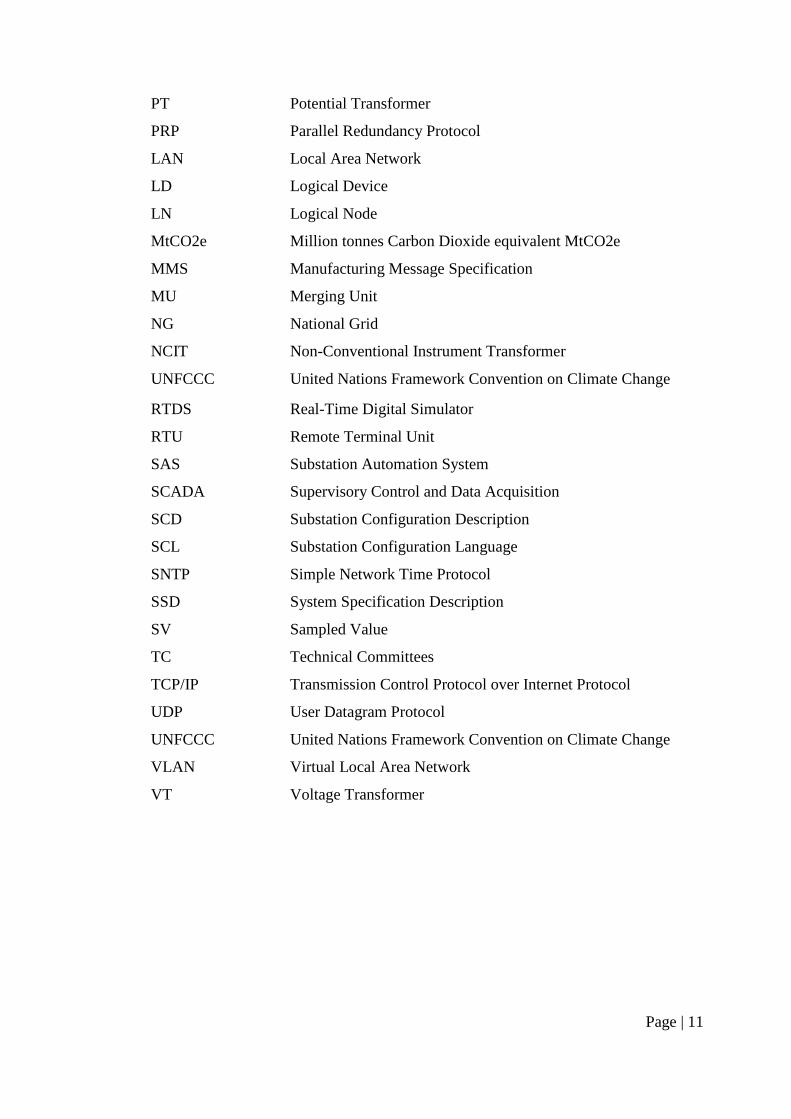
PT Potential Transformer
PRP Parallel Redundancy Protocol
LAN Local Area Network
LD Logical Device
LN Logical Node
MtCO2e Million tonnes Carbon Dioxide equivalent MtCO2e
MMS Manufacturing Message Specification
MU Merging Unit
NG National Grid
NCIT Non-Conventional Instrument Transformer
UNFCCC United Nations Framework Convention on Climate Change
RTDS Real-Time Digital Simulator
RTU Remote Terminal Unit
SAS Substation Automation System
SCADA Supervisory Control and Data Acquisition
SCD Substation Configuration Description
SCL Substation Configuration Language
SNTP Simple Network Time Protocol
SSD System Specification Description
SV Sampled Value
TC Technical Committees
TCP/IP Transmission Control Protocol over Internet Protocol
UDP User Datagram Protocol
UNFCCC United Nations Framework Convention on Climate Change
VLAN Virtual Local Area Network
VT Voltage Transformer

Page | 12
LIST OF PUBLICATIONS
1) F. Dong, H. Li, and R. Zhang, “Evaluation of Data Flow Control
Analysis and Performance for Architecture of Secondary Substation
System (AS3) Design,” 6th International Conference on Advanced
Power System Automation and Protection (APAP2015), Nanjing, Sept.
2015.
2) F. Dong, H. Li and R. Zhang, “A Comparison Studies of Data Flow
Control Methods for IEC 61850-based Substation Automation
System”, 7th International Conference on Advanced Power System
Automation and Protection (APAP2017), Jeju, Oct 2017

Page | 13
ABSTRACT
The University of Manchester
Fangfang Dong
A thesis submitted for the degree of Doctor of Philosophy
Data Flow Control and Performance Evaluation of IEC 61850-based Substation
Automation System
January 2018
The Power substation primary plant has an average lifetime of around 40 to 50 years,
which renewed only when they are physically or mechanically life-expired. Secondary
equipment that has integrated the information & communication technology (ICT) has
typically an average lifespan of approximately 10 to 15 years. This requires at least
once or twice replacement and maintenance for the secondary equipment. Since the
technological obsolescence has become a significant concern, due to the speed of the
new evolutions for ICT products, the continuous upgrading of the software or
firmware for the Intelligent Electronic Devices (IEDs) will increase the maintenance
frequency. The maintenance and commissioning are usually having long outage time,
which considered high risk and high cost. Hence, this requires a solution for the above
issues.
To solve the above issue and to provide the interoperability for multi-vendor IED, the
International Electrotechnical Commission (IEC) 61850 standard has defined as the
unique communication protocol for substation automation before the IEC 61850-
based digital substation can be full implement, some crucial tasks required to
investigate, such as data flow control and performance evaluation.
This thesis presents a data flow control method for the IEC 61850-based substation
automation system (SAS). It proposes the priority queueing method and applies it to
the AS3 architecture to improve the dynamic performance of the system. The
performance of the SAS has been evaluated using the event-based simulation tool,
OPNET. Two alternative queueing methods have considered comparing the
performance. It simulation results show that the priority queueing method has better
performance than the WFQ and FIFO in series conditions.
The thesis has presented the modelling of the IEC 61850-based network component
and message traffic in detail. The performance of the process bus and station bus have
been evaluated, and the capability of each network has been analysed based on the
IEC 61850 performance requirements.
This thesis has also considered the probability study using mathematical models to
evaluate the AS3 architecture. It classified all the messages that contain in the IEC
61820-based SAS into three types, i.e. cyclic data, stochastic data and burst data. The
mathematical model has been used to evaluate the performance of the station bus
under different MMS updated rate. Moreover, the thesis has investigated the IEC
61850 traffic behaviour based on the laboratory setup. The characteristic of the MMS,
GOOSE and SV traffic have been examined in real-world conditions.

Page | 14
DECLARATION
No portion of the work referred to in this thesis has been submitted in support of an
application for another degree of qualification of this or any other university or other
institution of learning.

Page | 15
COPYRIGHT STATEMENT
i. The author of this thesis (including any appendices and/or schedules to this thesis)
owns certain copyright or related rights in it (the “Copyright”) and s/he has given
The University of Manchester certain rights to use such Copyright, including for
administrative purposes.
ii. Copies of this thesis, either in full or in extracts and whether in hard or electronic
copy, may be made only in accordance with the Copyright, Designs and Patents
Act 1988 (as amended) and regulations issued under it or, where appropriate, in
accordance with licensing agreements which the University has from time to time.
This page must form part of any such copies made.
iii. The ownership of certain Copyright, patents, designs, trademarks and other
intellectual property (the “Intellectual Property”) and any reproductions of
copyright works in the thesis, for example, graphs and tables (“Reproductions”),
which may be described in this thesis, may not be owned by the author and may
be owned by third parties. Such Intellectual Property and Reproductions cannot
and must not be made available for use without the prior written permission of
the owner(s) of the relevant Intellectual Property and/or Reproductions.
iv. Further information on the conditions under which disclosure, publication and
commercialisation of this thesis, the Copyright and any Intellectual Property
and/or Reproductions described in it may take place is available in the University
IP Policy (see http://documents.manchester.ac.uk/display.aspx?DocID=24420), in
any relevant Thesis restriction declarations deposited in the University Library,
The University Library’s regulations (see
http://www.library.manchester.ac.uk/about/regulations/) and in The University’s
policy on Presentation of Theses.

Page | 16
ACKNOWLEDGEMENT
I want to express my heartfelt gratitude to all those who gave me the possibility to
complete this project.
My deepest gratitude goes first and foremost to Dr Haiyu Li, my supervisor. I want to
acknowledge the great advice, guidance and support that you has provided me
throughout this project. Without his consistent and illuminating instruction and
encouragement, this project could never reach to its present form.
I would also like to thank Senpeng Zhao, Linwei Chen, Yue Guo, Yukun Shen and
Luoyu Xu from the University of Manchester for all the help they provided me with at
different stages of the project.
I would especially like to thank my family. My wife, Shuangqi has been supportive of
me throughout this entire process and has made countless sacrifices to help me get to
this point. My parents, sister and Steven deserve special thanks for their continued
support and encouragement. Without such a team behind me, I doubt that I would be
in this place today.
For everyone who has had a positive impact on my life, I say thank you.

CHAPTER 1 INTRODUCTION
_____________________________________________________________________________________________________________________
Page | 17
CHAPTER 1 INTRODUCTION
1.1 Background
Nowadays, climate change is a real and serious issue in our life. The climate change
is caused by the increase in greenhouse gas (GHG) emissions over the past century in
the Earth’s atmosphere. The average temperature of the earth’s atmosphere and sea
level have increased due to the rapid rise in emission of the GHG such as carbon
dioxide (CO2), methane (CH4) etc. Many scientists believe that the main reason for
the increase of the GHG emissions is due to human activities particularly, in burning
the fossil fuels for electricity generation, heat and transportation [1]. The climate
change can have many negative effects such as global warming, sea levels rising,
extreme weather and nature disaster, such as hurricanes and severe droughts [2]. To
find solutions and mitigate the effects of the climate changes, the United Nations
created a convention in 1992 known as the United Nations Framework Convention
on Climate Change (UNFCCC). This convention is the main forum for international
action on climate change. The Kyoto Protocol published in 1997, and this protocol
aims to set a target to reduce the GHG emissions within 37 industrialised countries
[3]. The UNFCCC also led to the Paris Agreement in 2015 and intended to stop the
increase in the global average temperature [4].
Moreover, according to the ‘Climate change Art 2008’, the UK government aims to
reduce the GHG emissions by at least 80% lower than the 1990 level in the year of
2050 [5]. This Act also established the Committee on Climate Change (known as the
CCC) to monitor the reduction progress of GHG emission in the UK and ensure the
emissions target are met and can be prove by evidence [6]. In 2015, the UK
emissions of the GHG had estimated to be 495.7 million tonnes of carbon dioxide
equivalent (MtCO2e), as shown in Figure 1-1. The total UK GHG emissions were
expected to decrease by 38.0 per cent from 1990 [7]. Moreover, the energy supply
remains the largest emitting sector of UK, as shown in Figure 1-2. In 2015, this
sector was responsible for 29 per cent of the total GHG emissions in the UK. Also,

CHAPTER 1 INTRODUCTION
_____________________________________________________________________________________________________________________
Page | 18
the primary source of emissions from the energy supply is through burning the coal
and natural gas to generate electricity in power plants. Therefore, decarbonising the
energy supply sector is a significant way to reduce GHG emissions.
Renewable energy is one of the most useful tools to fight against climate change. For
example, using renewable energy sources for electricity generation will produce less
or even no GHG emissions. In 2014, the report provided by CCC, has used numbers
to show that burning coal for electricity can release 1.4 to 3.6 pounds of carbon
dioxide equivalent per Kilowatt-hour (CO2E/kWh) and 0.6 and 2 pounds of
CO2E/kWh for burning natural gas. On the other hand, the wind power only emits
0.02 to 0.04 pounds of CO2E/kWh on a life-cycle basis, and solar is responsible for
between 0.07 to 0.2 pounds of CO2E/kWh. [8]. Therefore, increasing the supply of
renewable energy sources can help the reduction of fossil fuels consumption and
significantly reduce the GHG emissions. However, by doing this, it will bring the
technical challenges to the current power system which may affect network stability
and power quality.
Figure 1-1 Total UK greenhouse gas emissions, 1990-2015 (MtCO2e) [7]

CHAPTER 1 INTRODUCTION
_____________________________________________________________________________________________________________________
Page | 19
Figure 1-2 Greenhouse gas emissions by sector, UK, 2015 [7]
Meanwhile, the worldwide demand for electric energy is continually increasing and
expected to rise by about 82% by 2030 [9]. This demand can be met by building
more new coal, nuclear and natural gas power stations, as well as integrating the
renewable energy sources and Distributed Generation (DG) into the power grid.
However, the cost of building new power generation, new substations, and new
transmission lines is extremely expensive, as well as the replacement and upgrades of
ageing assets. To make matters worse, it is still very challenging to significantly
utilise renewable energy sources for the electric power system ecause of the
intermittent electricity generation characteristic of renewable sources. On the other
hand, this demand also requires significant investment in the transmission &
distribution infrastructure to improve the performance of the existing system and
expand the overall grid. Therefore, to maintain the reliability of the electric power

CHAPTER 1 INTRODUCTION
_____________________________________________________________________________________________________________________
Page | 20
system, it is necessary to investigate new technologies that can make the power grid
more resilient.
Recognising these challenges, the energy community is now increasing the
incorporation of Information and Communication Technologies (ICT) into the power
system in recent years. ICT can improve the control of the power system, thereby
increasing the flexibility and functionality of these systems. Modern communication
and smart components can transmit much faster to diagnose problems and isolate the
faulty parts. Replacing the existing communication channels (for example, cellular
telephone networks) between substations and the control centre by the high-
bandwidth optical fibre can ensure the real-time information exchange and allows
utilities to manage the power system integrated. Also, ICT can provide cost benefits
by maximising power flows, combining renewable energy sources and DGs to the
existing power system.
Moreover, two-way communication between the grid and the consumer via smart
meters can provide information regarding energy use at a much more massive scale
than traditional metering practices, effectively increasing the price elasticity of
demand, enabling more-efficient rate, and pricing regimes, such as real-time dynamic
pricing. With prices that more closely reflect the incremental costs of supplying
electricity, the overall economic efficiency of the electric system can be enhanced.
This occurs primarily through the reduction of peak loads so that more expensive
generation sources need not enter the generation mix.
To ensure the power system reliability, it is necessary to modernise the existing
communication infrastructure of the power system, particularly inside the
transmission and distribution substations.
1.2 Substation automation system
Substations play a critical role in the electric power transmission and distribution
systems. Substation normally including the transformer, circuit breaker, and the
protection and control equipment etc. The primary functions of a substation include

CHAPTER 1 INTRODUCTION
_____________________________________________________________________________________________________________________
Page | 21
the step-up or down the voltage level, control and protection of the power equipment
(such as transformer and circuit breaker), monitoring the switchyard etc.
In the substation, the transformer is the critical element, which provides a function to
step-up and step-down voltage level of the electric power. Electricity is generated in
the power plants at a relatively low voltage level, and these power plants are
normally located far away from the customers. Therefore, the transformers located in
the receiving substations are used to step-up the voltage level to reduce the power
loss during the long-distance transmission. After that, the electricity is delivered to
the local distribution systems by the high-voltage transmission lines and step-down
by the transformers in the distribution substation to the suitable voltage level for the
customers. Therefore, substations can create as the node in the electric power
systems.
The conventional substation is composed of the interlocking logic, remote terminal
unit (RTU), relays, current/potential transformers (CT/PT). The protection and
control schemes in the conventional substation are implemented using signal-
function electromechanical or static devices and hardwired relay logic. Each
indication and control function requires a point-to-point hardwire for data acquisition.
Therefore, the protection and control system within the legacy substation has a large
number of interconnections between multiple relays and conventional instrument
transformers using copper wiring. These hard wirings can make the maintenance and
commissioning both expensive and challenging.
In modern substations, some of which are already in place, the substation control and
protection system has been fully digitalised and connected using the high-speed
Local Area Network (LAN) within the substation. The substation control and
protection system are performed by the microprocessor-based Intelligent Electronic
Devices (IED). Many manufacturers have developed IEDs. They can provide
multiple functionalities and increase communication capabilities. They use the
Ethernet communication network to provide high flexibility architecture and property
connects for the IEDs. By taking advantage of these technologies, substation

CHAPTER 1 INTRODUCTION
_____________________________________________________________________________________________________________________
Page | 22
automation is, therefore, able to provide more accurate functionality. This kind of
substations are known as digital substations.
The communication system within digital substation allows fast response and real-
time applications for protection and control. In a digital substation, all the data
related to primary processes are digitised immediately at the point where it is
measured. Therefore, data can exchange between protection and control devices via
the Ethernet.
Substation Automation System (SAS) can be described as a comprehensive system
that consists of multifunctional IEDs and advanced network communication
technologies, which can provide the effective substation monitoring, protection, and
control functions in power system.
Manufacturers have introduced multiple communication protocols for the IEDs based
on their behaviour. They have developed various protocols by themselves, including
the IEC 60870-5 series, Distributed Network Protocol 3 (DNP3), Modbus etc.
However, the communication between different protocols can lead to many problems
for the network integrator. For example, the protocol converters used in the
substation Supervisory control and data acquisition (SCADA) are very complex,
which makes them costly and difficult to maintain. It also increases the risk of cyber-
security vulnerabilities. Therefore, the interoperability between different
manufacturers IEDs has becomes a critical issue. To solve this issue, a single
universal standard that provides interoperability between IEDs from multi-vendor is
needed.
In 2003, IEC Technical Committees (TC) 57 working group 10 published the
International Standard called IEC 61850 - Communication Network and Systems in
Substation. This standard provides the interoperability between multi-vendor IEDs,
improves the expandability of the system, and provides the unique protocols & data
structures that allow a wide range of interconnection technology to apply.

CHAPTER 1 INTRODUCTION
_____________________________________________________________________________________________________________________
Page | 23
1.3 Issues affecting the substation
Power System networks are handling challenges such as significant increases in
volumes of low carbon energy, changes in generation and an ageing asset base,
which means that a large part of the existing asset base is approaching the end of life.
These challenges will require the Power System operators to install new and
modernised substations continually. Moreover, the design of the new and modern
substation is needed to have a lower cost and become more flexible. Therefore, the
new substation should have the ability to optimise the use of existing assets and
meanwhile reducing the systems outage time requirements for both maintenance and
construction. Problems have been addressed as follow:
System operational requirements allow only limited outage time windows when
circuits can take out of service, which conflicts with the business needs for
ageing asset replacement, modernisation and new building work.
Life cycle issue, such as installing or commissioning a replacement can lead to a
long outage time. There is an inherent safety hazard in conventional substation
equipment and cabling between primary high voltage equipment and the
secondary control instrumentation. Working practices have been used to
effectively mitigate the risk but often at the expense of cost and long outage time.
These issues are now seriously challenging the sustainability of secondary system
assets, which threaten the availability and reliability of electricity transmission and
distribution networks.
To address the growing concerns for the surrounding substation asset replacement
and load related investment, a shift in design focus is required. The historical focus
for substation design criteria has been mainly on costs and reliability. The new
emerging criteria based on the current energy scenario extend beyond costs and
reliability to operation flexibility, environmental impact, maintainability,
interoperability, reconfigurability and controllability.

CHAPTER 1 INTRODUCTION
_____________________________________________________________________________________________________________________
Page | 24
Digital substation is based on the concepts of standardisation and interoperability. It
can reduce the number and duration of circuit outages required throughout the life
cycle of the substation. It can also replace many kilometres of copper wiring with the
digital measurements over a cost-effective optical-fibre network, and provide much
greater flexibility in building, instrumenting, maintaining modernising and
controlling future substation. However, the industry is faced with a major challenge
to introduce a step change in design, replacing a decades-old established and reliable
practice, with new technology that the industry is in the process of gaining
experience, mainly through off-line trials. Because protection is so critical to the
safety and integrity of the system, this technology cannot be accepted into business-
as-usual practice without risk management by parallel live trials.
Major technical issues which affecting substation secondary system will be:
Performance of the SAS network mainly depends on the end-to-end (ETE) delay of
the time-critical message for the protection systems. The time-critical messages that
define in IEC 61850 standards are GOOSE messages and SV messages. For example,
a GOOSE message, such as circuit breaker failure or bus differential trip, sends from
protective IEDs to circuit breaker controller within the process bus.
However, the in-service performance of IEC 61850 standard for the SAS network is
largely unknown, and its technologies is still some years away from maturity. IEC
61850-5 defines the allowable message to transmit time delay requirements. Hence,
these requirements can be used to determine the process bus and station bus
performance. Nevertheless, the SAS network performance and the system capability
cannot solve by this standard. It is difficult to find out guidance to summarise the
performance of time-critical message across the SAS network.
Moreover, Ethernet Switching is reliable and low-cost for the substation automation
system network. The substation automation system will expand as long as the power
substation expandes as a result of the power demand increment. Hence, the Ethernet
switch must be able to carry heavy traffic flows due to more numbers of IEDs and

CHAPTER 1 INTRODUCTION
_____________________________________________________________________________________________________________________
Page | 25
MUs being connected. Therefore, the Ethernet Switches need to be scalable and
carefully considered when designing the substation communication network.
Additionally, time synchronisation IEC 61850 proposes the Simple Network Time
Protocol (SNTP) is used for time synchronisation on LAN, but the SNTP provides
accuracy of about one millisecond, and it is not sufficient enough for the raw data
sampling. There is a competitive approach called IEEE 1588 the Precision Time
Protocol, which provides a high level of accuracy in the range of 1µs. This approach
requires the I Inter-Range Instrumentation Group – Code B (IRIG-B)
synchronisation signal that uses an external time synchronisation source. However,
the overall availability of SAS, the level of accuracy of the protection and control
functions can be an issue in this approach.
1.4 Motivation
In a digital substation, where IEC 61850 is employed, the communication network is
a critical factor for the substation automation system to operate stably and to provide
advanced functions. Within the substation network, a broadcast storm will occur
when a network system is overwhelming by continuous multicast or broadest traffic.
For example, in the digital substation, IEDs have been configured to send different
multicast data, such as GOOSE or Sampled Value (SV) to the network to maintain
the protection, control and monitoring functions. However, if an IED has a failure
network interface or have under the malicious attacks (or virus), IED can fail in a
mode that continuous sending broadcast packet to the network in a very high data
rate, and these broadcast packets can overwhelm and bring down the network and
cause failure in all network links.
Moreover, avalanche packets, such as GOOSE has the characteristic that a signal of
frequent change will cause large network traffic. In the worst situation, if one signal
changes, each task cycle in the IED will cause a significant reduction of the network
performance. Therefore, the communication system of the substation needs to be

CHAPTER 1 INTRODUCTION
_____________________________________________________________________________________________________________________
Page | 26
designed properly, and the performance of the system needs to be assessed to meet
the requirements of the IEC 61850 standards.
For the time-critical messages, the unexpected delay can lead to serious issues such
as blackout or damage of the primary devices. Hence, the communication system of
the substation needs to be designed properly, and the performance of the system
needs to be assessed to meet the requirements of the IEC 61850 standards. It is
necessary to ensure the dynamic performance of the SAS and therefore to avoid the
failure of protection, control and monitoring functions.
The objectives of the National Grid Architecture of Substation Secondary System
(AS3) project are to optimise secondary system equipment/asset lifetime. By
standardising both substation level and process level Input/output (I/O) interface
modules, hence to reduce the copper connections and provides digital information
with ‘plug and play’ function; formulate standardised equipment testing procedures
to deal with IEDs asset replacement issues; minimise the risk and time associated
with introducing new equipment. So far, the AS3 project has been completed with
reviewing the life cycle issues, finalising the digital substation architectures, etc.
Before carrying out costly and high risky site acceptance tests, it is necessary to
develop an AS3 configurable test to prove the design standardised secondary
substation system and figure out the characteristics such as network capabilities and
dynamic performance.
1.5 Research objectives
With the foregoing motivations, exhaustive research work is carried out herein to
investigate the performance of the communication network for the substation
automation system. The research objectives of this research are listed as below:
1. Literature survey on recent data flow control development in communication
system and substation automation systems and on the evaluation approaches
for the performance in the substation automation system.

CHAPTER 1 INTRODUCTION
_____________________________________________________________________________________________________________________
Page | 27
2. Detailed modelling of a typical UK National Grid (NG) 400kV substation.
The selected substation is a typical double bus bar substation with single-
breaker bus tie arrangement.
3. Develop a data flow control method to improve the SAS network performance
and compare the control method with alternative data flow control methods.
4. Evaluate and validate the data flow control performance of the SAS network
with realistic testing scenarios using event-based simulation tool called
OPNET Moulder (i.e. digital communication network simulator).
5. Develop the probability study based on mathematical models for three types
of data, i.e. cyclic data, stochastic data and burst data, to evaluate the
performance of the substation automation system.
6. Investigate the data flow behaviour of the IEC 61850 message, such as
GOOSE, SVs and MMS, in the VSATT laboratory set up by using RTDS.
1.6 List of Main Contributions to Work
The main contributions of this thesis have given as below:
Propose a data flow management system for AS3 Architecture, which utilises the
priority queueing to mitigate data flow within the IEC 61850 substation-based
automation system.
Comparison of the proposed common data flow control approach with two
alternative methods, i.e. the FIFO control and the WFQ method, using UK
substation network models.
Evaluated and validate the data flow management performance of the AS3
architecture with realistic testing scenarios using event-based simulation tool
OPNET (i.e. digital communication network simulator).

CHAPTER 1 INTRODUCTION
_____________________________________________________________________________________________________________________
Page | 28
Possibility study for the substation automation system using mathematical
models for three types of data, such as cyclic data, stochastic data and burst data,
to evaluate the performance of the substation automation system.
Investigate the data flow characteristic for the IEC 61850 messages under
different protection scenarios in the VSATT laboratory setup.
1.7 Thesis outline
This thesis is consists of nine chapters and two appendices.
Chapter 1 briefly introduces the background of the substation automation and
communication within the substation. The issues of the substation automation have
been described, and the motivation and objectives of this research have been
described as well. The remainder of this thesis is organised as follows:
Chapter 2 presents a critical literature review of current status on the research of the
substation automation system and the existing data flow control methods of the
substation automation system. The current status and implementation of IEC 61850
standards in the substation have been described. Different methods for data flow
control in digital substation have been discussed in details.
Chapter 3 describes fundamental theories related to the proposed data flow control
method. For a better understanding of the subsequent chapters, it firstly presents a
brief introduction of IEC 61850 standards and then it describes the IEC 61850
communication protocol and message types. The structure, feature and functions of
the IEC 61850 standards have been introduced in details. Also, the communication
protocol of IEC 61850 has described as well as the message types.
Chapter 4 proposes the data flow control design for the IEC 61850-based substation
automation system and describes the simulation method.
Chapter 5 provides the simulation of a substation communication network using
OPNET Modeler. The OPNET software has introduced in detail, and the modelling

CHAPTER 1 INTRODUCTION
_____________________________________________________________________________________________________________________
Page | 29
of each IEDs used in the network has described. The simulation of the station bus
and process bus has been presented.
Chapter 6 provides a performance evaluation of the substation communication
network. The performance requirements of IEC 61850-based SAS have been
introduced. The simulation of different scenarios has been carried out for both the
station bus and process bus. The test results had analysis and discussed for each
scenario.
Chapter 7 presents an implementation of the data flow control the performance of
these methods, the FIFO, PQ, and WFQ, are compared under several SAS
communication networks. The impact of each queuing method has been evaluated,
compared and discussed.
Chapter 8 presents a comparative study of the Probability (mathematical models)
modelling and simulation of IEC 61850-based substation automation system. A
laboratory investigation of IEC 61850 traffic Behaviour have been carried out and
described as well.
Chapter 9 gives conclusions of this research project. The future work of this
research has been described as well.

CHAPTER 2 LITERATURE REVIEW
_____________________________________________________________________________________________________________________
Page | 30
CHAPTER 2 LITERATURE REVIEW
2.1 Introduction
This chapter presents the literature review of the communication network simulation
technology that has currently been applied to the substation automation system, and
the performance evaluation methods for IEC 61850-based substation automation
system. The benefits of implementing the IEC 61850 have been described in detail as
well. Furthermore, this chapter has also reviewed the different data flow control
methods of the communication network. It discusses the methodologies that are used
to manage the data flow in a digital substation in detail.
2.2 IEC 61850 communication network
The communication network is an essential part of smart grid technologies. The
advantages of smart grid applications cannot fully be realised if the communication
system is underperforming [10]. Many types of research focus on developing the
Smart-Grid communication of the distribution network [11-16], which are the wide
area networks (WAN). The characteristics of a substation communication network,
which is the local area network (LAN), this needs to be described in more detail in
the literature.
Ethernet was invented in the mid of 1970s. The technology has been improved
significantly in recent years. The speed of Ethernet cable is much faster than before,
by the 1980s, from 10 megabits per second (Mbps) to now 1Gbps is commonly used.
Furthermore, the Gigabit Ethernet has now been introduced which can speed up to
100 Gbps [17]. For the substation, most of the communication network is 100 Mbps,
and some large network systems may have 1Gbps for trunk link [18]. The Ethernet’s
usability has proved to be the communication technology which can meet the
sufficient performance requirements for the substation automation in [19].

CHAPTER 2 LITERATURE REVIEW
_____________________________________________________________________________________________________________________
Page | 31
Furthermore, F.Engler et al.[20] have done the feasibility studies of IEC 61850 and
have proved the real-time performance of SAS can meet the standard requirements
[21]. Tengdin et al. [22] have examined the LAN congestion scenarios for the
Ethernet-based substation. However, the examined substation design has not
included any process bus, and the voltage transformers (VT) are still hard wirings
using primary injection to the protection relays, and the background traffic load has
not been matched to IEC 61850. Therefore, the performance of the substation
automation system based on the IEC 61850 standard is largely unknown, and it
requires further investigation.
IEC 61850 does not specify a mandatory communication architecture for the station
or process bus; neither the type of topology is used when applying the station bus or
process bus architecture. Therefore, many different types of process bus architecture
have been proposed using the ring, star, point to point or meshed topology in the
literature [23-29]. J. Mo [29] suggested that the process bus and station bus should be
separate from each other to avoid the overflow of the station bus network. Because
the process bus contains the high data rate traffic which requires by the protection
and control equipment. Alternatively, researches [30-34] have proposed the
architectures which mergies the process bus and station bus. One possible reason for
this is to reduce the number of switches used. Additionally, in [35] researchers have
provided the merging with process bus and station bus by using HSR and PRP
redundancy. However, the decision to use either separated or merged process bus and
station bus design should be based on the factors such as the actual application
requirements and IED limitations[36].
Many researchers have studied the reliability of IEC 61850-based substation. IEC
61850 standards have left the redundancy design of the communication system to
substation design engineering. The reliability analysis using the 3-state Markov
model has been shown in [37, 38]; fault-tree methods [39] and Reliability Block
Diagram (RBD) [40] are also adapted to the SAS network and the influence of repair
rates on Mean Time To Failure (MTTF) and Mean Time To First Failure (MTTF),

CHAPTER 2 LITERATURE REVIEW
_____________________________________________________________________________________________________________________
Page | 32
and the performance of communication architectures has been tested by some
research, shown in the following section.
2.3 Advantages of IEC 61850
Power substation technology has evolved considerably since the first substation went
into service in the late 1980s. Today, there are several hundred thousand substations
of various sizes and varieties in operation around the world. To get better reliability
of the power system, the automation in transmission and distribution substations is
necessary.
Substation automation refers to using data from IEDs to control and automation
capabilities within the substation, and control commands from remote users to
control power –system devices. It can provide many positive impacts on the power
system. For example, it can increase power quality and reduce outage response.
However, the legacy communication protocols use in the substation automation only
had limited bandwidth due to the serial link technology. For example, there are
hundreds and thousands of devices making up a traditional substation using hard–
wired device-to-device connections and which run at relatively low-speed serial
connections over copper wiring. However, the IEDs in a modern IEC 61820-based
substation connected to a high-speed Ethernet switch can make it relatively easy to
implement with comprehensive management, maintenance and control strategy via a
centralised power SCADA system.
Here are the main advantages to retrofit an existing substation, or build a new
substation using the IEC 61850 technology:
Interoperability. The major advantage of IEC 61850 is in providing the
interoperability between multi-vendors. Interoperability allows the system integrators
to select the IEDs or other products from different vendors. However, each
protection bay of a conventional substation is usually required to have all products
that are provided from the same supplier. This is due to the high-cost protocols
exchange issues between different suppliers. Also, interoperability can also eliminate

CHAPTER 2 LITERATURE REVIEW
_____________________________________________________________________________________________________________________
Page | 33
procurement ambiguity. The IEC 61850 specifies a Substation Configuration
Language (SCL) to describe the configuration of the power system. SCL can
precisely define user requirement for substation and devices. Therefore, the user can
specify unambiguously what is expected provided in each device that is not subject
to misinterpretation by the suppliers.
Simplified and reliable Architecture. Hundreds of thousands of IEDs will be used
in a modern substation (depends on the size of the substation) to control and protect
the power system network. According to IEC 61850, all the IEDs are connected with
the Ethernet switches and managed with high reliability and redundant network
architectures. Different architecture designs have been introduced in detail in section
2.2. Furthermore, IEC 61850 enables devices to quickly exchange data and status
using GOOSE and SVs messages between the relays through Ethernet. This
significantly reduces the copper wirings costs replaced by the higher bandwidth fibre
optic cables.
Reduced installation and commissioning cost. IEC 61850-based substation has
some benefits such as lower installation and commissioning cost. For example, the
cost to configure and commission devices have been drastically reduced because IEC
61850 devices do not require as much manual configuration as legacy devices. Client
applications no longer need to be accessed because they can retrieve the points list
directly from the device or import via an SCL file. Moreover, many applications
require nothing more than setting up a network address to establish communications.
Therefore, IEC 61850 device can significantly reduce the installation/commissioning
time and cost.
Future-Proof Design. One of the major advantages of implementing IEC 61850 is
that it is easy to expand when the power system network is required. Also, because of
the interoperability that IEC 61850 has provided, any new products that connect to
the existing IEC 61850-based substation automation system can be fully compatible.
This is due to the IEC 61850 devices not required to be configured to expose data.
The new extensions can easily add to the substation without having reconfigured
devices to expose data that was previously not accessed. Therefore, the plug & play

CHAPTER 2 LITERATURE REVIEW
_____________________________________________________________________________________________________________________
Page | 34
function allows the IEC 61850-based system to have a minimal impact on the
existing system and equipment when introducing new products.
2.4 Implementations of IEC 61850
The implementation and the testing of IEC 61850 standard projects at the substation
and test facilities are all around the world. Remarkable research and development
activities are ongoing in both industry and academia. References [41] and [42] have
presented smart girds for future power delivery, and more importantly, they have
clarified that the substation automation is one of the key elements to achieve the
Smart Grid.
Many types of research have discussed the implementation issues with IEC 61850-
based substation automation systems. Research [43] has clarified the major issues
related to practical implementation and discusses the challenges for implementing
the new communication architecture. For the communication network, the Ethernet
topology and network performance requirements should be according to the size of
the substation functions. For example, one of the issues of the process bus and
station bus network is that performance evaluation of station bus for time critical
messages is not clear as yet.
Reference [44] discuss is specific issues related to the communication network of
SAS. For example, in this reference, the researchers have described the SAS
architectural issues as well as the time synchronisation issues. It clarifies that
building tightly coupled architecture out of several IEDs from multi-vendors will
bring extra risk and complexity to the SAS architecture. Furthermore, IEC 61850-3
reliability requirements define that there should be no single point of failure that will
cause the substation to be inoperable. However, the IEC 61850 does not demand
redundancy even for critical applications, and this is been left to the substation
design engineer. In reference [45], the researchers have investigated functionality
issues related to IEC 61850 based SAS. It mentioned one of the functional issues is

CHAPTER 2 LITERATURE REVIEW
_____________________________________________________________________________________________________________________
Page | 35
that coordination of all distributed SAS functions of a single protection zone needs to
be allocated and tested.
The world’s first IEC 61850-based substation was installed by Siemens in 2004 [46]
and after that many digital substation implementation projects have been carried out,
such as [47-49]. For instance, [50] has reported that the refurbishment of a 380kV
Laufenbury substation was successfully carried out in Switzerland. The stepwise
(bay to bay) approach was used to retrofit many bays within the substation.
Research [51] has mentioned the Azogues Electric Utility solved the challenges of
interoperability using protective and control devices from different manufacturers in
the Azogues 2 substation. The IEC 61850 standard was applied in most of the
devices. However, traditional protocols such as DNP3 and Modbus was used as well.
Their multi-vendor system using IEC 61850 is supplied by GE, ABB, ALSTOM and
SUBNET. The research summarised the benefits and pitfalls for using the IEC 61850
system. It has mentioned some pitfalls that they have faced in the current state, such
as complexity in the integration of IEDs equipment between different hardware and
software manufactures; increased interaction between protection, automation and
communication systems which needs more care in details so as not to affect other
areas during the integration. This also shows the leads of qualified technicians and
skills from many engineering areas; extra time and additional costs associated with
the system integration, etc.
Furthermore, J.Holbach [52] has reported the first multi-vendor project with IEC
61850 standard in the U.S. They demonstrate the practical use of the GOOSE
interoperability between multi-vendor IEDs. Additionally, [53] has introduced and
discussed the interoperability for both site and laboratory environments, and
interoperability test is performed to demonstrate the interoperability between multi-
vendors.
Research [54] described the first successful implementation of the IEC 61850 using
multivendor IEDs for transmission line protection scheme in Mexico. It provides the
suggestions for different stages of the project, which included the design,

CHAPTER 2 LITERATURE REVIEW
_____________________________________________________________________________________________________________________
Page | 36
communication interface test and functional test. Reference [55] describes an
evaluation retrofit project for an American Electric Power substation in Ohio, USA.
The project was based on the GE Hard Fiber process bus solution.
In the UK, the ‘piggy-back’ trials [56] has been installed and commissioned at
National Grid substations. This piggy-back trial contains a trial system parallel with
an existing protection and control system. But, the controls and trips of the trail
system are however disabled. For example, in the Alstom trial, the Non-
Conventional Instrument Transformer (NCIT) was installed in one substation, and a
conventional instrument transformer was installed in the other remote substation. The
metering and Feeder protection were connected to the NCITs using IEC 61850-2-9-2
LE.
In China, the commissioning of the full-scale process bus based substations have
been introduced in [57], and more digital substation projects are under construction.
However, there is a need to analyse the performance of the time-critical messages
and the reliability of the SAS communication architectures to gain a successful
implementation of the IEC 61850 technologies. Research [58] describes the
installation in China of a smart 110/10kV Air Insulated Substation (AIS) which
includes the process bus implementation together with synchronisation based on
IEEE 1588 time synchronisation. Research [59] presents the dynamic environment
monitoring method of power communication room based on IEC 61850 protocol.
The research uses the IEC 61850 protocol to improve the efficiency of operation and
maintenance of the power system. It has a centralised management structure which
collects the information from the substation site — this includes the information
from power equipment, environmental monitoring, fire protection system and
security system.
Reference [60] presents the AAB’s proposed refurbishment of a substation first
commissioned in Queensland, Australia, which includes the world’s first commercial
implementation of IEC 61850-9-2 LE in 1999. ABB has made a specific type of
NCIT which is not able to be used with other transformers and CT/VTs.

CHAPTER 2 LITERATURE REVIEW
_____________________________________________________________________________________________________________________
Page | 37
2.5 Performance evaluation methods for IEC 61850-based
substation automation system
The success of IEC 61850-based SAS highly relies on the communication system
because all the data that requires for the protection, control and monitoring functional
elements within substations has to be transmitted in the communication network. For
example, the IEC 61850 standard has defined the Generic Object-Oriented System
Event (GOOSE) and Sampled Values (SVs) message that are used for the fast
transmission of the time-critical information, such as the tripping signal, status
changes and interlocking between IEDs. If the GOOSE or SV messages have losses
or delays, it can cause the failure of the protection scheme and lead to the serious
damage of the power equipment [61-63]. Therefore, when designing the IEC 61850
based substation, it is critical to guarantee the end-to-end (ETE) latency of the time-
critical messages to meet the requirements which define in the IEC 61850-5.
Significant work has been reported in the literature to the performance evaluation of
the time-critical messages in IEC 61850-based substations. These studies can be
found in three main approaches: analytical studies, experimental studies, and
simulation approach based on network simulation tools.
2.5.1 Analytical methods
Network Calculus is one of the analytical techniques, and it is usually used to predict
network behaviour under variable traffic loads. Researchers have presented work on
using analytical methods [64] and calculus theory [65] to analyse the traffic flow in
the IEC 61850-based substation communication network. Ting Yang et al. [66]
presents a method to modelling and analysing the Substation Communication
Network (SCN) data traffic from the data generating, transmission and
retransmission.
These researchers have to use the self-similarity network traffic to evaluate the
message delay and traffic load under different network conditions. This kind of
traffic uses the auto-regressive and wavelet traffic models to predict network

CHAPTER 2 LITERATURE REVIEW
_____________________________________________________________________________________________________________________
Page | 38
behaviour, and it usually depends on the human activities which are known as
stochastic and non-coordinated network traffic. However, the analytical method does
not consider behaviour protocols and applications. For example, in a digital
substation based on IEC 61850, the behaviour of SV traffic is nearly constant, and
GOOSE Trip messages are more like to burst, and none of this traffic is effect by
human actions.
2.5.2 Experimental methods
Real-Time Digital Simulator (RTDS) has been used to simulate the power system in
real-time. Power system models are designed, compiled and simulated on the RTDS
hardware, and it can simulate the faults with various location and impedance in the
real-time for the protection relay response. Moreover, the implementation of GTNET
cards allows the RTDS to send and receive GOOSE and SV messages over the
Ethernet [67]. Therefore, it is possible to examing the latencies of GOOSE and SV
messages for different protection schemes under varied communication network
conditions. This is a significant improvement than the playback technology which
replays the pre-calculated faults [68].
D. Ingram [69] has presented the experimental method to evaluate the performance
of the process bus network considering various SVs traffic load conditions and the
study shows the adverse impact of the increasing SVs traffic on the network
performance. In reference [70], researchers present the experimental set-up which
combined the real IEDs and simulated IEDs to examine the IEC 61850-based SAS
architecture. Furthermore, the experimental approach normally can have a limited
number of process bus and station bus networks, since the realistic experimental
setup of a large SAS communication network can be very expensive in a laboratory
environment. Thus, a simulation environment can provide a more effective solution
which allows the large network to be simulated.

CHAPTER 2 LITERATURE REVIEW
_____________________________________________________________________________________________________________________
Page | 39
2.5.3 Network simulation methods
Many researchers have presented work using discrete-event based network
simulators, such as OMNeT++ [71, 72] and OPNET [19, 34, 73-77], to evaluate the
dynamic performance of the SCN architecture.
T.Skeie et al. [19] are the first to demonstrate that the switched-Ethernet based SAS
network can sufficiently perform the real-time demands of protection functions using
OPNET. M.G. Kanabar et al. [73] has presented that the performance of process bus
can be influenced by various network parameters such as sampling frequency, buffer
sizes, packet services rate etc. T. Sidhu et al. [74] introduced the details of designing
the IEC 61850 IED models in OPNET and analysed the dynamic performance of
SCN architectures. P. Kumar et al. [78] presented detail modelling of the IEC 61850
IEDs and examined the performance of various topologies and architectures.
M.S.Thomas and I.Ali. [79] shows the constructed substation communication
network model based on the OPNET modeller to evaluate the performance of the
SAS architecture. Moreover, S.Kumar et al. [80] study the performance of a PRP and
HSR seamless communication redundancies in a SAS network based on IEC 62439-
3.
Furthermore, some researchers presented the used of traffic control technologies to
improve the dynamic performance of SCN, such as multicast filtering, Virtual Local
Area Network (VLAN) and priority queuing method [81]. However, the problem of
the simulation method is the accuracy of the simulation results is dependent on the
degree of matching between the models and their actual behaviour in real-life cases
or in practice. To improve the efficiency of the simulation results, Z. Zhang et al. [82]
present the design of mathematical models to describe data flow in the substation and
assess the real-time performance using OPNET. The study classified all the messages
which transmit within the IEC 61850 based substation into three types, i.e. cyclic
data, stochastic data and burst data.

CHAPTER 2 LITERATURE REVIEW
_____________________________________________________________________________________________________________________
Page | 40
2.6 Data flow modelling and control
2.6.1 Dataflow analysis of substation automation system network
Based on IEC 61850 part 7-1 “Basic communication structure for substation and
feeder equipment – principle and model” [83], a suggested substation automation
topology with an additional data flow requirements have been shown in Figure 2-1.
The communications between IEDs and devices are used to support the following
substation automation functions (numbers in bracket refers to the figure):
(1) Sampled value exchange for CTs and VTs
(2) Fast exchange of I/O data for protection and control
(3) Control and trip signals
(4) Engineering and configuration
(5) Monitoring and supervision
(6) Control-centre communication
This SAS network has separated the station bus and process bus network. Each bay
has its process bus. Process buses are isolated from each other using filter switches.
For process bus, data exchange is denoted with Number 1 and 2 in Figure 2-1. The
output of CTs and VTs has been sampled and formated into the SV messages, and
then sent to the corresponding protection and control IEDs (P&C IEDs). The tripping
signals are sending P&C IEDs in GOOSE message to trip the circuit breaker.
Station bus consists of all the bays and connects with the P&C IEDs within each bay.
Fast exchange of I/O data between the bays for protection and control, such as
interlocking is denoted with Number 2. Human Machine Interface (HMI) and
engineering PC receive monitoring and supervision information from each bay
denoted by Number 5 in Figure 2-1. The data exchange between the substation and

CHAPTER 2 LITERATURE REVIEW
_____________________________________________________________________________________________________________________
Page | 41
remote-control centre is indicated by Numbers 3 and 6, to update local information
and receivie control signals through the gateway device.
Figure 2-1 A Simple Design of Substation Automation System with Data Flow
Requirements
The communication network performance of Station bus network depends on the
behaviour of the MMS traffic and GOOSE traffic. In the normal condition, GOOSE
traffic is relatively small to affect network performance. When the fault event occurs,
the burst GOOSE traffic needs to be considered. The MMS traffic transmits real-time
data between HMI and IEDs. The size of each MMS message is small. For instance,
an MMS request message is about 60 bytes, and one response MMS message is
about 250 bytes. However, the number of MMS messages in the station bus can be
huge because HMI needs to communicate with all IEDs within the substation (large
substation may contain hundreds of IEDs). Therefore, the MMS traffic needs to be
controlled appropriately to maintain the station bus performance.

CHAPTER 2 LITERATURE REVIEW
_____________________________________________________________________________________________________________________
Page | 42
2.6.2 Data flow modelling
2.6.2.1 Stochastic data modelling
The stochastic data are typical event-driven data, which means that they are triggered
by accidents or unplanned events, such as the trip message when a short-circuit fault
occurs and the artificial modulation of equipment parameters. Stochastic data in
substations can be mainly divided into two types. Type 1 includes the transformer
tap modulation, switch operation message, trip message, protection function
interlocking, time synchronisation, etc. Type 2 contains protection setting
modification, event log checking, data transmission, etc. The Type 2 message usually
has a large size and can cause a sudden increase in network flow. But the real-time
requirement of transmission has not been strictly specified.
Normally, stochastic data have the following characteristics of time sequence:
1. The packet has been generated in a random period with the probability of P.
2. The size of the packet can be fixed or time variant.
3. There is no correlation between two packets arriving one after the other,
which means that the number of packets in two mutually exclusive periods is
independent.
Therefore, the arrival of stochastic data can be modelled by the Poisson process[82].
2.6.2.2 Burst data modelling
During a random time, burst data are not only generated with the probability but also
dependent on the previously occurred events. Burst data mainly contain information
about protection actions and the changing status of breakers. When a fault occurs, the
protection device acts, and then, the transmission of GOOSE message is changed
from cyclic mode to burst mode. And this will cause the consequently generated
burst data flow.

CHAPTER 2 LITERATURE REVIEW
_____________________________________________________________________________________________________________________
Page | 43
Generally, burst data will cause a large data amount on the network in relatively
concentrated transmission time. The arrival of burst data packets has a characteristic
of time after effect, which means that there appears a short period of data
transmission on the SAS network when the burst data are generated. The network is
free for a long period after the transmission of data packets. Therefore, this type of
data flow has the characteristics of long-range dependence and self-similarity, which
presents the same burstiness at different time scales [84, 85].
The burstiness, long-range dependence and self-similarity of Ethernet data flow has
been generally accepted by the researcher [86-88]. It has been proven that the heavy-
tailed distribution and the ON/OFF model can be used to describe the self-similarity
of network data flow [89-91]. In an ON/OFF mode and it is assumed that the data
source states repeatedly change between sending and not sending messages. When
the state is ON, data are generated with a constant rate, whereas none is generated
when the state is OFF [88]. Generally, consequent ON- and OFF- states are
independent and identically distributed. Therefore, it is applicable to describe the
characteristic of the ON/OFF model by setting the distribution of time duration for
both states.
In the research [76], the researcher supposed that the time duration of ON-state for a
single data source obeys the Pareto distribution, which is a typical heave-tailed
distribution. The cumulative distribution function of Pareto distribution[82] can be
described by:
𝐹(𝑡) = 𝑃(𝑇 ≤ 𝑡) = 1 − (
𝑘
𝑡)
𝛼
, 0 < k ≤ t, α > 0 (1)
Where k is the minimum possible value of T, which represents the minimum
duration of ON-state; α is a positive parameter.
The Pareto distribution is characterised by a scale parameter k and a shape parameter
α known as the tail index [92].

CHAPTER 2 LITERATURE REVIEW
_____________________________________________________________________________________________________________________
Page | 44
2.7 Rate control for MMS messages
SCADA system data is transmitted between IEDs and HMI via the IEC 61850 MMS
protocol within the station bus network. The MMS traffic generated by IEDs consists
of a polling part from the SCADA and an event-driven part that depend on reports
the MMS servers send to the MMS clients. Measurements are commonly sent
cyclically via integrity Reports with an interval of time. For instance, the HMI polls
for metering values at every 3 or 4 seconds from an IED. However, the frequency of
IED report publications will affect MMS traffic. Accelerating the update rate of
MMS reports will increase the MMS traffic which will cost more bandwidth and will
impact on the network performance. Meanwhile, inappropriate update rate may not
be able to satisfy the SCADA system requirements. Therefore, the server of the
SCADA system requires achieving a proper update rate to the client application.
2.8 Data management of Ethernet-based networks
According to the Simple substation automation architecture in Figure 2-1, both
station bus and process bus will use Ethernet-based networks as the communications
path for data messages exchanged between devices. Ethernet-based networks are
managed networks, managed to provide both reliability and performance. Reliability
can roughly be defined as the requirements that messages will always successfully
pass between devices connected to the network. Performance can roughly be
described as the requirement that the network introduces no unreasonable time delays
while passing messages. Reliability and performance are balanced together in
network design. It is important to remember that network reliability and performance
is about passing messages across the network, not what is in the actual messages.
Reliability is a core function of network design and based on network reliability
protocols, such as RSTP, PRP, and HSR. The goal of these reliability protocols is
always to provide a path for messages to flow through the network, even on the
failure of specific physical network elements.

CHAPTER 2 LITERATURE REVIEW
_____________________________________________________________________________________________________________________
Page | 45
Performance is also a core function of network design, and at heart, is managing the
available bandwidth on the network such that each message passes through the
network within an appropriate amount of time. Messages may have differing
priorities, requiring transmission within differing time constraints. In a fully digital
substation, GSE and SV messages are sent over the network using Ethernet multicast
data frames. These multicast frames act similar to broadcast traffic and are flooded
out all Ethernet switch ports unless VLANs or multicast filtering is used to manage
the bandwidth.
The most common way to manage bandwidth on a network is to use VLANs.
Network ports are configured only to pass messages assigned to specific VLANs
associated with the port. Messages are assigned to operate across specific VLANs,
with a particular priority. In this way, particular messages are limited to specific parts
of the network, reducing the bandwidth utilisation for the entire network.
A second way to manage bandwidth is to use MAC address filtering. MAC address
filtering is intended more for security than performance, though MAC address
filtering can be used to do both. Ports on an Ethernet switch can be configured to
accept only messages with a specific destination or source MAC addresses. All other
messages will be blocked. The general goal with MAC address filtering is to keep
unknown, and or un-authorised, traffic from being introduced on the network.
However, this technique can also be used to manage bandwidth by restricting traffic
from specific parts of the network.
The fully digital substation will obviously take advantage of Ethernet networks. The
complicating factor of the fully digital substation for testing considerations is that of
managing data versus data sets versus data messages. The example illustrates some
of these considerations. There can be multiple networks in the substation, such as a
process bus network and a station bus network, with data flowing across both
networks for different needs. Data will be outputs of specific Logical Nodes (LN)
and inputs to specific Logical Nodes. A physical device, or a Logical Device (LD),
may combine the data outputs of multiple Logical Nodes into one data set and one
data message, or more place the output of one Logical Node into numerous data sets

CHAPTER 2 LITERATURE REVIEW
_____________________________________________________________________________________________________________________
Page | 46
and data messages, and one Logical Node may accept inputs from various messages
and multiple different datasets.
Testing at its most basic is the creation of simulated or controlled inputs to a function
or device to verify the operation, and output matches performance expectations.
When testing a fully digital substation, it is necessary to create simulated or
controlled data as inputs to specific Logical Nodes or Logical Devices to verify
performance. For this simulated data for testing to pass through the network, it is
necessary for this simulated data to be placed in a data message the network will
accept and transmit successfully. This requires that testing, and test devices, create
test messages that will appear as normal data messages to the network.
The most fundamental consideration in terms of data flows, and testing is that test
messages, especially if test devices create these messages, will successfully pass
through the network to the end Logical Nodes and Logical Devices that must
consume the test data in these messages. Therefore, the test message must duplicate
the entire normal message, including the VLANs and priority levels. If MAC address
filtering has used, tests messages may need to duplicate source and destination MAC
addresses in some cases, or switch ports may need to be configured to accept tests
messages with specific source and destination MAC addresses. So, it is not enough to
create test data that is the output of a Logical Node, and it is necessary to create an
entire test message.
2.9 Considerations for VLANs and MAC address filtering
Testing a fully digital substation requires a test device that creates test data and the
resulting data messages. There can also be the need for a test device that accepts and
records messages published by actual devices. For either type of test device, the
messages containing test data or test states must pass through the network between
the test device and the actual operating devices. Network data management, therefore,

CHAPTER 2 LITERATURE REVIEW
_____________________________________________________________________________________________________________________
Page | 47
influences where the test device can connect to the network in both a physical and
virtual sense.
2.9.1 VLANs
The most common method for data management is to use VLANs. GOOSE messages
and SV messages will be configured to specific VLANs, and therefore be limited to
portions of the network.
A switch port on one of the switches that will be connected to the specific VLAN is
left unconnected as a physical access port to the test device. (Note that cybersecurity
practices may require the enabling and disabling of this port as devices are physically
connected and disconnected.) This switch port is configured to be part of the same
specific VLAN as the operating devices under test. This method works if the test
device is either publishing test messages or subscribing to test messages. This
method requires that the network design is fully provisioned for the connection of
test devices to be able to perform all required test scenarios.
Passing VLAN data between individual Ethernet switches require the use of trunk
ports between these switches. Trunk ports pass all data from active VLANs on the
switch, unless specific VLANs have been excluded by configuration. It is, therefore,
possible to connect a test device to a third switch, assign test data to the appropriate
VLAN, and use port trunking to transmit the data. This requires careful network
design. The Institute of Electrical and Electronic Engineers (IEEE) 802.1Q Standard
defines the use of GVRP (GARP VLAN Registration Protocol) or MVRP (Multiple
VLAN Registration Protocol) through the IEEE 802.1ak amendment to dynamically
expand VLANs through trunk ports. Connecting a GARP or MVRP test device
publishing or subscribing to data on a specific VLAN will dynamically expand the
VLAN across the network. Since either of these methods expands the VLAN across
a larger portion of the network, multicast messages will flow across larger portions
of the network. This increased bandwidth utilisation during testing must be provided
for during the network design. For a test device which publishes the text messages,

CHAPTER 2 LITERATURE REVIEW
_____________________________________________________________________________________________________________________
Page | 48
there will probably not be a significant impact. For a test device subscribing to
messages, this may expand all VLANs across the network to the test device, thereby
reducing the effectiveness of VLANs.
2.9.2 MAC address filtering
MAC address filtering, if it is in use on the network, introduces similar challenges to
the location of the test device. The test device must create messages with MAC
addresses that will pass through the required network switch ports. Alternatively,
network ports must be configured to pass messages to MAC addresses created by the
test device.
2.9.3 Network bandwidth considerations
Data flow management techniques, as well as the network topology, must be
considered when determining Ethernet network bandwidth requirements. Devices
connected to an HSR network must be capable of handling every message passed
around the ring. HSR also reduces in a networks effective bandwidth in half since all
frames are sent twice over the same network. Devices connected to a PRP network
(either as a SAN or DANP) only require sufficient bandwidth to handle traffic for the
specific device. However, the Ethernet switches must have the capacity to pass all
traffic on the switch and trunk ports.
2.10 Summary
The performance evaluation of the IEC 61850-based substations researches can be
found in three main approaches: analytical studies, experimental studies, and
simulation approach based on network simulation tools. The analytical method is
usually used to predict network behaviour under variable traffic loads. However, this
method generates traffic based on auto-regressive and wavelet models which are
more likely to be affected by human activities. So, the analytical approach does not
consider behaviour protocols and applications. Several groups have used Real-time

CHAPTER 2 LITERATURE REVIEW
_____________________________________________________________________________________________________________________
Page | 49
simulations testing of protection relays, but no benchmarks have been provided that
validate the results obtained from the RTDS.
Substation communication network performance has previously been modelled using
event-based simulation, but the models need to reflect the protocols that define in
IEC 61850-9-2 LE. For example, many reported studies have used network traffic
from old standards which frame sizes and sampling rates used in the models are
incorrect. This chapter examines the foundations of the substation communication
network and real-time networks where the area has some unresolved questions
regarding performance. A few studies and IEC 61850-90-4 have suggested that the
confirmation of network configuration and guideline resented needs to be considered
more carefully.

CHAPTER 3 FUNDAMENTALS
_____________________________________________________________________________________________________________________
_
Page | 50
CHAPTER 3 FUNDAMENTALS
3.1 Introduction
This chapter provides an overview of the IEC 61850 standard. It introduces the
fundamentals of the IEC 61850 standard technologies. The structure, feature and
functions of the IEC 61850 standards have introduced in detail. Also, the
communication protocol of IEC 61850 has been described as well as the message
types.
3.2 IEC 61850 standards
The IEC Smart Grid standardisation “roadmap” defines that IEC 61850 is the
framework of substation automation of substation automation and protection for the
transmission Smart-Grid. Electric Power Institute (ERPI) and the Institute of
Electrical and Electronic Engineers (IEEE) were working to define Utility
Communications Architecture (UCA) in 1990. The effort focused on inter-control
communications architecture and communication between substations and control
centres[93]. The next phase of the UCA started in 1994, which focuses on station
bus[94]. In 2003, IEC Technical Committee - 57 had published IEC 61850 standard
titled “Communication Networks and Systems in Substation” [95]. The standard has
combined the former standards such like IEC 61870-5-103 [96], DNP 3.0[97],
MODBUS [98].
IEC 61850 standards consist of the following ten major parts:
Part 1: Introduction and overview
Part 2: Glossary
Part 3: General requirements
Part 4: System and project management

CHAPTER 3 FUNDAMENTALS
_____________________________________________________________________________________________________________________
_
Page | 51
Part 5: Communication requirements for functions and device models
Part 6: Configuration description language for communication in electrical
substations related to IEDs
Part 7-1: Basic communication structure for substation and feeder equipment –
Principles and models
Part 7-2: Basic communication structure for substation and feeder equipment –
Abstract communication service interface (ACSI)
Part 7-3: Basic communication structure for substation and feeder equipment –
Common data classes
Part 7-4: Basic communication structure for substation and feeder equipment –
Compatible logical node classes and data classes
Part 8-1: Specific communication service mapping (SCSM) – Sampled values over
serial unidirectional multidrop point to point link
Part 9-1: Specific communication service mapping (SCSM) – Sampled values over
ISO/IEC 8802-3
Part 10: Conformance testing
The objective of IEC 61850 is to provide a communication standard that meets
existing needs of power utility automation while supporting future developments as
technology improves. Additionally, IEC 61850 standards provide the interoperability
between applications, vendors and manufacturers. IEC 61850 brings open,
interoperable systems, and flexible architecture.
3.3 Hierarchy function and interfaces of IEC 61850
IEC 61850 provides the hierarchical structure of the substation automation system
with three levels, shown in Figure 3-1, known as process level, bay level, and station

CHAPTER 3 FUNDAMENTALS
_____________________________________________________________________________________________________________________
_
Page | 52
level. The station bus is between the station and bay level. Process level consists of
the primary equipment in the switchyard, such as CT/VT and circuit breakers, etc. It
provides instantaneous status, signals from instrument transformers, and control data
exchanges between bay level and process level. Functions or services are
communicated to the bay level via the logical interface 4 and 5.
Bay level includes protection and controls IEDs for each bay. It provides protection
data and control data exchange between the bays, process level, and station level.
Functions communicate in-between bay level via logical interface 3 and
communicate with station level using logical interface between 1 and 6. Logical
interface eight is using for communication between each bay.
Station level provides functions related to the overall operation of the equipment in
the substation. The functions are using data from different bays, so the data exchange
between station level and bay level.
Figure 3-1 Hierarchy structure and interface model of a substation automation system
[95]

CHAPTER 3 FUNDAMENTALS
_____________________________________________________________________________________________________________________
_
Page | 53
Station Bus is the communication channel between station level and bay level which
provides the data exchange for different bays and between local controls.
Process Bus is the communication channel between process level and bay level that
data from CT/VT can transmit to P&C IEDs, and P&C IEDs can send GOOSE
messages to control the circuit breaker.
3.4 Functions and logical nodes
The objective of IEC 61850 standard is to provide interoperability between multi-
vendor IEDs in Substation Automation System (SAS). To achieve interoperability
between the IEDs supplied from different manufacturers, IEC 61850 standard has
used three methods:
Functional decomposition – used to understand the logical relationship
between components of a distributed function. It is presented in terms of
logical nodes to describe the functions, sub-functions and functional
interfaces.
Data flow – used to understand the communication interfaces that support the
information exchange between distributed functional components and
functional performance requirements.
Information modelling – used to define the abstract syntax and semantics of
the information exchanged. It is presented in terms of data object classes,
attributes, etc.
IEC 61850 has used the object-oriented method to define the hierarchical data model
for the communication network and physical object of the substation. This includes
the primary equipment, secondary equipment, measure, control and protection
functions.
IEC 61850 application functions have been decomposed into small entities (called
logical nodes). Logical node (LN) is a named grouping of data and associated
services that virtually represent the power system functions. An LN is composed of

CHAPTER 3 FUNDAMENTALS
_____________________________________________________________________________________________________________________
_
Page | 54
data objects and data attributes which contain the status information, settings, etc.
that are related to the real applications. Several logical nodes can build up LD models
which provide the properties and allocation of functions in a physical device model.
The physical device is the hardware and operating system that connects to the
network through its network address. Figure 3-2 illustrates the principle of IEC
61850 data modelling. The relationship between data attribute, data objects, logical
node, logical device, and the physical device can show as below.
All known functions of a substation automation system have been identified and split
into LNs. As Figure 3-2 shows, the physical device is called IEDx which contain a
logical device called LDx. The LDx is composed of two logical nodes called XCBR1
and MMXU1. The logical node XCBR represents a specific circuit breaker of the
bay.
Each logical node is composed of some data objects, and each element of data has a
unique name. For instance, in XCBR1, the data object is called Pos which means the
position of the circuit breaker. In the Pos function, there are three data attributes
called StVal, q, and t. Staal is the status value that represents the position of the
circuit breaker (close or open), q means the quality of the data, and the t is the
operating time of the function. Appendix A shows the details of the data objects and
data attributes of the XCBR LN.
Figure 3-2 Relationship between IEC 61850 Data Models [83]

CHAPTER 3 FUNDAMENTALS
_____________________________________________________________________________________________________________________
_
Page | 55
3.5 Abstract Communication Service Interface (ACSI)
IEC 61850 has defined the object-oriented data models, it also defines the abstract
services to access, and exchange data for power control, protection, and monitoring
within the substation automation system. The ACSI is “Abstract Communication
Service Interface” which is defined in the IEC 61850 standard Part 7-2 [99]. The
ACSI defines the common utility services for substation and feeder applications. It
operates above the OSI 7 Layer model and provides the abstract interfaces for
communication services.
The ACSI provides the specification of a basic model for substation-specific
information models and the specification of information exchange service models.
Figure 3-3 shows the concept class diagram of the ACSI.
Figure 3-3 A basic Class Model of the ACSI [83]

CHAPTER 3 FUNDAMENTALS
_____________________________________________________________________________________________________________________
_
Page | 56
The ACSI defines the information models using the domain-specific technique.
These information models provide services operating on data. Each of these
information models has been defined in a class, and a class contains attributes and
services. The complete list of ACSI services models can be found in Appendix B.
The ACSI objects models are listed as follow:
SERVER class
LOGICAL-DEVICE class
LOGICAL-NODE class
DATA class
DATA-SET class
Substitution
SETTING-GROUP-CONTROL-BLOCK class
REPORT-CONTROL-BLOCK class and LGO-CONTROL-BLOCK
CONTROL class
File transfer
etc.
IEC 61850 defines two groups of communication services, and these communication
services have been shown in Figure 3-4 and Figure 3-5. Figure 3-4 shows the client-
server model and Figure 3-5(2) shows the peer-to-peer model. In the client-server
communication model, a client requests services to get data from logical nodes of the
server and the server will generate reports to the client triggered by changes of
process data. In peer-to-peer communication, the model is able to communicate using
one to one mode and one to many mode. It is used for time-critical information
exchange between IEDs such as GOOSE services and SV services.

CHAPTER 3 FUNDAMENTALS
_____________________________________________________________________________________________________________________
_
Page | 57
Figure 3-4 Two Group of ACSI Service, (1) Client-Server Model[83]
Figure 3-5 Two Group of ACSI Service, (2) Peer-to-Peer Model[83]
The abstract objects and communication services are mapped to concrete application
protocols and communication profiles (for example, MMS). The abstract definitions
of data objects and services are allowing mapping to different communication stacks.
This means the IEC61850 based Substation Automation System can easily accept the
further development of network technology.

CHAPTER 3 FUNDAMENTALS
_____________________________________________________________________________________________________________________
_
Page | 58
3.6 Profiles and protocols stack
IEC 61850 uses OSI-7-layer stack for communication and the communication
requirements for substation have been specified by each profile shown in Figure 3-6
IEC 61850 has proposed three different types of communication stacks and seven
types of messages based on time requirements.
Figure 3-6 Overview of functionality and profiles [100]
IEC 61850 specifies the communication of time critical message such as GOOSE
(Type 1, 1A) and Sampled Values (Type 4), which directly mapped onto the data
link layer to avoid any overhead delays, mapping over link layer and physical layer
as publisher/subscriber. Other types (2, 3, 5, 6, and 7) of messages are non-time-
critical messages that have mapped over complete OSI-7-layer stack as a
client/server application. According to IEEE 802.1Q, priority tagging and Virtual
Local Area Network tagging has been defined in the link layer of the stack. Hence,
the time-critical data will have high priority than the other messages to meeting the
time requirements.

CHAPTER 3 FUNDAMENTALS
_____________________________________________________________________________________________________________________
_
Page | 59
3.7 Specific Communication Service Mapping (SCSM)
ACSI defines abstract objects and services that have to map to concrete
communication protocols. Therefore, IEC 61850 defines the Specific
Communication Service Mapping (SCSM). The SCSM is provided with the concrete
mapping of the ACSI services and objects onto a particular protocol stack or
communication profile. IEC 61850 specifics the syntax (format) and encoding
messages in the specific communication service mapping (SCSM). The detail of
specific communication service mappings has been given in IEC 61850-8-1, 9-1, and
9-2. IEC 61850-8-1 specifics the IEC 61850 services mapping to MMS and
provisions, such as Transmission Control Protocol over Internet Protocol (TCP/IP)
and Ethernet. Figure 3-7 presents the communication profile of GOOSE, SV, and
MMS.
Figure 3-7 Mapping ACSI to GOOSE, SV, and MMS to the Communication Profiles

CHAPTER 3 FUNDAMENTALS
_____________________________________________________________________________________________________________________
_
Page | 60
As Figure 3-7 shows, IEC 61850 specifics ACSI mapping to three types of the
message for different communication requirements of the substation automation
system. IEC 61850-8-1has defined the Generic Object Oriented Substation Event
(GOOSE), which is a mechanism for the fast transmission of substation events, such
as commands, alarms, and indications. GOOSE data is directly embedded into
Ethernet data packets to reduce the processing time and transmit through multicast
addressing of data packets. GOOSE message has retransmitted with varying and
increasing re-transmission intervals to have more reliability.
IEC 61850 defined the Sampled Value (SV) in 9-1 and 9-2. SV messages have used
to send instantaneous current and voltage samples to form CTs and VTs to IEDs.
Similar to GOOSE, SV message is a time-critical message that has directly mapped
to Ethernet.
IEC 61850-8-1 mapped the core ACSI services to the Manufacturing Message
Specification (MMS) protocol. MMS has been proving that it can support the
complex naming and services model of IEC 61850. Unlike GOOSE and SV message,
MMS message is a non-time-critical message, which supports the TCP/IP and OSI
communication profiles at the transport layer. The MMS is mapped to the application
layer and used the full service of the Open System Interconnection (OSI) model. This
ensures the reliable data transfer of MMS messages. The detail of mapping to MMS
will be described in the following section.
3.8 IEC 61850 message types
A digital process bus carries information from the primary plant to the SAS (such as
voltage and current samples, transformer temperature and circuit breaker status), and
from the SAS to the primary plant (tripping massage and closing commands to
circuit breaker) over the digital network. All likely protocols need to be considered
for the design of the communication network of the substation.

CHAPTER 3 FUNDAMENTALS
_____________________________________________________________________________________________________________________
_
Page | 61
3.8.1 GOOSE
Generic Object-Oriented Substation Event (GOOSE) message, is a control
mechanism where data (time critical information) has been grouped into dataset and
transfer between the P&C (protection and control) IEDs. GOOSE has defended in
IEC 61850-8-1, it is primarily used to transmit binary data such as indications,
alarms, and tripping signals, but can also be used to transmit transduced analogue
values such as measured values etc. AS IEC 6185-0-8-1 defines, GOOSE message
shall transmit through multicast addressing of data packets to implement the
publisher/subscriber transfer model, where layer two multicast technologies have
used.
The publisher writes the value in the local buffer at the sending side; the receivers
read the values from a local buffer at the receiving side [101]. Moreover, the specific
mapping services of the communication system are responsible for updating the local
buffers of the subscribers automatically. The new value received replaces the former
value, but if the old value could not process in time, there will be queuing in the
transmission.
GOOSE message communication consists of a fast event-driven transmission and a
slow cyclic transmission. Once the event occurred, an IED will send GOOSE
message immediately carrying the values of the variables. Since GOOSE messages
are multicast, to avoid the transient errors, same GOOSE message typically updates
several of times per second.
Figure 3-8 Transmission time for events[18]

CHAPTER 3 FUNDAMENTALS
_____________________________________________________________________________________________________________________
_
Page | 62
As the Figure 3-8 shows, during the non-event period T0, GOOSE message is
transmitted as “Heartbeat” rate 1/s which is the maximum retransmission delay (on
the event for a long time) in steady state. T0 indicates the retransmission delay in
steady state shortened by an event.
During the event period, GOOSE messages are sent immediately, and the interval
time between the next GOOSE messages is T1, which is the shortest retransmission
delay, followed by T2 and T3 which are increasing retransmission delay, and the
retransmission delay will settle down back to T0.
3.8.2 Sampled Values (SV)
IEC 61850-9-2 has defined the Sampled Values [102]. SV is currently used to send
instantaneous current and voltage samples from CTs and VTs to the SAS. For the
process bus, the CT/VT and Merging Unit (MU) is used to transmit sampled value
over process bus. However, instrument transformers do not have this capability (for
example, as the conventional CTs and VTs), then Merging Units have been
introduced. Merging Units are intended to bridge the gap between the analogue
signal world and the IEC 61850 process bus LAN.
IEC 61850-9-2 details how SV data shall be transmitted over Ethernet but does not
explicitly define what information should be transmitted, nor at which sampling rate.
An implementation guideline known as IEC 61850-9-2 Light Edition (LE) developed
in 2004. The guideline specifies the data sets that are transmitted, sampling rates,
time synchronisation requirements and physical interfaces.
The SV messages are transmitted purely cyclically at high frequency. As the 9-2 LE
defines, there are two distinct sampling rates:
• 80 samples per nominal system frequency cycle
• 256 samples per nominal system frequency cycle

CHAPTER 3 FUNDAMENTALS
_____________________________________________________________________________________________________________________
_
Page | 63
In the 50 Hz power system (UK), this translates to 4,000 Hz and 12,800Hz,
repectively. In terms of Ethernet network loading, these rates translate respectively to
5 Percent (5 Mbps) and 12.5 (12.5 Mbps) per-cent of the 100 Mbps Ethernet link
capacity.
3.8.3 IEC 61850 MMS
3.8.3.1 Client-Server communication
Client-server services indicate that predominantly information exchange is basd on
fault record, an event record, measurement values, etc. This kind of data size is
running from kilobits up to Megabits. IEC 61850-8-1 maps the abstract objects and
services to the Manufacturing Message Specification (MMS) protocols of ISO9506.
MMS has the proven implementation track record that can support the complex
naming and service models of IEC 61850. The control model of ACSI is mapped to
MS read and write services, where the other object models mapped to specific MMS
objects. MMS protocol mapping to the application layer which uses the full services
of the OSI model. This will ensure the reliable data transfer of MMS messages, and
there are non-time critical data.
3.8.3.2 Mapping ACSI to MMS
MMS is the “Manufacturing Message Specification” which is defined in ISO 9506.
MMS is used to transmit the real-time process data and supervisory control
information between network devices and computer applications. The specification
only describes the visible network aspects of communication which means it only
specifies the communication between a client and a server. This makes MMS fully
flexible for implementation. MMS defines a set of objects (such as read, write, event
signalling, etc.) and a set of messages exchanged between a client and server for
monitoring and control purpose. MMS also defined a Virtual Manufacturing Device
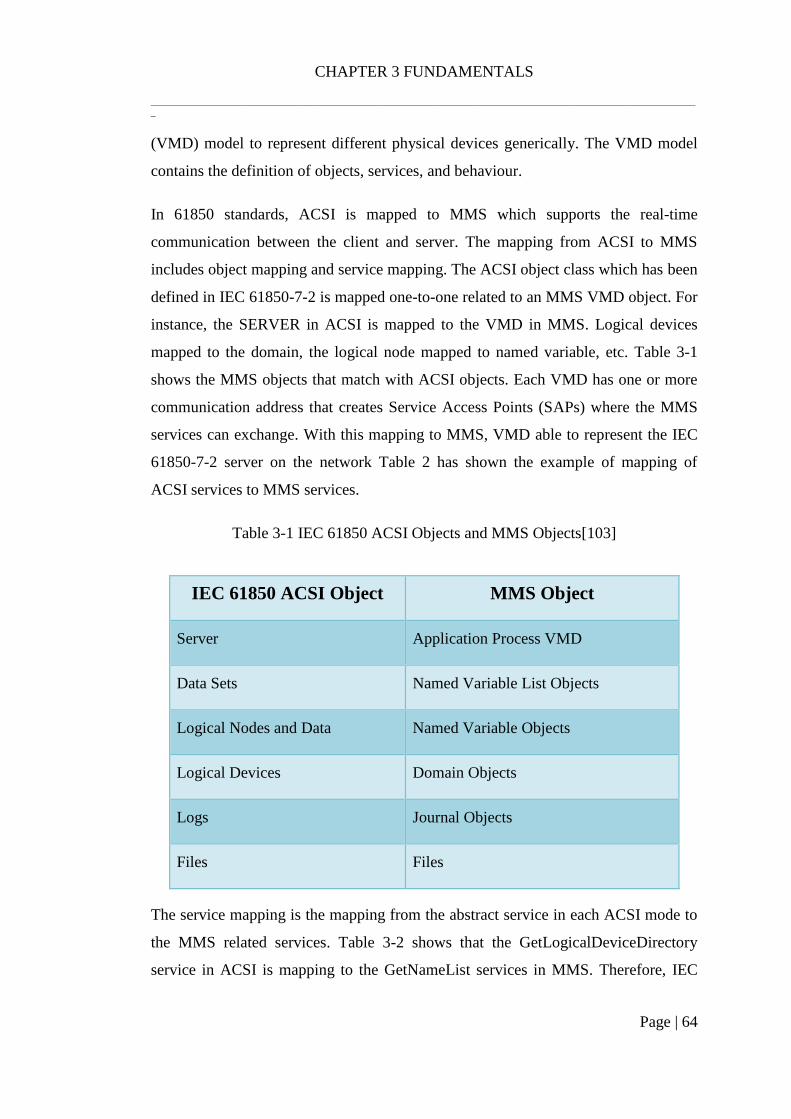
CHAPTER 3 FUNDAMENTALS
_____________________________________________________________________________________________________________________
_
Page | 64
(VMD) model to represent different physical devices generically. The VMD model
contains the definition of objects, services, and behaviour.
In 61850 standards, ACSI is mapped to MMS which supports the real-time
communication between the client and server. The mapping from ACSI to MMS
includes object mapping and service mapping. The ACSI object class which has been
defined in IEC 61850-7-2 is mapped one-to-one related to an MMS VMD object. For
instance, the SERVER in ACSI is mapped to the VMD in MMS. Logical devices
mapped to the domain, the logical node mapped to named variable, etc. Table 3-1
shows the MMS objects that match with ACSI objects. Each VMD has one or more
communication address that creates Service Access Points (SAPs) where the MMS
services can exchange. With this mapping to MMS, VMD able to represent the IEC
61850-7-2 server on the network Table 2 has shown the example of mapping of
ACSI services to MMS services.
Table 3-1 IEC 61850 ACSI Objects and MMS Objects[103]
IEC 61850 ACSI Object MMS Object
Server Application Process VMD
Data Sets Named Variable List Objects
Logical Nodes and Data Named Variable Objects
Logical Devices Domain Objects
Logs Journal Objects
Files Files
The service mapping is the mapping from the abstract service in each ACSI mode to
the MMS related services. Table 3-2 shows that the GetLogicalDeviceDirectory
service in ACSI is mapping to the GetNameList services in MMS. Therefore, IEC
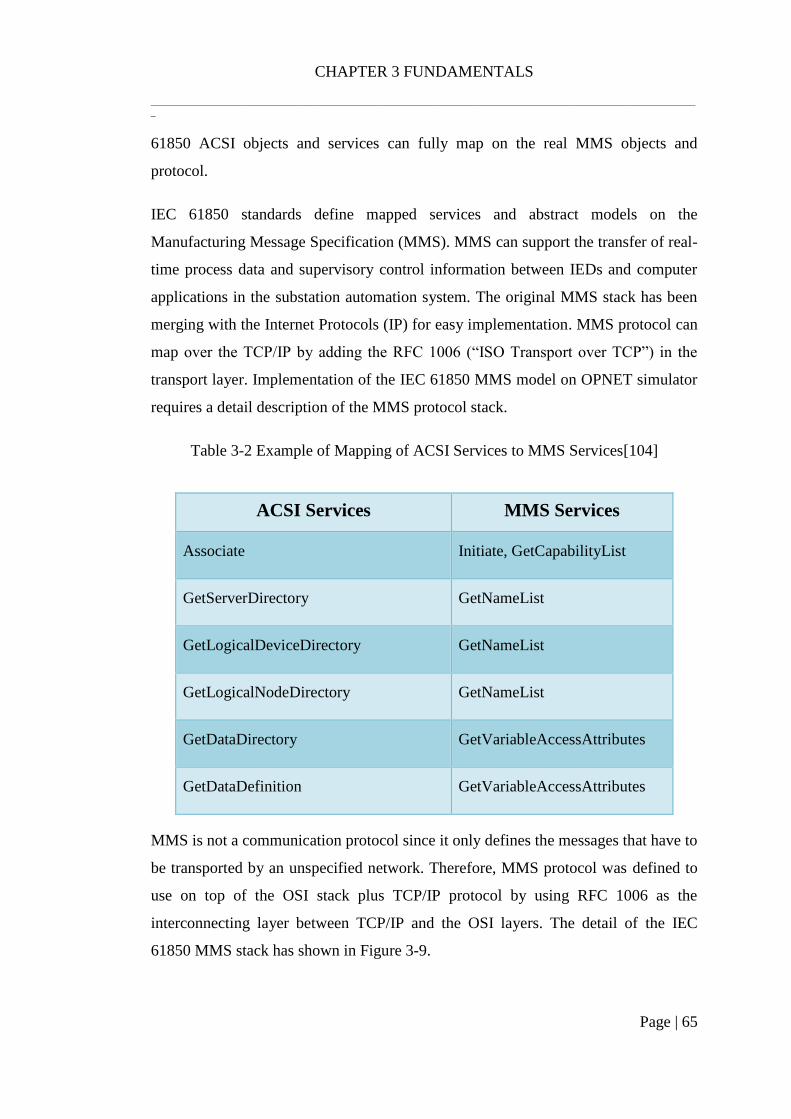
CHAPTER 3 FUNDAMENTALS
_____________________________________________________________________________________________________________________
_
Page | 65
61850 ACSI objects and services can fully map on the real MMS objects and
protocol.
IEC 61850 standards define mapped services and abstract models on the
Manufacturing Message Specification (MMS). MMS can support the transfer of real-
time process data and supervisory control information between IEDs and computer
applications in the substation automation system. The original MMS stack has been
merging with the Internet Protocols (IP) for easy implementation. MMS protocol can
map over the TCP/IP by adding the RFC 1006 (“ISO Transport over TCP”) in the
transport layer. Implementation of the IEC 61850 MMS model on OPNET simulator
requires a detail description of the MMS protocol stack.
Table 3-2 Example of Mapping of ACSI Services to MMS Services[104]
ACSI Services MMS Services
Associate Initiate, GetCapabilityList
GetServerDirectory GetNameList
GetLogicalDeviceDirectory GetNameList
GetLogicalNodeDirectory GetNameList
GetDataDirectory GetVariableAccessAttributes
GetDataDefinition GetVariableAccessAttributes
MMS is not a communication protocol since it only defines the messages that have to
be transported by an unspecified network. Therefore, MMS protocol was defined to
use on top of the OSI stack plus TCP/IP protocol by using RFC 1006 as the
interconnecting layer between TCP/IP and the OSI layers. The detail of the IEC
61850 MMS stack has shown in Figure 3-9.
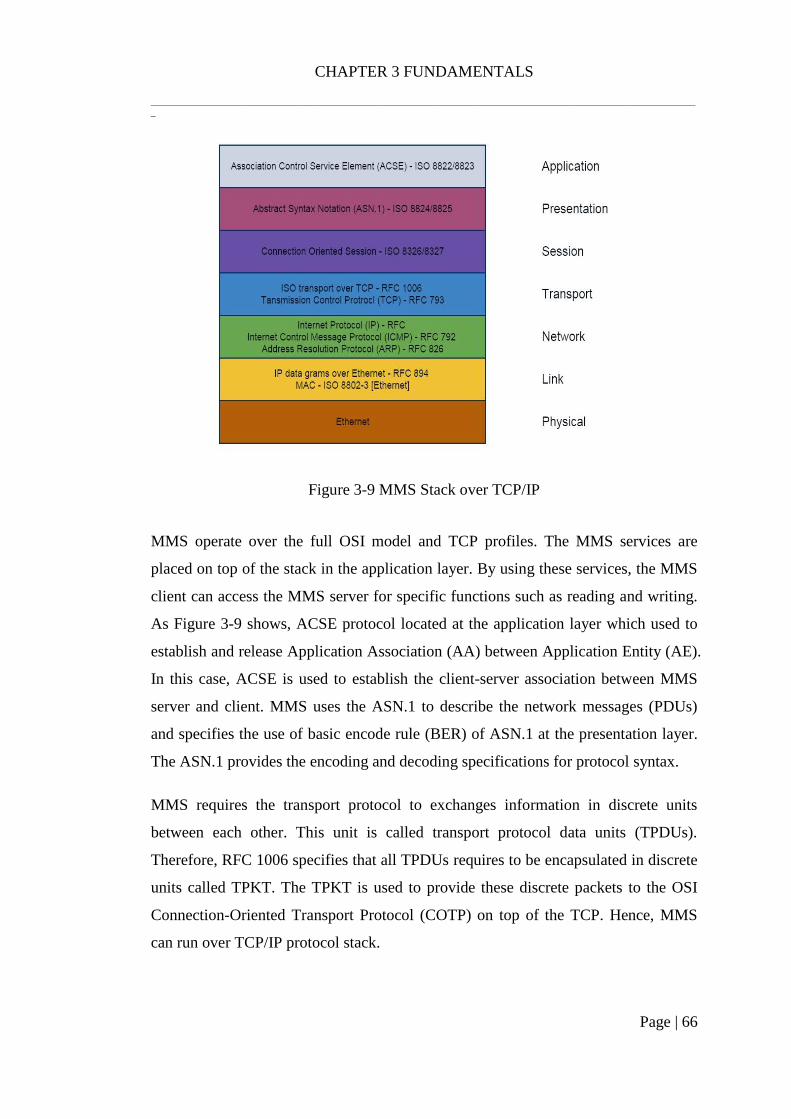
CHAPTER 3 FUNDAMENTALS
_____________________________________________________________________________________________________________________
_
Page | 66
Figure 3-9 MMS Stack over TCP/IP
MMS operate over the full OSI model and TCP profiles. The MMS services are
placed on top of the stack in the application layer. By using these services, the MMS
client can access the MMS server for specific functions such as reading and writing.
As Figure 3-9 shows, ACSE protocol located at the application layer which used to
establish and release Application Association (AA) between Application Entity (AE).
In this case, ACSE is used to establish the client-server association between MMS
server and client. MMS uses the ASN.1 to describe the network messages (PDUs)
and specifies the use of basic encode rule (BER) of ASN.1 at the presentation layer.
The ASN.1 provides the encoding and decoding specifications for protocol syntax.
MMS requires the transport protocol to exchanges information in discrete units
between each other. This unit is called transport protocol data units (TPDUs).
Therefore, RFC 1006 specifies that all TPDUs requires to be encapsulated in discrete
units called TPKT. The TPKT is used to provide these discrete packets to the OSI
Connection-Oriented Transport Protocol (COTP) on top of the TCP. Hence, MMS
can run over TCP/IP protocol stack.

CHAPTER 4 METHODOLOGY
______________________________________________________________________________________________________________________
Page | 67
CHAPTER 4 METHODOLOGY
4.1 Introduction
In this chapter, a proposed method to control the data flow within the IEC 61850-
based substation automation system has been described. The research stage has been
divided into two parts, 1) Research methodology and 2) proposed data flow control
method.
4.2 Research methodology
This research will focus on three parts (1) proposed data flow control method, 2)
implementation and performance assessment for an AS3 architecture by using
OPNET simulation tool, and (3) comparing the performance of the proposed data
flow control method with alternative data flow control methods.
The first part explants the methodology for data flow control through the flowchart,
which has been shown in Figure 4-1. The first step is to review the AS3 architecture
and the IEC 61850 technologies. Then step two is to design the data flow within the
AS3 architecture. In this research, the data flow for the substation communication
system has been separated in-between the process bus and station bus. For example,
the protection & control IEDs are using the process bus and control bus. Therefore it
will have two Ethernet ports to communicate with these two buses. Step three is an
arm to test the performance of the AS3 architecture which applies the data flow
management system by using OPNET Modeller. Step four compares the data flow
control method with an alternative method and analyses the simulation result to
improve the data flow management system. Finally, probability modelling has been
applied to evaluate the performance of the IEC 61850-based SAS.

CHAPTER 4 METHODOLOGY
______________________________________________________________________________________________________________________
Page | 68
Figure 4-1: Methodology of data flow management
The second part describes the methodology of developing VSATT testbed based on
AS3 architecture. Firstly, the virtual substation models will be developed on the
RTDS as RTDS can provide the test data by simulating the power system. Next step is

CHAPTER 4 METHODOLOGY
______________________________________________________________________________________________________________________
Page | 69
to develop the configurable VSATT testbed based on AS3 architecture. Follow up
with test procedures design based on IEC 61850-10. Finally, the interoperability
performance of different vendor IEDs will be evaluated by using the VSATT test bed.
4.3 The AS3 Architecture and data flow
The National Grid Architecture of Substation Secondary System Architecture aims to
allow the replacement of faulty IED and the refurbishment of the secondary bay with
minimum outage requirements, simplify isolation procedures between the primary and
secondary system, and reduce the risk of mal-operation. Therefore, the generic
architecture applied to generic substation bay has been designed and shown in Figure
4-2.
Figure 4-2 Generic architecture of AS3

CHAPTER 4 METHODOLOGY
______________________________________________________________________________________________________________________
Page | 70
Each circuit breaker has connected to a circuit breaker controller (CBC). The CBCs
and MUs have connected to the bay process buses (through PB1 and PB2). The
Switch Box has used for isolation purpose. The protection devices which include
main protection (MP1 and MP2) and Backup protection (BP) are connected to the
process bus and the station bus. The Bay Control Unit (BCU) and Metering (M)
devices have connected to the control bus and station bus. Phasor Measurement Unit
(PMU) has been connected to the control bus and also connect to the Wide Area
Network (WAN) to transmit thought out the substation.
Figure 4-3 Generic architecture applied across two bays
Figure 4-3 shows the concept of how to connect the process bus between two bays.
The process bus link is used as an Interbay process bus to isolate bays wherever
necessary. The process bus link can implement by using a filter switch mechanism.

CHAPTER 4 METHODOLOGY
______________________________________________________________________________________________________________________
Page | 71
Figure 4-4 Filter switch mechanism
Figure 4-4 describes the two connections of filter switch; in part ‘a’ series connection,
the filter switches have been located at the end of each process bus of each bay. For
part ‘b’ the shunt connection, the process bus has been connected to the Interbay in a
shunt manner. IEC 61850-8-1 GOOSE messages traffic is allowed to pass to
neighbour bay process buses. Figure 4-5 illustrates the connection of “n” numbers of
bays and the process bus have connected with filter switches. Figure 4-6 shows the
high-level view of the substation communication architecture with the double bus bar,
which includes the bus coupler bay, feeder bay, bus section bay, and bay process bus.
Furthermore, the protection devices for this architecture are operating independently.
For this architecture design, the protection devices only require the voltage and current
information from its bay, and protection devices are not going to trip any circuit
breaker within other bays.

CHAPTER 4 METHODOLOGY
______________________________________________________________________________________________________________________
Page | 72
Figure 4-5 Generic architecture applied to numbers of bays
Figure 4-6 High-level views of the process bus architecture for double bus bar
substation

CHAPTER 4 METHODOLOGY
______________________________________________________________________________________________________________________
Page | 73
4.4 Simulation of the SAS network
The flowchart of SAS network performance research has illustrated in Figure 4-7. In
this research, the simulation software OPNET Modeller is chosen to facilitate
communication networks, devices, protocols, and applications with complete
flexibility. The SAS network model can be built up by using the models provided by
the OPNET software and customised models designed for IEDs (these IEDs models
will be introduced in the following sections).
Figure 4-7 Flowchart model of SAS network performance research
The SAS network as shown in Figure 4-7, is built up in the project editor of the
OPNET Modeller, and all devices models are connected via links to make a
communication network. Network configuration involves data flow analysis of the
SAS network and also includes the network traffic and network parameter
configuration. The transmission method of each device is needed to be set up by using
multicast or client-server.
Since the SAS network is built up and the network configuration is set up, it is critical
to decide on what kind of statistics needs to collect. In this research, the performance
of the SAS communication network depends heavily on the ETE delay for the time-
critical messages, which defines in IEC 61850 standards as requirements. Therefore,
the ETE time delay of the time-critical message such as GOOSE and SV messages
needs to collect. Other statistics are also needed to be collected, such as the bandwidth
utilisation of each communication link, which can show the devices have taken the
total bandwidth. Hence, it can find up the capability of the communication network.

CHAPTER 4 METHODOLOGY
______________________________________________________________________________________________________________________
Page | 74
Now, the simulation can run for a setup length of time. The duration of a simulation
can set up as long as the user needed, but the shortest period of the simulation time has
to be longer than the services start time of the applications. Otherwise, the results will
not reflect the network performance.
Results of simulation can be collected and analysed to improve the overall
improvements. For example, OPNET is allowed for collecting the results to generate
the web report. Simulation results are analysed and compared to different scenarios,
and the results of this research will be in Chapter 7.
4.5 Data flow control method
This thesis presents a comparative study of three common queuing methods, the FIFO,
PQ, and WFQ, for an IEC 61850-based SAS communication network. This research
firstly defines the time delay requirements for both the time-critical message and the
non-time critical message that have defined in IEC 61850-5. The principles of FIFO,
PQ, and WFQ algorithms have described in details below. The SAS communication
network model with the consideration of three queuing algorithms, respectively, for
protecting a typical 400 kV double bus-bar substation is modelled by using the
OPNET simulation tool. The impact of each queuing algorithm on the SAS
communication network performance has been evaluated, compared and discussed.
When the network is designed to service widely varying data types of traffic, there is a
way to treat contention for resources by queuing and manages the resources according
to conditions outlined by the network administrator. Therefore, the router or switch
must be implemented some queuing algorithm to govern how packets are buffered and
waited to be transmitted. This paper considers three common queuing methods, and
they are first in first out (FIFO), priority queuing (PQ) and weighted-fair queuing
(WFO).

CHAPTER 4 METHODOLOGY
______________________________________________________________________________________________________________________
Page | 75
4.5.1 First-in-first-out queuing
FIFO is a basic queuing method which can describe as first-come-first-serve behaviour.
In FIFO, all packets are treated equally regardless of the importance of the packets and
the application that have to utilise. The principle of FIFO is that the first packet arrives
is the first packet to be transmitted. Figure 4-8 illustrates that all the incoming traffic
has put into a single queue where packets are queued according to the arrival time and
served in order.
Figure 4-8 First-in-first-out queuing algorithm
4.5.2 Priority queueing
With Priority Queuing, incoming packets have classified into different queues depends
on their priority tag. PQ can reflect the importance and urgency required in the
transmission of packets. Figure 4-9 illustrates the principle of priority queuing. In PQ,
the buffer of the switch/router has partitioned in several queues which depend on the
number of priority classes. For example, as shown in Figure 4-10, incoming traffic has
been partitioned into three queues which are the highest priority, middle priority and
lowest priority queue. Each queue associated with a priority, and within each queue,
the packet served according to a FIFO method. For the incoming packets, the highest
priority is transmitted on the output port first and then the packets with lower priority.
When congestion occurs, packets with lower-priority queues will be served at all high-
priority packets are excessive.

CHAPTER 4 METHODOLOGY
______________________________________________________________________________________________________________________
Page | 76
Figure 4-9 Priority Queuing (PQ) algorithm
4.5.3 Weighted Fair Queuing
Weighted-fair queuing is a packet scheduling technique allowing guaranteed
bandwidth services and packets control operations in WFQ as shown in Figure 4-10.
Incoming packets have put into several flows based on its priority. Each queue has
been given different weights where the higher weight gets a higher bandwidth share of
the output port usage. The WFQ scheduler calculates a finish time for each arriving
packet. The scheduler then selects and forwards the packet which has the earliest
finish time from all the queued packets. It can understand that the finish time is not the
actual transmission time for each packet. Instead, the finish time is a number assigned
to each packet that represents the order in which packets should transmit to the output
port.
Figure 4-10 WFQ queuing algorithm

CHAPTER 4 METHODOLOGY
______________________________________________________________________________________________________________________
Page | 77
4.6 Summary
This chapter introduced the research methodology in two parts. The first part focuses
on the design of data flow management. His second part is the system level test of the
AS3 Architecture by using the VSATT test bed. Furthermore, AS3 architecture has
described in detail. Then, the simulation method and the interoperability test method
have been described.
The proposed data flow control method has been described in detail. Next chapter will
provide the modelling and simulation of the station bus and process bus by using
OPNET.

CHAPTER 5 MODELLING OF SAS NETWORK USING OPNET
______________________________________________________________________________________________________________________
Page | 78
CHAPTER 5 MODELLING OF THE SAS NETWORK
USING OPNET
5.1 Introduction
This chapter presents the network modelling of the SAS network using OPNET
simulator. The functions of OPNET simulator and the network modelling domains
have been described. The modelling of MMS, SV and GOOSE messages are described
in detail as well.
5.2 OPNET network simulator
5.2.1 Introduction
OPNET Modeller [105] tool belongs to the OPNET Technologies suite. The software
products are widely used for research and development of emerging networking
technologies for performance evaluation, testing and debugging of communication
networks, protocols and applications. OPNET software has an easy-to-use user
interface which allows the users to build various network configurations and test their
performance. It also contains a larger size of the model library which helps the user to
simulate the most complex computer network and configure the protocols that
implement the most up-to-date communication technologies such as IEC 61850.
Network simulation technology is using statistical/mathematics model to construct
network equipment and network links and simulate the transmission of network traffic
for the required data. [106] OPNET is one of the most advanced developments and
application platform in the world. It has been designed to support the modelling and
simulation of communication networks and distributed systems. The OPNET Modeller
version 14.5 has been applied in this research.

CHAPTER 5 MODELLING OF SAS NETWORK USING OPNET
______________________________________________________________________________________________________________________
Page | 79
5.2.2 OPNET simulation mechanism
Network simulation technology is using statistical/mathematics model to construct
network equipment and network links and simulate the transmission of network traffic
for the required data.[107] OPNET is one of the most advanced developments and
application platform in the world. It has been designed to support the modelling and
simulation of communication networks and distributed systems.
OPNET used a Discrete Event-driven Simulation (DES) mechanism, where “event”
refers to changes in network status. Each event occurs at an instant in time and marks a
change of state in the system. Any simulation calculation will not be performed if the
state of the network doesn’t change. This means only when the network state changes,
analogue machines can work. For example, when simulating the routing protocol, it is
not necessary to check the packet arrival every short period, and it only needs to check
the packet every time it arrived. The FSM will stay in the state after the packet arrived
and then it will switch to another state. So, OPNET works more efficiently than the
system which operates as a chronological sequence of events.
OPNET uses the finite state machine (FSM) approach to support the specification of
protocols, resources, applications, algorithms, and queuing policies. States and
transitions graphically define the progression of a process in response to events. [108]
OPNET has a three-layer modelling hierarchy. The highest layer is called the network
level which allows the definition of system topologies. The second layer is the node
model allows the definition of node architecture such as data flow within a node. The
third layer is the process model that specifies the logic or control flow among
components in the form of FSM.
OPNET provides C++ based object-oriented modelling approach to develop each node,
and the model is generated in the application for different objects with specific
parameters. [108, 109] Therefore, it improves efficiency and utilisation, and the user
can create/configure the model within every layer. OPNET also provides a huge model
library that contains many network devices and communication links. Figure 5-1
shows the relationship between three-layer models.

CHAPTER 5 MODELLING OF SAS NETWORK USING OPNET
______________________________________________________________________________________________________________________
Page | 80
Figure 5-1 Hierarchical modelling
The traffic generation is one of the key aspects of parameter configuration in the
modelling of a network system. The data flow through the network allows the users to
study the behaviour and evaluate the performance of various network protocols in
different operational environments.
At the node editor level, OPNET has presents the architecture of a network device or
system by describing the flow of data between functional elements, known as
“modules”. Each module can generate, send and receive packets from other modules
to perform its function within the node.
OPNET provides a variety of traffic source models that may be included in a
simulation. Different types of traffic source models may require in the simulation, and
some types of sources are created simply, while others require a more complex
configuration process. Typically, OPNET simulates network traffic using explicit,
background and hybrid traffic models. Each of the explicit and background models can
be deployed in a simulation by choosing different mechanisms. Figure 5-2 illustrates
the overall hierarchy of the traffic models available in the OPENT simulator. Theses
standard model is easy to configure and provides the commonly used applications such
as e-mail, FTP and remote login. However, the standard model does not allow for
modifications of the simulated application protocols.
To address this issue, OPNET also provides the facilities for modelling custom
applications, which could represent nonstandard, multitier applications that follow a
user-defined protocol. For example, the data exchange between sender and receiver
using IEC 61850 MMS protocol can be easily achieved using the custom application
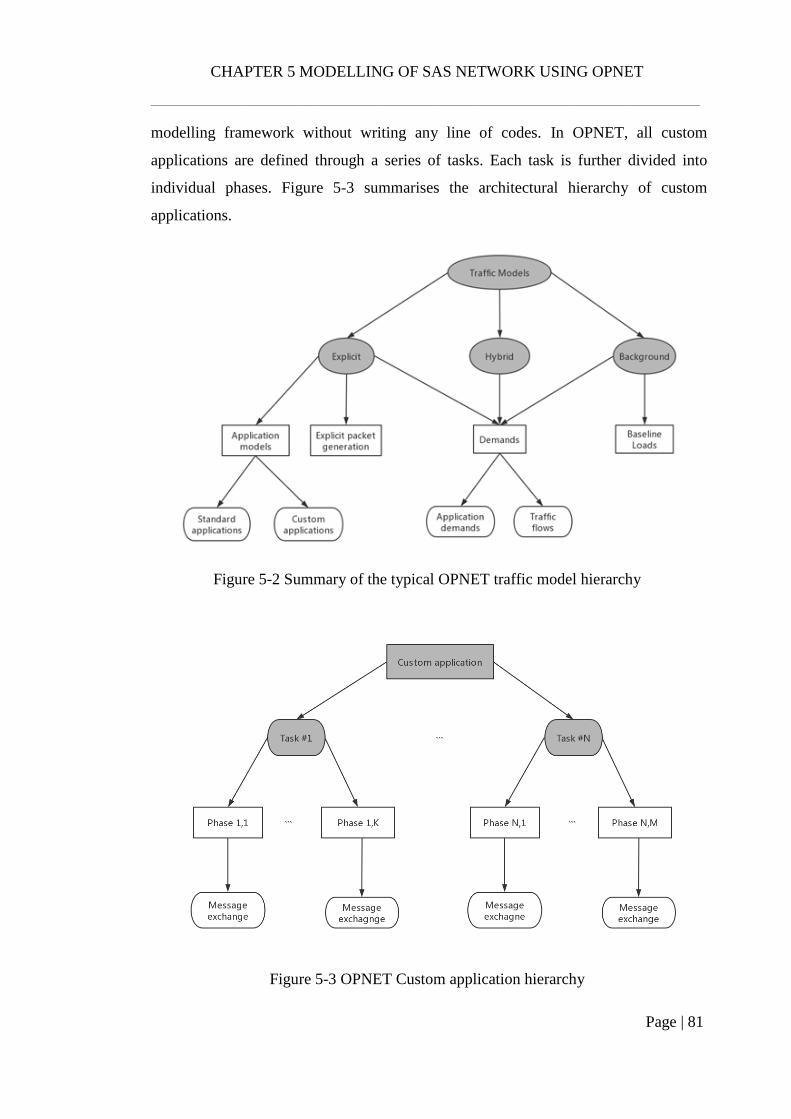
CHAPTER 5 MODELLING OF SAS NETWORK USING OPNET
______________________________________________________________________________________________________________________
Page | 81
modelling framework without writing any line of codes. In OPNET, all custom
applications are defined through a series of tasks. Each task is further divided into
individual phases. Figure 5-3 summarises the architectural hierarchy of custom
applications.
Figure 5-2 Summary of the typical OPNET traffic model hierarchy
Figure 5-3 OPNET Custom application hierarchy

CHAPTER 5 MODELLING OF SAS NETWORK USING OPNET
______________________________________________________________________________________________________________________
Page | 82
5.2.3 Network model
The OPNET is a hierarchical structure modelling which is divided into three main
domains: Network, Node, and Process. Therefore, the simulation will be separated as
the Network model, Node model, and Process model.
In the project editor, it specifies the topology of the network and configures the
various components of the system is the main area to start creating a network
simulation. It is a high-level description of the objects contained in the system and
specifies their physical locations, interconnections and configurations. In this area,
the user can model the network, collect statistics, run the simulation, and review the
results. As the Figure 5-4 show, the network model consists of numbers of sub-
networks and nodes connected by point-to-point or radio link, which can be treated as
single objects in the network model.
Figure 5-4Network model in project editor.

CHAPTER 5 MODELLING OF SAS NETWORK USING OPNET
______________________________________________________________________________________________________________________
Page | 83
5.2.4 Node model
The next level in the OPNET hierarchy is the node model by using Node Editor to
define individual network devices and to specify the internal structure, known as a
network node. As seen in Figure 5-5, the node contains various module connections
with packet streams and statistic wires. The connections allow the packets and status
information to be exchanged between modules. Furthermore, each node has its
function, such as generating packets, queuing packets, and processing packets.
Figure 5-5 Node model in node editor
5.2.5 Process model
The process model is the lowest level in the OPNET model hierarchy, which has been
used to specify various protocols and network technologies. It consists of a variation

CHAPTER 5 MODELLING OF SAS NETWORK USING OPNET
______________________________________________________________________________________________________________________
Page | 84
of the C++ codes, with extended finite state machine transition diagrams. Figure 5-6
shows the process model in the Process Editor.
The process model is a finite state machine which implements the behaviour of
applications. FSM consists of numbers of states with transitions and conditions
between the applications. The state is the condition of a module, and a transition is a
change of state in response to an event. Operations performed in each state or for a
transition are describe in embedded C or C++ code blocks that are supported by an
extensive library of functions which designed for network programming.
Figure 5-6 Process model in the Process Editor
5.2.6 Modelling of IEDs and devices
This section introduces the modelling of IEDs and devices that have been used in the
AS3 architecture network. Although OPNET provides standard models for most of
the devices, the IED models need to be customised for specifying functionalities. The

CHAPTER 5 MODELLING OF SAS NETWORK USING OPNET
______________________________________________________________________________________________________________________
Page | 85
SAS network model uses the standard Ethernet workstation for HMI or station PC,
server, switch, and links. For the switches, it should support link layer priority tagging
according to IEEE 802.1Q. The procedures to construct the IED models are discussed
in the following sections.
5.3 Data flow analysis between process bus and station bus
The data flow in the AS3 architecture network is shown as Figure 5-7. For the process
level, the merging unit is located beside the CT/VTs in the switch-yard. MU has
digitised the analogue voltage and current signals (collected from the CT/VT) into SV
format, and then transfer to the protection and control (P&C) IEDs through process
bus network. Circuit breaker IED is used to control the circuit breaker, and it has
connected with the P&C IED to upload the circuit breaker states.
For the Bay level, the Relay (also known as P&C IEDs) is connected with the Station
controller (or HIM) which located in the Substation local control room through the
Station bus network.
Figure 5-7 Point-to-point communication within SAS

CHAPTER 5 MODELLING OF SAS NETWORK USING OPNET
______________________________________________________________________________________________________________________
Page | 86
5.3.1 Design of the IEC 61850 MMS models
MMS is based on TCP/IP protocol, which is aim to build up the connection between
the HMI (client) and an IED, it is necessary to follow the TCP connection
establishment process which known as TCP Three-Way Handshake. All TCP
messages have the same segment format. Within the TCP header, there is two control
flag used to indicate whether the segment is used for controlling purpose or for
transmitting data. One control flag is called ACK which indicates the segment that
sends the acknowledgement to the device. The other one is called SYN, synchronise,
it indicates the segment which for initialises a connection. Figure 5-8 illuminates the
TCP Three-Way handshake process.
Figure 5-8 TCP Three-Way Handshake
As Figure 5-9 shows, to establish a TCP connection, the client needs to send the SYN
to the server. When the server receives the SYN from the client, it sends back an
SYN+ACK message to the client. This SYN+ACK message contains the ACK for the

CHAPTER 5 MODELLING OF SAS NETWORK USING OPNET
______________________________________________________________________________________________________________________
Page | 87
client’s SYN and server’s SYN. When the client receives this message, it sends a
message back to the server which contains an ACK with the server’s SYN. Then the
connection establishment is done.
After the TCP three-way handshake, the client is able to send a connection request
message which establishes by the COTP layer to the server. The server will send a
connection-confirm message back to the client. Now the transport connection setup is
finished and turns into the next phase.
Then the MMS client needs to establish an MMS Initiation/Association. The MMS
Initiate/association request message is sent to the client, and the server sends back the
initiation/association response.
Figure 5-9 MMS Message Transfer between Different Phase during the Connection of
MMS Client and Server

CHAPTER 5 MODELLING OF SAS NETWORK USING OPNET
______________________________________________________________________________________________________________________
Page | 88
5.3.2 Implementation of the MMS model using OPNET modeller
In section 5.3.1, the messages flow between MMS client and MMS server in different
phase has been clarified. Therefore, the IEC 61850 MMS model should be built
according to the MMS message design.
In OPNET simulator provides applications which have frequently been used by the
user, such as Database, Email, Ftp, Http, etc. All these functions can be found in the
application description panel. Moreover, within this panel, the user can configure the
application behaviour by specifying the attributes of the application. For instance, the
Http application is normally used for web browsing, and the user can define the usage
and the server for the application. Besides, the user can configure manually for each
attribute to build up the desired behaviour of the application. The application
attributes are shown in Figures 5-10 and 5-11.
Figure 5-10 Application Attributes

CHAPTER 5 MODELLING OF SAS NETWORK USING OPNET
______________________________________________________________________________________________________________________
Page | 89
Figure 5-11 Http Attribute Table
For IEC 61850 MMS application, we need to use the customised application function
to design and describe the MMS message flow since there are no available
applications provided by the OPNET. To use the customized application, it requires
defining the application behaviour in the Task definition panel. The task is known as
the basic unit of the user activity within the context of the application. For example, a
task can be the action of reading an e-mail or obtaining records from the database.
According to the MMS behaviour, three tasks need to be configured (as Figure 5-9
shows). Firstly, is the transport connection, the MMS client needs to send a
connection request message to establish the COTP layer connection with the MMS
server. After receiving the connection request, the server sends back a connection
confirm message to the client. Figure 5-12 shows the configuration of the Transport
Connection setup within OPNET task panel.
In Figure 5-9, it shows the MMS client sends the request message at the application
start point. A one second time delay is set as the request processing time before the
client sends the request and the length of request packet size is 60 bytes. The MMS
server sends back one response message, and the packet size is 60 bytes.

CHAPTER 5 MODELLING OF SAS NETWORK USING OPNET
______________________________________________________________________________________________________________________
Page | 90
Figure 5-12 Configuration of the Transport Connection Setup in OPNET
The second phase of MMS communication is the MMS Initiation/Association. The
MMS initiate request message has been mapped onto the Application Association
Request (AARQ) PDU of the ACSE layer. The MMS initiate response message is
mapping onto the Application Association Response (AARE) PDU of the ACSE layer.
As shown in Figure 5-13, the MMS client sends a request message which size is about
233 bytes, and the server sends back a response message which is about 204 bytes.
The size of both request and response messages are using exponential distribution to
have randomness. Therefore, the size of each packet would be the same. The actual
size of request and response message depends on the TCP heard.
Figure 5-13 MMS Association in OPNET
After establishing the application association, the MMS client is now ready for
regular MMS request and response to support the IEC 61850 services. As Figure 5-13
shows, the client sends an MMS request message to the MMS server; for instance, the

CHAPTER 5 MODELLING OF SAS NETWORK USING OPNET
______________________________________________________________________________________________________________________
Page | 91
MMS client sent a GetList service message to get instantaneous measurement values.
The request message contains the names of the parameters or parameters list that
needs to be read. The server sends back the response message which contains the
requested list of values.
5.3.3 Protection and Control IED and Circuit Breaker IED
The IED integrates all substation protection and control functionalities. This study has
two Ethernet ports to connect both the process bus and station bus. The P&C IED is
configured to generate GOOSE message for fault event occurs to trip the
corresponding circuit breaker. For normal condition, the P&C IED generates constant
rate packet and send to the station PC (or HMI). As Figure 5-14 shows, the P&C IED
can communicate directly at ‘mac’ for GOOSE message transmission and to use all
the OSI-7-layer stacks for client-server communication.
After an application association can be established, the client can send regular MMS
requests such as read, write, and delete information variables to the MMS servers and
receive the responses.
Figure 5-14 OPNET model for protection and control IED

CHAPTER 5 MODELLING OF SAS NETWORK USING OPNET
______________________________________________________________________________________________________________________
Page | 92
As Figure 5-14 shows, the circuit breaker IED needs to communicate with relay by
exchange data in bi-direction. The functionalities of circuit breaker IED including
reporting the breaker states and condition of the circuit breaker by sending Generic
Substation State Events (GSSE) to the protection IEDs and HMI. Then circuit breaker
IED will receive GOOSE ‘trip’ message from the protection IED. These entire
messages are transmitted within the process bus. The GOOSE message is also a time
critical message which should be tagged with high priority. Therefore, circuit breaker
IED should be modelled to support both the client-server communication and GOOSE
message. Figure 5-15 shows the circuit breaker model which contains a GOOSE stack
and an MMS stack with the TCP/IP layer.
Figure 5-15 OPNET model for circuit breaker IED
5.3.4 Merging Unit
The modelling of merging unit IED is based on IEC 61850-9-2. MU IED transmits
the digital voltage and current signals form CT/VT to the P&C IED through the

CHAPTER 5 MODELLING OF SAS NETWORK USING OPNET
______________________________________________________________________________________________________________________
Page | 93
process bus. The Ethernet transmission type is using broadcast as a default destination
address. The configuration of MU IED can be edited, such as the sample rate, start
time, stop time, packet size, etc. The communication stack for MU IED in the node
model diagram that is shown in Figure 5-16; it contains an application layer, Ethernet
layer, and physical layer.
The ‘bursty_gen’ model is to generate raw data as the Ether-type protocol data unit
(PDU), and ‘sink’ model is to receive a message to the MU IED. The ‘bursty_gen’
model and ‘sink’ model are in the application layer. In this case, the MU IED would
not process the received message since the function of MU is only generate SV
messages. The Ethernet layer consists of the ‘eth_mac_intf’ model and ‘mac’ models,
where Ethernet protocols and algorithms are implemented. The SV messages sent
from the application layer have added the priority tagging to separate the time critical
messages from the non-time critical messages. The physical layer builds up the
connection between the IEDs through physical links, such as 100Mb/s or 1Gb/s link.
The chosen links are depending on the transmitter and receiver module.
Figure 5-16 MU IED model

CHAPTER 5 MODELLING OF SAS NETWORK USING OPNET
______________________________________________________________________________________________________________________
Page | 94
5.4 Detail double bus bar applications
The selected substation is a National Grid 400kV substation; it is a typical double bus
bar substation with a single breaker bus tie arrangement shown in Figure 5-17.
According to the high-level design, no filter switches are needed between
neighbouring bays. Therefore, the protection of each bay is independent with other
bays.
Figure 5-17 Double bus bar single breaker with bus tie arrangement
The original copper connections of Feeder Bay, Bus Section, Bus coupler Bay, and
Transformer Bay of National Grid substation can be found in Appendix B.
A detailed application of this architecture is shown in Figure 5-18 which provides the
application of the process bus. This diagram shows the connection between the
primary devices and the secondary devices, such as circuit breaker and circuit breaker
control (CBC).

CHAPTER 5 MODELLING OF SAS NETWORK USING OPNET
______________________________________________________________________________________________________________________
Page | 95
Figure 5-18 Detailed double bus bar substation application
Figure 5-19 shows the details of Bus Coupler Bay within the double bus bar
substation. There are six current transformers (C1-C6), one circuit breaker (X130) and
two dis-connectors (X134 and X136). Figure 5-18 shows that CTs are connected to
merging units, while circuit breakers and dis-connectors are connected to circuit
breaker controllers. All these connections are the switch boxes. CTs are usually
connected with one MU, and some may be connected with two MUs, while VTs are
connected with three MUs. The circuit breaker is connected to four circuit breaker
controls (CBC), and each disconnector are connected with two CBCs.
The AS3 architecture has been designed to have two process bus, called PB 1 and PB
2, one station bus and one control bus. The station bus is isolated using process buses
by P&C IEDs. Process bus 1 and Process bus two are providing the communication
redundancy as the dashed line shows.

CHAPTER 5 MODELLING OF SAS NETWORK USING OPNET
______________________________________________________________________________________________________________________
Page | 96
Figure 5-19 Detailed double bus coupler bay substation application
After introducing the AS3 architecture in details, the next step is to build up the
simulation model for the process bus and station bus. In the simulation model, the
structure of the process bus and station bus has defined, but the modelling for each
IED and devices need to be clarified, which can be seen in the following sections.
5.5 Simulation of Process Bus
In this section, according to the AS3 architecture, the process bus model for bus
coupler bay has been built up. It is a diagram that consists of basic elements which
illustrate the process bus network model in the OPNET Modeller, shown in Figure 5-
20. Within the bus coupler bay, there are three CBC and three MUs connected by
using an Ethernet switch with one main protection and fault recorder.

CHAPTER 5 MODELLING OF SAS NETWORK USING OPNET
______________________________________________________________________________________________________________________
Page | 97
Figure 5-20 OPNET modelling for bus coupler bay process bus network
The switch model is using is an ‘Etherne16_switch’ OPNET standard model,
featuring 16 interfaces with full duplex communication with 100MB/s transmission
rate. The switch is using the default settings, which means the switch buffer size and
packet service rate are used as default values, shown in Figure 5-21. Fault Recorder
will not send any message to the process bus, while it will be receiver GOOSE and
SV messages from CBC, MP, and MU.

CHAPTER 5 MODELLING OF SAS NETWORK USING OPNET
______________________________________________________________________________________________________________________
Page | 98
Figure 5-21 Switch default settings
5.5.1 SV traffic estimation
The features of sampled values messages have been introduced in section 3.8.2. Since
the period of the time-triggered messages is small, the SV messages from MUs will
occupy a large portion of the network channel bandwidth. Based on the IEC 61850
standards define, the MU supports the multicasting the time-critical message SV,
which allows the MU art as publisher and send SV messages to multiple destination
devices as subscribers.
The SV data function is aiming to read the voltage values from the IEC 61850-9-2
format, and this includes eight sets of data: IA; IB; IC; IN; VA; VB; VC; VN.
According to IEC 61850-90-4 standard, a typical size of SV is 133 octets (Bytes). The
sampling frequency of the merging units chosen in this study are all 80 samples per
power system frequency cycle. For a 50 Hz power system, this will give 4000 SV
messages per second, which means for each SV message takes 0.25 msec. Therefore,
the communication channel bandwidth taken for each MU can be calculated as
4000×133×8=4.256Mb/s. The setting has been shown in Figure 5-22:
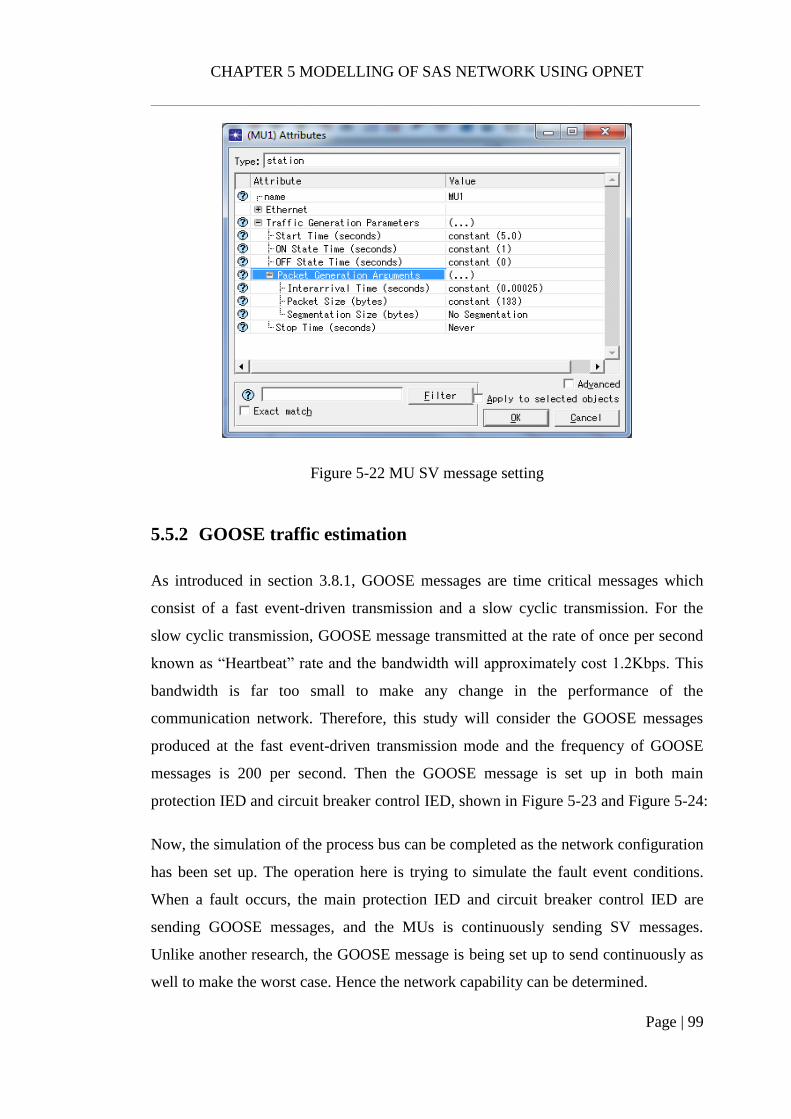
CHAPTER 5 MODELLING OF SAS NETWORK USING OPNET
______________________________________________________________________________________________________________________
Page | 99
Figure 5-22 MU SV message setting
5.5.2 GOOSE traffic estimation
As introduced in section 3.8.1, GOOSE messages are time critical messages which
consist of a fast event-driven transmission and a slow cyclic transmission. For the
slow cyclic transmission, GOOSE message transmitted at the rate of once per second
known as “Heartbeat” rate and the bandwidth will approximately cost 1.2Kbps. This
bandwidth is far too small to make any change in the performance of the
communication network. Therefore, this study will consider the GOOSE messages
produced at the fast event-driven transmission mode and the frequency of GOOSE
messages is 200 per second. Then the GOOSE message is set up in both main
protection IED and circuit breaker control IED, shown in Figure 5-23 and Figure 5-24:
Now, the simulation of the process bus can be completed as the network configuration
has been set up. The operation here is trying to simulate the fault event conditions.
When a fault occurs, the main protection IED and circuit breaker control IED are
sending GOOSE messages, and the MUs is continuously sending SV messages.
Unlike another research, the GOOSE message is being set up to send continuously as
well to make the worst case. Hence the network capability can be determined.

CHAPTER 5 MODELLING OF SAS NETWORK USING OPNET
______________________________________________________________________________________________________________________
Page | 100
In the stage, process bus simulation is run for 10mins. The Ethernet end-to-end time
delay and through the output of each IEDs are selected for key statistics to evaluate
the real-time performance of the process bus.
Figure 5-23 GOOSE setting in the MP
Figure 5-24 GOOSE setting on CBC

CHAPTER 5 MODELLING OF SAS NETWORK USING OPNET
______________________________________________________________________________________________________________________
Page | 101
5.5.3 Analysis simulation results for process bus
The messages configuration with total traffic in million bits per second has been listed
in Table 5-1.
Table 5-1 Messages configuration for process bus
Types of Messages Packet Size (bytes) Inter-arrival Time
(sec)
Total Traffic
(Mbps)
GOOSE 150 0.005 0.24
SV 133 0.00025 4.2
The consumption of communication channel bandwidth between the main protection
and switch is shown in Figure 5-25. The top half of the diagram shows the MP IED
output which is the GOOSE messages sending to the CBC IED; while the bottom half
shows the messages sending to the MP IED which includes the SV and GOOSE from
CBC IEDs. Adding up both of them that will be the total consumption of the channel
bandwidth, the result is 16.28Mbps which cost 16.28% of the total 100Mbps
bandwidth.
Figure 5-25 Consumption of communication channel bandwidth between the switch
and MP

CHAPTER 5 MODELLING OF SAS NETWORK USING OPNET
______________________________________________________________________________________________________________________
Page | 102
The time delay of the process bus is 48µsec which shows in Figure 5-26. The end-to-
end real-time performance of the GOOSE and SV data stream can be evaluated by the
time delay, compared with the transmission delay requirements of the time-critical
message. The requirements that are defined by IEC 61850 standards are shown in
chapter 6.
Figure 5-26 ETE time delay in process bus
5.6 Simulation of station bus
The station bus for AS3 architecture is using the ring topology to connect each bay to
the substation. In this section, the simulation is only containing a single bay, so the
ring topology is not able to present. The simulation model for the station bus with one
bay is shown in Figure 5-27. Main protection, back protection IEDs, and station PC
are using the P&C IED model’s analysis in section 5.10. The FR is using the standard
Ethernet workstation model. FTP Server is using the standard Ethernet server model
provided by OPNET Modeller.

CHAPTER 5 MODELLING OF SAS NETWORK USING OPNET
______________________________________________________________________________________________________________________
Page | 103
Figure 5-27 Station bus model with one bay in OPNET
5.6.1 MMS traffic estimation
The MMS traffic generated by IEDs consists of a polling part from the SCADA. An
event-driven part depends on the MMS messages sent from the MMS server to MMS
clients. An IED sends digital values and data counters using reports triggered by data
change, quality change or data update. The size of reports sent via MMS depends on
the number of elements in the data set as well as on the configuration of report control
block parameters.
Main protection and backup protection are sending MMS messages as MMS server to
MMS clients, in this case, is station PC. Moreover, the configuration of the MMS is
shown in Figure 5-28, where the packet size is 700 Bytes and inter-request time is
0.06 seconds.

CHAPTER 5 MODELLING OF SAS NETWORK USING OPNET
______________________________________________________________________________________________________________________
Page | 104
Figure 5-28 MMS traffic setting in OPNET
Files transfer between fault recorder and FTP Server. As IEC 61850-90-4 standard
describe file transfer as using the medium bandwidth of the communication channel.
Hence, the FTP service has been defining shown in Figure 5-29, the file size is 500K
Bytes and the inter-request time is 1 sec.
Figure 5-29 FTP traffic setting in OPNET

CHAPTER 5 MODELLING OF SAS NETWORK USING OPNET
______________________________________________________________________________________________________________________
Page | 105
5.6.2 Analysis simulation results for station bus
The messages configuration for station bus with total traffic in million bits per second
has been listed in Table 5-2.
Table 5-2 Messages configuration for station bus
Types of
Messages
Packet Size
(bytes)
Inter-arrival
Time (s)
Total Traffic
(Mbps)
MMS 700 0.05 0.112
FTP 500,000 1 4
GOOSE 250 0.002 1
The simulation has been run for 40 minutes, and the end-to-end real-time performance
is shown in Figure 5-30, where the time delay is 0.11msec. The MMS traffic generated
by a single IED on the station bus is about 100kbit/s, and it is not multicast. Therefore,
it only influences the bandwidth on the channel link that connected MMS clients and
MMS server.
Figure 5-30 Time delay of station bus

CHAPTER 5 MODELLING OF SAS NETWORK USING OPNET
______________________________________________________________________________________________________________________
Page | 106
5.7 Summary
This chapter provides an introduction to OPNET Modeller software.
Furthermore, the modelling of protection and control IED, merging unit IED and
circuit breaker IED have been presented. The simulation of process bus and station
bus network with these IEDs is presented, and the results have been shown as well.
The next chapter will provide the performance evaluation for different scenarios and
analysis of the results performance evaluation for different scenarios and analysis of
the results.

CHAPTER 6 IMPLEMENTATION OF THE DATA FLOW CONTROL
______________________________________________________________________________________________________________________
Page | 107
CHAPTER 6 Implementation of the Data Flow Control
the SAS
6.1 Introduction
This chapter introduces the implementation of the proposed data flow control method
in the IEC 61850-based substation automation system. The selected substation has
been described, and the modelling of its SAS network have been presented. The
simulation results have been illustrated and compared with the other two control
methods.
6.2 Implementation of the selected substation
The National Grid (NG) 400kV transmission substation is selected for this study. This
substation has a typical double bus-bar arrangement. It provides the ‘main’, and the
‘reserve’ bus-bar and each of them have a bus-section circuit-breaker. Therefore, this
substation provides four discrete sections of the bus-bar. Bus coupling circuit-
breakers couple the main and reserve bus-bar. The selected substation consists of two
transformer bays, one bus section bay, two bus coupler bays and six feeder bays
(Feeder 1-6). Figure 6-1 shows the single-line diagram (SLD) of the NG 400kV
double bus-bar substation arrangement.
Independent protection schemes have been applied to the power system device. For
example, each feeder bay is protected by the distance protection relay (as ‘main’
protection) and has the overcurrent protection relay as backup protection. In this study,
the SAS communication network has been considered and shown in Figure 6-2. The
communication network connects all 11 bays. Each bay has been allocated the
required IEDs for either the bus section protection or the feeder protection or the
transformer protection or the substation protection, respectively.

CHAPTER 6 IMPLEMENTATION OF THE DATA FLOW CONTROL
______________________________________________________________________________________________________________________
Page | 108
Figure 6-1 Single-line diagram of the National Grid 400kV substation
Figure 6-2 Station Bus Structure of the SAS network for the double bus-bar
Substation

CHAPTER 6 IMPLEMENTATION OF THE DATA FLOW CONTROL
______________________________________________________________________________________________________________________
Page | 109
6.3 Modelling and implementation
For the different protection and control functions, data messages can be classified into
five types which have been shown in Table 6-1. Type 1 is the GOOSE trip messages
which are travelling within the bay or between the bays. The GOOSE trip messages
occur when the faulty events take places, such as circuit breaker failure or faults in the
substation feeder or transformer or bus sections. The size of the GOOSE message of
125 bytes is considered. The MMS are classified as the type 2 messages, which are
used to control and monitor the IEDs. MMS is transmitted between IEDs and the
substation human-machine interface (HMI) system. The MMS messages are modelled
by using application demands. The size of each message is about 250 bytes. The type
4 message is the sample values within the substation process bus. Type 5 messages
(e.g. file transfers) are modelled by using FTP application between Fault Recorder (in
each bay) and the control centre. Table 6-1 summarises the priority tag value assigned
for each SAS message type. The type 1 GOOSE message has been given the highest
priority level. In this case, the larger priority tag value indicates the higher priority
level for the messages.
The implementations of different queuing algorithms are adopted to explore the
performance of the SAS communication network. The queuing algorithms are applied
to all the layer three switches by configuring the QoS scheme. For the TCP/IP-based
message, for example, MMS and FTP, the priority tag can be edited in the application
configuration model by defining the type of service (ToS) for each message. However,
for GOOSE message, it is the layer two messaging services. Therefore, the priority
can be edit in the MAC function block in the IED model. For the Priority Queuing,
five queues with five different priorities have been configured for each switch. In the
WFQ, only three queues are configured, where the high priority queue (Type 1 and
Type 4) has 50% of the output bandwidth; the middle priority queue has (Type 2 and
Type 3) have 40% of the output bandwidth, and the lowest priority queue (Type 5)
has 10% of the output bandwidth. For the FIFO queuing, simply configure the layer
three switches as FIFO, since the FIFO is the default queuing setting of the network
switch.

CHAPTER 6 IMPLEMENTATION OF THE DATA FLOW CONTROL
______________________________________________________________________________________________________________________
Page | 110
This study simulated the SAS station bus network by using OPNET modeller. Figure
6-3 illustrated in the view of the station bus network structure for the SAS
communication network model. The station bus used ring topology to connect all bay
switches. All IEDs in each bay is connected to the bay switch using the star topology.
The transformer bays and feeder bays consist of main 1 IED, main 2 IED, one backup
IED and one bay controller IED. The bus section bay and bus coupler bay consists of
one main IED, one backup IED and one bay controller IED. The SAS communication
network also includes one Engineering PC for setting IEDs and one HMI system for
monitoring IEDs. Bay control and circuit breakers statues. All nodes are connected to
the layer three switches in the ring topology by 100Mbps Ethernet links. The SAS
communication network has been modelled and implemented using OPNET tool as
shown in Figure 6-3.
Figure 6-3 Implementation of the SAS network using OPNET

CHAPTER 6 IMPLEMENTATION OF THE DATA FLOW CONTROL
______________________________________________________________________________________________________________________
Page | 111
Table 6-1 SAS Message Type and Tag Values
Sequence Number Message Type Priority Tag Value
1 Type 1 5
2 Type 2 3
3 Type 3 2
4 Type 4 4
5 Type 5 1
6.4 Results and discussions
Each of the queuing methods has been applied to the station bus network. For each
scenario, a fault event has been applied to evaluate the performance of the queuing
method during both normal and abnormal conditions. The results have been shown
and compared with the performance requirement in IEC 61850-5. This study applied
the tripping GOOSE message time delay to evaluate the performance of the SAS
station bus network.
6.4.1 Comparison of FIFO, PQ and WFQ
Based on the result above, firstly, the FIFO algorithm does not provide any different
levels of service for the data traffic. Therefore, the messages have been served in the
arriving order with only a single queue. The time delay of the GOOSE message with
FIFO queuing algorithm has been shown in Figure 6-4. The fault event started at the 8
seconds of the simulation. It can be seen that the GOOSE time delay of 4.5msec
during the abnormal condition is clearly over the performance requirement for the
GOOSE message, which is three milliseconds.

CHAPTER 6 IMPLEMENTATION OF THE DATA FLOW CONTROL
______________________________________________________________________________________________________________________
Page | 112
Figure 6-4 GOOSE message delays for FIFO algorithm
Secondly, for the Priority Queuing, messages have been put into serval queues
according to their assigned priorities. The queue with the highest priority has been
served first. After that, the lower priority queues can be served only when the higher
priority queues are empty. Figure 6-5 has shown that the fault event happens on the
8th second of the simulation and the maximum delay of GOOSE message by PQ is
0.8ms during the abnormal situation. Therefore, the delay of GOOSE packets by
using PQ has met the GOOSE performance requirement.
Figure 6-5 GOOSE message delays for PQ algorithm
0.0000
0.0005
0.0010
0.0015
0.0020
0.0025
0.0030
0.0035
0.0040
0.0045
0.0050
0 2 4 6 8 10 12 14 16 18 20 22 24 26 28 30 32 34
Tim
e D
elay
(se
c)
Time (sec)
0.0000
0.0001
0.0002
0.0003
0.0004
0.0005
0.0006
0.0007
0.0008
0.0009
0 2 4 6 8 10 12 14 16 18 20 22 24 26 28 30 32 34
Tim
e D
elay
(se
c)
Time (sec)
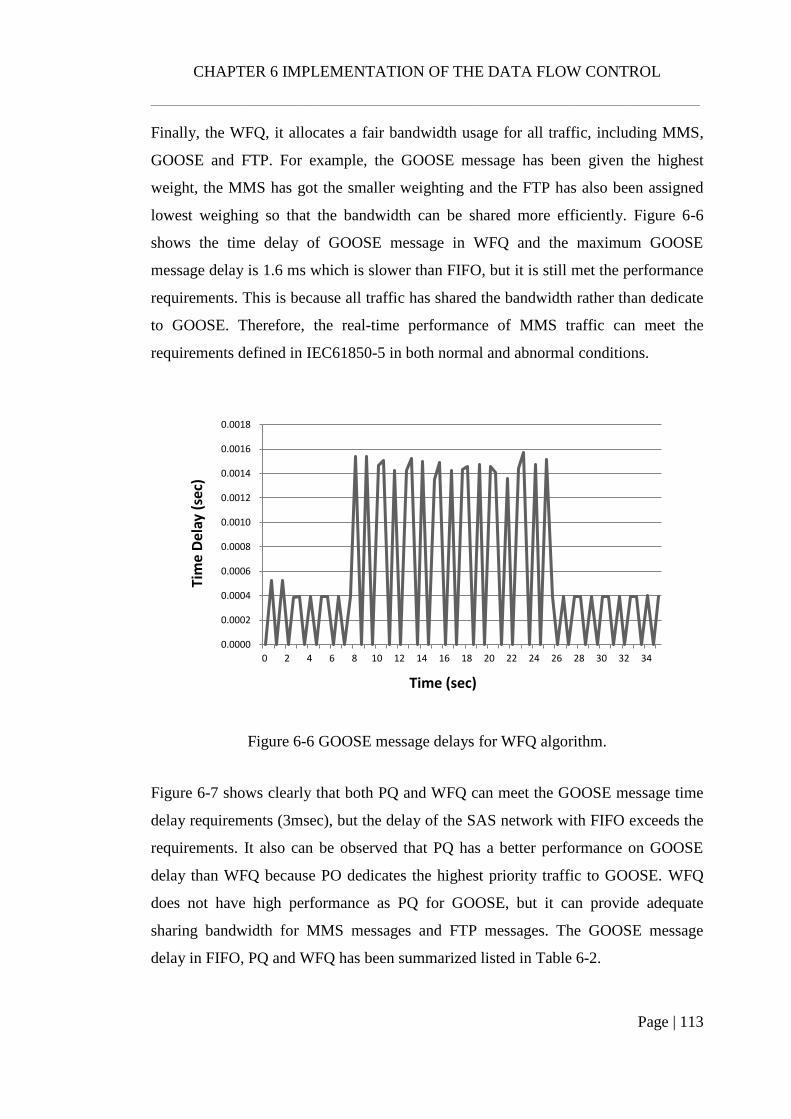
CHAPTER 6 IMPLEMENTATION OF THE DATA FLOW CONTROL
______________________________________________________________________________________________________________________
Page | 113
Finally, the WFQ, it allocates a fair bandwidth usage for all traffic, including MMS,
GOOSE and FTP. For example, the GOOSE message has been given the highest
weight, the MMS has got the smaller weighting and the FTP has also been assigned
lowest weighing so that the bandwidth can be shared more efficiently. Figure 6-6
shows the time delay of GOOSE message in WFQ and the maximum GOOSE
message delay is 1.6 ms which is slower than FIFO, but it is still met the performance
requirements. This is because all traffic has shared the bandwidth rather than dedicate
to GOOSE. Therefore, the real-time performance of MMS traffic can meet the
requirements defined in IEC61850-5 in both normal and abnormal conditions.
Figure 6-6 GOOSE message delays for WFQ algorithm.
Figure 6-7 shows clearly that both PQ and WFQ can meet the GOOSE message time
delay requirements (3msec), but the delay of the SAS network with FIFO exceeds the
requirements. It also can be observed that PQ has a better performance on GOOSE
delay than WFQ because PO dedicates the highest priority traffic to GOOSE. WFQ
does not have high performance as PQ for GOOSE, but it can provide adequate
sharing bandwidth for MMS messages and FTP messages. The GOOSE message
delay in FIFO, PQ and WFQ has been summarized listed in Table 6-2.
0.0000
0.0002
0.0004
0.0006
0.0008
0.0010
0.0012
0.0014
0.0016
0.0018
0 2 4 6 8 10 12 14 16 18 20 22 24 26 28 30 32 34
Tim
e D
elay
(se
c)
Time (sec)

CHAPTER 6 IMPLEMENTATION OF THE DATA FLOW CONTROL
______________________________________________________________________________________________________________________
Page | 114
Figure 6-7 Comparison of the GOOSE time delay between using FIFO, PQ, and WFQ
Table 6-2 Comparison of the GOOSE time delay between FIFO, PQ, and WFQ
methods with 11 bays
Queuing Algorithm GOOSE Delay
(Maximum)
GOOSE Delay
(Average)
FIFO 4.5 msec 3.3 msec
PQ 0.8 msec 0.5 msec
WFQ 1.6 msec 1.2 msec
0.000
0.001
0.002
0.003
0.004
0.005
0.006
0.007
0 2 4 6 8 10 12 14 16 18 20 22 24 26 28 30 32 34
Tim
e D
elay
(se
c)
Time (sec)
PQ
WFQ
FIFO

CHAPTER 6 IMPLEMENTATION OF THE DATA FLOW CONTROL
______________________________________________________________________________________________________________________
Page | 115
6.4.2 Capacity assessment for FIFO, PQ and WFQ
The selected substation network has only 11 bays. However, in reality, many National
Grid’s substations have more than 11 bays. Therefore, this study has evaluated the
maximising the number of days to figure out the capability of the SAS
communication network. The SAS network capability has evaluated by using
different queuing algorithms. This study thus considers and compares the SAS
communication network performance with three different FIFO, PQ and WFQ.
Figure 6-8 shows the time delay of GOOSE message with using a FIFO algorithm
with 9, 10 and 11 bays both in the normal and abnormal conditions. It can be observed
from Figure 6-8 that the delay of GOOSE for 9 and ten bays are met the GOOSE
message time delay requirement of 3msec. However, the delay exceeds 3msec when
the SAS with FIFO connects to 11bays.
Figure 6-8 GOOSE message delays for FIFO
Figure 6-9 shows that the time delay of GOOSE has exceeds 3 millisecond when the
SAS network connects to 15 bays. Hence the SAS network with WFQ is only able to
connect maximum 14 bays. Since WFQ considers a fair sharing SAS communication
0.0000
0.0005
0.0010
0.0015
0.0020
0.0025
0.0030
0.0035
0.0040
0.0045
0 2 4 6 8 10 12 14 16 18 20 22 24 26 28 30
Tim
e D
elay
(se
c)
Time (sec)
GOOSE Delay for FIFO
9 Bays
10 Bays
11 Bays

CHAPTER 6 IMPLEMENTATION OF THE DATA FLOW CONTROL
______________________________________________________________________________________________________________________
Page | 116
network bandwidth for both critical, i.e. delay message (GOOSE) and non-time
critical message, i.e. MMS and FTP, it can prevent the message accumulation for
MMS and FTP message, hence to relief any data transfer congestion in the SAS
communication network.
Figure 6-9 GOOSE message delays for WFQ algorithm.
For switches with using priority queuing algorithm, packets are queued according to
its assigned priority tag. Figure 6-10 shows the time delay of GOOSE messages by
using PQ method. It can be seen that the GOOSE performance are still acceptable
when the station bus is connecting 15 bays and 16 bays. However, the GOOSE
message time delay exceeds 3msec when the SAS network connected to 17 bays.
Results suggest that SAS network can extend bays up to maximum 16 bays by using
PQ method.
0.0000
0.0005
0.0010
0.0015
0.0020
0.0025
0.0030
0.0035
0.0040
0 2 4 6 8 10 12 14 16 18 20 22 24 26 28 30
Tim
e D
elay
(se
c)
Time (sec)
GOOSE Delay for WFQ
13Bays
14Bays
15Bays

CHAPTER 6 IMPLEMENTATION OF THE DATA FLOW CONTROL
______________________________________________________________________________________________________________________
Page | 117
Figure 6-10 GOOSE message delays for WFQ algorithm.
6.5 Summary
Applying appropriate queuing methods can reduce the impact of unexpected delay for
the time-critical messages (such as GOOSE) on the performance of protection and
control functions during the abnormal conditions. This paper has presented the
comparison study among FIFO, PQ and WFQ queuing algorithms. Furthermore, the
SAS network for protecting a typical 400kV double bus bar substation was modelled
for this study. The SAS network and all three queuing methods have been modelled
by using OPNET simulation tool. For the same SAS network connecting 11 bays, the
results show that GOOSE messages for the SAS with FIFO are 4.5msec and it with
PQ is 0.8msec and with WFQ is 1.6 msec. Hence the GOOSE message delay in the
SAS network with FIFO exceeds the minimum critical time requirement of 3msec.
Since the PQ has dedicated to the highest priority messages for the GOOSE message,
it limits the non-critical MMS and FTP messages. The accumulation of MMS and
FTP in the SAS network would result in the loss of these messages. Unlike PQ, WFQ
can not only ensure GOOSE delay of 1.6msec to meet the delay of critical time delay
requirement of 3msec, but it can also provide sufficient bandwidth for the non-critical
0.0000
0.0005
0.0010
0.0015
0.0020
0.0025
0.0030
0.0035
0.0040
0 2 4 6 8 10 12 14 16 18 20 22 24 26 28 30
Tim
e D
elay
(se
c)
Time (sec)
GOOSE Delay for WFQ
15 Bays
16 Bays
17 Bays

CHAPTER 6 IMPLEMENTATION OF THE DATA FLOW CONTROL
______________________________________________________________________________________________________________________
Page | 118
messages MMS and FTP. PQ method only prioritises the critical message. However,
WFQ provides a fair share of both the time-critical messages.

CHAPTER 7 PERFORMANCE EVALUATION
______________________________________________________________________________________________________________________
Page | 119
CHAPTER 7 PERFORMANCE EVALUATION AND
RESULTS ANALYSIS
7.1 Introduction
This chapter presents the performance evaluation of the substation communication
network which includes the process bus and station bus by using OPNET. The first
section discusses the performance requirements defined in IEC 61850 standard for
each type of messages flow in the SAS communication network. In sections 2 and 3,
process bus and station bus have been developed to analyse with more realistic
scenarios for the SAS performance evaluation, and the results have been discussed in
detail.
7.2 IEC 61850 performance requirements
The performance of SAS data communication network is mainly affected by the end-
to-end delay. IEC 61850 defines the performance requirements for different types of
messages based on their applications and functions. Table 7-1 summarises the
allowable ranges of data transfer time delay by classifying to monitoring, protection
and control applications within the substation. Figure 7-1 illustrates that the total
transfer time (t) of an IEC 61850 message is the sum of the IEC 61850 stack
processing time in both end IEDs (𝑡𝑎 and 𝑡𝑐) and the network transfer time (𝑡𝑏) is
represented as.
Transfer time t = 𝑡𝑎 + 𝑡𝑏 + 𝑡𝑐 (2)
This means that the data transfer time starts to count from the moment the transmitting
node sent the data content on top of the transmission stack up to the moment the
receiving node extracts the data from the transmission stack.

CHAPTER 7 PERFORMANCE EVALUATION
______________________________________________________________________________________________________________________
Page | 120
Table 7-1 IEC 61850 MESSAGE TYPES AND PERFORMANCE
Message Type Transfer Time
(msec)
Applications
1A 3 Fast Messages (Trip)
1B 20 Fast Messages (Others)
2 100 Medium Speed Messages
3 500 Low-Speed Messages
4 3 Raw Data Messages
5 1000 File Transfer Functions
Figure 7-1 Definition of transmission time (Reference form IEC 61850-5 [110])
7.3 Process Bus Performance
In this section, the process bus performance has been evaluated with different
scenarios. This assessment aims to find out the capability of the process bus network.
The capability here refers to the maximum numbers of merging units that can
interconnect within one individual bay.

CHAPTER 7 PERFORMANCE EVALUATION
______________________________________________________________________________________________________________________
Page | 121
The GOOSE messages and SV messages have similar requirements for the process
bus network, where SV is more predictable. Though GOOSE messages have a fixed
structure indicated in the Substation Configuration Description (SCD) file, to reduce
encoding and to decode overhead, Therefore, it is usually uses fixed-length fields
which means using the maximum number of octets. However, carrying out different
application functions will change the GOOSE message size which will affect the
performance of the process bus network. Similar situation in SV messages, though it
will only transmit the eight sets of values of currents and voltages, the application ID
is unique for each device or application within the substation and the length will be
different. Therefore, a few tests groups have been taken with a mixed combination of
fix or random size of GOOSE and SV messages, show as below.
7.3.1 Fixed SV and fixed GOOSE
In this scenario, the SV message packet size is using fixed value which is 133 bytes
and the sampling frequency is 4000 (t= 0.00025s). The GOOSE message packet size
is fixed as well, 600 bytes with interval time is 0.005s. Results of the end-to-end time
delay of the process bus network have been shown in Figure 7-2.
It can be easily observed from Figure 7-2 that when process bus network contains
18MUs, the end-to-end time delay is more than 3ms. It is also realized that the
18MUs have a signification increase in the time delay compared with others. The
reason behind this case is because the process bus only has one switch that contains
all the MUs and network devices, and it has a default Packet Service Rate at 500,000
packet/sec. For 18MUs scenario, the switch needs to hand 76,000 (received)
+1,525,000(forwarded) = 1,601,000 packets/sec. Therefore, for broadcasting such a
large number of packets, the time delay will constantly be accumulating.
The MUs are broadcasting the heavy SV traffic to the process bus network. Thus,
when introducing a new MU to the network, it is sending the heavy SV traffic to all
the network devices through the only switch. In this case, when the process bus
contains 18MUs, the Ethernet switch is not that efficacy enough to meet the

CHAPTER 7 PERFORMANCE EVALUATION
______________________________________________________________________________________________________________________
Page | 122
requirements. A better Ethernet switch with a strong processor, backplane bandwidth,
and greater buffer size can improve the performance of the process network.
Figure 7-2 ETE time delay for 10 MUs, 13 MUs, 17MUs, and 18MUs
Table 7-2 shows that the number of merging units in the process bus, the more MUs
connected the more bandwidth they consume. This is because the merging units are
sending heavy SV stream to main protection IED and SV messages have been sending
as multicast transmission. Thus, as the results show that 17 number of merging units
cost 90.5% of the communication link channel and the time delay is 0.17msec, which
still achieves the requirements <4ms. However, when the merging unit number
increases to 18, the bandwidth consumption is 94% and the time delay is over the
limit and rises continuously.
Table 7-2 Performance of fixed GOOSE and fixed SV
No. of MUs Utilisation ETE Time Delay
10 63.9% 0.1msec
13 70% 0.12msec
17 90.5% 0.17msec
18 94% >1s

CHAPTER 7 PERFORMANCE EVALUATION
______________________________________________________________________________________________________________________
Page | 123
7.3.2 Fixed SV with random GOOSE
In the second scenario, the SV message packet size is still using fixed value at 133
bytes, and the sampling frequency is 4000 (t= 0.00025s). For the GOOSE message
packet size, it is set up randomly within a range between the maximum 600 bytes and
minimum 150 bytes. This is being done by choosing the Predefined Distributions
supplied by OPNET, called Uniform. The interval time of the random GOOSE is
0.005s. Results of the end-to-end time delay of the process bus network have been
shown in Figure 7-3.
Figure 7-3 shows that the time delay is over 3ms when 18 MUs are connected with
the process bus. Therefore, the capability of the AS3 architecture process bus network
can be connecte to maximum of 17 numbers of merging units. It can be easily
observed that 18MUs have a signification increase in the time delay compared with
others. It is because the process bus only has one switch that contains all the MUs and
network devices, and it is has a default Packet Service Rate at 500,000 packet/sec.
Therefore, for broadcasting such a large number of packets, the time delay will
constantly be accumulating. Thus, when the process bus contains 18MUs, the
Ethernet switch does not work efficacy enough to meet the requirements.
Due to the random GOOSE stream being relatively small, the effect on the time delay
is not obvious. Table 7-3 shows that 17 number of merging units cost 89% of the
communication link channel and the time delay is 0.15msec, which can still achieve
the requirements of IEC 61850 standards less than 3ms. However, when the merging
unit number increases to 18, the bandwidth consumption is now 93.5%, the time delay
that is over the limit and rises continuously.
Similar reason as the previous scenario, in this case, the SV traffic is used the same
packet size and the GOOSE has become Stochastic. When adding 18 MUs to the
process bus network, the large amount of broadcasting SVs traffic goes over the
Ethernet switch forward ability. Therefore, the end-to-end time delay starts to
accumulate. This will change when SV traffic stops broadcasting or the network
collapses.

CHAPTER 7 PERFORMANCE EVALUATION
______________________________________________________________________________________________________________________
Page | 124
Figure 7-3 ETE time delay for 10 MUs, 13 MUs, 17MUs, and 18MUs
Table 7-3 Performance of fixed SV and random GOOSE
No. of MUs Bandwidth Utilization ETE Time Delay
10 53.5% 0.1msec
13 68.5% 0.12msec
17 89% 0.15msec
18 93.5% >0.4s
7.3.3 Random SV with fixed GOOSE
In the third scenario, the SV message packet size is a random value between the
maximum of 142 to the minimum of 118 bytes and the sampling frequency is 4000
(t= 0.00025s). The reason for choosing a random value is that the application and
devices ID are unique. Although the packet size difference between the maximum and
minimum value are only a few bits, it is still needed for comparison.
For the GOOSE message packet size, is constant 600 bytes and with interval time
0.005s. Results of the end-to-end time delay of the process bus network have been
shown in Figure 7-4. In this scenario, it can be easily observed that 18MUs have a
0
1
2
3
4
5
6
10 13 17 18
Tim
e (
mse
c)
Number of MUs
Time Delay of MUs

CHAPTER 7 PERFORMANCE EVALUATION
______________________________________________________________________________________________________________________
Page | 125
signification increase in the time delay compared with others. It is because the process
bus only has one switch that contains all the MUs and network devices, and it has a
default Packet Service Rate at 500,000 packet/sec. Therefore, for broadcasting such a
large number of packets, the time delay will constantly be accumulating. So, when the
process bus contains 18MUs, the Ethernet switch deos not have efficacy enough to
meet the requirements. Figure 7-4 shows that the time delay is over 3ms when 18
MUs are connected with the process bus. Therefore, the capability of the AS3
architecture process bus network can be connecte to maximum of 17 numbers of
merging units.
Table 7-4 shows that 17 number of merging units cost 89% of the communication link
channel and the time delay is 0.19msec, which can still achieve the requirements of
IEC 61850 standards <4msec. However, when the merging unit number increases to
18, the bandwidth consumption is 94% and the time delay is over the limit and rises
continuously.
Figure 7-4 ETE time delay for 10 MUs, 13 MUs, 17MUs, and 18MUs,
0
1
2
3
4
5
6
10 13 17 18
Tim
e (m
sec)
Number of MUs
Time Delay of MUs

CHAPTER 7 PERFORMANCE EVALUATION
______________________________________________________________________________________________________________________
Page | 126
Table 7-4 Performance of random SV and fixed GOOSE
No. of MUs Bandwidth Utilization ETE Time Delay
10 54% 0.1msec
13 68% 0.12msec
17 93% 0.19msec
18 94% >3sec
7.3.4 Random SV and random GOOSE
In this scenario, the packet size of the SV and GOOSE message has been set to be
random, which means that the SV message size is between 118 to 142 bytes and
GOOSE message size is from 150 to 600 bytes. The simulation results are shown in
Figure 7-5. It can be easily observed that 18MUs have a signification increase in the
time delay compared with others. Even with the random SV packet size, the
broadcasting of SV traffic for 18MUs is still very large. Therefore, for broadcasting
such a large number of packets, the time delay will constantly be accumulating.
Thus, when the process bus contains 18MUs, the Ethernet switch is not efficacy
enough to meet the requirements. Figure 7-5 shows that the time delay is over 3ms
when 18 MUs are connected with the process bus. Therefore, the capability of the
AS3 architecture process bus network can have connected to of a maximum of 17
numbers of merging units.
Table 7-5 has listed the simulation results and the bandwidth consumption. The time
delay for connecting 10 MUs to the process bus is 0.09msec, for connecting 13 MUs
the time delay is 0.11msec, and the time delay for connecting 17 MUs is 0.16msec.
The time delay of connected 18 MUs to the process bus is over 2 sec. Therefore, we
can be said that the maximum capability for connecting MUs to the process bus in this
scenario is 17 because when 18 MUs are connected to the process bus, the time delay
is over 4msec.
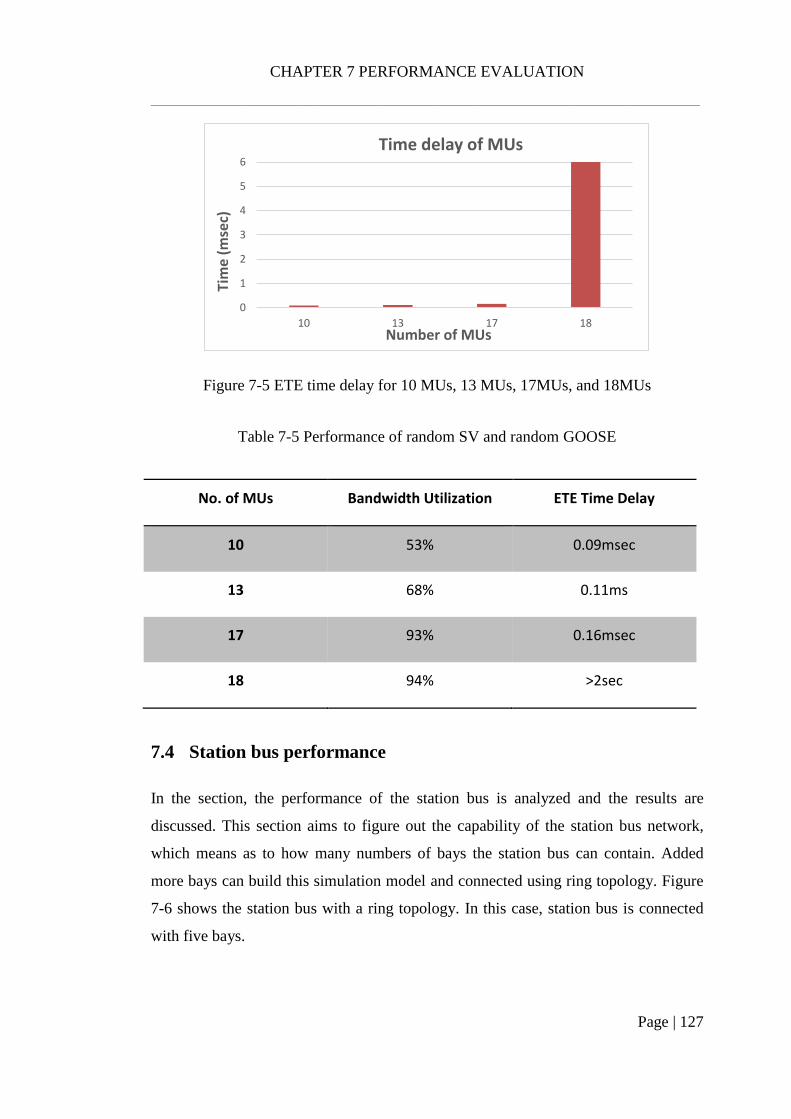
CHAPTER 7 PERFORMANCE EVALUATION
______________________________________________________________________________________________________________________
Page | 127
Figure 7-5 ETE time delay for 10 MUs, 13 MUs, 17MUs, and 18MUs
Table 7-5 Performance of random SV and random GOOSE
No. of MUs Bandwidth Utilization ETE Time Delay
10 53% 0.09msec
13 68% 0.11ms
17 93% 0.16msec
18 94% >2sec
7.4 Station bus performance
In the section, the performance of the station bus is analyzed and the results are
discussed. This section aims to figure out the capability of the station bus network,
which means as to how many numbers of bays the station bus can contain. Added
more bays can build this simulation model and connected using ring topology. Figure
7-6 shows the station bus with a ring topology. In this case, station bus is connected
with five bays.
0
1
2
3
4
5
6
10 13 17 18
Tim
e (m
sec)
Number of MUs
Time delay of MUs

CHAPTER 7 PERFORMANCE EVALUATION
______________________________________________________________________________________________________________________
Page | 128
Figure 7-6 Station bus model contains five bays using ring topology in OPNET
Figure 7-7 shows end-to-end time delay performance of different numbers of bays. As
can see from the graph, the time delay is rising when the bay number increase. It is
fluctuating more significantly, for example, the time delay of 22 bays is still within
the IEC 61850 requirements, but variations are large.
Figure 7-8 shows the time delay of 23 Bays is over the maximum transfer time limit,
i.e. the time delay of 23 bays is over 0.06s after 40 minutes. However, there is a
concern about the time delay of bay 22. It seems to approach the limits of 4msec, but
the large variations of the time delay of 22 bays need to determine if it is still
acceptable.

CHAPTER 7 PERFORMANCE EVALUATION
______________________________________________________________________________________________________________________
Page | 129
Figure 7-7 ETE time delay for 15, 18, 19, 20, 21, 22 bays in the station bus network
Figure 7-8 ETE time delay comparison of 22 bays and 23 bays
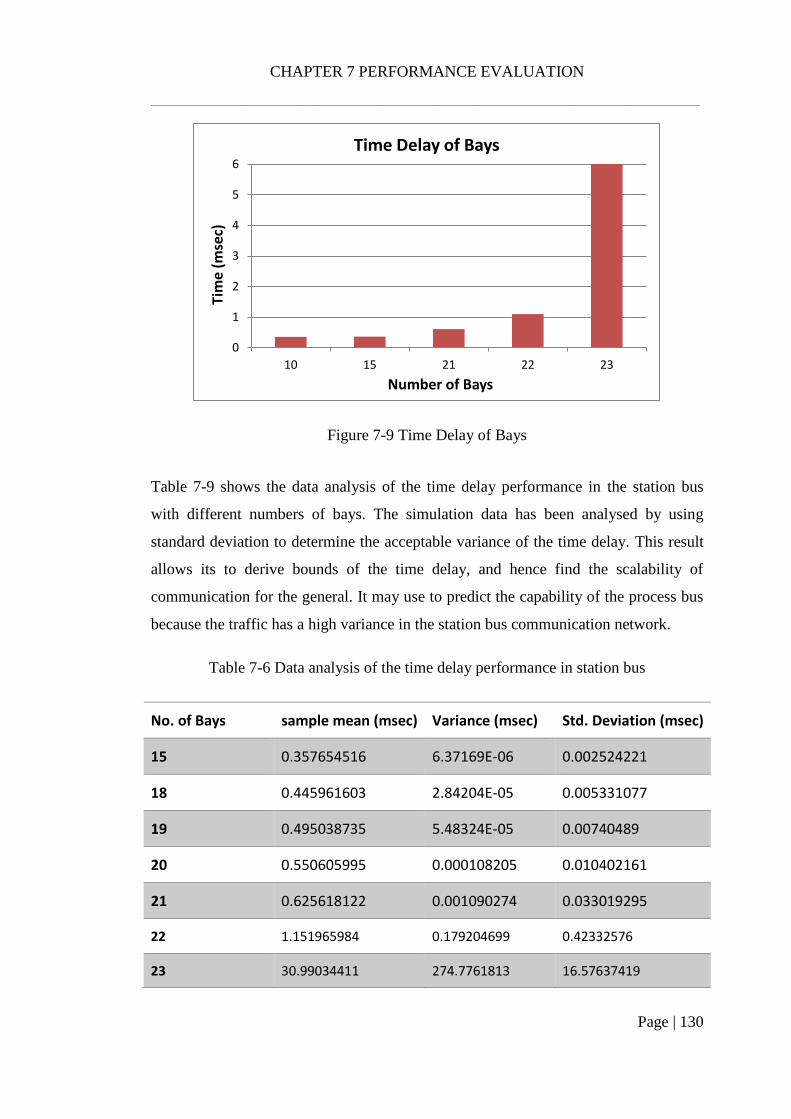
CHAPTER 7 PERFORMANCE EVALUATION
______________________________________________________________________________________________________________________
Page | 130
Figure 7-9 Time Delay of Bays
Table 7-9 shows the data analysis of the time delay performance in the station bus
with different numbers of bays. The simulation data has been analysed by using
standard deviation to determine the acceptable variance of the time delay. This result
allows its to derive bounds of the time delay, and hence find the scalability of
communication for the general. It may use to predict the capability of the process bus
because the traffic has a high variance in the station bus communication network.
Table 7-6 Data analysis of the time delay performance in station bus
No. of Bays sample mean (msec) Variance (msec) Std. Deviation (msec)
15 0.357654516 6.37169E-06 0.002524221
18 0.445961603 2.84204E-05 0.005331077
19 0.495038735 5.48324E-05 0.00740489
20 0.550605995 0.000108205 0.010402161
21 0.625618122 0.001090274 0.033019295
22 1.151965984 0.179204699 0.42332576
23 30.99034411 274.7761813 16.57637419
0
1
2
3
4
5
6
10 15 21 22 23
Tim
e (m
sec)
Number of Bays
Time Delay of Bays

CHAPTER 7 PERFORMANCE EVALUATION
______________________________________________________________________________________________________________________
Page | 131
As a result, as shown in Table 7-6, the standard deviation is increases when the mean of the
samples are increased. Identifying the 22 bays time delay performance by compared the 21
bays and 22 bays, the sample mean of 22 bays is double than that of 21 bays, and the variance
and standard deviation is much larger. Hence, to limit the time delay variance, the maximum
variance should be no more than 0.1msec for better or stable performance on station bus time
delay.
7.5 Summary
This chapter explores the requirements of IEC 61850 standard for different types of
messages. The process bus has been simulated with different number of merging units
to determine the capability of time delay performance. Moreover, the station bus has
been simulated with different number of bays to find out its capability.
CHAPTER 8 PROBABILITY STUDY
______________________________________________________________________________________________________________________
Page | 132
CHAPTER 8 Probability Study of IEC 61850-based
Substation Automation System
8.1 Introduction
This chapter presents the probability study of the IEC 61850-based substation
automation system. The simulation results have been presented and analysed.
Moreover, the laboratory investigation of IEC 61850 traffic behaviour has been
presented. Furthermore, the characteristic of MMS, GOOSE and SV traffic have been
examined by using RTDS and capture Wireshark tools. The results have been
analysed and discussed in this chapter.
8.2 Mathematical modelling of IEC 61850 SAS
In IEC 61850 standard-based digital substation network, SVs message traffics
continuous, and the SVs network load is stable. But the GOOSE traffic is either
periodic at a low rate (called “heartbeat” messages) or sporadic at high rates (4 or 5
messages sent over in few ms). GOOSE messages on a process bus are expected to be
commands from the SAS (e.g., switch open or close, circuit breaker trip or close, or
transformer tap change controls) or status updates from the high-voltage plant (e.g.,
digital indications, transduced analogue values and commanded acknowledgements).
High-rate GOOSE traffic, such as that resulting from inter-tripping, should be
restricted to the Station Bus network.
IEC 61850 message has been classified into several types based on its functionality,
such as fast message, medium speed message, low-speed message, raw data message,
file transfer function, time synchronisation message, and access control command
[110]. However, in [76] researchers have divided the IEC 61850 messages into three
types of messages that are based on their data flow characteristics in the time domain,
which are: cyclic data, stochastic data, and burst data.

CHAPTER 8 PROBABILITY STUDY
______________________________________________________________________________________________________________________
Page | 133
8.2.1 Modelling of cyclic data flow
According to the practical operating condition of power substations, there are two
types of cyclic data flow. One type is the SVs generated by MUs in substation process
level and transmitted to protection and control IEDs in substation bay level. SVs
represent time-critical information that contains large amounts of data flow and will
have an intensive influence on the SAS network. The other type is the meter values
and breaker status information transmitted from the device in bay level to the server in
station level at a certain time interval, which belongs to the cyclic type of generic
object-oriented substation event (GOOSE) message. This kind of cyclic GOOSE data
is comparatively stable and at a medium speed. Figure 8-1 shows the Generation of
data packets for cyclic data flow.
According to [76], the cyclic data can be modelled as:
𝑀𝑐 = 𝑓(𝐿𝑐 , 𝑁𝑐, 𝐷𝑐) (3)
𝑁𝑐 = 𝑓0 (4)
𝐷𝑐 = 𝑆𝑐 + 𝐸𝑐 + 𝑅𝑐) (5)
Where Lc is the size of cyclic data, which contains the frame header, address field,
data field, cyclic redundancy check field, and so on, Nc is the number of cyclic data
arriving per unit time, which numerically equals to the sampling frequency f0 of IEDs.
Dc is the time delay of a message from end to end, representing the sum of Ethernet
delay Ec, pre-treatment time of the sender Sc, and post proceeding time of the
receiver Rc.

CHAPTER 8 PROBABILITY STUDY
______________________________________________________________________________________________________________________
Page | 134
Figure 8-1 Generation of data packets for cyclic data flow[76]
8.2.2 Modelling of stochastic data flow
Stochastic data are typical event-driven data, which means that they are triggered by
accidents or unplanned events, such as the trip message when a short-circuit fault
occurs and the artificial modulation of equipment parameters. Stochastic data in
substations mainly is divided into two types, and the stochastic data flow packet
generation diagram is shown in Figure 8-2.
1) Type 1: Transformer tap modulation, switch operation message, trip message,
protection function interlocking, time synchronisation, etc. It usually has the
features of small size and short duration, while the transmission time should meet
the requirements of the fast message type.
2) Type 2: Protection setting modification, event log checking, recording to data
transmission, file transfer, and so on. Type 2 is larger and will usually cause a
sudden increase in a network flow, while the real-time requirement of
transmission is not strictly specified. Generally, stochastic data have the following
characteristics of time sequence: The packet generated in a random period with
the probability of P. The size of the packet can be fixed or time variant. There is
no correlation between the two packets arriving one after the other, which means
that the number of packets in two mutually exclusive periods is independent.
Therefore, the arrival of stochastic data has been modelled by the Poisson process.
For the period, supposing that λ is the average arrival rate of packets (number of
packets arrived per unit time), N(t) is the total number of arrived packets. The

CHAPTER 8 PROBABILITY STUDY
______________________________________________________________________________________________________________________
Page | 135
probability of k packets arrived in time interval t is following the Poisson distribution
with parameter λ, can be defined as follows [76]:
𝑃{𝑁(𝜏 + 𝑡) − 𝑁(𝜏) = 𝑘} =(𝜆𝑡)𝑘𝑒−𝜆𝑡
𝑘! (6)
Figure 8-2 Generation of data packets for the stochastic data flow [76]
8.2.3 Modelling of burst data flow
During a random time, burst data are not only generated with the probability of λ but
also dependent on the previously occurred events. Burst data mainly contain
information about protection actions and the changing status of breakers, which
belong to the GOOSE message as well. When a fault occurs, the protection device
acts, and then, the transmission rate of GOOSE message is changed from cyclic mode
to burst mode, which consequently, generates burst data flow.
Burst data will cause a large data amount on the network in a short period, and the
network will be quiet for a long period after the transmission of burst data traffic. This
type of data flow has the characteristics with long-range dependency and self-
similarity (presents the same burstiness at different time scales). Researchers have
proven that the heavy-tailed distribution and the ON/OFF model can be used to
describe the self-similarity of network data flow [86, 87, 89-91]. For the On/OFF
model, it assumes the data source changes repeatedly between sending and stop
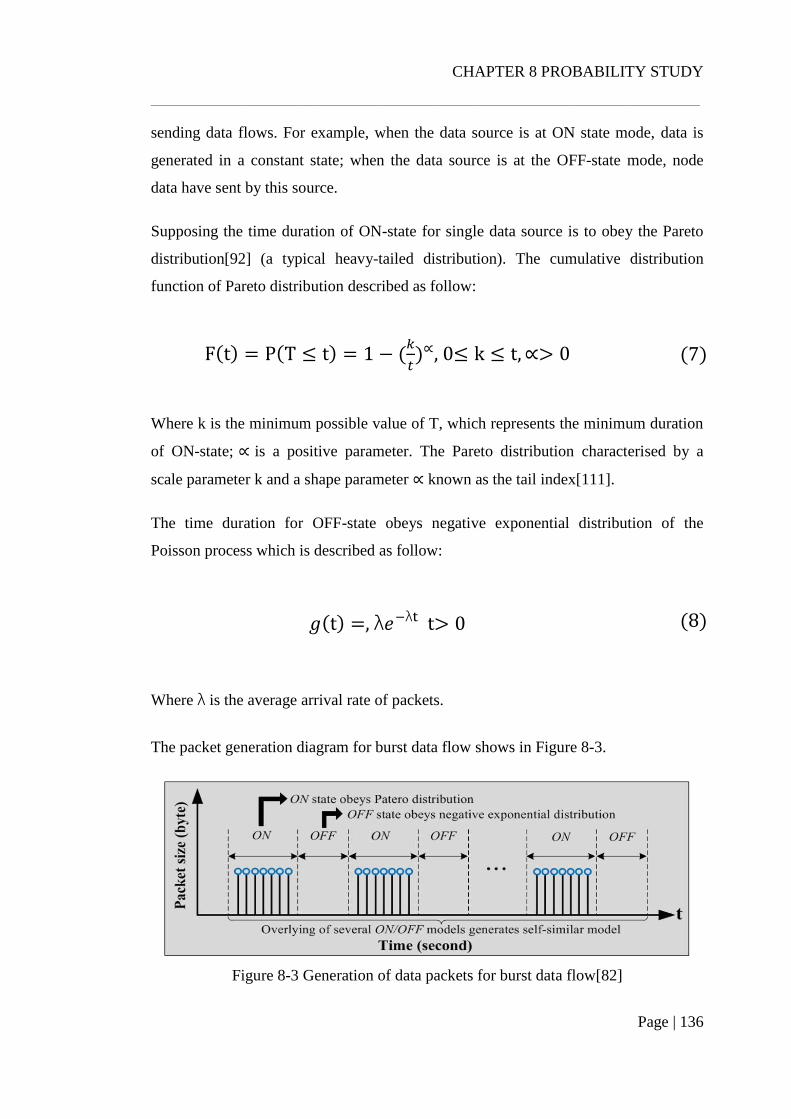
CHAPTER 8 PROBABILITY STUDY
______________________________________________________________________________________________________________________
Page | 136
sending data flows. For example, when the data source is at ON state mode, data is
generated in a constant state; when the data source is at the OFF-state mode, node
data have sent by this source.
Supposing the time duration of ON-state for single data source is to obey the Pareto
distribution[92] (a typical heavy-tailed distribution). The cumulative distribution
function of Pareto distribution described as follow:
F(t) = P(T ≤ t) = 1 − (𝑘
𝑡)∝, 0≤ k ≤ t, ∝> 0 (7)
Where k is the minimum possible value of T, which represents the minimum duration
of ON-state; ∝ is a positive parameter. The Pareto distribution characterised by a
scale parameter k and a shape parameter ∝ known as the tail index[111].
The time duration for OFF-state obeys negative exponential distribution of the
Poisson process which is described as follow:
𝑔(t) =, λ𝑒−λt t> 0 (8)
Where λ is the average arrival rate of packets.
The packet generation diagram for burst data flow shows in Figure 8-3.
Figure 8-3 Generation of data packets for burst data flow[82]

CHAPTER 8 PROBABILITY STUDY
______________________________________________________________________________________________________________________
Page | 137
8.3 Data flow analysis in a substation
According to the mathematical models described in section 8-2, a detailed analysis of
data flow for atypical substation has been shown as follow. In the typical SAS
network, there are three types of IEDs: Merging Unit IEDs, Circuit Breaker Controller
IEDs and Protection and Control (P&C) IEDs. The selected model network is a
National Grid’s transmission substation which is a 400kV (double bus-bar) substation.
Figure 8-4 illustrates the single-line diagram (SLD) and physical bays of the
substation, which consists of one bus section bay, two bus coupler bays, two
transformer bays, and six feeder bays.
Figure 8-5 shows the SAS network architecture. The ring topology is used to connect
all bay switches for the station bus, and each IED connected to the bay switch as star
topology within each bay. The transformer bays and feeder bays model has two
protection and control IEDs, one backup IED and one bay controller IED. The bus
section bay and bus coupler bay have one main protection IED, one backup IED and
one bay controller IED. It also includes Engineering PC and HMI located in the local
control room. All the nodes are connected with layer three switches in the ring
topology by 100Mbps Ethernet links.
Figure 8-4 Single-line diagram of the National Grid 400kV substation

CHAPTER 8 PROBABILITY STUDY
______________________________________________________________________________________________________________________
Page | 138
Figure 8-5The SAS network architecture
8.4 Simulation and analysis
In this study, different MMS update rate have been applied to test the SAS network
performance using OPNET. Results can be viewed and collected after finish the
simulation. OPNET is allowed for collecting the results to generate the web report.
The results are collected and analysed to derive different graphs with are shown in the
following sections.
8.4.1 Scenario 1
In this scenario, each bay has been configured to have 4 IEDs which are the MU,
CBC, IED and Bay control. As shown in Figure 8-5.
HMI and Engineering are sending MMS requests to IEDs, and each IED has separate
connections for each of them. The MMS traffic generated by the proposed IEC 61850
MMS model has been introduced in the previous section. For, scenario 1, the cyclic
MMS message has an update rate for 1 per second.

CHAPTER 8 PROBABILITY STUDY
______________________________________________________________________________________________________________________
Page | 139
Table 8-1 summaries the five types of messages transmitted in the SAS network. The
SVs messages sent by MU and transmitted to the P&C IEDs classified as the cyclic
data. The SVs traffic is deterministic which is transmitted at a certain rate; in this
study this is 4800 samples per system cycle, and the packet size of the SV message
defined as 200 bytes. P&C IEDs and CBC IEDs are constantly sending the meter
values and breaker status information to the HMI server with a certain rate. These
messages are mapped to the MMS protocol and control by the TCP/IP and classified
as cyclic data as well. The MMS packet size is defined as 145 bytes.
P&C IEDs will send the GOOSE tripping signal to the CBC IED when the fault
occurs in the system. These GOOSE trip messages are classified as stochastic data
which have a small size and short transmission period, and the packet size is set to
125 bytes. The arriving messages have been set to obey the Poisson distribution with
λ=500, which means the average time interval between two GOOSE trip message is
1/λ=2 msec. Moreover, the HMI will send a large amount of data to the Engineering
PC located in the substation local control room. These data files have sent by the file
transfer protocol (FTP) and the FTP message has been classified as stochastic data
flow as well. The single FTP message packet size is set as 1000 bytes and the interval
time of the arriving packets is to obey the exponential distribution with 1/λ=1 msec.
Therefore, the average transmission rate for the FTP is 8Mb/sec.
The CBC IED will send the GOOSE message to the corresponding P&C IED and
HMI after open/close the circuit breaker. This kind of GOOSE message classified as
burst data. For the ON-state of burst data, it obeys the Pareto distribution with
parameters of k = 512 μs and α = 1.1, and the OFF-state has obeyed the Poisson
distribution with λ = 263.16. Therefore, the trip GOOSE message packet size is
144bytes and the arriving time interval is 0.1 msec.
Meanwhile, the P&C IED will also update the circuit breaker status to the HMI. This
kind of GOOSE message is known as meter values and breaker status which has
cyclic data with the typical packet size of 145 bytes.

CHAPTER 8 PROBABILITY STUDY
______________________________________________________________________________________________________________________
Page | 140
Table 8-1 Summary of data flow in the SAS network for Scenario 1
Message type Source Destination Data type Packet
size(bytes)
SVs MU P&C IED Cyclic data 200
Meter values and
breaker status
P&C IED
CBC IED HMI Cyclic data 145
Trip signals P&C IED CBC IED Stochastic
data 125
GOOSE CBC IED P&C IED Burst data 144
FTP file transfer HMI Engineering
PC
Stochastic
data 1000
The simulation results of Scenario 1 have been shown in Figure 8-6 and Figure 8-7.
As Figure 8-6 shows, the station bus time delay for 21 bays has increased
significantly than that for 20 bays which is over 3ms. This is because when the station
bus contains 21 bays, the switches become much less efficiency. So, a large amount
of packet has been forwarded quick enough and getting accumulate. Therefore, in this
scenario, only 20 bays can be connected to the station bus.
For the MMS update rate at 1/s, the time delay of the station bus which consists 21
bays has clearly over maximum three milliseconds delay time of GOOSE message.
Hence, apply the rate control method to the 21 bays case to determine the maximum
acceptable update rate (or interval time) for this scenario.

CHAPTER 8 PROBABILITY STUDY
______________________________________________________________________________________________________________________
Page | 141
Figure 8-6 Time Delay on the station bus in Scenario 1 with 1/s Update Rate
In scenario 1, the research has also applied the rate control method to the station bus
which contains 21 bays. In this way, it can help the design engineer to determine the
maximum update rate of integrity reports. In this case, the interval time of integrity
reports has been used to represents the update rate. The results of different interval
time have shown in Figure 8-7.
As Figure 8-7 shows, when the MMS update rate has been slow down the 1.65
seconds, it can meet the 3ms requirements. Therefore, the maximum interval time to
update the integrity report can set in 1.65 seconds.
Figure 8-7 End-to-end Time Delay of Station bus in Scenario 1

CHAPTER 8 PROBABILITY STUDY
______________________________________________________________________________________________________________________
Page | 142
8.4.2 Scenario 2
In this scenario, each bay of the station bus consists of 3 IEDs, and each of the IED
has connections between HMI and Engineering PC respectively. This means that for
every individual bay, it will only contain three IEDs which are the MU, CBC, and
Protection IED. The reason to have different IED configuration in each bay is to find
out how much it can affect the performance of the SAS network. Therefore, when
designing the SAS network, a system designer can have a reference.
HMI and Engineering have been sending MMS requests to IEDs, and each IED has
separate connections for each of them. The MMS traffic generated by the proposed
IEC 61850 MMS model was introduced in the previous section. For, scenario 1, the
cyclic MMS message has an update rate for 1 per second.
Table 8-2 summaries the five types of messages transmitted in the SAS network. The
SVs messages sent by MU and transmitted to the P&C IEDs classified as the cyclic
data. The SVs traffic is deterministic as which to transmitted at a certain rate, in this
study is 4800 samples per system cycle, and the packet size of the SV message
defined as 200 bytes. P&C IEDs and CBC IEDs are constantly sending the meter
values and breaker status information to the HMI server with a certain rate. These
messages are mapping to the MMS protocol and control by the TCP/IP and classified
as cyclic data as well. The MMS packet size defined as 145 bytes.
Protection IEDs (only one IED has been applied to protect the bay in this scenario)
will send the GOOSE tripping signal to the CBC IED when the fault occurs in the
system. These GOOSE trip messages are classified as stochastic data which have a
small size and short transmission period, and the packet size set to 125 bytes. The
arriving messages have been set to obey the Poisson distribution with λ=500, which
means the average time interval between two GOOSE trip message is 1/λ=2 msec.
Moreover, the HMI will send a large amount of data to the Engineering PC located in
the substation local control room. These data file sent by the file transfer protocol
(FTP) and the FTP message has been classified as stochastic data flow as well. The
single FTP message packet size set as 1000 bytes and the interval time of the arriving

CHAPTER 8 PROBABILITY STUDY
______________________________________________________________________________________________________________________
Page | 143
packets is to obey the exponential distribution with 1/λ=1 msec. Therefore, the
average transmission rate for the FTP is 8Mb/sec.
The CBC IED will send the GOOSE message to the corresponding Protection IED
and HMI after open/close the circuit breaker. This kind of GOOSE message classified
as burst data. For the ON-state of burst data, it obeys the Pareto distribution with
parameters of k = 512 μs and α = 1.1, and the OFF-state has obeyed the Poisson
distribution with λ = 263.16. Therefore, the packet size of the trip GOOSE message is
144bytes and the arriving time interval is 0.1 msec.
Meanwhile, the Protection IED will also update the circuit breaker status to the HMI.
This kind of GOOSE message known as meter values and breaker status which has
cyclic data with a typical packet size of 145 bytes.
Table 8-2 Summary of data flow in the SAS network for Scenario 2
Message type Source Destination Data type Packet
size(bytes)
SVs MU Protection IED Cyclic data 200
Meter values and
breaker status
Protection IED
CBC IED HMI Cyclic data 145
Trip signals Protection IED CBC IED Stochastic
data 125
GOOSE CBC IED Protection IED Burst data 144

CHAPTER 8 PROBABILITY STUDY
______________________________________________________________________________________________________________________
Page | 144
FTP file transfer HMI Engineering
PC
Stochastic
data 1000
The simulation results of Scenario 2 have been shown in Figure 8-8 and Figure 8-9.
As Figure 8-8 shows, the station bus time delay for 28 bays has increased
significantly than that for 27 bays which is over 3ms. This is because when the station
bus contains 28 bays, the number of packets that require to be transferred by the
switches have increased to a very high level. These switches’ packet service rate is not
able to handle such a large amount of traffic. So, the transfer time has arrvied a delay
and continuously accumulate. Therefore, in scenario 2, only 27 bays can be connected
to the station bus and meet the requirements of 3 ms delay.
The simulation results of the end-to-end time delay for this scenario have been shown
in Figure 8-8 and 8-9. As Figure 8-8 shows, the update rate of the integrity reports is
defined as once per second (1/s). Therefore, the station bus which contains 27 bays
has delay time around 1ms and approaching a stable status. However, the time delay
of the station bus which contains 28 bays is clearly over the 3ms requirement.
Therefore, the maximum number of bays can be contained in the station bus using 3
IED standard bay solution is 27 bays.
Figure 8-8 Station Bus Time Delay of Scenario 2 with 1/s Update Rate

CHAPTER 8 PROBABILITY STUDY
______________________________________________________________________________________________________________________
Page | 145
For the MMS update rate at 1/s, the time delay of the station bus which consists 28
bays has clearly over maximum 3ms delay time of GOOSE message. Hence, the rate
control method to the 28 bays case to determine the maximum acceptable update rate
(or interval time) for this scenario is applied.
The rate control method to the 28 bays station bus design to determine the maximum
update rate of MMS messages for this scenario is applied. In this case, the interval
time of integrity reports has been using to represents the update rate. As Figure 8-9
shows, when the MMS update rate is 1.65 second it meets the performance
requirements. So, the quickest update rate for scenario 2 is 1.65s.
Figure 8-9 End-to-end Time Delay of Station Bus in Scenario 2
8.5 Laboratory Investigation of IEC 61850 traffic Behaviour
This research was performed to study the IEC 61850 traffic behaviour based on the
laboratory setup. The traffic characteristics of SAS network with a large number of
data sources are unknown (the content is known, but the timing characteristics are
not), and this has been identified as an issue when dealing with other aspects of
0
0.001
0.002
0.003
0.004
0.005
0.006
0
15
30
45
60
75
90
10
5
12
0
13
5
15
0
16
5
18
0
19
5
21
0
22
5
24
0
25
5
27
0
28
5
30
0
Eth
ern
et T
ime
Del
ay (
sec)
Time (sec)
Rate Control
1.5 second
1.6 second
1.65 second
1.7 second

CHAPTER 8 PROBABILITY STUDY
______________________________________________________________________________________________________________________
Page | 146
substation automation. Therefore, it is necessary to identify the traffic characteristics
of the SAS network in the ‘real-world’ conditions.
This study is utilised by the National Grid VSATT platform to investigate the IEC
61850 traffic behaviours. The phase-to-phase and phase-to-ground faults can be
simulated by the RTDS in order to perform the different protection schemes. The data
flow of IEC 61850 messages in both normal system operating conditions and fault
conditions have been captured and analysed using the Wireshark network analysis
tool [112].
8.5.1 Experiment Setup
This section introduces the laboratory setup configuration to investigate the data flow
behaviour of the IEC 61850 messages, such as GOOSE, SVs and MMS. A closed-
loop test platform has been developed by connecting the Real Time Digital Simulator
(RTDS), AMUs, DMUs (or circuit breaker controller called by other vendors), power
amplifiers, Ethernet Switches, Relays and Global Positioning System (GPS) clocks.
Figure 8-10 shows the single line diagram of the substation model which consists of
two feeder bays and on bus coupler bay. Figure 8-11 illustrates the overall test
platform and the detail connection of all protection and control devices.
The RTDS provides the simulation of the primary plants and generates the analogue
signals of voltage and current. These analogue signals are amplified via the power
amplifiers and then sent to the Merging Units (MUs). MUs will digitise the voltage
and current signals in the IEC61850 9-2LE SV format and sent the SVs messages to
the MP1 (differential relay), MP2 (distance relay) and BCU through the process bus.
These protection and control IEDs will process the SVs messages and send the
appropriate GOOSE message to subscribers, such as the IEDs and DMU. All the
protection and control IEDs are connected by the station bus with the HMI system. A
master clock has been applied to provide the time synchronised signals, such as one
pulse per second (1-PPS) or IRIG-B, for all the equipment.

CHAPTER 8 PROBABILITY STUDY
______________________________________________________________________________________________________________________
Page | 147
Fibre-optic cables are used to connect all the devices in both process bus, and station
bus/ The Wireshark network analysis tool [113] is applied in this research to capture
all the data flows in the SAS network.
Figure 8-10 Single line diagram of the substation model

CHAPTER 8 PROBABILITY STUDY
______________________________________________________________________________________________________________________
Page | 148
Figure 8-11The RTDS test platform
Notes: MP1: differential relay, MP2: distance relay, BCU: bay control unit (includes
breaker failure protection and delayed automatic reclose functions), DMU: referred to
circuit breaker controller, AMU: referred to merging units
8.5.2 Case Study 1: Breaker Failure Protection Scenario
Breaker failure protection is a backup protection system which has been designed to
operate when the primary protection system fails to trip the circuit breaker to clear a
fault in the required time. The breaker failure protection can prevent the expansion of
the accidents which cause the un-normal operation of the circuit breaker. The backup
protection can collect the substation area information, including the currents and

CHAPTER 8 PROBABILITY STUDY
______________________________________________________________________________________________________________________
Page | 149
voltages of local electric elements; each circuit breaker’s switching status and main
protection’s action situation.
In this study, a phase-to-ground fault has been applied at the mid-point of the
transmission Feeder line (Feeder 1) shown in Figure 8-10. When the fault occurs, the
Main one protection (MP1) in the Bay 1 has detected the fault and sent GOOSE trip
messages to DMU 1 to trip the circuit breaker. However, to perform the circuit
breaker failure protection, this circuit breaker within the Bay1 has failed to operate.
Therefore, the BCU1 sent to the GOOSE message to the BCU2 within the adjacent
Bay2 to trip the corresponding circuit breaker.
Table 8-3 lists the detailed data flow for the breaker failure protection scenario within
the process bus 1, process bus 2 and station bus. The information to be exchanged for
substation breaker failure protection (RBRF) and interlocking is the following as
below:
1) Within Bay 1:
Bay Control Unit (BCU, includes breaker failure protection), Main protection 1 (Main
1, differential relay), and Main protection 2(Main 2, distance relay) send GOOSE to
their subscribers at heartbeat rate and MMS to the HMI. Both Main 1, Main 2 will
send GOOSE trip message to the circuit breaker when a fault occurs. Each Merging
Units (MUs) sent Sampled Values (SVs) to the protection relays (Main 1 and Main 2)
and BCU.
2) From the Bay 1 to the Bay 2:
When the circuit breaker fails to respond the GOOSE trip signal, the BCU within the
failure bay will send GOOSE message to the Back-trip into IEDs (e.g. Main 1, Main 2
and BCU) in other bays. In this case, BCU within NR bay will send GOOSE trip
message to IEDs in the GE bay to trip the associative circuit breaker.
Table 8-3 Data flow for Case Study 1, Breaker Failure Protection

CHAPTER 8 PROBABILITY STUDY
______________________________________________________________________________________________________________________
Page | 150
Event Sequence Source TX Sink
MP1
detects
faults
1 MP1 PB1 GOOSE
Trip DMU1 trips CB
2 MP1 SB GOOSE
MP2 cross-trip
BCU – for Delayed
Auto Reclose
(DAR)
3 MP1 SB MMS HMI – alarm
reported via MMS
4 DMU1 (Plant
Status) PB1 GOOSE MP1 & BCU
5 DMU2 (Plant
Status) PB2 GOOSE MP2
6 BCU SB MMS HMI – status
update
7 DAR in BCU PB2 GOOSE
Close DMU2 recloses CB
Breaker
Failure
Protectio
n (RBRF)
in BCU
1 BCU SB GOOSE
Back-trip into IEDs
(e.g. MP1, MP2 or
BUP) in other bays.
2 BCU SB MMS HMI - alarm
3 3rd party bay PB GOOSE 3rd party bay DMU

CHAPTER 8 PROBABILITY STUDY
______________________________________________________________________________________________________________________
Page | 151
IED Trip
4 3rd party bay
DMU
PB GOOSE
(Plant Status) 3rd party bay BCU
5 3rd party bay
BCU
SB MMS (or
GOOSE)
HMI – status
update
Figure 8-12 GOOSE message sent from MP1 during steady-state and fault event
Figure 8-12 shows the GOOSE message sent from the MP1which captured using
Wireshark. During steady-state, the first two GOOSE message is the cyclic heartbeat
rate with an interval time of one second. When the fault occurs, Main1 protection
starts to send the GOOSE trip messages and repeated after two milliseconds, four
milliseconds, eight milliseconds etc. Before returning to cyclic operation, MP1 send
the GOOSE messages again at the end of the fault. Compare the results to Figure 8-13
which shows the GOOSE sent by MP2; it shows that the GOOSE traffic has total
different characteristic then MP 1. This is because the functions it contains is different
from MP1. Both MP 1 and MP 2 are from the same supplier.
Figure 8-13 GOOSE messages send by MP2

CHAPTER 8 PROBABILITY STUDY
______________________________________________________________________________________________________________________
Page | 152
8.5.3 Case Study 2: Differential protection scenario
The differential protection scheme has advantages such as immunity to voltage
variations, ability to operate without prior knowledge of the fault levels etc. the
differential protection requires the communication links between two terminals must
have very low latency because in differential protection the measurements received
from another terminal/end of transmission line via communication link are compared
with local measurements. The measurements made at both ends of the transmission
line must be standardised. And the performance of the communication link must be
highly reliable and must be uninterrupted one.
A phase-ground fault has been applied to feeder line the, both instant fault (which last
0.3 seconds) and permanent fault (which last 30 seconds) has been tested and
recorded respectively. Wireshark has been used to capture the data flow in both
station bus and process bus.
In this case, only one bay is used. Therefore subscriber of MP1 is MP2 and BCU,
MP2 has subscribers of MP1 and BCU, and BCU has subscribers of MP1 and MP2.
From the results, in test 1 (instant fault) MP1 has sent the GOOSE message to trip the
circuit breaker, and the BCU has reclosed the circuit breaker after a few seconds.
Figure 8-14 has shown the results of data flow from the process bus during the fault
event. As it can be seen, MP1 has sent the GOOSE trip message when a fault occurs,
and the GOOSE message rate has changed again after 0.3 sec.
Figure 8-14 GOOSE sent from MP 1, instant fault

CHAPTER 8 PROBABILITY STUDY
______________________________________________________________________________________________________________________
Page | 153
Table 8-2 listed the detailed data flow for the differential protection scenario within
the process bus 1 and station bus. The information to be exchanged in this scenario is
summarised as below:
1) Within Bay 1:
Bay Control Unit (BCU, includes breaker failure protection), Main protection 1 (Main
1, differential relay), and Main protection 2(Main 2, distance relay) send cyclic
GOOSE to their subscribers at heartbeat rate and MMS to the HMI. Both Main 1,
Main 2 will send GOOSE trip message to the circuit breaker when a fault occurs.
Each Merging Units (MUs) sent Sampled Values (SVs) to the protection relays (Main
1 and Main 2) and BCU.
In test 2, the fault has been set as a permanent fault which lasts 30 seconds. The
reason for this is to try to record the operation when BCU try to reclose the circuit
breaker during the fault on both process bus and station bus).
Table 8-3 MP 1 data flow
Event Sequence Source TX Sink
MP1 detects
faults
1 MP1 PB1 GOOSE
Trip DMU1 trips CB
2 MP1 SB GOOSE
MP2 cross-trip
BCU – for Delayed
Auto Reclose (DAR)
3 MP1 SB MMS HMI – alarm
reported via MMS
4 DMU1 (Plant
Status) PB1 GOOSE MP1 & BCU

CHAPTER 8 PROBABILITY STUDY
______________________________________________________________________________________________________________________
Page | 154
5 DMU2 (Plant
Status) PB2 GOOSE MP2
6 BCU SB MMS HMI – status update
7 DAR in BCU PB2 GOOSE
Close DMU2 recloses CB
Figure 8-15 shows the results of data flow from the process bus during the fault event.
From the results, in the process bus, MP1 has sent the cyclic GOOSE at the beginning,
and when a fault occurs, they start to burst the GOOSE and repeat after two
milliseconds, four milliseconds, eight milliseconds etc. and then back to cyclic
operation. After 20 sec, it received the automatic reclose (DAR) signal from BCU and
then sent GOOSE trip to reclose the circuit breaker. The BCU has been set to reclose
the circuit breaker in 20 seconds as the default.
Figure 8-15 GOOSE sent from MP 1, permanent fault
8.6 Summary
This chapter investigated the requirements of IEC 61850 standard for different types
of messages. The process bus has been simulated with different numbers of merging
units to determine the capability of time delay performance. The station bus has been
simulated with different numbers of bays to find out the capability. The next chapter
will provide the conclusion of the report and the future work of the research.

Chapter 9 CONCLUSION
______________________________________________________________________________________________________________________
Page | 155
CHAPTER 9 CONCLUSIONS
This chapter summarises the research studies and discusses possible future work plans.
9.1 Conclusions
This research focuses on addressing the major technical challenges related to the
IEC61850-based substation automation system. The conclusions and the specific
research outcomes of the research work are discussed as follows.
The thesis first introduces the background of the power substation automation system
and its communication system in chapter 1. The issues of substation automation have
been described in detail. In 2003, IEC TC 57 working group 10 published the IEC
61850 which can provide interoperability between multi-vendor IEDs. However, the
performance of the IEC 61850-based substation automation system is largely
unknown. Therefore, the main purpose of this research is to evaluate the dynamic
performance of the SAS and improve the performance using data flow control method.
Critical reviews of existing data flow control methods in a digital substation, and the
current status on the research of substation automation and real-time networks
technologies have been carried out in chapter 2. From the literature, the performance
evaluation of the IEC 61850-based substations research can be found in three main
approaches: analytical studies, experimental studies, and simulation approach based
on network simulation tools.
The analytical method does not consider behaviour protocols and applications. The
experimental approach normally can only have a limited number of process bus and
station bus network, since the realistic experimental setup of a large SAS
communication network can be very expensive in a laboratory environment. Thus, a
simulation environment is necessary which can provide a more effective solution that
allows the large network to be simulated. However, the problem of the simulation
method is that the accuracy of the simulation results is dependent on the degree of

Chapter 9 CONCLUSION
______________________________________________________________________________________________________________________
Page | 156
matching between the models and their actual behaviour in real-life cases or practice.
Many studies do not follow the IEC 61850 standard where the packets size and the
sampling rate are not relevant. Moreover, some researchers have presented the use of
traffic control technologies to improve the dynamic performance of a substation
communication network, such as multicast filtering, VLAN and priority queuing
method. Based on these concepts, this research has proposed a method to improve the
dynamic performance of the IEC 6180-based SAS network using priority queueing
method.
The proposed method utilises the queueing theory in the local switches in the Ethernet
to provide the priority queueing services for the time-critical messages in the SAS
network. In this research work, the proposed data flow control method has been
applied to the substation automation system network and compare it with two
alternative methods.
The detail of each contribution is summarised as follows:
1) Comparison study and capacity assessment of data flow control methods
To investigate the performance of priority queueing method and difference
between alternative methods, a comparison study has been carried out. The
studies are based on a real UK National Grid 400kV substation automation
system network. The priority queueing method has been applied to the SAS
network as well as the FIFO and WFQ methods. The comparison studies
demonstrate that priority queueing method can improve the dynamic performance
of the SAS network compared with FIFO and WFQ in varies scenarios. The
capacity assessment has also indicated that, under certain network conditions, the
maximum capacity of that substation automation network can connect to 11 bays
by using FIFO queueing method, it can connect 14 bays by using WFQ method,
and 16 Bays by using priority queuing method.
2) Performance evaluation of AS3 architecture and capability assessment
The performance of the AS3 architecture is evaluated by using a typical double
bus bar substation. Using the OPNET simulation tool. The dynamic models of

Chapter 9 CONCLUSION
______________________________________________________________________________________________________________________
Page | 157
IEC 61850 based process bus, station bus, and communication protocols are
developed to analyse the delay for GOOSE messages by considering various
network scenarios. The capability assessment of the process bus and station bus
network has been carried out.
3) Probability study and laboratory investigation of IEC 61850 traffic
behaviour
The probability study of IEC 61850-based substation automation system is
carried out by using mathematical models to generate the IEC 61850 messages.
The detail modelling of cyclic data, burst data, and stochastic data have been
described. The mathematical models have been applied to a typical 400kV double
bus bar substation. The simulation results show that when MMS has an update
rate of one per second. The maximum bays it can contain in a SAS network is 20
bays. Laboratory investigation of IEC 61850 traffic behaviour has been carried
out based on the National Grid VSATT platform. The phase-to-phase and phase-
to-ground faults can be simulated by the RTDS to perform the different
protection schemes. The data flow of IEC 61850 messages in both normal system
operating conditions and fault conditions have been captured and analysed using
the Wireshark network analysis tool.
9.2 Suggestion for Future Work
This research project has concentrated on the necessary investigations of the
implementation of the data flow control method and performance evaluation. Further
studies can be carried out to improve some aspects of the proposed data flow control
method and the performance evaluation or the probability studies using different
probability distribution models.
Data flow control
More data flow control method is available to be used to improve the overall
performance of the IEC 61850 substation automation system. Optimum protection

Chapter 9 CONCLUSION
______________________________________________________________________________________________________________________
Page | 158
and automation functions allocation considering Logical Nodes (LNs) proposed by
IEC 61850 can be obtained using optimisation techniques. This work can utilise the
flexibility of function allocation proposed in IEC 61850 standard to devise different
optimum process bus architectures.
Performance evaluation
This research work has been used to evaluate the performance of AS3 architecture.
However, this architecture has considered network redundancy using two parallel
process bus networks. The integration of Parallel Redundancy Protocol (PRP) and
High-availability Seamless Redundancy (HSR) with Red box or even Quad box
which has four ports within one switch can have different dynamic performance.
Probability distribution models
Development of new or enhancement of existing digital protection functions can be
carried out using the developed IEC 61850-9-2 laboratory facilities. The
implementation of state-of-the-art process bus lab can open up a vast range of
opportunities for new developments in this area. Fault-tolerant time synchronisation
techniques can study for IEC 61850 based substation communication networks, and
developed process bus laboratory can also use for this evaluation. The ongoing work
in the area of IEEE 1588 based time synchronisation is to create synchronisation with
at least N-1redundancy.
Optimum protection and automation functions allocation considering Logical Nodes
(LNs) proposed by IEC 61850 can be obtained using optimisation techniques. This
work can utilise the flexibility of function allocation proposed in IEC 61850 standard
to devise different optimum process bus architectures.

REFERENCES
______________________________________________________________________________________________________________________
Page | 159
REFERENCES
[1] IPCC, "Summary for Policymakers. In: Climate Change 2007: The Physical
Science Basis.," EXIT Contribution of Working Group I to the Fourth
Assessment Report of the Intergovernmental Panel on Climate Change,
Solomon, S., D. Qin, M. Manning, Z. Chen, M. Marquis, K.B. Averyt, M.
Tignor and H.L. Miller (eds.), CAMBRIDGE UNIVERSITY PRESS,
Cambridge, United Kingdom and New York, NY, USA,2007.
[2] IPCC, "Climate change 2013: the physical science basis," Working Groups I
& II, Intergovernmental Panel on Climate Change, Cambridge University
Press,Cambridge, UK, and New York, NY, USA, 2013.
[3] The Kyoto protocol [Online]. Available:
http://unfccc.int/kyoto_protocol/items/2830.php
[4] The Paris Agreement [Online]. Available:
http://unfccc.int/paris_agreement/items/9485.php
[5] U. K. Parliament, "Climate Change Act 2008," The Stationery Office Limited,
London, 2008.
[6] IPCC, "IPCC Special Report on Renewable Energy Sources and Climate
Change Mitigation. Prepared by Working Group III of the Intergovernmental
Panel on Climate Change,O. Edenhofer, R. Pichs-Madruga, Y. Sokona, K.
Seyboth, P. Matschoss, S. Kadner, T. Zwickel, P. Eickemeier, G. Hansen, S.
Schlömer, C. von Stechow (eds)," Cambridge University Press, Cambridge,
United Kingdom and New York, NY, USA, 1075 pp. (Chapter 9)2011.
[7] N. Statistics, "2015 UK GREENHOUSE GAS EMISSIONS, FINAL
FIGURES," Department for Business, Energy & Industrial Strategy, London,
UK, 2017.
[8] C. o. C. Change, "Meeting carbon budgets - 2014 progress report to
Parliament ", ed: [Online]. Available:
http://www.theccc.org.uk/publication/meeting-carbon-budgets-2014-progress-
report-to-parliament/, London Jul. 2014.
[9] U.S. Energy Information Administration, International Energy Outlook 2017
[Online]. Available: https://www.eia.gov/outlooks/ieo/index.php
[10] Y. Seung-Ho, Y. Hyo-Sik, A. Yong-Ho, and K. Yong-Hak, "Performance
analysis of IEC 61850 based substation," in 2012 14th International
Conference on Advanced Communication Technology (ICACT), 2012, pp.
854-858.
[11] T. Sauter and M. Lobashov, "End-to-End Communication Architecture for
Smart Grids," IEEE Transactions on Industrial Electronics, vol. 58, no. 4, pp.
1218-1228, 2011.
[12] V. C. Gungor et al., "A Survey on Smart Grid Potential Applications and
Communication Requirements," IEEE Transactions on Industrial Informatics,
vol. 9, no. 1, pp. 28-42, 2013.
[13] G. Kienesberger, E. Xypolytou, J. Marchgraber, T. Kaufmann, A.
Prostejovsky, and M. Faschang, "Agent-based decentralization of applications

REFERENCES
______________________________________________________________________________________________________________________
Page | 160
in distributed smart grid systems," in 2015 International Symposium on Smart
Electric Distribution Systems and Technologies (EDST), 2015, pp. 271-277.
[14] P. Ferrari, A. Flammini, M. Loda, S. Rinaldi, D. Pagnoncelli, and E. Ragaini,
"First experimental characterization of LTE for automation of Smart Grid," in
2015 IEEE International Workshop on Applied Measurements for Power
Systems (AMPS), 2015, pp. 108-113.
[15] S. Dasgupta, S. N. Mohan, S. K. Sahoo, and S. K. Panda, "A Plug and Play
Operational Approach for Implementation of an Autonomous-Micro-Grid
System," IEEE Transactions on Industrial Informatics, vol. 8, no. 3, pp. 615-
629, 2012.
[16] M. A. Hammoudeh, F. Mancilla-David, J. D. Selman, and P. Papantoni-
Kazakos, "Communication Architectures for Distribution Networks within the
Smart Grid Initiative," in 2013 IEEE Green Technologies Conference
(GreenTech), 2013, pp. 65-70.
[17] "IEEE Draft Standard for Information technology--Telecommunications and
information exchange between systems--Local and metropolitan area
networks--Specific requirements Part 3: Carrier Sense Multiple Access with
Collision Detection (CSMA/CD) Access Method and Physical Layer
Specifications Amendment: Physical Layer Specifications and Management
Parameters for Ethernet Passive Optical Networks Protocol over Coax," IEEE
P802.3bn/D3.0, January 2016 (Amendment of IEEE Std 802.3-2015), pp. 1-
356, 2016.
[18] Communication Networks and Systems for Power Utility Automation, 2013.
[19] T. Skeie, S. Johannessen, and C. Brunner, "Ethernet in substation automation,"
Control Systems, IEEE, vol. 22, no. 3, pp. 43-51, 2002.
[20] L. Andersson, C. Brunner, and F. Engler, "Substation automation based on
IEC 61850 with new process-close technologies," in 2003 IEEE Bologna
Power Tech Conference Proceedings, 2003, vol. 2, p. 6 pp. Vol.2.
[21] F. E. T. L. K. L.ANDERSSON, "IEC 61850 based digital communicatons as
interface to the primary equipment," CIGRE 2004 Paris, 2004.
[22] J. T. Tengdin, M. S. Simon, and C. R. Sufana, "LAN congestion scenario and
performance evaluation," in Power Engineering Society 1999 Winter Meeting,
IEEE, 1999, vol. 2, pp. 919-924 vol.2.
[23] J. C. Tournier and T. Werner, "A quantitative evaluation of IEC61850 process
bus architectures," in IEEE PES General Meeting, 2010, pp. 1-8.
[24] D. Dolezilek, "IEC 61850: What You Need to Know About Functionality and
Practical Implementation," in 2006 Power Systems Advanced Metering,
Protection, Control, Communication, and Distributed Resources, 2006, pp. 1-
17.
[25] L. Andersson, K. P. Brand, C. Brunner, and W. Wimmer, "Reliability
investigations for SA communication architectures based on IEC 61850," in
2005 IEEE Russia Power Tech, 2005, pp. 1-7.
[26] M.Schumacher, "Process bus communication in High Voltage Substation
based on IEC 61850," CIGRE Study Committee B3 Colloquium,
BerlinSeptember 2007 2007.
[27] R. E. Mackiewicz, "Overview of IEC 61850 and Benefits," in 2006 IEEE PES
Power Systems Conference and Exposition, 2006, pp. 623-630.

REFERENCES
______________________________________________________________________________________________________________________
Page | 161
[28] A. Apostolov and D. Tholomier, "Impact of IEC 61850 on Power System
Protection," in 2006 IEEE PES Power Systems Conference and Exposition,
2006, pp. 1053-1058.
[29] J. Mo, J. C. Tan, P. A. Crossley, Z. Q. Bo, and A. Klimek, "Evaluation of
process bus reliability," in Developments in Power System Protection (DPSP
2010). Managing the Change, 10th IET International Conference on, 2010, pp.
1-5.
[30] I. E. a. G. Z. V. Skendzic, "IEC 61850-9-2 Process Bus and Its Impact on
Power System Protection and Control Reliability," 9th annual Western Power
Delivery Automation conference, Spokane, Washington2007.
[31] L. Andersson, C. Brunner, and F. Engler, "Substation automation based on
IEC 61850 with new process-close technologies," in Power Tech Conference
Proceedings, 2003 IEEE Bologna, 2003, vol. 2, p. 6 pp. Vol.2.
[32] K. P. Brand and W. Wimmer, "Investigations of different Function Allocations
in SA Systems enabled by IEC 61850," in 2007 IEEE Lausanne Power Tech,
2007, pp. 720-725.
[33] R. Midence and D. Iadonisi, "Ethernet networks redundancy with focus on
IEC 61850 applications," in CIRED 2009 - The 20th International Conference
and Exhibition on Electricity Distribution - Part 2, 2009, pp. 1-1.
[34] M. S. Thomas and I. Ali, "Reliable, Fast, and Deterministic Substation
Communication Network Architecture and its Performance Simulation," IEEE
Transactions on Power Delivery, vol. 25, no. 4, pp. 2364-2370, 2010.
[35] R. Midence and D. Iadonisi, "Ethernet networks redundancy with focus on
IEC 61850 applications," in Electricity Distribution - Part 2, 2009. CIRED
2009. The 20th International Conference and Exhibition on, 2009, pp. 1-1.
[36] U. B. ANOMBEM, "Evaluation of IEC 61850 Process Bus Architecture and
Reliability," Doctor of Philosophy, School of Electrical and Electronic
Engineering, University of Manchester, 2012.
[37] K. P. Brand, M. Ostertag, and W. Wimmer, "Safety related, distributed
functions in substations and the standard IEC 61850," in Power Tech
Conference Proceedings, 2003 IEEE Bologna, 2003, vol. 2, p. 5 pp. Vol.2.
[38] L. Andersson, K. P. Brand, C. Brunner, and W. Wimmer, "Reliability
investigations for SA communication architectures based on IEC 61850," in
Power Tech, 2005 IEEE Russia, 2005, pp. 1-7.
[39] B. Yunus, A. Musa, H. S. Ong, A. R. Khalid, and H. Hashim, "Reliability and
availability study on substation automation system based on IEC 61850," in
2008 IEEE 2nd International Power and Energy Conference, 2008, pp. 148-
152.
[40] Z. Peichao, L. Portillo, and M. Kezunovic, "Reliability and Component
Importance Analysis of All-Digital Protection Systems," in Power Systems
Conference and Exposition, 2006. PSCE '06. 2006 IEEE PES, 2006, pp. 1380-
1387.
[41] S. M. Amin and B. F. Wollenberg, "Toward a smart grid: power delivery for
the 21st century," IEEE Power and Energy Magazine, vol. 3, no. 5, pp. 34-41,
2005.
[42] E. Santacana, G. Rackliffe, L. Tang, and X. Feng, "Getting Smart," IEEE
Power and Energy Magazine, vol. 8, no. 2, pp. 41-48, 2010.

REFERENCES
______________________________________________________________________________________________________________________
Page | 162
[43] S. S. G. K. P. P. Parikh, "Implementation Issues with IEC 61850 Based
Substation Automation Systems," presented at the Fifteenth National Systems
Conference (NPSC), IIT Bombay, 2008.
[44] B. Kasztenny, J. Whatley, E. Udren, J. Burger, D. Finney, and M. Adamiak, A
Practical Application Primer for Protection Engineers. 2019.
[45] M. P. Pozzuoli, "Ethernet in suubstation Automation Application - Iussues and
Requirements," Ruggedcom Inc. - Industrial Strength Networks, Woodbridge ,
Ontario, Canada.
[46] S. P. Release, "Siemens commissions the world's first substation control
system based on IEC 61850," 2002.
[47] T. Nissen and D. Peterchuck, "Substation integration pilot project," Power and
Energy Magazine, IEEE, vol. 1, no. 2, pp. 42-49, 2003.
[48] M. N. Sara, J. E. Fitch, and A. Weightman, "The First National Grid
Substation Equipped with a Substation LAN According to IEC 61850," in
Developments in Power System Protection, 2008. DPSP 2008. IET 9th
International Conference on, 2008, pp. 26-29.
[49] N. Pavaiya, A. Varghese, M. Boucherit, P. Newman, and P. Diemer, "IEC
61850 process bus application in Energinet, Denmark," in Developments in
Power System Protection (DPSP 2014), 12th IET International Conference on,
2014, pp. 1-4.
[50] W. B. S. Laederach, K.P. Brand and P.Reinhardt, "EXPERIENCE WITH IEC
61850 IN THE REFURBISHMENT OF AN IMPORTANT EUROPEAN
380KV SUBSTATION," presented at the CIGRE B5-109, Paris, 2006.
[51] A. Portalanza and A. Espinoza, "Pitfalls of implementing multi-vendor IEC
61850 substation automation systems," in 2017 IEEE PES Innovative Smart
Grid Technologies Conference - Latin America (ISGT Latin America), 2017,
pp. 1-5.
[52] J. Holbach et al., "Status on the First IEC61850 Based Protection and Control,
Multi-Vendor Project in the United States," in Protective Relay Engineers,
2007. 60th Annual Conference for, 2007, pp. 283-306.
[53] T. Jian-Cheng, V. Green, and J. Ciufo, "Testing IEC 61850 based multi-
vendor substation automation systems for interoperability," in Power Systems
Conference and Exposition, 2009. PSCE '09. IEEE/PES, 2009, pp. 1-5.
[54] V. R. G.-C. J. BautistaFlores , C. G. Mel??ndez Rom??n , E. Robles Ram??rez
and J. P. Rasgado Casique, "First multivendor 400kV transmission line
protection scheme using an IEC 61850-9-2digital network for optical CTs and
protection relays," CIGRE 2012, vol. no. B3-111, pp. pp. 1-7, 2012.
[55] D. A. K. a. J. R. A. J. F. Burger, "AEP Process Bus Replaces Copper,"
Transmission & Distribution World magazineMarch 2009.
[56] R. Z. a. D. B. Gwyn. (September 2010) Architecture of Substation Secondary
Systems. Protection, Automation and Control (PAC) World Magazine.
[57] R. Moore, R. Midence, and M. Goraj, "Practical experience with IEEE 1588
high Precision Time Synchronization in electrical substation based on IEC
61850 Process Bus," in IEEE PES General Meeting, 2010, pp. 1-4.
[58] J. McGhee and M. Goraj, "Smart High Voltage Substation Based on IEC
61850 Process Bus and IEEE 1588 Time Synchronization," in Smart Grid

REFERENCES
______________________________________________________________________________________________________________________
Page | 163
Communications (SmartGridComm), 2010 First IEEE International
Conference on, 2010, pp. 489-494.
[59] Y. Liang, H. Liu, Y. Hu, and K. Zhang, "Design and implementation of power
communication room monitoring system based on IEC 61850," in 2017 3rd
IEEE International Conference on Computer and Communications (ICCC),
2017, pp. 2971-2975.
[60] S. Meier, "Sharing Values," ABB Review Issue 1/2011.
[61] X. Chen, H. Guo, and P. Crossley, "Interoperability Performance Assessment
of Multivendor IEC61850 Process Bus," IEEE Transactions on Power
Delivery, vol. 31, no. 4, pp. 1934-1944, 2016.
[62] D. M. E. Ingram, P. Schaub, R. R. Taylor, and D. A. Campbell, "System-Level
Tests of Transformer Differential Protection Using an IEC 61850 Process
Bus," IEEE Transactions on Power Delivery, vol. 29, no. 3, pp. 1382-1389,
2014.
[63] Y. Li, P. Crossley, S. Xin, M. Redfern, A. Wen, and H. Grasset, "Protection
performance testing in IEC 61850 based systems," in 10th IET International
Conference on Developments in Power System Protection (DPSP 2010).
Managing the Change, 2010, pp. 1-5.
[64] Y. Zhang, Z. Cai, X. Li, and R. He, "Analytical Modeling of Traffic Flow in
the Substation Communication Network," IEEE Transactions on Power
Delivery, vol. 30, no. 5, pp. 2119-2127, 2015.
[65] P. Xie et al., "Traffic flow calculation method for substation communication
network," in 2016 IEEE PES Innovative Smart Grid Technologies Conference
Europe (ISGT-Europe), 2016, pp. 1-6.
[66] T. Yang, R. Zhao, W. Zhang, and Q. Yang, "On the Modeling and Analysis of
Communication Traffic in Intelligent Electric Power Substations," IEEE
Transactions on Power Delivery, vol. 32, no. 3, pp. 1329-1338, 2017.
[67] D. M. E. Ingram, D. A. Campbell, P. Schaub, and G. Ledwich, "Test and
evaluation system for multi-protocol sampled value protection schemes," in
2011 IEEE Trondheim PowerTech, 2011, pp. 1-7.
[68] M. G. Kanabar, T. S. Sidhu, and M. R. D. Zadeh, "Laboratory Investigation of
IEC 61850-9-2-Based Busbar and Distance Relaying With Corrective Measure
for Sampled Value Loss/Delay," IEEE Transactions on Power Delivery, vol.
26, no. 4, pp. 2587-2595, 2011.
[69] D. M. E. Ingram, P. Schaub, R. R. Taylor, and D. A. Campbell, "Performance
Analysis of IEC 61850 Sampled Value Process Bus Networks," IEEE
Transactions on Industrial Informatics, vol. 9, no. 3, pp. 1445-1454, 2013.
[70] R. Gore, H. Satheesh, M. Varier, and S. Valsan, "Analysis of an IEC 61850
based Electric Substation Communication Architecture," in 2016 7th
International Conference on Intelligent Systems, Modelling and Simulation
(ISMS), 2016, pp. 388-393.
[71] P. Ferrari, A. Flammini, S. Rinaldi, and G. Prytz, "Mixing Real Time Ethernet
traffic on the IEC 61850 Process bus," in Factory Communication Systems
(WFCS), 2012 9th IEEE International Workshop on, 2012, pp. 153-156.
[72] M. Golshani, G. A. Taylor, and I. Pisica, "Simulation of power system
substation communications architecture based on IEC 61850 standard," in

REFERENCES
______________________________________________________________________________________________________________________
Page | 164
2014 49th International Universities Power Engineering Conference (UPEC),
2014, pp. 1-6.
[73] M. G. Kanabar and T. S. Sidhu, "Performance of IEC 61850-9-2 Process Bus
and Corrective Measure for Digital Relaying," Power Delivery, IEEE
Transactions on, vol. 26, no. 2, pp. 725-735, 2011.
[74] T. S. Sidhu and Y. Yujie, "Modelling and Simulation for Performance
Evaluation of IEC61850-Based Substation Communication Systems," Power
Delivery, IEEE Transactions on, vol. 22, no. 3, pp. 1482-1489, 2007.
[75] N. Das, M. Wu, and S. Islam, "Comparison study of various factors affecting
end-to-end delay in IEC 61850 substation communications using OPNET," in
Universities Power Engineering Conference (AUPEC), 2012 22nd
Australasian, 2012, pp. 1-5.
[76] Z. Zhang, X. Huang, B. Keune, Y. Cao, and Y. Li, "Modeling and Simulation
of Data Flow for VLAN-Based Communication in Substations," IEEE Systems
Journal, vol. PP, no. 99, pp. 1-12, 2017.
[77] L. Chen, K. Zhang, Y. Xia, and G. Hu, "Scheme design and real-time
performance analysis of information communication network used in
substation area backup protection," in 2012 Power Engineering and
Automation Conference, 2012, pp. 1-4.
[78] Y. V. P. Kumar and R. Bhimasingu, "Review and retrofitted architectures to
form reliable smart microgrid networks for urban buildings," IET Networks,
vol. 4, no. 6, pp. 338-349, 2015.
[79] M. S. Thomas and I. Ali, "Reliable, Fast, and Deterministic Substation
Communication Network Architecture and its Performance Simulation,"
Power Delivery, IEEE Transactions on, vol. 25, no. 4, pp. 2364-2370, 2010.
[80] S. Kumar, N. Das, and S. Islam, "High performance communication
redundancy in a digital substation based on IEC 62439-3 with a station bus
configuration," in 2015 Australasian Universities Power Engineering
Conference (AUPEC), 2015, pp. 1-5.
[81] D. M. E. Ingram, P. Schaub, and D. A. Campbell, "Multicast traffic filtering
for sampled value process bus networks," in IECON 2011 - 37th Annual
Conference on IEEE Industrial Electronics Society, 2011, pp. 4710-4715.
[82] Z. Zhang, X. Huang, B. Keune, Y. Cao, and Y. Li, "Modeling and Simulation
of Data Flow for VLAN-Based Communication in Substations," IEEE Systems
Journal, vol. 11, no. 4, pp. 2467-2478, 2017.
[83] communication networks and systems in substations, 2003.
[84] M. S. Taqqu, W. Willinger, and R. Sherman, "Proof of a fundamental result in
self-similar traffic modeling," SIGCOMM Comput. Commun. Rev., vol. 27, no.
2, pp. 5-23, 1997.
[85] S. Shibin, J. K. Ng, and T. Bihai, "Some results on the self-similarity property
in communication networks," IEEE Transactions on Communications, vol. 52,
no. 10, pp. 1636-1642, 2004.
[86] G. Min and X. Jin, "Analytical Modelling and Optimization of Congestion
Control for Prioritized Multi-Class Self-Similar Traffic," IEEE Transactions
on Communications, vol. 61, no. 1, pp. 257-265, 2013.

REFERENCES
______________________________________________________________________________________________________________________
Page | 165
[87] J. Liebeherr, A. Burchard, and F. Ciucu, "Delay Bounds in Communication
Networks With Heavy-Tailed and Self-Similar Traffic," IEEE Transactions on
Information Theory, vol. 58, no. 2, pp. 1010-1024, 2012.
[88] W. Willinger, M. S. Taqqu, R. Sherman, and D. V. Wilson, "Self-similarity
through high-variability: statistical analysis of Ethernet LAN traffic at the
source level," IEEE/ACM Transactions on Networking, vol. 5, no. 1, pp. 71-86,
1997.
[89] R. F. R. Adler, andM. S. Taqqu, "A Practical Guide to Heavy Tails: Statistical
Techniques and Applications," Boston, MA, USA: Birkbauser1998.
[90] Z. Junshan and T. Konstantopoulos, "Multiple-access interference processes
are self-similar in multimedia CDMA cellular networks," IEEE Transactions
on Information Theory, vol. 51, no. 3, pp. 1024-1038, 2005.
[91] T. Kim, D. Lee, and S. Lee, "Hierarchical Multilevel on/off Source Traffic
Modeling for a Warship Combat System," IEEE Journal of Oceanic
Engineering, vol. 39, no. 2, pp. 226-242, 2014.
[92] B. C. Arnold, "Pareto Distribution," Fairland, MD, USA: International
Cooperative Publishing House1983.
[93] T. S. Sidhu and P. K. Gangadharan, "Control and automation of power system
substation using IEC61850 communication," in Proceedings of 2005 IEEE
Conference on Control Applications, 2005. CCA 2005., 2005, pp. 1331-1336.
[94] L. Hossenlopp, "Engineering perspectives on IEC 61850," IEEE Power and
Energy Magazine, vol. 5, no. 3, pp. 45-50, 2007.
[95] communication networks and systems in substations, 2003.
[96] I. S. f. T. e. a. system, "Transmission protocols - Companion standard for the
informative interface of protection equipment, IEC 60870-5-103," 1996.
[97] D. B. GROUP, "Distributed Network Protocol," Available:
http://www.dnp.org/.
[98] MODBUS. Modbus application protocol specification [Online]. Available:
http://www.modbud-ida.org/.
[99] communication networks and systems in substations, 2003.
[100] communication networks and systems in substations, 2004.
[101] I. A. J. M. Islamia, "High-speed Peer-to-peer Communication based Protection
Scheme Implementation and Testing in Laboratory," International Journal of
Computer Applications, vol. 38, no. No.4, pp. 0975-8887, January 2012 2012.
[102] communication networks and systems in substations, 2004.
[103] communication networks and systems in substations, 2003.
[104] communication networks and systems in substations`, 2003.
[105] O. M.-O. Technologies. [Online]. Available: [Online]. Available:
http://www.OPNET.com
[106] M. A. Hosein and R. L. Seegobin, Transaction Processing and Distribution
with COPAR and Opnet. 2014.
[107] L. Q. Juan Wang, "Implementation of Data Transmitted Network Base on
OPNET," presented at the International Conference on Civil, Materials and
Environmental Sciences (CMES 2015), March 13-14, 2015 London, UK, 2015.
[108] A. S. S. V. Y.Hnatyshin, The Practical OPNET User Guide for Computer
Network Simulation. 6000 Broken Sound Pkwy NW Boca Raton: CRC Press,
2013.

REFERENCES
______________________________________________________________________________________________________________________
Page | 166
[109] Z. L. a. H. Yang, Unlocing the Power of OPNET Modeler. the Edinburgh
Building , Cambridg CB2 8RU, UK: Cambridge University Press, 2012.
[110] communication networks and systems in substations, 2003.
[111] B. C. Arnold, "Pareto Distributions," International
Cooperative Publishing House, Fairland, MD, USA:1983.
[112] G. Combs. Wireshark Network Protocol Analyse [Online]. Available:
http://www.wireshark.org/
[113] WireShark, [Online]. Available: http://www.wireshark.org/.

APPENDICES
______________________________________________________________________________________________________________________
Page | 167
APPENDICES A: A National Grid 400kV Substation
There provides the schematic diagram of the main connections and protection of
National Grid 400kV Substation. The figures show the original copper connections
between the current transformers, voltage transformers and their corresponding
protection and control devices
Figure A - the schematic diagram of the main connections and protection of the
National Grid 400kV Substation.

APPENDICES
______________________________________________________________________________________________________________________
Page | 168
Appendix B: IEC 61850 Message Formats
9.3 B.1 GOOSE Message APDU
The following Figure B-1 shows the structure in GOOSE-ISO/IEC8802.3 mapping.
Figure B-1 ISO/IEC 8802-3

APPENDICES
______________________________________________________________________________________________________________________
Page | 169
The header comprises ‘Destination MAC address’ and ‘Source MAC address’
contains 6 bytes respectively 12 in total, and follows by the priority tagged contains
both ‘TPID’ which indicates the Ethertype assigned to 802.1Q has two byes and ‘TCI’
which is two byes also. EtherType is 2 bytes long; AppID is the identifier of the
Logical-Device which is 2 bytes, length and reserved number 1, 2, two bytes for each.
Before the fundamental information of the GOOSE message there total 26 bytes
(6+6+2+2+2+2+2+2+2 =26). The 27th byte is the start of APDU (Application
Protocol Data Unit), and the size of APDU is depended on the DataSets in the APDU.
Different information or data items in an IED can be grouped as DataSets, and one
GOOSE can accommodate several DataSets in its ‘allData’ filed. Any change in the
value of any data attributes of a DataSet will generate an event and send GOOSE
message repetitively. Therefore, the user defines which data elements and data
attributes are to be transmitted. Hence, the size of APDU can be set as m, and the total
size of the GOOSE message will be 26+m< 1521, where 1521 is the maximum size of
a single Ethernet packet.
Within the APDU, there are the main parameters:
i. GoCBRef: is the GOOSE control block for whom the lookup is being
requested
ii. T is the time at which the attribute StNum was incremented
iii. GoID: is the GOOSE ID
iv. StNum: is the “state number” identifies the increments each time a GOOSE
message has been sent and a value change has been detected within DATA-SET
v. SqNum: is the “sequence number” that increments each time when a GOOSE
message has been sent
vi. Test: is the value of TRUE that the values of the message shall not be used for
operational purposes.

APPENDICES
______________________________________________________________________________________________________________________
Page | 170
vii. Confrey: is the “configuration revision”, indicate that any change has occurred
in the configuration has been detected.
viii. NdsCom: are the “needs commissioning” to indicate the GB requires further
configuration.
ix. Dataset is the Object Reference of the DATA-SET whose values of the
members shall be transmitted.
x. Value: is the value of a member of the DATA-SET referenced in GoCB.
Most of the size of these parameters are fixed or within a small range, the variation of
the GOOSE message size is dependents on the number of the dataset and the size of
each dataset. The calculation of the GOOSE message size will be considered in the
following section where the GOOSE needs to be simulated.

APPENDICES
______________________________________________________________________________________________________________________
Page | 171
9.4 B.2 SV Message APDU
The sampled value APDU defined by IEC 61950-9-2 is shown in Figure B-2. One
APDU can include multiple ASDUs, where ASDU is consists of sampled value ID,
sample control, revision, and most important is a data set that consists of the sequence
of voltage and current signal data.
Figure B-2 APDU of IEC 61850-9-2 sampled value message