Embed Size (px)
Citation preview
Data Experiences: novel interfaces
for data engagement using
environmental health data
Laura J. Perovich Submitted to the Program in Media Arts and Sciences, School of Architecture and Planning,
in partial fulfillment of the requirements for the degree of Master of Science in Media Arts & Sciences at the Massachusetts Institute of Technology
September 2014
© 2014 Massachusetts Institute of Technology. All Rights Reserved
Author:
_____________________________________________
Program in Media Arts & Sciences August 22, 2014
Certified by:
_____________________________________________
Dr. V. Michael Bove, Jr. Principal Research Scientist Media Lab Massachusetts Institute of Technology
Accepted by:
_____________________________________________
Prof. Patricia Maes Interim Academic Head Program in Media Arts & Sciences Massachusetts Institute of Technology

2
3
Data Experiences: novel interfaces
for data engagement using
environmental health data
Laura J. Perovich Submitted to the Program in Media Arts and Sciences, School of Architecture and Planning
on August 22, 2014, in partial fulfillment of the requirements for the degree of Master of Science in Media Arts & Sciences at the Massachusetts Institute of Technology
Abstract
For the past twenty years, the data visualization movement has reworked the way we
engage with information. It has brought fresh excitement to researchers and reached broad
audiences. But what comes next for data? I seek to create example “Data Experiences”
that will contribute to developing new spaces of information engagement. Using data from
Silent Spring Institute’s environmental health studies as a test case, I explore Data
Experiences that are immersive, interactive, and aesthetic. Environmental health datasets
are ideal for this application as they are highly relevant to the general population and have
appropriate complexity. Dressed in Data will focus on the experience of an individual with
her/his own environmental health data while BigBarChart focuses on the experience of the
community with the overall dataset. Both projects seek to present opportunities for non-
traditional learning, community relevance, and social impact.
Thesis Supervisor: V. Michael Bove, Jr. Title: Principal Research Scientist, MIT Media Lab

4
5
Data Experiences: novel interfaces
for data engagement using
environmental health data
Laura J. Perovich
Thesis Reader:
_____________________________________________
Dr. V. Michael Bove, Jr. Principal Research Scientist Media Lab, Massachusetts Institute of Technology
Thesis Reader:
_____________________________________________
Dr. Julia Brody Executive Director Silent Spring Institute
Thesis Reader:
_____________________________________________
Prof. Hiroshi Ishii Jerome B. Wiesner Professor of Media Arts & Sciences Media Lab, Massachusetts Institute of Technology
Thesis Reader:
_____________________________________________
Prof. Patricia Maes Alexander W. Dreyfoos Professor Media Lab, Massachusetts Institute of Technology

6
7
Table of Contents Abstract ......................................................................................................................................................... 3
Table of Contents .......................................................................................................................................... 7
Acknowledgements ....................................................................................................................................... 9
Prologue ...................................................................................................................................................... 10
Introduction ................................................................................................................................................ 11
Background ................................................................................................................................................. 12
Concept ................................................................................................................................................... 12
Artifacts ................................................................................................................................................... 12
Prior work................................................................................................................................................ 12
Application & expansion of prior work ................................................................................................... 18
Project outcomes .................................................................................................................................... 18
Project findings ....................................................................................................................................... 19
Data overview ......................................................................................................................................... 20
Emerging contaminants .......................................................................................................................... 20
Phthalates ........................................................................................................................................... 21
Alkylphenols & phenols....................................................................................................................... 21
Parabens ............................................................................................................................................. 21
Flame retardants ................................................................................................................................. 21
Polychlorinated biphenyls (PCBs) ....................................................................................................... 22
Polycyclic aromatic hydrocarbons (PAHs) ........................................................................................... 22
Metals & particulates .......................................................................................................................... 22
Pesticides ............................................................................................................................................ 23
Green Housing Study data .................................................................................................................. 23
Diethyl phthalate (DEP) ....................................................................................................................... 23
Benzyl butyl phthalate (BBP)............................................................................................................... 23
Diethyl hexyl phthalate (DEHP) ........................................................................................................... 24
Data content & meaning ......................................................................................................................... 24
Dressed in Data ........................................................................................................................................... 26
Overview ................................................................................................................................................. 26
8
Related work ........................................................................................................................................... 26
Design considerations & scenarios ......................................................................................................... 27
Software and fabrication system ............................................................................................................ 28
Code & data display ............................................................................................................................ 28
“Artisanal” laser cutting ...................................................................................................................... 28
Artifacts ................................................................................................................................................... 31
User study protocols & initial testing ..................................................................................................... 37
Limitations & future work ....................................................................................................................... 38
BigBarChart ................................................................................................................................................. 40
Overview ................................................................................................................................................. 40
Data considerations & scenarios ............................................................................................................ 41
Hardware, software & system ................................................................................................................ 42
Process ................................................................................................................................................ 42
System overview ................................................................................................................................. 42
Lessons learned in fabrication ................................................................................................................ 45
Manufacturing ........................................................................................................................................ 46
Manufacturing partners ...................................................................................................................... 46
Manufacturing design process ............................................................................................................ 48
Manufacturing ethics & the environment .......................................................................................... 50
Product based chemical exposures..................................................................................................... 51
Prototype outcomes ............................................................................................................................... 54
Evaluation ............................................................................................................................................... 61
Limitations & future work ....................................................................................................................... 62
Conclusion ................................................................................................................................................... 64
Data experiences in environmental health ............................................................................................. 64
Future work ............................................................................................................................................. 64
Supplemental .............................................................................................................................................. 66
Online documentation ............................................................................................................................ 66
Manufacturing partners .......................................................................................................................... 66
Semi-structured interview: BigBarChart ................................................................................................. 67
Semi-structured interview: Dressed in Data ........................................................................................... 69
Bibliography ................................................................................................................................................ 71
9
Acknowledgements Michael, thanks for supporting and refining my ideas over the past two years. And thanks for convincing me that 3D printing is still overrated. Lathing and metal work is high on the agenda for next year! Thanks to my readers for your advice and knowledge that helped bring this project together as well as all your research that influenced it. Thanks to Silent Spring Institute for inspiring this research and providing me with the background needed to pursue it. And thank you for all your support that made it possible for me to be at the Media Lab. Thanks to my UROPs Kristin Zimmerman and Dayanna Espinoza for all your hard work, patience, and new ideas. Thanks to the John S. and James L. Knight Foundation, especially Prototype Fund manager Chris Barr, for supporting this work. Thanks to OBMG for all of your help, from filming videos to moving MDF to yoga breaks. Thanks to my classmates and the Media Lab community for your inspiration, diversity, and easy going attitudes. Thanks to the Director’s Fellows program for bringing in so many interesting collaborators. Thanks to my manufacturing partners abroad, especially the Yiwu Knong Daily Commodity Factory, for trying something new. Thanks to Bunnie Huang and AQS for facilitating the process. Thanks to Tom Lutz and John Difrancesco for the shop training and ideas about how to make things work. Thanks to Linda Peterson, Keira Horowitz, and Kristin Hall for your help, advice, and patience. Thanks to my friends for the Toscanini’s breaks, songs, walks to nowhere, gchat conversations, and dancing that kept me grounded through the tough parts. Thanks to my family for helping me get here, especially mom for tolerating the fact that I don’t sew like an engineer.
10
Prologue
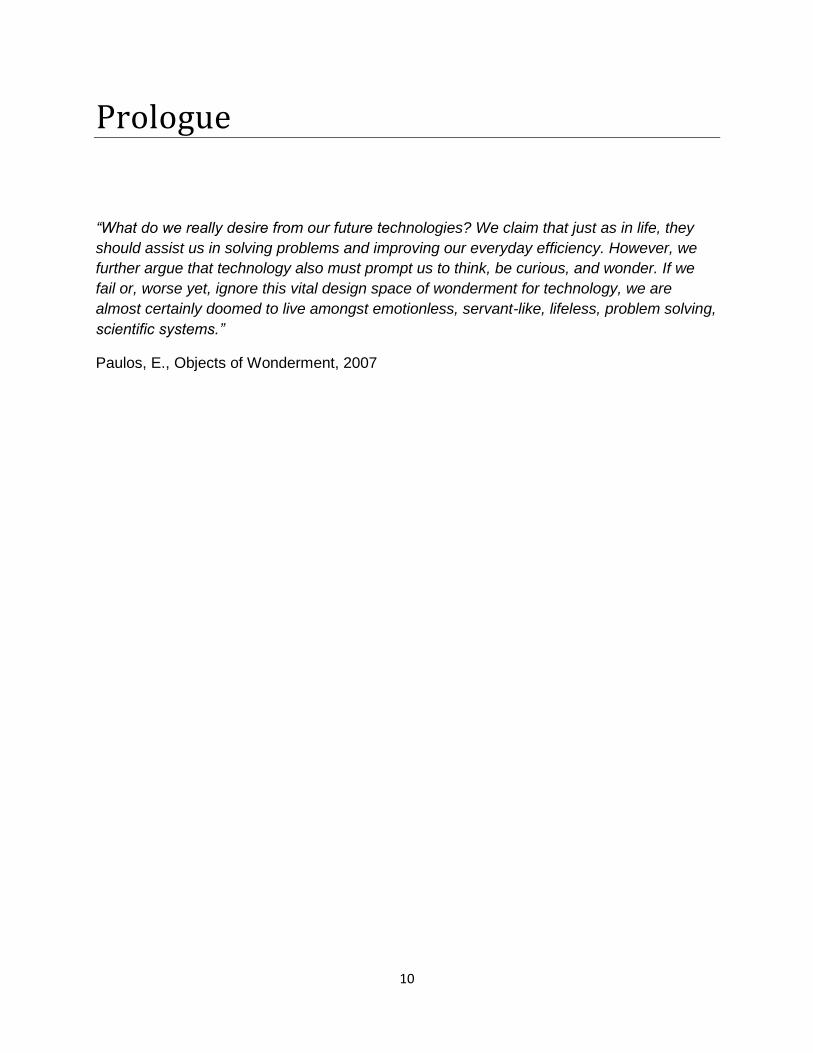
“What do we really desire from our future technologies? We claim that just as in life, they
should assist us in solving problems and improving our everyday efficiency. However, we
further argue that technology also must prompt us to think, be curious, and wonder. If we
fail or, worse yet, ignore this vital design space of wonderment for technology, we are
almost certainly doomed to live amongst emotionless, servant-like, lifeless, problem solving,
scientific systems.”
Paulos, E., Objects of Wonderment, 2007
11
Introduction
Recent advancements in statistics, computer science, and web-based interactions have led
to powerful data analysis tools for researchers and a public enthusiasm for interactive data
visualizations. These visualizations appear in online news media and have introduced new
people to data exploration.
Yet pixels and screens limit the range of our experience. They offer great speed of analysis
and significant versatility, but remain remote from the self, hard and electronic, and often
somewhat emotionally distant and easy to forget. They rarely consume us or stay in our
memories in the same way phenomena in the world do through their physicality and full
sensory engagement. Thus to obtain a sense of wonderment in our technology, we venture
off the screen back into the physical world.
Data Experiences will attempt to provide physical world form for datasets. They build from
and encompass emerging work in a number of areas including data sculptures, data
therapy, and wearable data (Miebach, 2014; Bhargava, 2014; Kim, 2010). I propose that
Data Experiences be described by three primary characteristics. They:
engage multiple senses
exist at a human or embodied scale; they are immersive and present, not separate
from the self like a document or a screen
interact with the emotional and aesthetic self
Together these characteristics aim to create interactions that increase wonderment, prompt
curiosity, create strong memories, and draw diverse people to engage with data.
The Data Experiences developed will be tested using environmental health
datasets. Environmental health datasets collected by research organizations contain
concentrations of consumer product chemicals (e.g. flame retardants, phthalates, metals)
measured in homes (e.g. air, dust) and people (e.g. blood, urine). Participants almost
always want to receive the results of testing because they are curious and the data is highly
personal and may be relevant to health conditions (Brody, 2007). Yet researchers are often
reluctant to share this information as it is a large investment of resources and expertise and
institutional review boards may not support reporting data on personal chemical exposures
to study participants (Brody, 2007). I created immersive physical realizations of this data
that build from prior research in sharing results through paper (Altman, 2009) and digital
methods (Silent Spring Institute, 2014); future work will compare outcomes of paper, digital,
and experiential reporting methods.
12
Background
Concept
Data Experiences pull together findings from diverse fields to create a new space. They
seek to take data off the screen and put it into the physical world. They may emphasize the
aesthetic angle to create emotional experiences that complement analytic approaches
traditionally taken with data and prompt new perspectives or engage new groups of
people. A number of existing and ongoing projects begin to map out this space and inform
current work, as discussed in future sections.
Artifacts
I created two Data Experiences using environmental health data: Dressed in Data and
BigBarChart. Each Data Experience was implemented using data from Silent Spring
Institute exposure studies.
Dressed in Data is a series of garments with lace patterns or prints that represent the
concentrations of chemicals detected in an individual’s home. Squares in the pattern
represent chemicals detected and are sized based on the amount of the chemical found.
This is intended to give a “one glance” intuitive understanding of an individual’s
exposures. Further information on chemical sources and health effects can be conveyed
through color choices, fabric, and pattern design.
BigBarChart is a room-sized 3D bar chart that users can walk inside and interact with. Bars
are constructed from custom pop-up laundry hampers extending close to 6 feet in height to
create immersion and a sense of magic. Bars are networked and can change their height
(motor actuation) and color (LEDs). They are responsive to interaction through tangible
interfaces. BigBarChart explores immersion, human-scale, and tangible interfaces for data
investigation.
Prior work
Prior work in tangible interfaces, art installations, data visualization, environmental health,
and data ethics inform this project, as detailed below. Many of these fields are well
established with ongoing research occurring at major universities while others continue to
13
gain momentum. Findings and best practices from these areas will be extended in
developing Data Experiences.
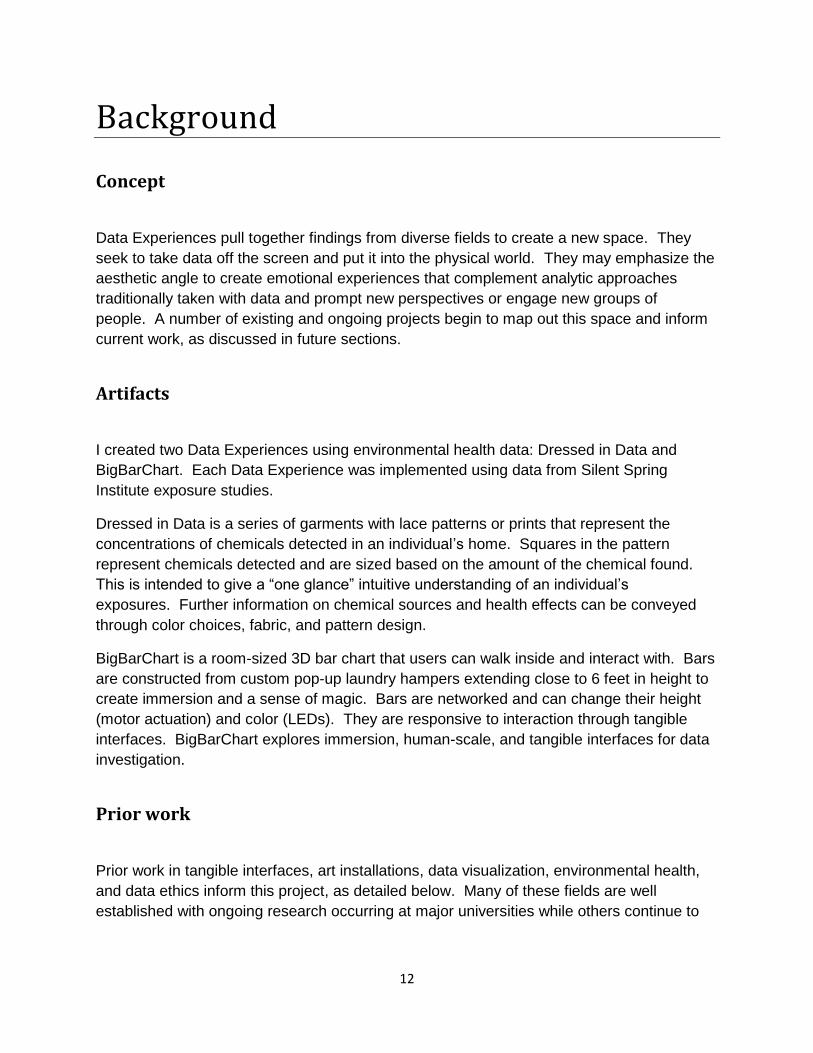
Basic findings in data visualization were taken into account in developing these Data
Experiences. For example, BigBarChart was initially chosen over BigPieChart as bar
graphs have been shown to outperform pie charts in most situations (Kosslyn, 2006). The
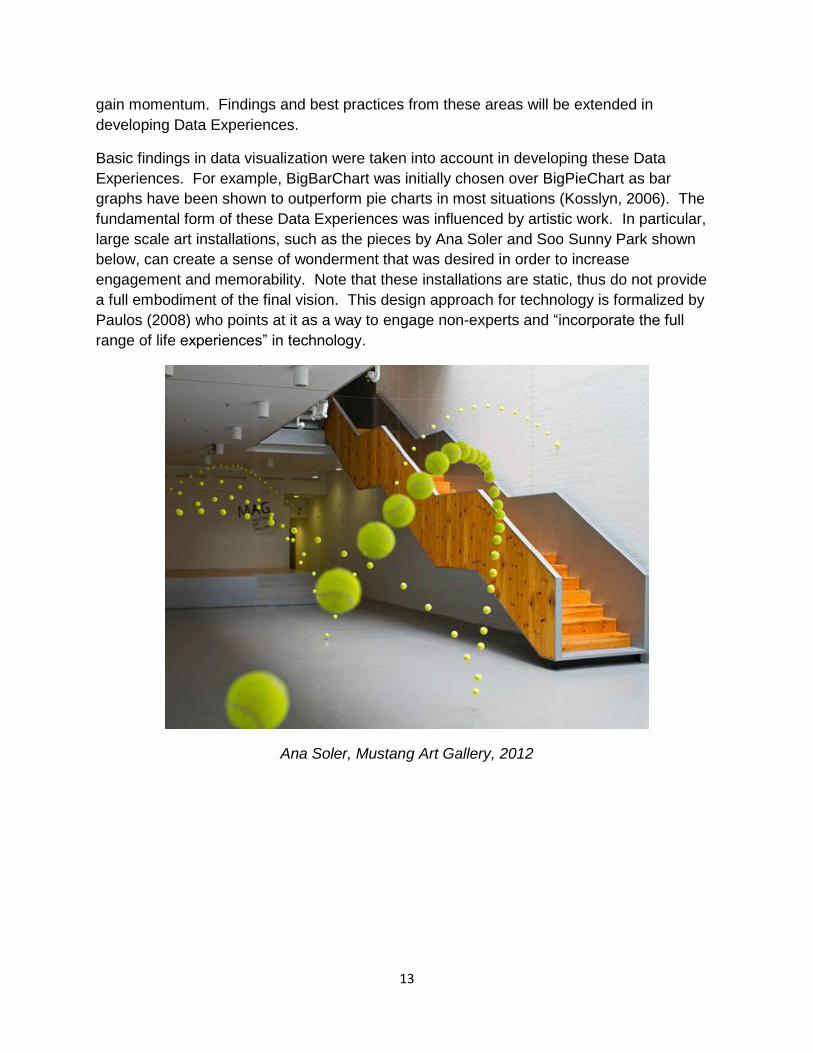
fundamental form of these Data Experiences was influenced by artistic work. In particular,
large scale art installations, such as the pieces by Ana Soler and Soo Sunny Park shown
below, can create a sense of wonderment that was desired in order to increase
engagement and memorability. Note that these installations are static, thus do not provide
a full embodiment of the final vision. This design approach for technology is formalized by
Paulos (2008) who points at it as a way to engage non-experts and “incorporate the full
range of life experiences” in technology.
Ana Soler, Mustang Art Gallery, 2012
14
Soo Sunny Park, Unwoven Light, 2013
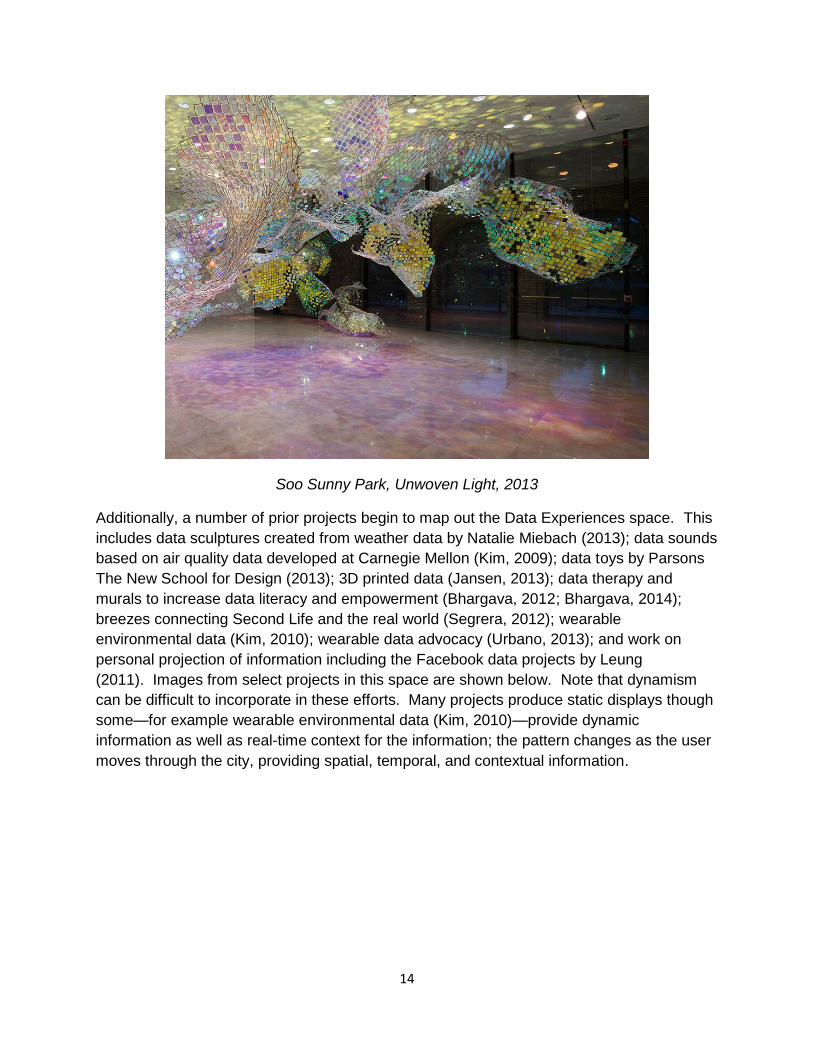
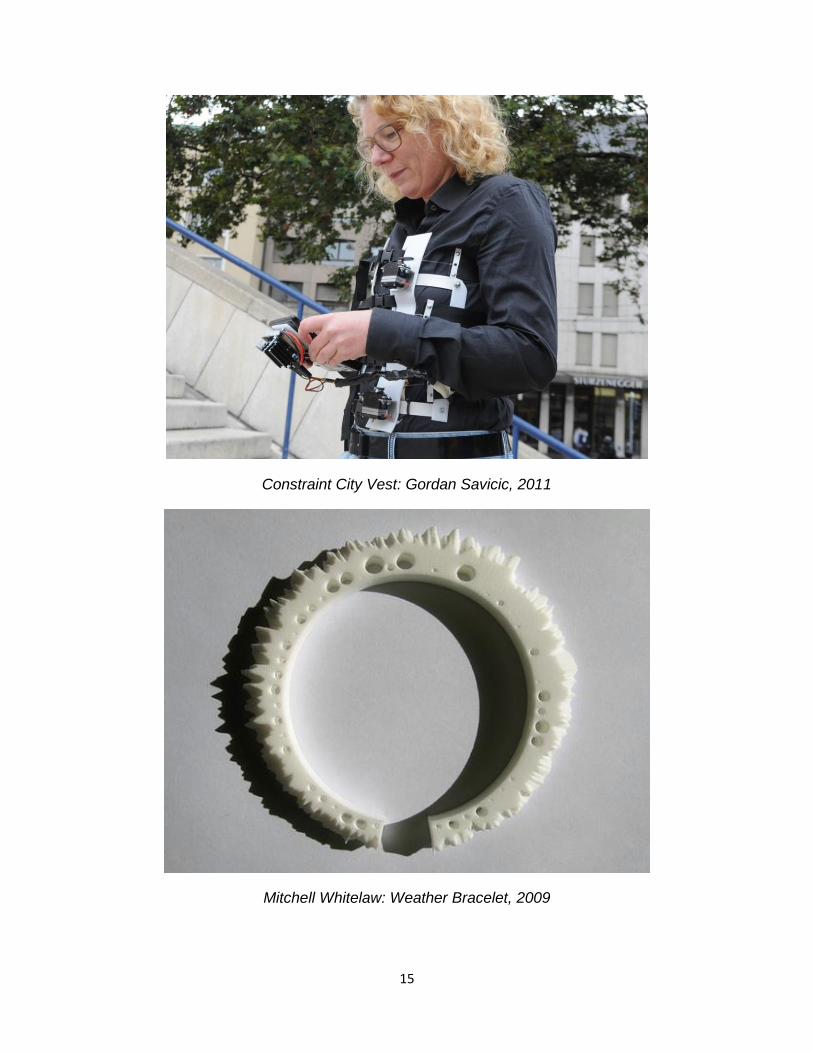
Additionally, a number of prior projects begin to map out the Data Experiences space. This
includes data sculptures created from weather data by Natalie Miebach (2013); data sounds
based on air quality data developed at Carnegie Mellon (Kim, 2009); data toys by Parsons
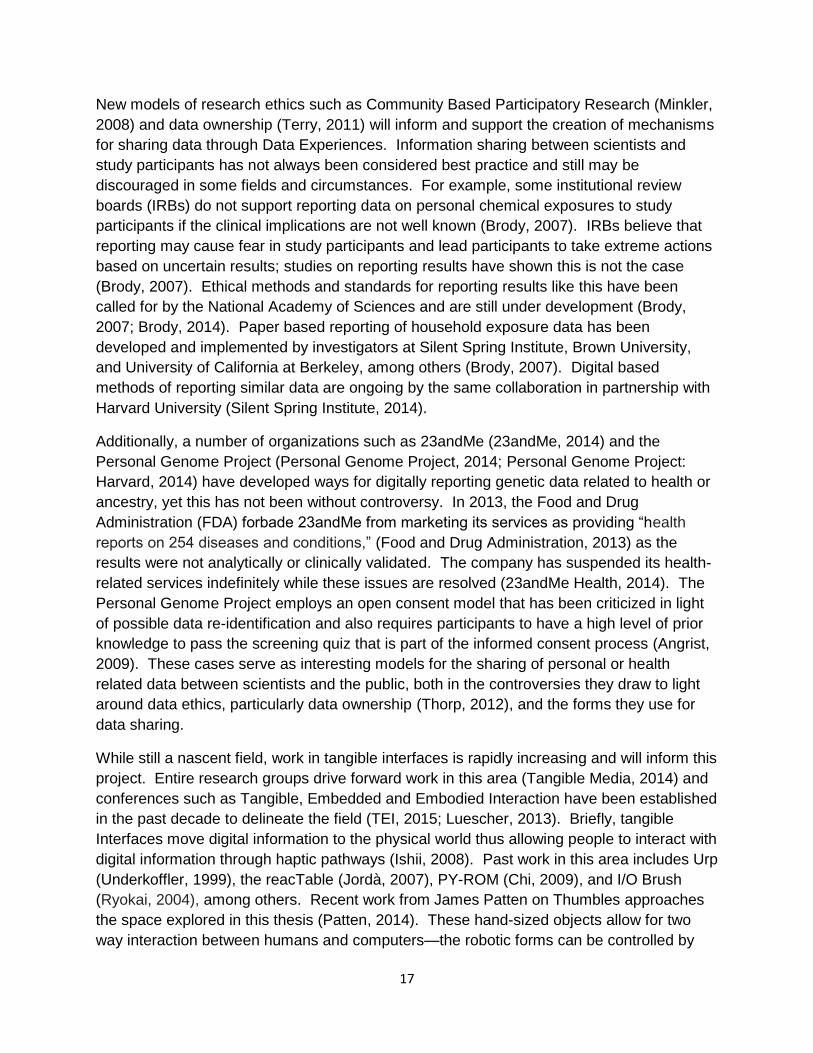
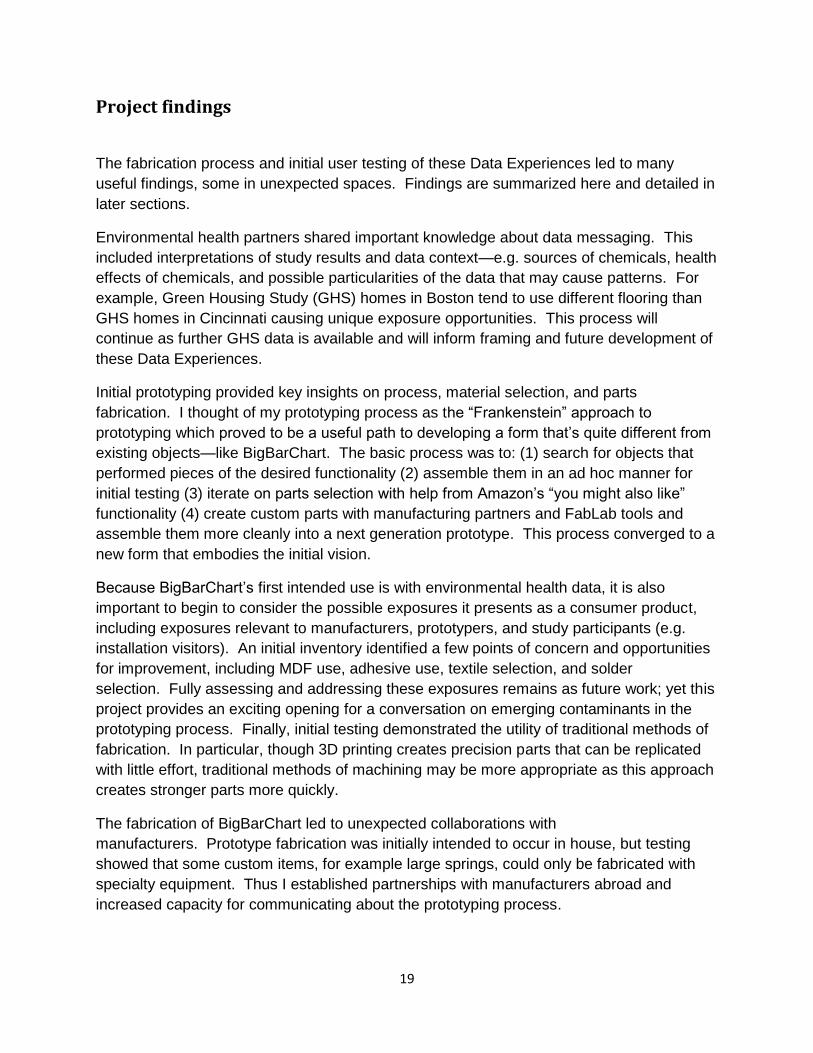
The New School for Design (2013); 3D printed data (Jansen, 2013); data therapy and
murals to increase data literacy and empowerment (Bhargava, 2012; Bhargava, 2014);
breezes connecting Second Life and the real world (Segrera, 2012); wearable
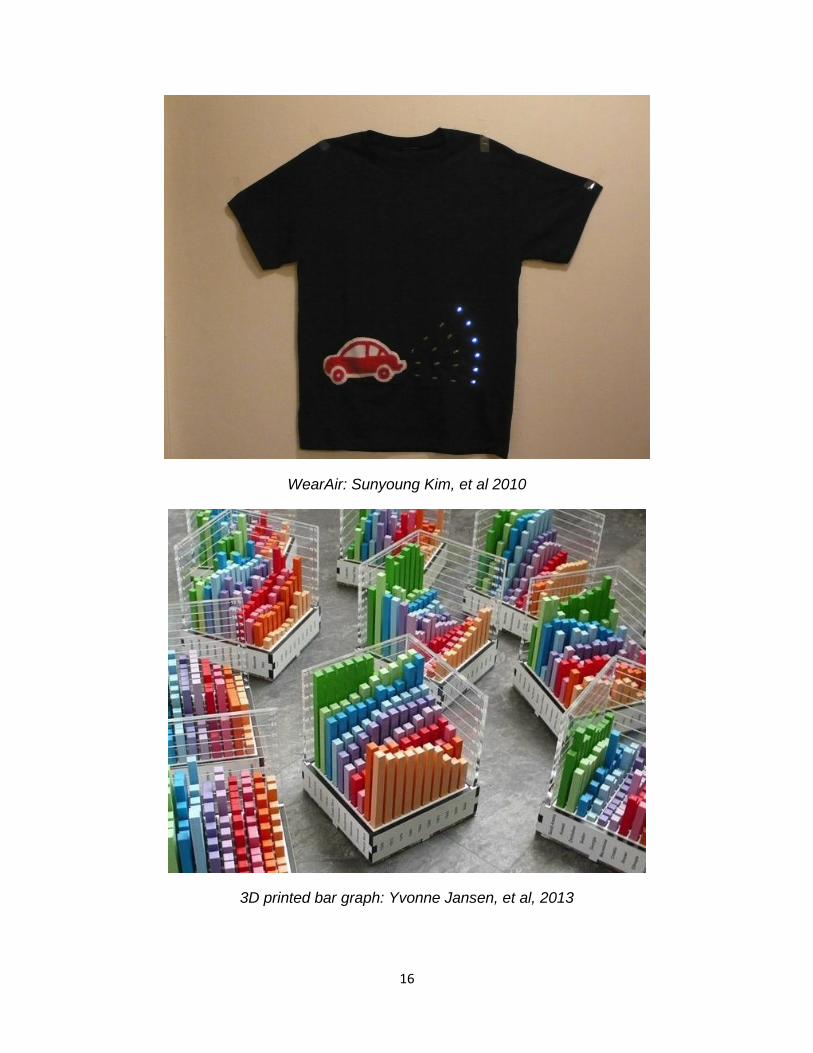
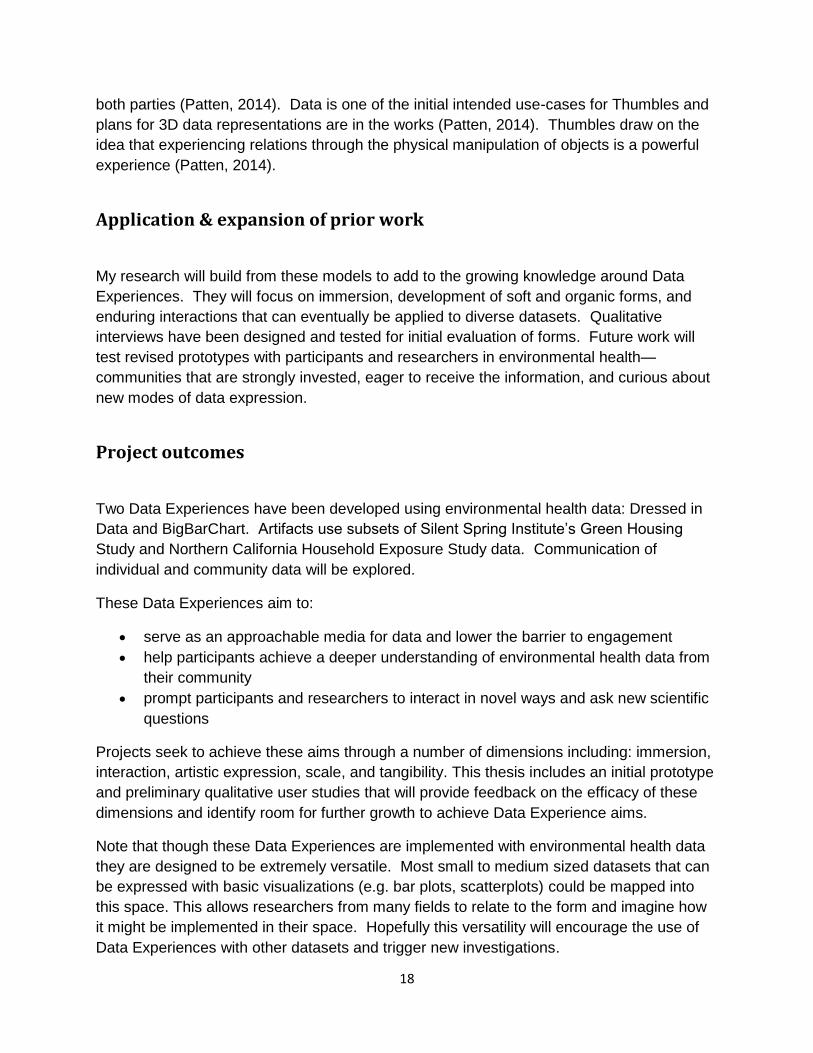
environmental data (Kim, 2010); wearable data advocacy (Urbano, 2013); and work on
personal projection of information including the Facebook data projects by Leung
(2011). Images from select projects in this space are shown below. Note that dynamism
can be difficult to incorporate in these efforts. Many projects produce static displays though
some—for example wearable environmental data (Kim, 2010)—provide dynamic
information as well as real-time context for the information; the pattern changes as the user
moves through the city, providing spatial, temporal, and contextual information.
15
Constraint City Vest: Gordan Savicic, 2011
Mitchell Whitelaw: Weather Bracelet, 2009
16
WearAir: Sunyoung Kim, et al 2010
3D printed bar graph: Yvonne Jansen, et al, 2013
17
New models of research ethics such as Community Based Participatory Research (Minkler,
2008) and data ownership (Terry, 2011) will inform and support the creation of mechanisms
for sharing data through Data Experiences. Information sharing between scientists and
study participants has not always been considered best practice and still may be
discouraged in some fields and circumstances. For example, some institutional review
boards (IRBs) do not support reporting data on personal chemical exposures to study
participants if the clinical implications are not well known (Brody, 2007). IRBs believe that
reporting may cause fear in study participants and lead participants to take extreme actions
based on uncertain results; studies on reporting results have shown this is not the case
(Brody, 2007). Ethical methods and standards for reporting results like this have been
called for by the National Academy of Sciences and are still under development (Brody,
2007; Brody, 2014). Paper based reporting of household exposure data has been
developed and implemented by investigators at Silent Spring Institute, Brown University,
and University of California at Berkeley, among others (Brody, 2007). Digital based
methods of reporting similar data are ongoing by the same collaboration in partnership with
Harvard University (Silent Spring Institute, 2014).
Additionally, a number of organizations such as 23andMe (23andMe, 2014) and the
Personal Genome Project (Personal Genome Project, 2014; Personal Genome Project:
Harvard, 2014) have developed ways for digitally reporting genetic data related to health or
ancestry, yet this has not been without controversy. In 2013, the Food and Drug
Administration (FDA) forbade 23andMe from marketing its services as providing “health
reports on 254 diseases and conditions,” (Food and Drug Administration, 2013) as the
results were not analytically or clinically validated. The company has suspended its health-
related services indefinitely while these issues are resolved (23andMe Health, 2014). The
Personal Genome Project employs an open consent model that has been criticized in light
of possible data re-identification and also requires participants to have a high level of prior
knowledge to pass the screening quiz that is part of the informed consent process (Angrist,
2009). These cases serve as interesting models for the sharing of personal or health
related data between scientists and the public, both in the controversies they draw to light
around data ethics, particularly data ownership (Thorp, 2012), and the forms they use for
data sharing.
While still a nascent field, work in tangible interfaces is rapidly increasing and will inform this
project. Entire research groups drive forward work in this area (Tangible Media, 2014) and
conferences such as Tangible, Embedded and Embodied Interaction have been established
in the past decade to delineate the field (TEI, 2015; Luescher, 2013). Briefly, tangible
Interfaces move digital information to the physical world thus allowing people to interact with
digital information through haptic pathways (Ishii, 2008). Past work in this area includes Urp
(Underkoffler, 1999), the reacTable (Jordà, 2007), PY-ROM (Chi, 2009), and I/O Brush
(Ryokai, 2004), among others. Recent work from James Patten on Thumbles approaches
the space explored in this thesis (Patten, 2014). These hand-sized objects allow for two
way interaction between humans and computers—the robotic forms can be controlled by
18
both parties (Patten, 2014). Data is one of the initial intended use-cases for Thumbles and
plans for 3D data representations are in the works (Patten, 2014). Thumbles draw on the
idea that experiencing relations through the physical manipulation of objects is a powerful
experience (Patten, 2014).
Application & expansion of prior work
My research will build from these models to add to the growing knowledge around Data
Experiences. They will focus on immersion, development of soft and organic forms, and
enduring interactions that can eventually be applied to diverse datasets. Qualitative
interviews have been designed and tested for initial evaluation of forms. Future work will
test revised prototypes with participants and researchers in environmental health—
communities that are strongly invested, eager to receive the information, and curious about
new modes of data expression.
Project outcomes
Two Data Experiences have been developed using environmental health data: Dressed in
Data and BigBarChart. Artifacts use subsets of Silent Spring Institute’s Green Housing
Study and Northern California Household Exposure Study data. Communication of
individual and community data will be explored.
These Data Experiences aim to:
serve as an approachable media for data and lower the barrier to engagement
help participants achieve a deeper understanding of environmental health data from
their community
prompt participants and researchers to interact in novel ways and ask new scientific
questions
Projects seek to achieve these aims through a number of dimensions including: immersion,
interaction, artistic expression, scale, and tangibility. This thesis includes an initial prototype
and preliminary qualitative user studies that will provide feedback on the efficacy of these
dimensions and identify room for further growth to achieve Data Experience aims.
Note that though these Data Experiences are implemented with environmental health data
they are designed to be extremely versatile. Most small to medium sized datasets that can
be expressed with basic visualizations (e.g. bar plots, scatterplots) could be mapped into
this space. This allows researchers from many fields to relate to the form and imagine how
it might be implemented in their space. Hopefully this versatility will encourage the use of
Data Experiences with other datasets and trigger new investigations.
19
Project findings
The fabrication process and initial user testing of these Data Experiences led to many
useful findings, some in unexpected spaces. Findings are summarized here and detailed in
later sections.
Environmental health partners shared important knowledge about data messaging. This
included interpretations of study results and data context—e.g. sources of chemicals, health
effects of chemicals, and possible particularities of the data that may cause patterns. For
example, Green Housing Study (GHS) homes in Boston tend to use different flooring than
GHS homes in Cincinnati causing unique exposure opportunities. This process will
continue as further GHS data is available and will inform framing and future development of
these Data Experiences.
Initial prototyping provided key insights on process, material selection, and parts
fabrication. I thought of my prototyping process as the “Frankenstein” approach to
prototyping which proved to be a useful path to developing a form that’s quite different from
existing objects—like BigBarChart. The basic process was to: (1) search for objects that
performed pieces of the desired functionality (2) assemble them in an ad hoc manner for
initial testing (3) iterate on parts selection with help from Amazon’s “you might also like”
functionality (4) create custom parts with manufacturing partners and FabLab tools and
assemble them more cleanly into a next generation prototype. This process converged to a
new form that embodies the initial vision.
Because BigBarChart’s first intended use is with environmental health data, it is also
important to begin to consider the possible exposures it presents as a consumer product,
including exposures relevant to manufacturers, prototypers, and study participants (e.g.
installation visitors). An initial inventory identified a few points of concern and opportunities
for improvement, including MDF use, adhesive use, textile selection, and solder
selection. Fully assessing and addressing these exposures remains as future work; yet this
project provides an exciting opening for a conversation on emerging contaminants in the
prototyping process. Finally, initial testing demonstrated the utility of traditional methods of
fabrication. In particular, though 3D printing creates precision parts that can be replicated
with little effort, traditional methods of machining may be more appropriate as this approach
creates stronger parts more quickly.
The fabrication of BigBarChart led to unexpected collaborations with
manufacturers. Prototype fabrication was initially intended to occur in house, but testing
showed that some custom items, for example large springs, could only be fabricated with
specialty equipment. Thus I established partnerships with manufacturers abroad and
increased capacity for communicating about the prototyping process.
20
Data overview
BigBarChart and Dressed in Data will be implemented using data from Silent Spring
Institute studies. Dressed in Data uses data from the Household Exposure Study and
BigBarChart uses data from the Green Housing Study.
The Household Exposure Study was conducted by Silent Spring Institute, University of
California Berkeley, Brown University, and Communities for a Better Environment in
Northern California in 2006. It builds from the Cape Cod Household Exposure Study
conducted in 2000 by Silent Spring Institute. The Cape Cod study sampled indoor air and
dust in 120 homes and analyzed samples for 89 endocrine disrupting compounds; over 65
chemicals were found in at least one home (Rudel, 2003). The Northern California
Household Exposure Study measured concentrations of over 100 compounds in 40 homes
in Richmond, California (industrial), and 10 homes in Bolinas, California (rural), in indoor air,
outdoor air, and house dust. A wide range of chemicals were detected—many of them
endocrine disruptors—including phthalates, alkylphenols, parabens, flame retardants,
polychlorinated biphenyls (PCBs), polycyclic aromatic hydrocarbons (PAHs), pesticides,
and phenols (Rudel, 2010).
The Green Housing Study (GHS) took place in 2013 in Boston, MA, and Cincinnati, OH.
Families in this study lived in public housing units undergoing renovations and included a
child with asthma. Data from this study includes measurements of over 50 chemicals (e.g.
phthalates, glycol ethers, flame retardants, PCBs) related to health (especially asthma) in
the air and dust of these homes and in the urine of study participants. Sample
characterization and data analysis is ongoing, though preliminary data is available for select
media and chemical groups. Early results include data for phthalates in air in multiple
communities and at multiple time points; subsets of this data were used as a first
implementation of BigBarChart. Additional data will be added to the prototype as it
becomes available in the following year.
Emerging contaminants
Dressed in Data presents the personal data of one Northern California Household Exposure
Study participant. This includes measurements of concentrations of over 100 chemicals
from a variety of chemical groups. Many of these chemicals are “emerging contaminants”—
their sources and health effects are not fully understood, they may have recently entered
industrial use, and our exposures to them in everyday life are not sufficiently
characterized. Cell data, animal data, and early exposure studies for some of these
chemicals indicate adverse health impacts such as endocrine disruption, respiratory effects,
and mutagenicity (Silent Spring Institute, 2007). An overview of these chemical groups,
example chemicals, chemical sources, and chemical health effects is found below.
21
Phthalates Phthalates are common plasticizers that increase flexibility and transparency. They are
found in many products such as shower curtains, food packaging, floor tiles, toys,
cosmetics, and adhesives. Phthalates are not strongly bound to plastic so they readily
enter the environment as products age. Example compounds include diethyl phthalate and
di-n-butyl phthalate (Rudel, 2009).
Phthalates were first found in the 1970s and have been detected in a range of environments
including the Norwegian Sea. As they largely come from everyday products, phthalates are
ubiquitous in the indoor environment (indoor air and dust) and indoor concentrations most
often exceed outdoor concentrations. Diet is a major route of exposure, but fragrance,
medical equipment, toys, and pharmaceuticals may be substantial exposure routes in some
cases. Phthalates are detected in virtually all people (Rudel, 2009).
Many phthalates are endocrine disrupting compounds. Phthalates are associated with
adverse effects to male reproductive outcomes such as decreased sperm count and
testosterone level (Jurewicz, 2013). Some compounds have also been associated with
respiratory effects and cardiac outcomes (Gillum, 2009; Rudel, 2009).
Alkylphenols & phenols Alkylphenols & phenols are surfactants and are often used in detergents, cleaners, and
disinfectants. Examples include o-phenyl phenol and nonylphenol (Rudel, 2009; Silent
Spring Institute, 2007).
These compounds became common in the 1940s. They are often found in the indoor
environment and in water. People may be exposed to phenols and alkylphenols through
diet, product use, and air, but primary sources of exposure are not well understood (Rudel,
2009).
Many alkylphenols are endocrine disruptors, often mimicking estrogen (Rudel, 2009).
Parabens Parabens are preservatives and anti-microbials. They may be used in personal care
products, pharmaceuticals, and food. Examples include methyl paraben and ethyl paraben
(Rudel, 2009).
Exposure to parabens is thought to occur primarily through the skin. They have also been
measured in air and house dust (Rudel, 2009).
Parabens are endocrine disrupters that mimic estrogen (Rudel, 2009).
Flame retardants Flame retardants are found in many consumer products including plastics, furniture,
bedding, electronics, and appliances. Examples include PBDEs and FireMaster 550
(Rudel, 2009; Dodson, 2012).
22
Flame retardants are persistent organic pollutants that easily leach from products into the
environment. Thus they are ubiquitous in the environment and in people and have been
found in remote regions (Rudel, 2009).
Flame retardants are commonly found in dust and air; dust is thought to be the primary
route of exposure, though diet may also play a significant role. Use of flame retardants has
increased rapidly in the past few decades, but some governments have now banned or
heavily restricted their use (Rudel, 2009).
Health effects of flame retardants may include neurological impacts and effects on the
reproductive system (Rudel, 2009; Silent Spring Institute, 2007).
Polychlorinated biphenyls (PCBs) Polychlorinated biphenyls (PCBs) were used in a variety of products including plastics,
paints, electrical equipment, adhesives, floor finish, and caulking. They have been used in
the US since the 1930s and were most prevalent in the 1970s until regulations began to
restrict their use. Example compounds include PCB 52 and PCB 153 (Rudel, 2009).
Dietary exposures to PCBs are generally the most significant, but indoor sources may play
an important secondary role as many PCBs come from the built environment or consumer
products (Rudel, 2009). Exposure may also occur at contaminated industrial sites (Zhou,
2014).
PCBs are developmental neurotoxicants and endocrine disruptors and also have effects on
nervous system function and cancer (Rudel, 2009).
Polycyclic aromatic hydrocarbons (PAHs) Polycyclic aromatic hydrocarbons (PAHs) come from combustion. They come from burning
coal, oil, gas, garbage, tobacco, or meat and are also found in roofing, plastics, and
dyes (ATSDR, 1996). Example compounds include fluoranthene and pyrene (Rudel 2010).
Primary exposure to PAHs comes from air and diet, such as breathing smoke or eating
burnt meat (ATSDR, 1996).
Some PAHs are carcinogenic and have adverse reproductive effects (ATSDR, 1996).
Metals & particulates Metals and particulates come from industrial emissions, traffic, frying food, and cigarette
smoke; they have both outdoor and indoor sources. Example compounds are lead,
vanadium, and PM2.5 (Silent Spring Institute, 2007).
Metals and particulates have been linked to effects on the nervous system, respiratory
system, and cardiac system. They have been shown to increase death rates (Silent Spring
Institute, 2007).
23
Pesticides Pesticides are used to repel or kill things, including bugs, fungus, rodents and germs. They
are often used on pets or plants and can also be found in paints, furniture, and
carpets. DDT, chlordane and permethrin are examples of pesticides (Rudel, 2009).
Pesticides are found indoors and outdoors. Diet and household exposures are thought to
be the two major routes of exposure outside of agricultural or occupational settings. Many
pesticides have been banned or restricted but some long-banned compounds can still be
found today (Rudel, 2009).
Many pesticides are endocrine disrupting compounds. They also are associated with
cancer and neurotoxicity (Rudel 2009).
Green Housing Study data BigBarChart uses a subset of Green Housing Study data: phthalate data in air in Cincinnati
and Boston at 6 months after home renovation and 12 months after home
renovation. Three phthalates were selected from this data: diethyl phthalate (DEP), benzyl
butyl phthalate (BBP), and diethyl hexyl phthalate (DEHP). All three compounds are
plasticizers and have been linked to reproductive effects in animals and/or humans, though
some may be acting as indicators for other chemical exposures (Parlett, 2013). Additional
background information on each chemical can be found below.
Diethyl phthalate (DEP) Diethyl phthalate is a plasticizer used in plastics as well as cosmetics and fragrances (Api,
2000).
DEP has been linked to effects on the reproductive and nervous systems (Miodovnik, 2011;
Swan, 2008). It is often used as a binder for fragrances that are endocrine disrupters and
may serve as an indicator for those exposures; it is unclear if related health outcomes are
due to DEP or the fragrance compounds (Parlett, 2013).
Dermal contact is thought to be the main route of exposure to DEP (Gong,
2014). Consumer products are the main source of these exposures (Rudel, 2011).
Benzyl butyl phthalate (BBP) Benzyl butyl phthalate is a plasticizer used in plastics and flooring (Serrano, 2014; Green
Facts, 2014).
Dermal contact is thought to be the main route of exposure to BBP for most people (Gong,
2014). It is currently banned in toys, childcare objects, and cosmetics (Green Facts, 2014).
BBP is an endocrine disrupting compound (Rudel, 2011). It is also linked to respiratory
effects (Scottish Environmental Protection Agency, 2014).
24
Diethyl hexyl phthalate (DEHP) Diethyl hexyl phthalate is a plasticizer used in plastics (Gong, 2014) and food packaging
(Serrano, 2014; Rudel, 2011).
DEHP is an endocrine disrupting compound (Rudel, 2011) linked to reproductive effects,
cardiac effects, and cancer (Gillum, 2009).
Diet is thought to be the primary route for exposure to DEHP for many people (Gong, 2014).
Changing individuals to a fresh food diet substantially reduced levels of DEHP found in their
urine (Rudel, 2011).
Data content & meaning
Brody (2007) found that participants in environmental health studies often seek answers to
the questions: (1) What did you find? (2) How much? (3) Is that high? (4) Is it safe? (5)
What should I focus on? (6) Where did the chemical come from? (7) What can I do?
Often there is not sufficient research to answer all these questions for emerging chemicals,
particularly in prescribing a “safe” amount. The report-back process—whether it be paper
based, digital, or experiential—is meant to engage people in the scientific process by
accurately conveying gaps in knowledge while also providing practical information. One
method that begins to respond to participants questions is to compare the detected
concentrations of chemicals in a study to amounts found in other studies (questions 1, 2,
and 3). Comparison values can serve as preliminary benchmarks that provide a starting
point for understanding, though they cannot indicate what levels are safe or the effects on
human health. Providing information about chemical sources and health effects also
positions people to consider their relative importance and presents opportunities for
change. For example, an individual with asthma may note that some phthalates have
respiratory health effects and try to remove sources of these chemicals from her/his
home. In conveying this information it is also important to note that data on chemical
sources and health effects is constantly evolving as manufacturers alter product
formulations and researchers conduct additional cell, animal, and human studies on the
effects of these chemicals. Both Data Experiences developed here will try to provide this
type of contextual information to respond to typical participant questions and provide
participants a framework for the information they are considering.
Dressed in Data first provides data context by scaling the square size in the lace patterns
against the median study values. Thus if the concentration of a particular chemical for one
individual is below the study median, its square size will be less than the unit square, while
those above the median will have square sizes exceeding the unit square. This approach is
aligned with current methods where an individual’s values are graphed on a strip plot in
relation to the study median and alongside the values of others in the study. This provides
25
context so the information can more easily be interpreted than a mere value (e.g. “35 ug/g
DDT”). The design and pattern of the clothing will begin to provide contextual information
about the sources of the chemicals (e.g. data representing industrial sources will be black
spots over yellow fabric, hinting at smokestack discharge obscuring the sun).
An initial design of BigBarChart will provide context in a similar manner: bar heights for a
chemical are given as a percentage of the maximum value for the chemicals available; bars
go from zero (minimum height = concentration of zero) to 100 (maximum height = maximum
concentration). This is an initial convenience-based approach, as it ensures that all data
can be displayed on the bars—bars are not required by the data to exceed their maximum
possible physical height. It also provides relative information about the values as opposed
to absolute values. This approach may become problematic since exposure data are often
lognormal, thus maximum values can greatly overshadow the bulk of the dataset, making
values around the median indistinguishable. Future work will consider other possibilities for
scaling data and managing outlying points, such as showing absolute magnitudes, scaling
to a median, or signifying extreme outliers with blinking lights while excluding them from the
data scaling. Each bar in the room will represent one participant in the study for a common
chemical. Bar height shows the amount of that chemical relative to the maximum value.
The current design does not prominently display scale information and the flexible form of
the bar and the inherent error in its position encourages people to understand the error
associated with these measurements. This approach takes advantage of the embodied and
immersive nature of BigBarChart as the heights of the bars can be read relative to the body,
hopefully creating a more memorable experience.
The BigBarChart design also conveys basic health and source information for chemicals
through the soft switches used to select them. Labeled icons on the switches show general
health effects (e.g. reproductive) and sources (e.g. food packaging) related to each
chemical. Though complete detailed information is difficult to convey in this simplified form,
the switches provide a starting point for engagement.
Future BigBarChart designs will allow people to compare the bars to external studies, not
just the current study. Comparison values will be introduced as additional bars, projected
lines, or bar colors. Comparison values will match the scaling protocols used for the study
data; they will be presented as absolute magnitudes or relative to the designated scaling
factor as appropriate. Users will be able to toggle through comparison values to see how
chemical levels in their community compare to other locations or time points. Bar colors
may be used to classify the relative values as “higher,” “similar,” or “lower.” Heights of the
bars can be compared to lines projected on walls or to additional bars. Comparison values
could include national guidelines, estimated effect levels, or results from prior studies—such
as median DDT concentration in the Arctic or median DDT concentration on South Carolina
farms. Outlying high values would turn red to draw additional attention.
Efficacy of these approaches will be studied in detail in future work.
26
Dressed in Data
Overview
Dressed in Data focuses on an individual’s experience receiving chemical data from his/her
own home and body.
Dressed in Data explores ways to map an individual’s exposure data onto his/her
clothing. Clothing is closely tied to the body and intensely personal, just like an individual’s
chemical exposures. Embedding exposure information into clothing prompts us to develop a
more intuitive sense for the data and to keep it with us throughout the day. It can also serve
as a point of conversation and sharing with others, achieving the Data Experience goal of
increased engagement and memorability.
The project includes design of possible translations from data to patterns, code to map
environmental health data to laser cut files, materials testing, and development of basic
clothing patterns. Patterns focus on effectively conveying quantities and amounts of
detected chemicals; initial work explores lace patterns that represent detected chemicals as
squares sized based on concentration values. This provides a “one glance” intuitive
understanding of an individual’s exposures. Further information on chemical sources and
health effects can be conveyed through color choices, fabric, and pattern design; for
example flowery prints may be used to signify that data is related to gardening or pesticide
exposures.
Related work
A number of projects explore computational design for craft and clothing as a display
interface, as described below. This includes works by Jacobs and Buechley (Codeable
Objects, 2013) and Zoran (Hybrid Mediums, 2013) that offer paths for pairing craft and
computational design. For example, FreeD (Zoran, 2013) presents a handheld milling tool
that provides guidance based on a 3D model of the object. The tool adapts its feedback if
the user adjusts the 3D model and the user can also autonomously control the tool to
override the model to achieve the benefits of handcrafted design. Related works include
Hybrid Basketry (2013) and Hybrid Reassemblage (2013). Jacobs & Buechley (2013)
present a number of insights on the process of pairing craft and computational design for
general use, such as the importance of simplifying code syntax to soften the learning curve
for new programmers. Their users from both programming and craft backgrounds
expressed engagement and continued interest in mixing craft with technical approaches
(Jacobs, 2013).
27
Additional projects work with datasets to create fashion or art. Nathalie Miebach’s data
sculptures map astronomy, ecology and meteorology data to intricate shapes. Her woven
sculptures explore the role of aesthetics in expressing and understanding science (Miebach,
2014) and she has also explored the use of music for expressing data (Miebach, 2012). For
example, “Recording and Translating Climate Change” compares current weather data to
historical trends through pieces in both music and sculpture. Chen’s x.pose project (2014)
ties fashion with data. This shirt has a 3D printed structure that frames material than can be
solid or transparent. The transparency of the shirt increases as the wearer produces more
shared data (Chen, 2014).
Other related projects use participatory creation of fashion through technology as a means
for empowerment. For example, DressCode engages new programmers by providing an
interface that displays both the code and the design output in real time (Jacobs, 2013). It
reaches out to groups often underrepresented in technology, particularly young women, and
provides a platform for new modes of expression and the blending of craft and
computational design (Jacobs, 2013).
Design considerations & scenarios
Two sets of works were created: a set of garments suited for fashion and a shirt meant for
daily wear.
The fashion-oriented garments are intended to be an eye catching example of data display
with aesthetic consistency within themselves. They could be displayed in a public space,
photographed for media, or shown in an arts setting. This serves as another avenue for
bringing publicity to environmental health studies and engaging new audiences. In
particular, they provide an opportunity to combine art and data and encourage
communication between individuals in these spheres. Data is primarily displayed on the
back of the fashion-oriented garments as the intended audience is the general public, not
the user.
The second piece serves as an example of the type of garment that could be given to—or
even designed and created by—participants in exposure studies as part of an effort to
report findings from their homes. This garment is casual and comfortable enough for
everyday use. The design is conspicuous enough that it opens the door for the wearer to
discuss their results with family, friends, strangers, media, or others by using the shirt as a
reference point. Yet it is sufficiently aligned with everyday styles so that such conversations
are not required if the wearer would prefer to avoid them.
28
Software and fabrication system
These data-based garments required development in a number of areas:
preliminary explorations of display options
R code to transform data into a lace pattern, including multiple display options
design files for garment patterns of various styles
“artisanal” laser cutting approaches and garment fabrication
Code & data display Inputs to the system are csv files with chemical names, measurements, participant ID, and
auxiliary data (e.g chemical class, measurement media). Functions sort and clean data
based on user selection of chemical group and participant.
A number of data display options are supported and can be customized based on
knowledge and preferences of the user. First, chemicals that were not detected in a home
can be set to a variety of values before creating the lace pattern. This is particularly
important with emerging contaminants since analytic methods are often still in development
causing high detection limits. Thus in some cases researchers may want to assign “non-
detects” to a small number below the detection limit if the chemical is thought to be
ubiquitous. The code also supports selection of a variety of comparison points. Squares
are scaled relative to the selected value—such as the chemical class median, chemical
class maximum, or an external value—to give context to the data.
Additionally, the code provides functions to shape the lace pattern into an iterable
form. Suggestions are made based on the number of chemicals in the group. Dimensions
are set to ensure that the pattern can be effectively cut in most fabrics (e.g. sufficient line
thickness and square size to ensure robustness of remaining material).
The program outputs black and white JPEGs that can be used in Corel Draw to create cut
files for the laser cutter.
“Artisanal” laser cutting JPEGs of data patterns and data scaffolding were translated to cut files by using the trace
functionality of Corel Draw. Files were then cut using an Epilogue laser cutter.
Copier scanners were also used to bridge the gap between handmade patterning and CAD
software. The speed and precision of CAD tools and the laser cutter was critical to creating
these garments. Yet in some circumstances hands-on intuition or an artistic eye was
necessary for design optimization. For example, it is easy to notice poorly aligned pieces
when pinning them together. One can rework these curves using scissors then scan them
to JPEGs that can be traced in CAD software to refine the shapes of the pattern. These
hand-cut curves can be smoothed in CAD software if needed, and pattern pieces can then
29
be cut in mass on the laser cutter. This hybrid of computationally constructed and
handmade items is also useful in creating iterated designs or switching between materials—
hand drawn sketches with a repeating pattern can be scanned and then iterated in CAD
software to save time or created in an alternative material then transferred to the laser
cutter for use with a different material. For example, snowflake patterns can easily be cut
by hand in paper, but cutting them directly in fabric leads to distortion and fraying. Cutting a
snowflake in paper, scanning it, and then laser cutting it in a fabric with synthetic content
creates the desired outcome. The laser cutter is an intriguing tool for craft and warrants
further exploration.
Most fabrics are well suited to laser cutting. The specific considerations, guidelines and
recommended settings for cutting fabric on the Epilogue laser cutter found below come from
trial and error in the Dressed in Data fabrication process.
all fabrics: patterns with thin curves or unfixed edges lose their form; straight lines
and fixed edges are easier to work with. Fabrics cut nicely; those with high synthetic
content will seal at the edges. Be aware of this when layering fabric for cutting
(layers may melt to each other) or cutting stretch fabric (sealed edges will extend but
will not regain their shape after stretching).
silk (high fashion pieces): raster nicely on low settings (~10% power, 95%
speed). Handle with care when placing in the laser cutter as fabric can easily twist
and misalign itself though appearing flat. Pre-folding pieces and unfolding them onto
the bed can be beneficial.
stretch blends (daily wear shirt): stretch fabrics with high synthetic content will
melt when rastered creating non-extendable sections. Non-synthetics, such as
cotton or soy blends, burn easily when rastered thus thicker fabric must be used and
rastered at low settings (98% speed; 5% power) to avoiding tearing.
novelty fabrics (data): leathers are often treated and may release fumes that
should be avoided. Fabrics with significant texture may lead to jagged or incomplete
cuts. Faux fur burns easily and cuts very poorly creating a molting look.
sheer fabrics (data scaffolding): should be cut on very low settings (8% power,
95% speed) to avoid burning or tearing. Shapes should be sufficiently thick (~3/16”)
to keep their form and avoid tears. Thicker sheers are easier to work with and
stretch sheers are often less reliable.
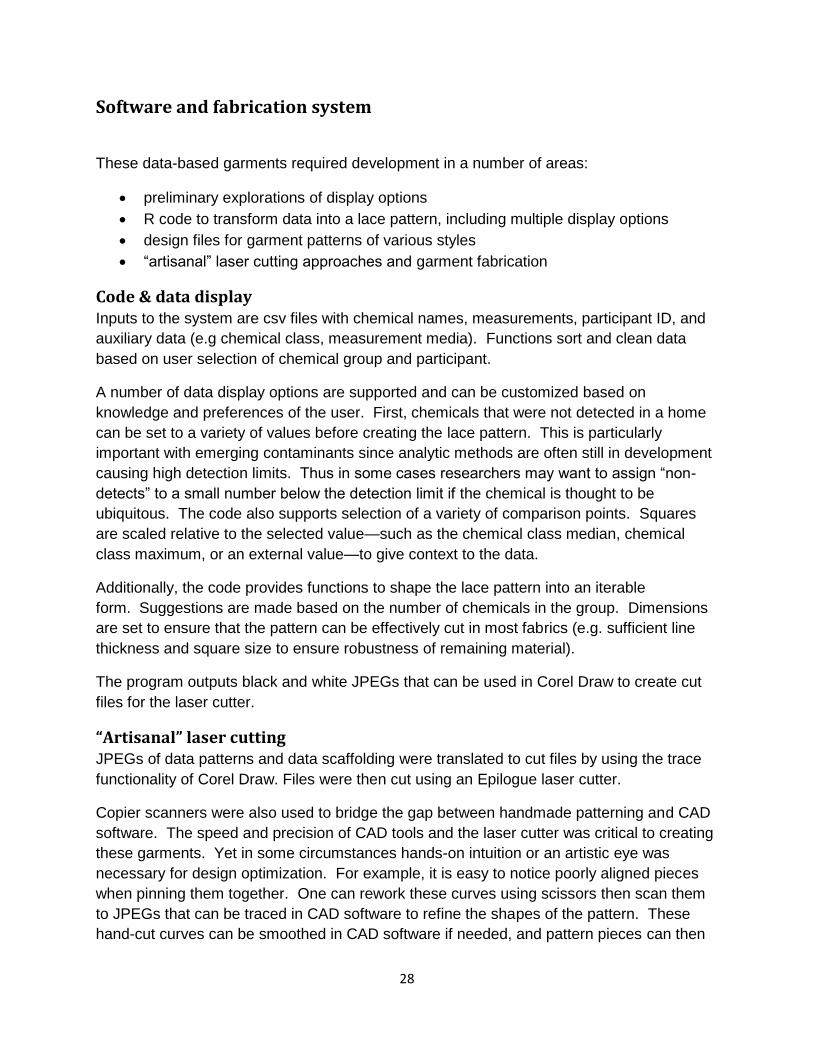
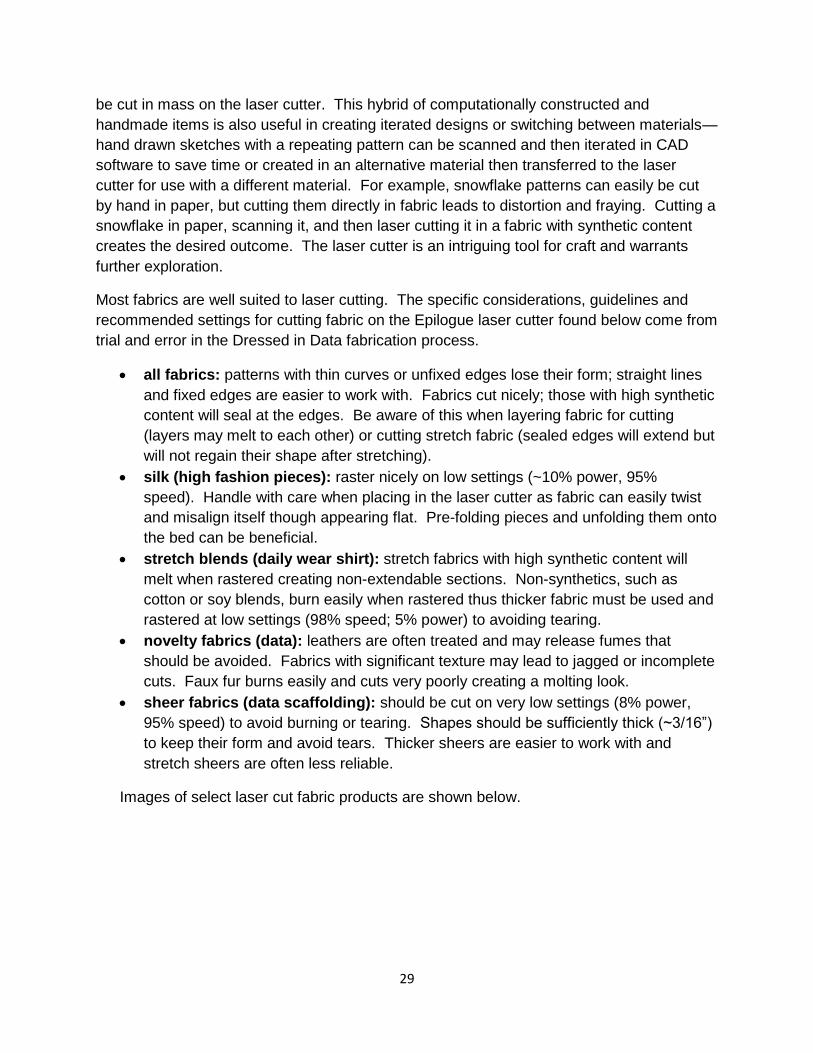
Images of select laser cut fabric products are shown below.
30
rastered natural fabrics (soy & cotton stretch blend)
rastered synthetic stretch fabric (rastered regions melt and cannot be stretched)
31
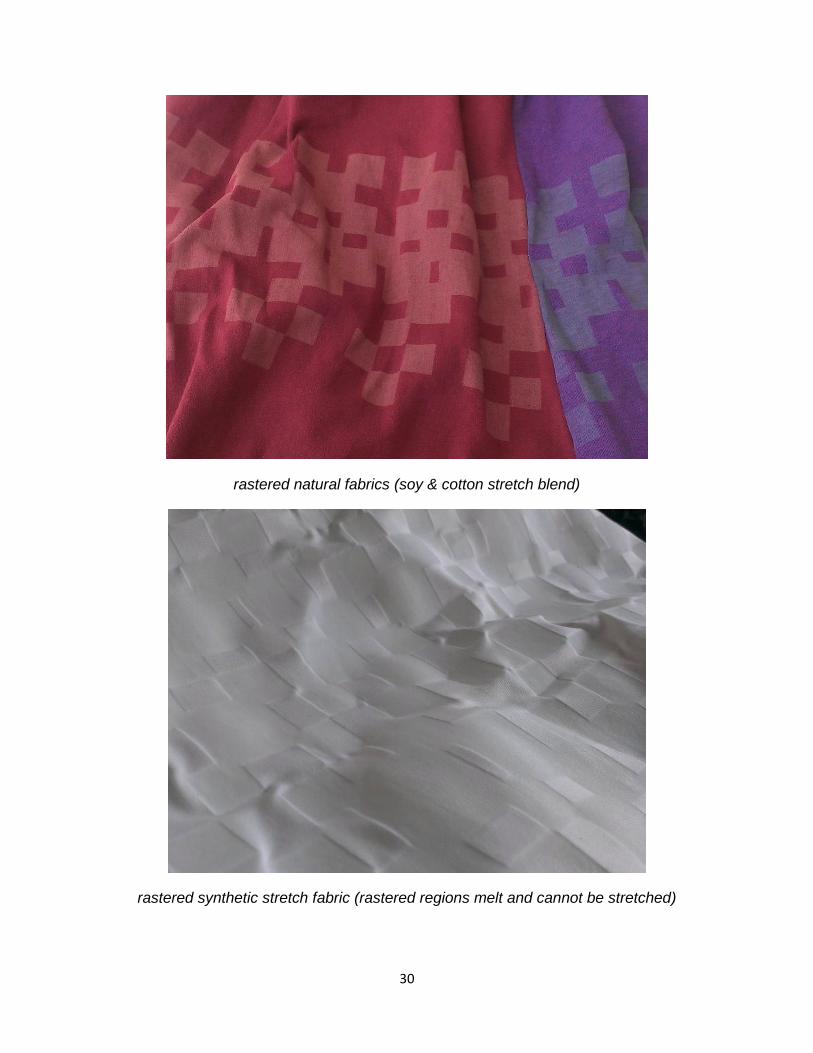
shapes created though hybrid hand traced and CAD design methods
Garment and data pieces were assembled through sewing and gluing. Garments were
sewn through traditional methods, including fasteners, trim, and sizing. Data layers were
glued to one another to create the final product for the high fashion pieces. Data layers
were aligned with scaffolding layers and fabric glue was applied to each data point to affix
the two. The scaffolding portions of the data layer were cut away with scissors, leaving the
mesh scaffolding and the data. This was an effective but time consuming process that
warrants further iteration. Everyday garments included data patterns through rastering the
fabric directly. Silk screening data or printing data onto fabric may also create the desired
effect.
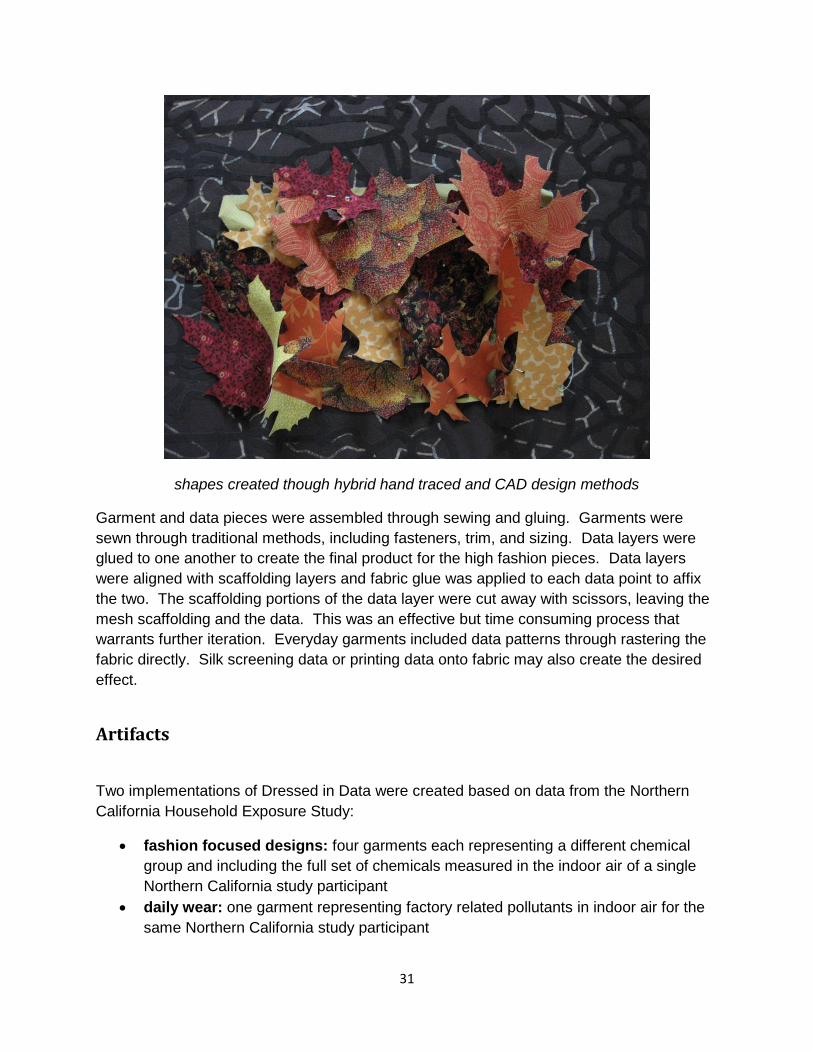
Artifacts
Two implementations of Dressed in Data were created based on data from the Northern
California Household Exposure Study:
fashion focused designs: four garments each representing a different chemical
group and including the full set of chemicals measured in the indoor air of a single
Northern California study participant
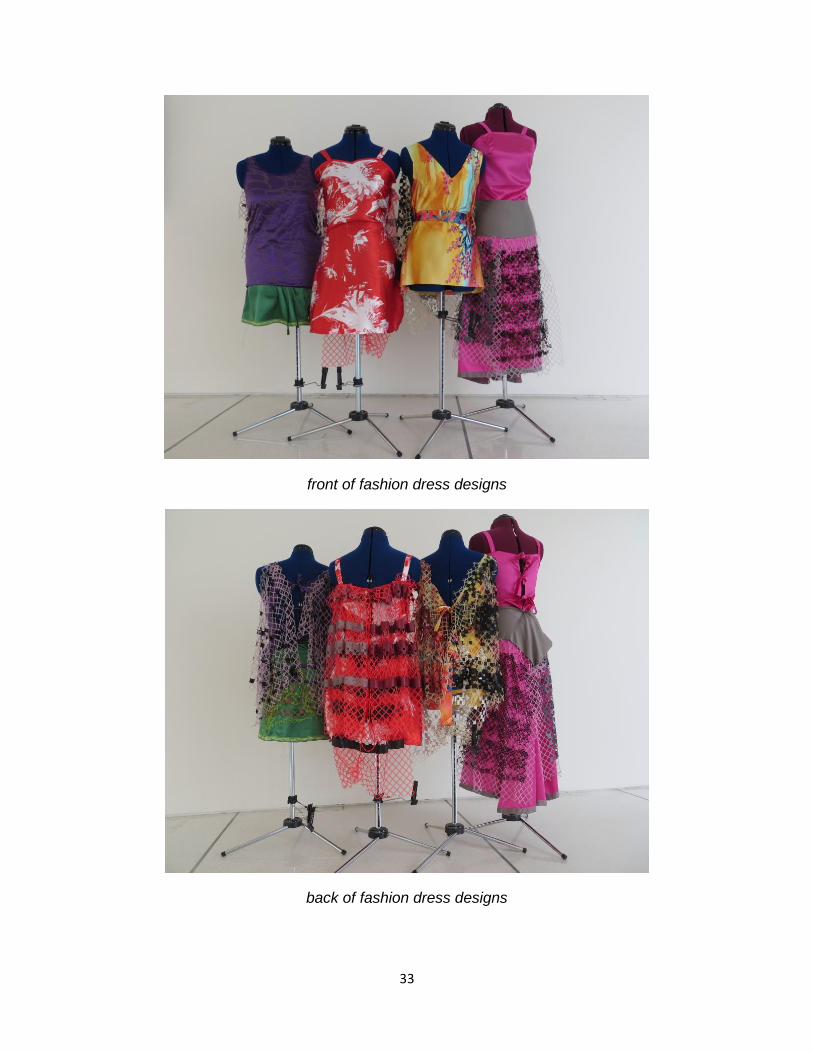
daily wear: one garment representing factory related pollutants in indoor air for the
same Northern California study participant
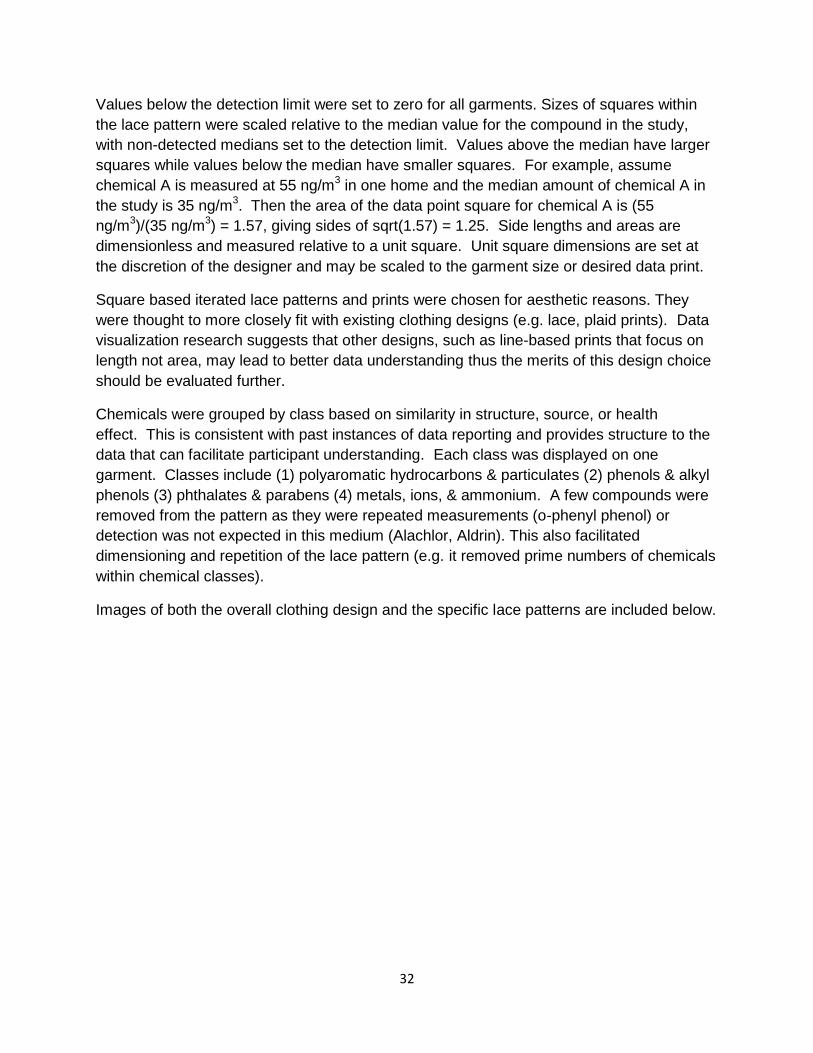
32
Values below the detection limit were set to zero for all garments. Sizes of squares within
the lace pattern were scaled relative to the median value for the compound in the study,
with non-detected medians set to the detection limit. Values above the median have larger
squares while values below the median have smaller squares. For example, assume
chemical A is measured at 55 ng/m3 in one home and the median amount of chemical A in
the study is 35 ng/m3. Then the area of the data point square for chemical A is (55
ng/m3)/(35 ng/m
3) = 1.57, giving sides of sqrt(1.57) = 1.25. Side lengths and areas are
dimensionless and measured relative to a unit square. Unit square dimensions are set at
the discretion of the designer and may be scaled to the garment size or desired data print.
Square based iterated lace patterns and prints were chosen for aesthetic reasons. They
were thought to more closely fit with existing clothing designs (e.g. lace, plaid prints). Data
visualization research suggests that other designs, such as line-based prints that focus on
length not area, may lead to better data understanding thus the merits of this design choice
should be evaluated further.
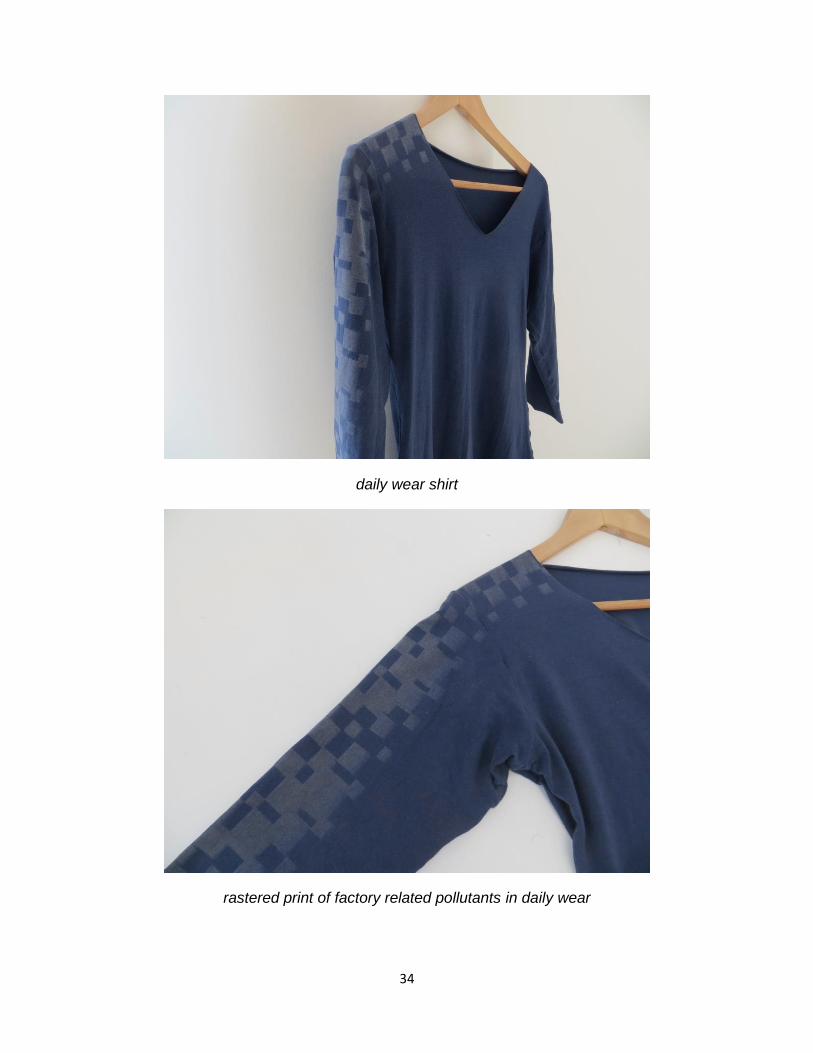
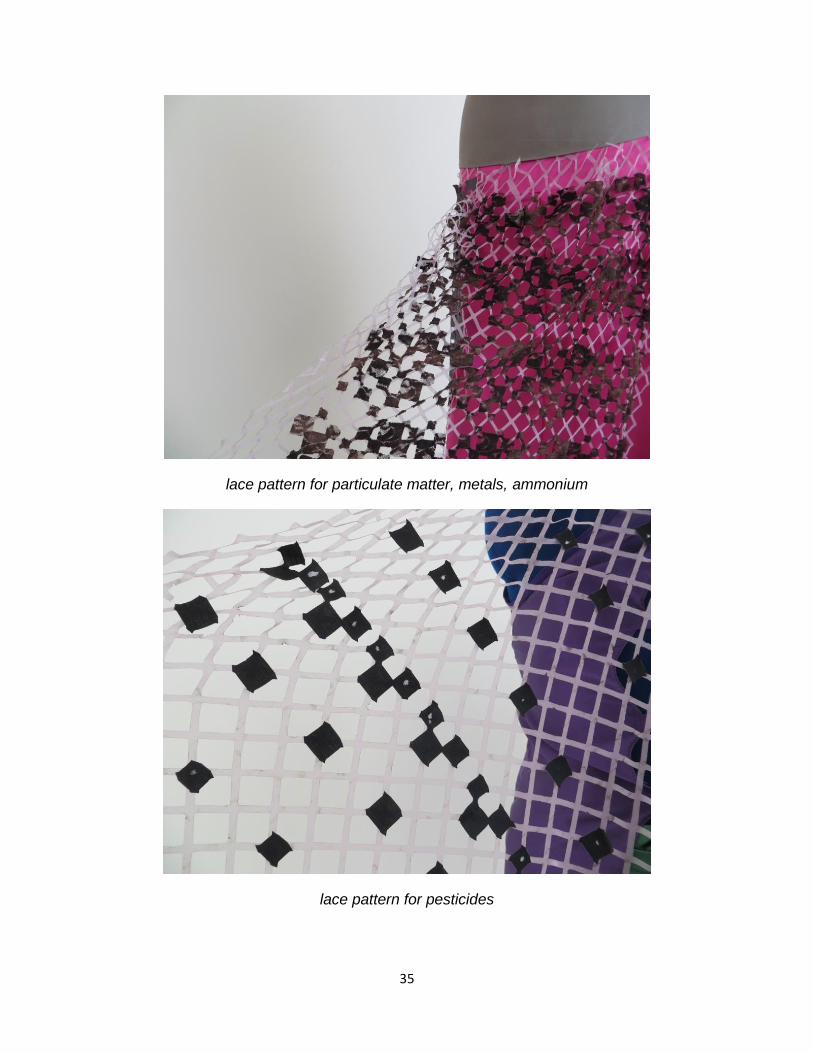
Chemicals were grouped by class based on similarity in structure, source, or health
effect. This is consistent with past instances of data reporting and provides structure to the
data that can facilitate participant understanding. Each class was displayed on one
garment. Classes include (1) polyaromatic hydrocarbons & particulates (2) phenols & alkyl
phenols (3) phthalates & parabens (4) metals, ions, & ammonium. A few compounds were
removed from the pattern as they were repeated measurements (o-phenyl phenol) or
detection was not expected in this medium (Alachlor, Aldrin). This also facilitated
dimensioning and repetition of the lace pattern (e.g. it removed prime numbers of chemicals
within chemical classes).
Images of both the overall clothing design and the specific lace patterns are included below.
33
front of fashion dress designs
back of fashion dress designs
34
daily wear shirt
rastered print of factory related pollutants in daily wear
35
lace pattern for particulate matter, metals, ammonium
lace pattern for pesticides
36
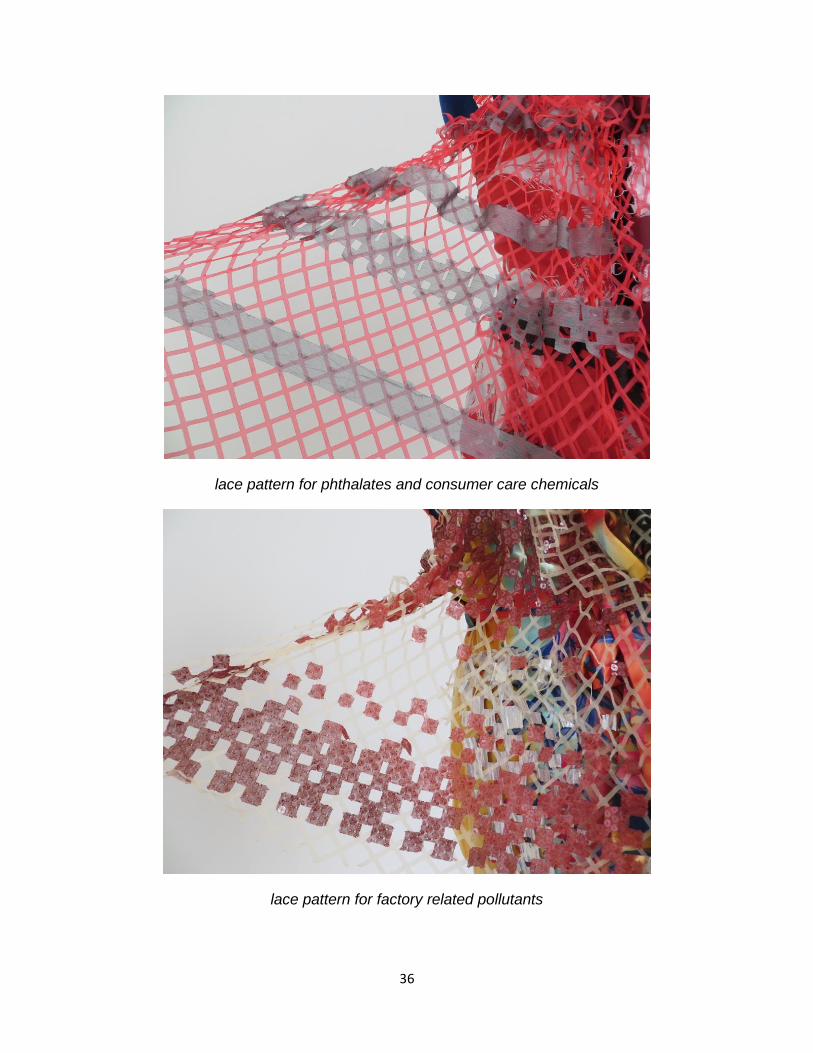
lace pattern for phthalates and consumer care chemicals
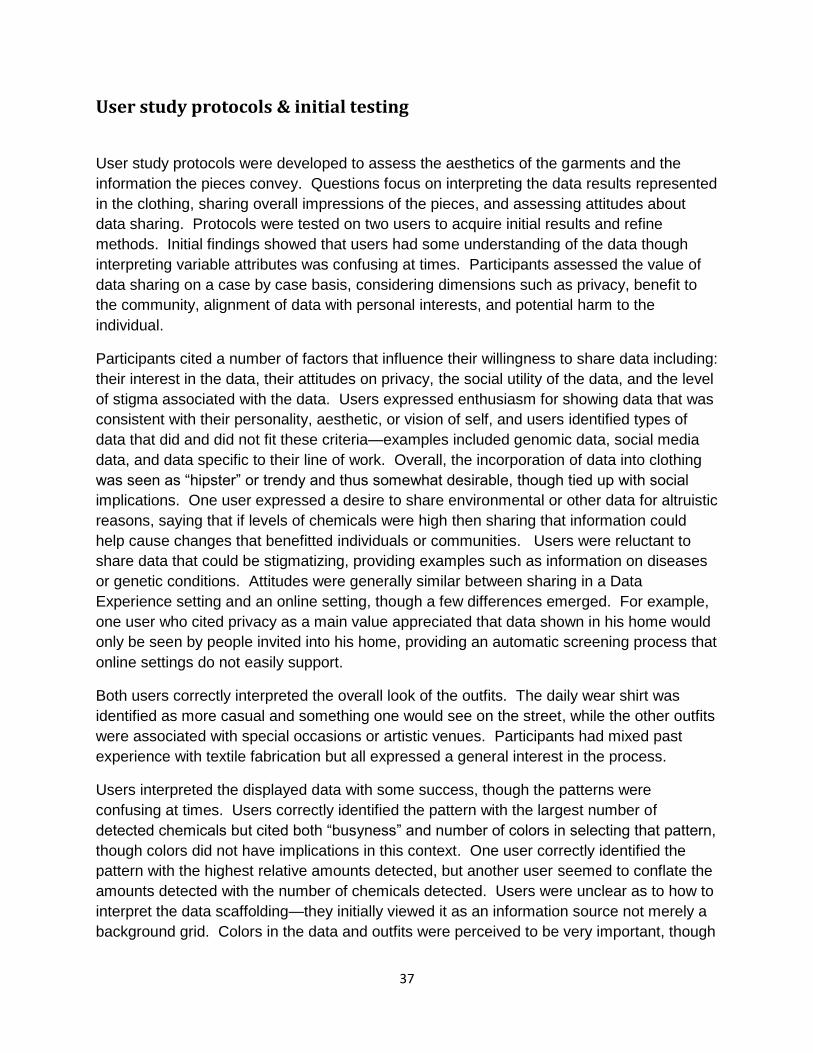
lace pattern for factory related pollutants
37
User study protocols & initial testing
User study protocols were developed to assess the aesthetics of the garments and the
information the pieces convey. Questions focus on interpreting the data results represented
in the clothing, sharing overall impressions of the pieces, and assessing attitudes about
data sharing. Protocols were tested on two users to acquire initial results and refine
methods. Initial findings showed that users had some understanding of the data though
interpreting variable attributes was confusing at times. Participants assessed the value of
data sharing on a case by case basis, considering dimensions such as privacy, benefit to
the community, alignment of data with personal interests, and potential harm to the
individual.
Participants cited a number of factors that influence their willingness to share data including:
their interest in the data, their attitudes on privacy, the social utility of the data, and the level
of stigma associated with the data. Users expressed enthusiasm for showing data that was
consistent with their personality, aesthetic, or vision of self, and users identified types of
data that did and did not fit these criteria—examples included genomic data, social media
data, and data specific to their line of work. Overall, the incorporation of data into clothing
was seen as “hipster” or trendy and thus somewhat desirable, though tied up with social
implications. One user expressed a desire to share environmental or other data for altruistic
reasons, saying that if levels of chemicals were high then sharing that information could
help cause changes that benefitted individuals or communities. Users were reluctant to
share data that could be stigmatizing, providing examples such as information on diseases
or genetic conditions. Attitudes were generally similar between sharing in a Data
Experience setting and an online setting, though a few differences emerged. For example,
one user who cited privacy as a main value appreciated that data shown in his home would
only be seen by people invited into his home, providing an automatic screening process that
online settings do not easily support.
Both users correctly interpreted the overall look of the outfits. The daily wear shirt was
identified as more casual and something one would see on the street, while the other outfits
were associated with special occasions or artistic venues. Participants had mixed past
experience with textile fabrication but all expressed a general interest in the process.
Users interpreted the displayed data with some success, though the patterns were
confusing at times. Users correctly identified the pattern with the largest number of
detected chemicals but cited both “busyness” and number of colors in selecting that pattern,
though colors did not have implications in this context. One user correctly identified the
pattern with the highest relative amounts detected, but another user seemed to conflate the
amounts detected with the number of chemicals detected. Users were unclear as to how to
interpret the data scaffolding—they initially viewed it as an information source not merely a
background grid. Colors in the data and outfits were perceived to be very important, though
38
these selections were based on metadata and aesthetics. Overlap between the individual
squares caused confusion for one user. Future work will explore alternative data mappings,
such as linear instead of area based mappings of amounts and assigning significance to
color, as detailed in later sections.
Limitations & future work
Future user studies will test Dressed in Data designs with environmental health study
participants using their own data. Studies will provide important information on clothing
design, aesthetic, and perception of data that will inform design iterations to improve user
experience. Future work will create garments for a set of environmental health participants
based on their own data and then test these garments with them to better describe the
emotional engagement.
Options for data pattern design will also be considered. Currently, concentrations for an
individual are expressed as an area of a square scaled relative to a comparison value (e.g.
chemical median). Expressing amount in two dimensions (e.g. square) may not be as
readable as expressing it in one dimension (e.g. line or bar). Direct comparisons of
chemical amounts are also not possible since concentrations are scaled relative to their
respective medians. Additionally, pattern iteration and ordering of chemicals within a
pattern relative to one another may influence interpretation. Currently chemicals are
ordered by convenience (e.g. alphabetically) within a class; ordering chemicals by
concentration, relative amount, or randomly may create a different overall impression of the
data, especially as individual squares may overlap with one another when they exceed the
unit square. Designers may also rescale the data pattern based on the clothing item or the
user’s size—this is highly valuable aesthetically but may create inconsistencies in
interpretation or comparison. These possibilities will be considered further and evaluated
by closely examining the data visualization literature and conducting additional user studies.
Future iterations may engage the participants in the garment design itself. Participants will
have the opportunity to select colors, clothing styles, clothing sizes, and fabric type based
on their personal tastes. This will act to increase engagement and memorability of the Data
Experience. Advanced users could also customize data display—for example placement of
pattern on the garment, iteration of pattern, shape of pattern, data subsetting, or data
comparisons—and cut and sew the garments themselves. Much of the existing code and
process works towards these goals and could be formalized into workshops for garment
creation, as in the DressCode project (Jacobs, 2013). Involving environmental health study
participants in the garment design and fabrication has the potential to increase
engagement, understanding, and personalization. It is also a bridge for individuals
comfortable in the artistic sphere to use to achieve better data literacy, and for those
comfortable with data to gain an appreciation for the aesthetics of information. Individuals
39
and tools already established in both areas can help facilitate these exchanges. Individuals
feel significant ownership of their clothing choices and personal fashion; leveraging this
sense of ownership by including their data in the process may help them engage with the
information in a space they’ve already established as their own.
Finally, future work will display data in real time, or much closer to it, to increase the real life
relevance of information. Current pieces are static and based on one time measurements
due to the fact that chemicals included in the data require in-depth sampling and lab work to
measure, on the scale of weeks of labor. Additionally, though less of a limiting factor, the
clothing fabrication process does take a number of hours. These limitations can be
addressed through advances in sensors, clothing fabrication, and clothing interactivity.
A few chemicals of concern—such as particulate matter, ozone, and carbon dioxide—can
already be measured in real time or almost real time with fairly reliable and affordable
sensors (Taking Space, 2014; Futurlec, 2014). As more information arises about the health
effects of other chemicals, researchers will find faster and cheaper ways to measure
them. Multiple groups and funding sources are currently beginning to cover this space
(Knight Foundation, 2014). Measurement techniques that are fast and affordable enough
for daily use could be leveraged to make garments that provide a more holistic view of an
individual’s exposures. Indeed, the fashion industry itself is eager to develop a “t-shirt
machine” that can create simple garments without human intervention (Bevans, 2014). One
could imagine being presented every morning with a shirt patterned with your exposure
information from the previous day. This implementation acts as a bridge to real time data
display which will be possible with better chemical sensors paired with improvements to
adaptable fashion. Indeed, fashion technology is one of the next fronts in wearables. A
number of fashion projects have started to explore this space of shape changing fashion
and data display (Chen, 2014; Perovich, 2013). As the materials and processes advance,
they will become more suited to daily fashion and can be paired with existing soft materials
with specialized functions such as color changing ink, color changing thread, and smocking
thread that are already established in the crafting community. One can imagine the print on
your shirt changing as your chemical exposures change; your clothing changing shape and
stiffness to become uncomfortable and encourage you to leave a heavily polluted area; or
your clothing increasing its protectiveness by offering air filtration in polluted spaces. These
types of projects would increase understanding by giving ongoing relevant information and
prompting action based on these understandings.
40
BigBarChart
Overview
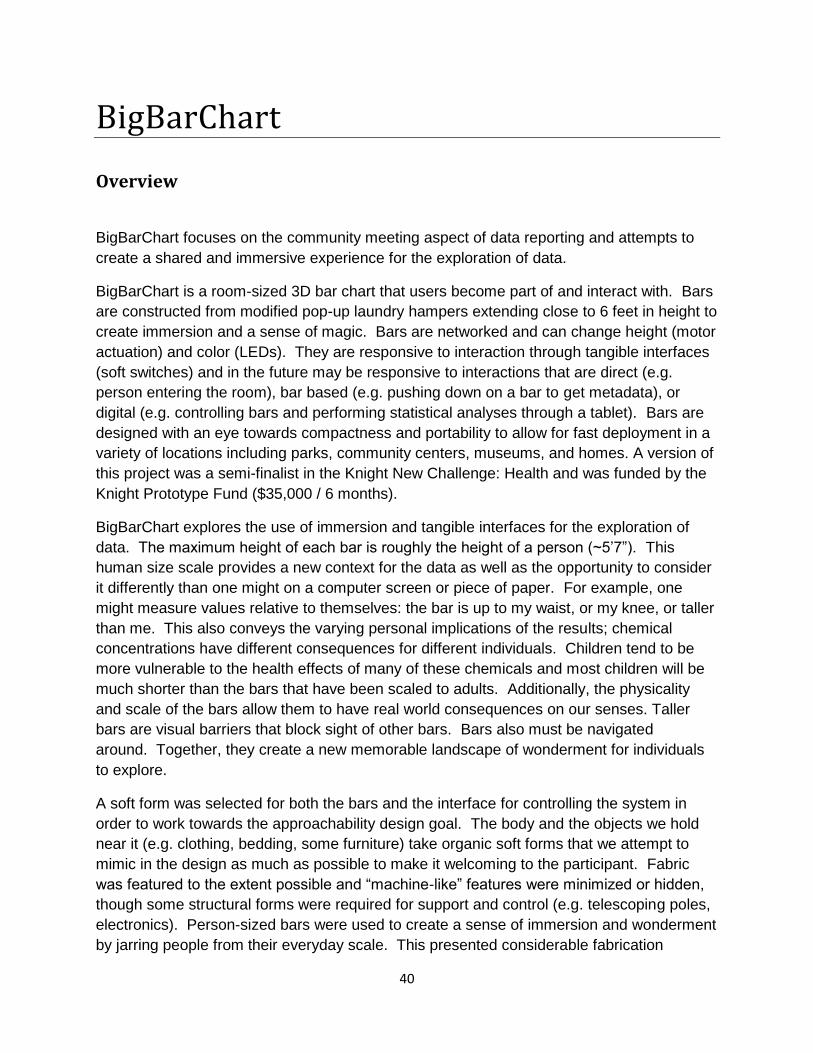
BigBarChart focuses on the community meeting aspect of data reporting and attempts to
create a shared and immersive experience for the exploration of data.
BigBarChart is a room-sized 3D bar chart that users become part of and interact with. Bars
are constructed from modified pop-up laundry hampers extending close to 6 feet in height to
create immersion and a sense of magic. Bars are networked and can change height (motor
actuation) and color (LEDs). They are responsive to interaction through tangible interfaces
(soft switches) and in the future may be responsive to interactions that are direct (e.g.
person entering the room), bar based (e.g. pushing down on a bar to get metadata), or
digital (e.g. controlling bars and performing statistical analyses through a tablet). Bars are
designed with an eye towards compactness and portability to allow for fast deployment in a
variety of locations including parks, community centers, museums, and homes. A version of
this project was a semi-finalist in the Knight New Challenge: Health and was funded by the
Knight Prototype Fund ($35,000 / 6 months).
BigBarChart explores the use of immersion and tangible interfaces for the exploration of
data. The maximum height of each bar is roughly the height of a person (~5’7”). This
human size scale provides a new context for the data as well as the opportunity to consider
it differently than one might on a computer screen or piece of paper. For example, one
might measure values relative to themselves: the bar is up to my waist, or my knee, or taller
than me. This also conveys the varying personal implications of the results; chemical
concentrations have different consequences for different individuals. Children tend to be
more vulnerable to the health effects of many of these chemicals and most children will be
much shorter than the bars that have been scaled to adults. Additionally, the physicality
and scale of the bars allow them to have real world consequences on our senses. Taller
bars are visual barriers that block sight of other bars. Bars also must be navigated
around. Together, they create a new memorable landscape of wonderment for individuals
to explore.
A soft form was selected for both the bars and the interface for controlling the system in
order to work towards the approachability design goal. The body and the objects we hold
near it (e.g. clothing, bedding, some furniture) take organic soft forms that we attempt to
mimic in the design as much as possible to make it welcoming to the participant. Fabric
was featured to the extent possible and “machine-like” features were minimized or hidden,
though some structural forms were required for support and control (e.g. telescoping poles,
electronics). Person-sized bars were used to create a sense of immersion and wonderment
by jarring people from their everyday scale. This presented considerable fabrication
41
challenges so smaller bars (standard 2 ft. pop-up laundry hamper) were used in early
prototyping.
The physicality and softness of the form also begins to convey a sense of error that is part
of the measurements. The form is not highly structural, rigid, or precise and it does not
appear to be a machine. Instead, as the external form is fabric based, it resembles a
muppet and has a soft “sketched” sense to it that invites approximation. A height is
presented as data instead of a precise numeric value and the height has some variation
within itself as the bars tend to be not fully level and the motor winding introduces small
variations.
The project includes exploration of mechanics (e.g. base design, gearing, springs), data
design (e.g. what functionality to include), electronics (e.g. networking, motor actuation,
lighting), and fabrication techniques (e.g. manufacturing partnerships and
communication). Results from preliminary user testing and informal conversations with
participants and researchers will guide future iterations of the project.
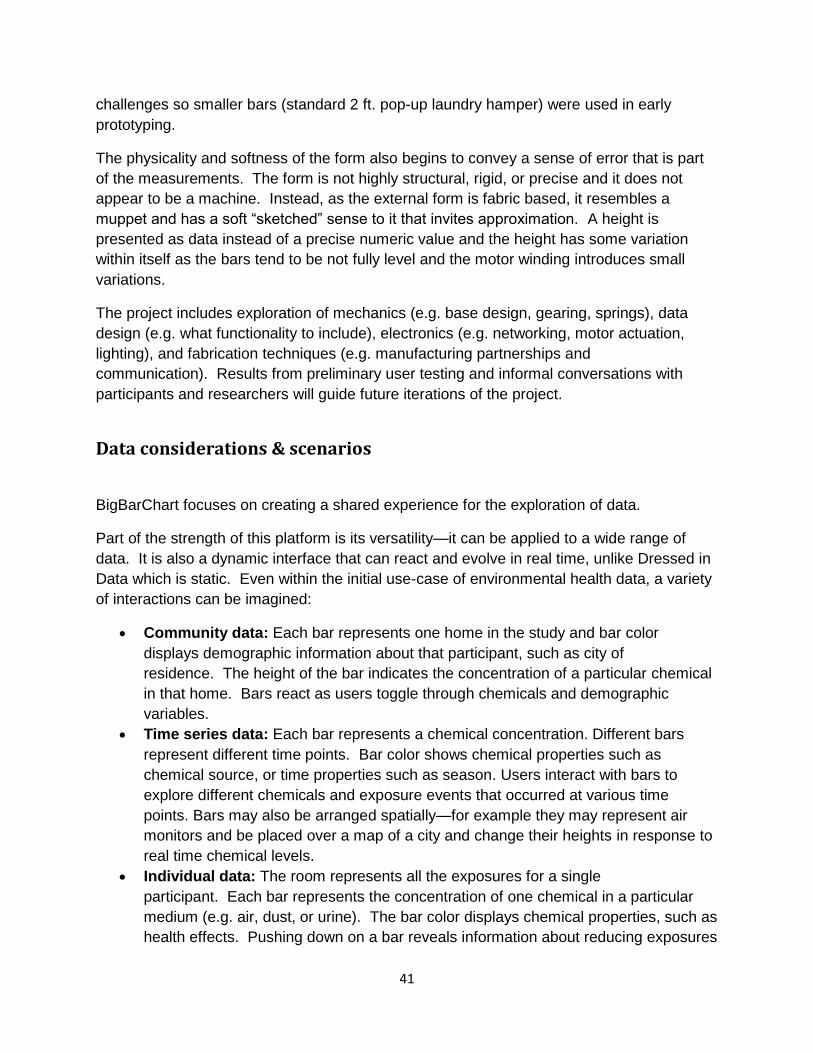
Data considerations & scenarios
BigBarChart focuses on creating a shared experience for the exploration of data.
Part of the strength of this platform is its versatility—it can be applied to a wide range of
data. It is also a dynamic interface that can react and evolve in real time, unlike Dressed in
Data which is static. Even within the initial use-case of environmental health data, a variety
of interactions can be imagined:
Community data: Each bar represents one home in the study and bar color
displays demographic information about that participant, such as city of
residence. The height of the bar indicates the concentration of a particular chemical
in that home. Bars react as users toggle through chemicals and demographic
variables.
Time series data: Each bar represents a chemical concentration. Different bars
represent different time points. Bar color shows chemical properties such as
chemical source, or time properties such as season. Users interact with bars to
explore different chemicals and exposure events that occurred at various time
points. Bars may also be arranged spatially—for example they may represent air
monitors and be placed over a map of a city and change their heights in response to
real time chemical levels.
Individual data: The room represents all the exposures for a single
participant. Each bar represents the concentration of one chemical in a particular
medium (e.g. air, dust, or urine). The bar color displays chemical properties, such as
health effects. Pushing down on a bar reveals information about reducing exposures
42
to that chemical. Bars react to show the data of the participant currently in the room
and allow users to explore different media or chemical properties.
For the purposes of this thesis, the data interactions will focus on community data for three
chemicals at two time points using data from the Green Housing Study (GHS). Chemicals
are diethyl phthalate (DEP), butyl benzyl phthalate (BBP), and diethyl hexyl phthalate
(DEHP). Chemicals were selected based on data availability and confidence in data
values. Time points are 6 months and 12 months after home renovations. Two time points
were selected as an initial test of the interpretation of the movement of the bars; does
seeing the process of bar heights changing from one time to the next bring meaning and
might this be extended to more densely packed time series data? Each bar represents the
concentration of the selected chemical in one home at the selected time point. Users
employ tangible interfaces (soft switches) to toggle between variables.
Data selection and interaction designs were first simulated with computer based
animations. Animations were created in R from GHS data and informed BigBarChart data
use. Examples of these animations can be found in online materials.
Hardware, software & system
Process BigBarChart is a unique form fairly distant from existing products. I thought of my
prototyping process as the “Frankenstein” approach to creating new objects. I found
everyday objects that approximated the desired functionality by scanning daily life with help
from colleagues and friends. Initial prototypes patched these objects together casually
(duct tape and hot glue) as a first test of feasibility. Promising prototypes were then iterated
on by creating more precise connections and better fitted parts. Amazon’s “you might also
like” feature proved to be a useful tool in the process of finding better suited parts. Finally,
when a reasonably robust overall design was established manufacturers were engaged to
create custom parts for pieces that could not be fabricated locally. This “Frankenstein”
approach of repurposing everyday parts proved to be a productive mode of prototyping new
forms.
Bars were actuated from the ground up so they could be installed quickly in a variety of
places with minimal impact on the location. This is mechanically more difficult than
actuation from the ceiling down, but provides benefits in mobility. Bars require only a power
source and ideally a somewhat dim space for better viewing of the bar colors; no drilling or
affixing structures to the ceiling is necessary.
System overview The BigBarChart system contains a number of mechanical and electronic components. A
brief description of each part is included below:
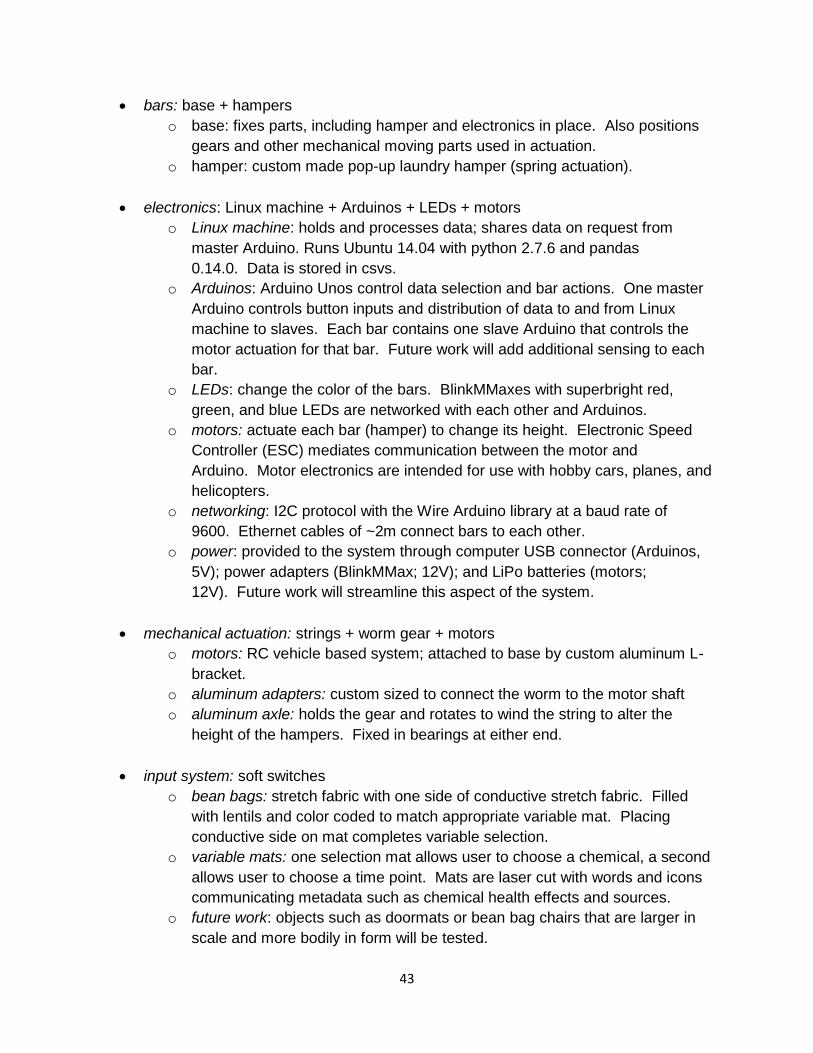
43
bars: base + hampers
o base: fixes parts, including hamper and electronics in place. Also positions
gears and other mechanical moving parts used in actuation.
o hamper: custom made pop-up laundry hamper (spring actuation).
electronics: Linux machine + Arduinos + LEDs + motors
o Linux machine: holds and processes data; shares data on request from
master Arduino. Runs Ubuntu 14.04 with python 2.7.6 and pandas
0.14.0. Data is stored in csvs.
o Arduinos: Arduino Unos control data selection and bar actions. One master
Arduino controls button inputs and distribution of data to and from Linux
machine to slaves. Each bar contains one slave Arduino that controls the
motor actuation for that bar. Future work will add additional sensing to each
bar.
o LEDs: change the color of the bars. BlinkMMaxes with superbright red,
green, and blue LEDs are networked with each other and Arduinos.
o motors: actuate each bar (hamper) to change its height. Electronic Speed
Controller (ESC) mediates communication between the motor and
Arduino. Motor electronics are intended for use with hobby cars, planes, and
helicopters.
o networking: I2C protocol with the Wire Arduino library at a baud rate of
9600. Ethernet cables of ~2m connect bars to each other.
o power: provided to the system through computer USB connector (Arduinos,
5V); power adapters (BlinkMMax; 12V); and LiPo batteries (motors;
12V). Future work will streamline this aspect of the system.
mechanical actuation: strings + worm gear + motors
o motors: RC vehicle based system; attached to base by custom aluminum L-
bracket.
o aluminum adapters: custom sized to connect the worm to the motor shaft
o aluminum axle: holds the gear and rotates to wind the string to alter the
height of the hampers. Fixed in bearings at either end.
input system: soft switches
o bean bags: stretch fabric with one side of conductive stretch fabric. Filled
with lentils and color coded to match appropriate variable mat. Placing
conductive side on mat completes variable selection.
o variable mats: one selection mat allows user to choose a chemical, a second
allows user to choose a time point. Mats are laser cut with words and icons
communicating metadata such as chemical health effects and sources.
o future work: objects such as doormats or bean bag chairs that are larger in
scale and more bodily in form will be tested.
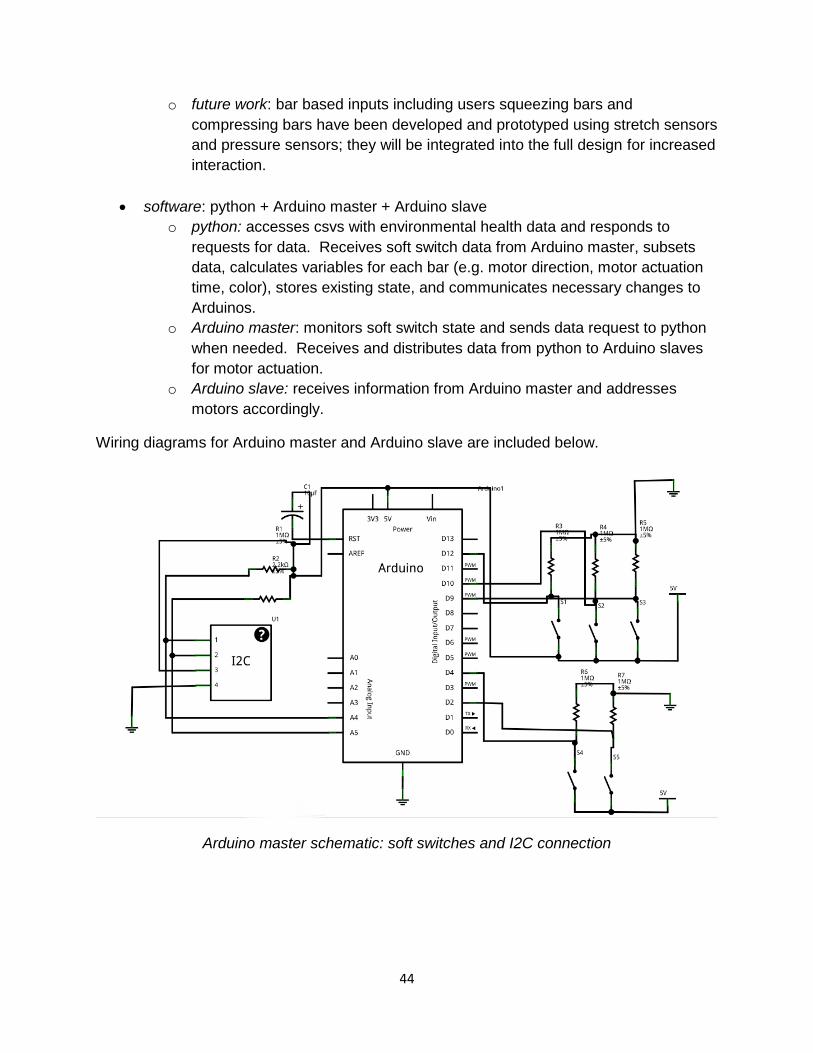
44
o future work: bar based inputs including users squeezing bars and
compressing bars have been developed and prototyped using stretch sensors
and pressure sensors; they will be integrated into the full design for increased
interaction.
software: python + Arduino master + Arduino slave
o python: accesses csvs with environmental health data and responds to
requests for data. Receives soft switch data from Arduino master, subsets
data, calculates variables for each bar (e.g. motor direction, motor actuation
time, color), stores existing state, and communicates necessary changes to
Arduinos.
o Arduino master: monitors soft switch state and sends data request to python
when needed. Receives and distributes data from python to Arduino slaves
for motor actuation.
o Arduino slave: receives information from Arduino master and addresses
motors accordingly.
Wiring diagrams for Arduino master and Arduino slave are included below.
Arduino master schematic: soft switches and I2C connection
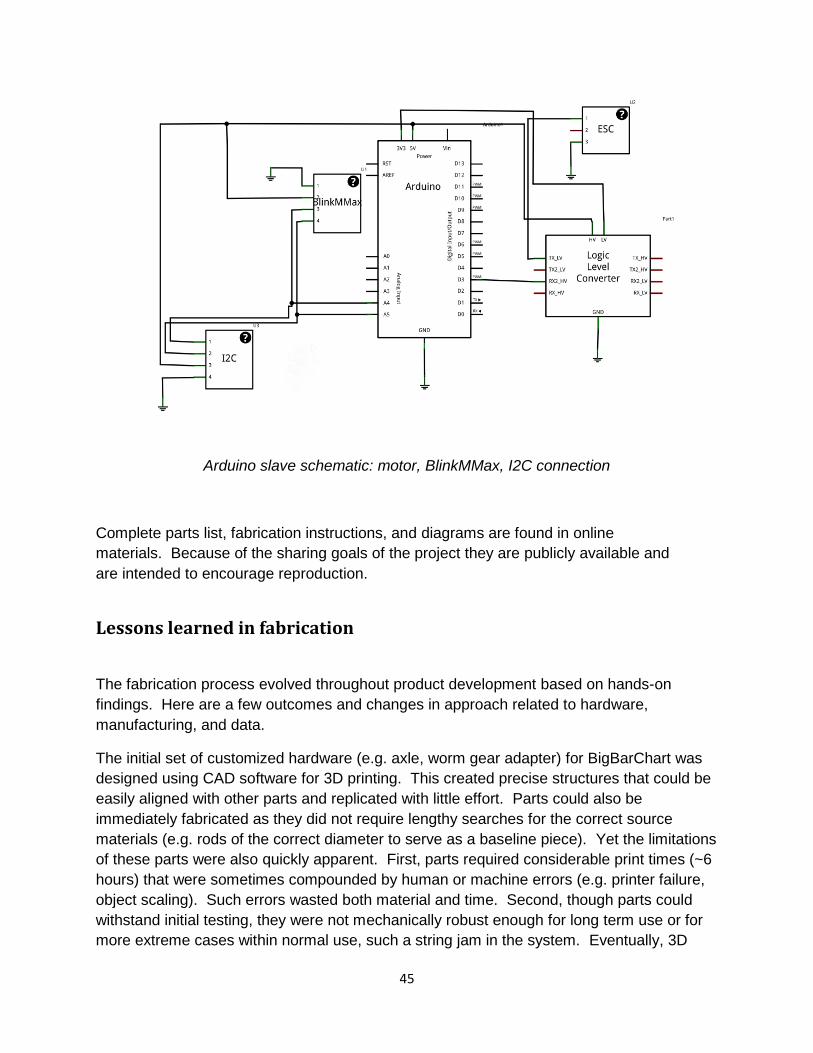
45
Arduino slave schematic: motor, BlinkMMax, I2C connection
Complete parts list, fabrication instructions, and diagrams are found in online
materials. Because of the sharing goals of the project they are publicly available and
are intended to encourage reproduction.
Lessons learned in fabrication
The fabrication process evolved throughout product development based on hands-on
findings. Here are a few outcomes and changes in approach related to hardware,
manufacturing, and data.
The initial set of customized hardware (e.g. axle, worm gear adapter) for BigBarChart was
designed using CAD software for 3D printing. This created precise structures that could be
easily aligned with other parts and replicated with little effort. Parts could also be
immediately fabricated as they did not require lengthy searches for the correct source
materials (e.g. rods of the correct diameter to serve as a baseline piece). Yet the limitations
of these parts were also quickly apparent. First, parts required considerable print times (~6
hours) that were sometimes compounded by human or machine errors (e.g. printer failure,
object scaling). Such errors wasted both material and time. Second, though parts could
withstand initial testing, they were not mechanically robust enough for long term use or for
more extreme cases within normal use, such a string jam in the system. Eventually, 3D
46
printed parts were deemed not suitable for the application and hand-lathed aluminum axles
and worm adapters were fabricated (thanks Mike!). Two dimensional parts, such as the
base of the bars, were designed in CAD software and cut on the ShopBot. L brackets for
motor mounting presented a particularly interesting case, as they were designed as two 2D
pieces and cut carefully on the water jet to preserve alignment between the two sides.
Manufacturing approaches are discussed in detail later but a few lessons learned are worth
mentioning here. First, note that it may be difficult or impossible to fabricate some items in
a typical machine shop as extremely specialized equipment and parts are required—this
includes the large springs needed for the tall hampers. Second, US manufacturers may be
accustomed to corporation sized orders or precision parts and thus be unwilling to consider
smaller scale runs. Alibaba can be a useful tool for identifying manufacturers abroad for
collaboration.
Before using the data in BigBarChart, some initial animations were created using R to give
a general impression of the interaction. A few lessons were learned from this exercise,
though the medium could not provide the full experience of the installation. First, it became
evident that using buttons to adjust the data ratios (e.g. the denominator comparison value)
was misleading and should be avoided. The motion of the bars suggested the values were
changing, though in fact only the comparison amounts that were being adjust—e.g. PCB
concentrations in GHS versus highly exposed factory workers or rural Germany. In the
future, bar colors or projected axes may be used to convey similar information. Second,
creating animations demonstrated the extent to which movement can attract attention. It is
possible that BigBarChart would be a stronger piece if it capitalized on its motion, perhaps
being used with live data or time series data. Testing of motion in the human-sized
installation is needed to fully assess this.
Manufacturing
Manufacturing partners Manufacturing partnerships were established via two channels: Alibaba and the network of
Andrew "bunnie" Huang. Custom manufacturing was sought after initial searching and
design testing of related mainstream products available through Amazon and an attempt at
sourcing appropriate machinery locally.
The first manufacturing need was for modified pop-up laundry hampers to be used as the
bars. Basic requirements of the new form were: increased height (with increased spring
strength and diameter to support the height) and minor accessory modifications to the
design (e.g. added ties, open bottom, partially closed top). Initially, American based spring
manufacturers, metal workers, and machine shops were contacted in an attempt to
fabricate large custom springs. Possible machinery included WB-4120 3D CNC wire
bender (Taiwan Spring Machine, 2011), NewForm Tech: 3D wire bending machine MB-R
47
series (NewForm Tech, 2010), and Reivax Máquinas MAQ-3D-CNC (ReivaxMaquinas
English, 2011). Organizations did not appear to have the appropriate machinery for springs
of this scale (both diameter and length) and expressed little interest in pursuing this
question further. Often their focus seemed to be on large industrial orders or precision
work.
To find other possible manufacturers, I searched the Alibaba website for pop-up laundry
hampers or similar products such as pop-up tents, crawl tunnels, and large springs. I
contacted over twenty manufacturers via email or the Alibaba messaging interface with a
description of the product and basic information about the desired design. Little attention
was paid to minimum order requirements listed by the manufacturers when reaching out to
potential partners, as almost all minimum order sizes (500 to 5,000 pieces) were
substantially larger than the desired initial order quantity (~50).
Many companies contacted via Alibaba did not respond to the initial inquiry and others
reported reluctance to engage with a difficult project and/or small order size. Casual
conversation with individuals who have collaborated in the past with manufacturers abroad
suggested that less well established manufacturers may be willing to compromise on order
size and difficulty when working with MIT or other well-known American organizations in
order to increase their company’s visibility and credibility in the eyes of future buyers. For
those that did respond, a number of emails, often including images or drawings, were
exchanged to discuss design possibilities and feasibility of the project. Additional
companies opted out in this process, leaving one company: the Yiwu Kenong Daily
Commodity Factory in Zhejiang Province (2014).
At this point in the process, I discovered that the Media Lab was pursuing the launch of a
somewhat formalized partnership with manufacturing groups in China. Bunnie Huang was
identified as the facilitator of these budding relationships and was contacted for advice on
manufacturing this particular part. Using his ongoing relationship with the firm AQS
Electronic Manufacturing Solutions (2014), he honed in on a couple of manufacturers that
might have the appropriate expertise. I reached out to these companies, including the Yiwu
Kenong Daily Commodity Factory, as found through Alibaba, with a similar project
description and request as used with Alibaba contacts. Ultimately, a partnership with Yiwu
Kenong Daily Commodity Factory was established.
A second manufacturing need was telescoping poles. These manufacturing relationships
were built primarily through Alibaba, as well as a casual request for recommendations from
existing manufacturing partners. I initially contacted over 20 manufacturers with a focus on
those creating carbon fiber poles. Applications included flag poles, pointers, fishing poles,
and walking sticks among others. Order requirements for telescoping poles often had lower
minimums (as low as 10) than hamper manufacturing. Design approach and desired
product outcomes were discussed with responding companies, including extended and
closed lengths, material strength, and pole diameter. Due to the compressed timeline,
product manufacturing times were also a consideration. Because the telescoping poles
48
were required immediately, could be ordered in lower numbers, and showed a great range
in quoted prices, two factories were contracted for preliminary test work to permit prompt
comparison in quality. These factories are: Jiangsu Toptek Composite Materials and
Caroline Dong’s unnamed company, both in Jiangsu Province, China. Ultimately, Jiangsu
Toptek Composite Materials provided superior and cheaper products on a faster timeline
and was selected for the full order.
Manufacturing design process Successfully communicating with manufacturers throughout the design process was a
challenging task. Challenges were based in logistics, language, knowledge, and
philosophical approach. Strategies for optimizing outcomes were developed on the fly and
met with mixed success.
Logistical challenges included time differences, shipping, and payment. Because of the
large time difference between the two locations, parties were often offline during each
other’s work days or waking hours, thus causing a lag in email communication. This was a
fairly unavoidable situation, but often caused delays in the process as questions took over
24 hours to resolve. This was minimized as much as possible by taking care in composing
emails and making attempts to be available outside of normal hours during crucial periods.
Shipping could also be a challenge. One manufacturing partner could not ship directly to
the US, thus AQS kindly received the package locally and arranged international
shipping. This lack of direct shipping caused additional costs and delays and required the
assistance of an outside organization. Occasionally, customs held packages which caused
additional delays in delivery; in one case, an order of motors was returned to Hong Kong
due to a faulty customs form and had to be reshipped (~2 week delay), in another instance
customs officials temporarily held goods and phoned the receiver to confirm their intended
purpose (~ 2 day delay). These challenges are not easily avoidable at this point in time, but
awareness of them can facilitate planning during the fabrication process.
Arranging payments was often a time consuming process. Partnering manufacturers
suggested options including bank transfer, PayPal, and Western Union for
payment. Alibaba itself offers payment services, but this option was not explored, nor was it
proposed by any of the factories as a desirable payment method. Other less established
possibilities may be explored in the future including Stellar, bitcoin, and Stripe. When
available, PayPal was the most time efficient and reliable option. Banking transfers
required detailed information that neither manufacturers nor purchasers could identify and
also necessitate in-person visits to the banking branch. In the end, this approach was
avoided. Western Union payments were used when PayPal was not
available. Unfortunately, online Western Union charges often failed for unknown reasons
that customer service agents and credit card companies were unable or unwilling to
divulge. Even successful online payments caused additional credit card charge fees
(immediate interest accumulation and cash-back charges). In-person Western Union
49
payments were used on a few occasions. While they were consistently processed correctly,
these payments were time consuming and required carrying significant amounts of cash to
complete the payment. This would not be a feasible option when scaled. All payment
methods required some level of risk and trust between purchaser and manufacturer.
Challenges based in differences in language, knowledge, and philosophical approach were
quite entwined in communicating about the design and manufacturing needs. Language
challenges were well known from the beginning of the collaborations, as purchaser has no
proficiency in Mandarin and the English of some manufacturing contacts was
limited. Limited manufacturing knowledge on the purchaser’s side included lack of correct
vocabulary for parts, differences in expectations around how parts were assembled, and
limited knowledge of manufacturing constraints. Manufacturers seemed to be accustomed
to fabricating well established designs with concrete requirements and use-case scenarios
developed; a prototyping approach for creating new objects through repeated testing,
refinement of constraints, and discussion seemed outside their normal process.
A few communication approaches were useful in bridging these gaps. Helpful strategies
included:
examine existing products: identifying current products similar in form or function
was useful in communicating the overall concept to manufacturers. Inspecting these
products or product photos also served to fill purchaser’s gaps in knowledge around
product components (e.g. pop-up hamper includes two material types, spring,
handles), typical dimensions (e.g. inner and outer diameters of telescoping poles),
product types (e.g. straight telescoping poles vs tapered telescoping poles), or
functionality (e.g. use of hooks to fasten hamper closed).
share ideas through photos: often labeled photos could quickly clear up confusion
that was not well identified or could confirm that parties were in agreement on a
course of action when language was unclear.
share ideas through video: video with explanatory text throughout helped bridge
language barriers and identify misunderstandings. Videos were used for
demonstrations mimicking the desired outcome of the project, possible fabrication
methods, and ongoing faults with the design. Note that transfer of video was
sometimes difficult as file sizes were too large for email, Vimeo and youtube were
not available to manufacturers, and compressed files placed on a server could not
be reliably extracted by manufacturers.
communicate carefully: short messages, consistent and concise language, and well
defined questions or suggestions helped smooth communication. This had to be
balanced against the communication lag caused by time differences; sometimes
emails needed to contain multiple topics which could create confusion.
express prototyping expectations: because some manufacturers seemed
accustomed to receiving well outlined designs, it was useful to state and reiterate
50
that some testing might be needed and multiple sample runs could be
required. Further developing the manufacturer’s role in this testing would be useful.
request advice or knowledge: explicit requests for input or advice early in the
communication process was used to gain knowledge of the manufacturing steps and
set up expectations of information exchange and dialogue around the design. This
process was especially useful in selecting manufacturers and also establishing the
limits and constraints of their process. It helped locate manufacturers that thought
critically about problems and could provide solid feedback on the process. It also
provided information about what parts were further outsourced (e.g. steel wire for
hampers is contracted out; molds for telescoping poles may be contracted out).
confirm outcomes: verifying all product parameters (dimension, quantity, shipping)
for the final order was critical due to the high volume of requests manufactures
receive and the constantly evolving designs in the prototyping process.
be prepared for unexpected delays or challenges: small sample runs may be
delayed by large requests from big companies or long time patrons. Parts that are
contracted out (e.g. steel wire) may change in specification over short amounts of
time or become difficult to attain. Try to account for these issues when developing a
timeline.
Manufacturing ethics & the environment Data Experiences are meant to bring data off the screen and into the physical world. It is
hypothesized that the tangibility of data, its proximity to the body, and the human-sized
scale of the form will bring a broader range of people to interact with the data, create a
common space for conversation between researchers and the community, and induce new
attitudes towards the data—“wonderment” or an artistic eye—that will be profitable to
engagement and new understandings. Yet, especially when using these objects to display
environmental data, it is important to note the downsides of physicality. Digital “objects”
(e.g. jpegs of barplots) consume comparatively minimal resources and space. They are
quickly malleable and editable, creating limited waste when there are errors in their
production. Physical objects do not have these affordances; the creation of each bar
requires multiple enduring objects and poorly measured material cannot be simply
uncut. Clearly current Data Experiences add to the world of “consumables” that may have
negative environmental impacts and must show themselves to provide benefits beyond
more digital approaches such as augmented reality.
However, BigBarChart pursues an ethically important goal of data reporting to study
participants (Brody, 2007). In the long term, the success of Data Experiences must be
analyzed against its cost in resources. As an initial attempt to increase long term net utility,
BigBarChart was created to be reusable—the barchart form is not specific to the particular
environmental health data but instead can be applied to a range of datasets and types of
data. The shapes and colors of the bars can be programmatically manipulated; the form
takes some of its existence from the physical realm and some from the virtual realm and
thus begins to better manage its use of resources. Ideally, BigBarChart and other Data
51
Experiences are a step on the road to Ishii’s vision of “radical atoms” (Ishii, 2012). These
objects are infinitely editable and reshapable though physical in nature and thus provide the
benefits of the physical and digital worlds. Follmer’s inFORM is an early example of how
this approach may be implemented and applied (Follmer, 2013).
Additionally, organizations that value social consciousness or serve constituents with these
values may prefer to avoid Chinese manufacturing for economic, environmental, or human
labor reasons. Assessing the validity of these concerns and fully treating this complicated
topic is outside the scope of this thesis, but it is worth briefly addressing the environmental
concerns as a prompt for future exploration since the data used with BigBarChart is
environmental.
Many have documented high levels of air pollution in China, often tied to industry, and have
observed connections to disease and mortality (Chen, 2013; Zhang, 2011; Lin,
2014). Outdoor air pollution in China is linked to over 400,000 deaths per year (Gong,
2012). Sources of this pollution include traffic pollution, manufacturing, and household
heating among others (Gong, 2012). US air pollution related deaths are estimated at
50,000 per year (National Oceanic & Atmospheric Administration, 2014); thus these issues
are not unique to China, though they may be more severe there.
Environmental regulations throughout the world are beginning to address air pollution and
health. The American Environmental Protection Agency and the Chinese government have
worked together through the EPA-China Environmental Law Initiative. This initiative has
established air pollution standards and increased pollution monitoring (Ministry of
Environmental Protection, 2013). Yet, even in the US, chemical exposure through products
themselves is not closely monitored. The Toxic Substances Control Act is perhaps the
primary regulatory guideline for chemicals in the US but it does not require health data for
new chemicals on the market and the vast majority of chemicals in use remain untested and
unidentified in products (Lohmann, 2013). Thus both countries have room for significant
progress in this regard, with the European Union’s REACH legislation proposed as the best
existing model for this effort (Lohmann, 2013).
Product based chemical exposures BigBarChart was designed as an extension of work in data reporting in environmental
health. Though its design was intentionally broad enough for use with a wide range of data,
its application to environmental health prompts us to at least provisionally consider the
possible exposures it presents as a consumer product. Relevant individuals and exposure
pathways include: parts manufactures, prototypers, and study participants (e.g. installation
visitors). Fully assessing these exposures and addressing possible points of concern is a
large endeavor left as future work; this project provides an exciting opening to the
conversation on emerging contaminants in prototyping and early stage fabrication.
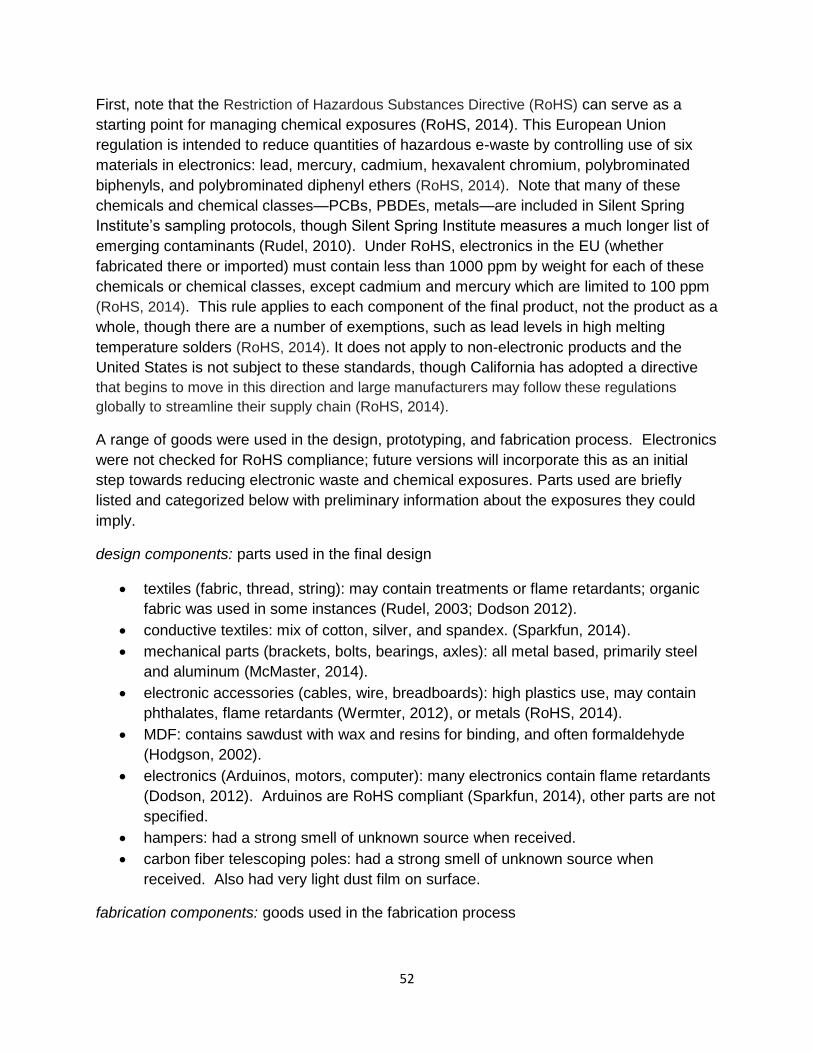
52
First, note that the Restriction of Hazardous Substances Directive (RoHS) can serve as a
starting point for managing chemical exposures (RoHS, 2014). This European Union
regulation is intended to reduce quantities of hazardous e-waste by controlling use of six
materials in electronics: lead, mercury, cadmium, hexavalent chromium, polybrominated
biphenyls, and polybrominated diphenyl ethers (RoHS, 2014). Note that many of these
chemicals and chemical classes—PCBs, PBDEs, metals—are included in Silent Spring
Institute’s sampling protocols, though Silent Spring Institute measures a much longer list of
emerging contaminants (Rudel, 2010). Under RoHS, electronics in the EU (whether
fabricated there or imported) must contain less than 1000 ppm by weight for each of these
chemicals or chemical classes, except cadmium and mercury which are limited to 100 ppm
(RoHS, 2014). This rule applies to each component of the final product, not the product as a
whole, though there are a number of exemptions, such as lead levels in high melting
temperature solders (RoHS, 2014). It does not apply to non-electronic products and the
United States is not subject to these standards, though California has adopted a directive
that begins to move in this direction and large manufacturers may follow these regulations
globally to streamline their supply chain (RoHS, 2014).
A range of goods were used in the design, prototyping, and fabrication process. Electronics
were not checked for RoHS compliance; future versions will incorporate this as an initial
step towards reducing electronic waste and chemical exposures. Parts used are briefly
listed and categorized below with preliminary information about the exposures they could
imply.
design components: parts used in the final design
textiles (fabric, thread, string): may contain treatments or flame retardants; organic
fabric was used in some instances (Rudel, 2003; Dodson 2012).
conductive textiles: mix of cotton, silver, and spandex. (Sparkfun, 2014).
mechanical parts (brackets, bolts, bearings, axles): all metal based, primarily steel
and aluminum (McMaster, 2014).
electronic accessories (cables, wire, breadboards): high plastics use, may contain
phthalates, flame retardants (Wermter, 2012), or metals (RoHS, 2014).
MDF: contains sawdust with wax and resins for binding, and often formaldehyde
(Hodgson, 2002).
electronics (Arduinos, motors, computer): many electronics contain flame retardants
(Dodson, 2012). Arduinos are RoHS compliant (Sparkfun, 2014), other parts are not
specified.
hampers: had a strong smell of unknown source when received.
carbon fiber telescoping poles: had a strong smell of unknown source when
received. Also had very light dust film on surface.
fabrication components: goods used in the fabrication process
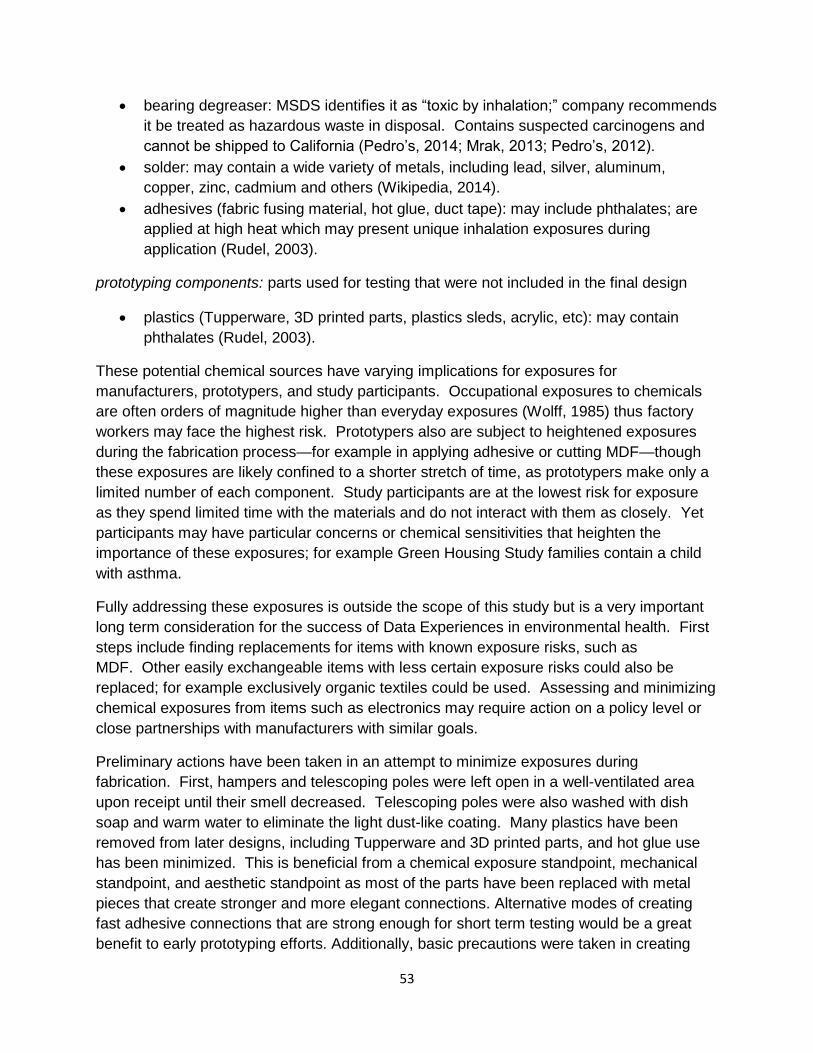
53
bearing degreaser: MSDS identifies it as “toxic by inhalation;” company recommends
it be treated as hazardous waste in disposal. Contains suspected carcinogens and
cannot be shipped to California (Pedro’s, 2014; Mrak, 2013; Pedro’s, 2012).
solder: may contain a wide variety of metals, including lead, silver, aluminum,
copper, zinc, cadmium and others (Wikipedia, 2014).
adhesives (fabric fusing material, hot glue, duct tape): may include phthalates; are
applied at high heat which may present unique inhalation exposures during
application (Rudel, 2003).
prototyping components: parts used for testing that were not included in the final design
plastics (Tupperware, 3D printed parts, plastics sleds, acrylic, etc): may contain
phthalates (Rudel, 2003).
These potential chemical sources have varying implications for exposures for
manufacturers, prototypers, and study participants. Occupational exposures to chemicals
are often orders of magnitude higher than everyday exposures (Wolff, 1985) thus factory
workers may face the highest risk. Prototypers also are subject to heightened exposures
during the fabrication process—for example in applying adhesive or cutting MDF—though
these exposures are likely confined to a shorter stretch of time, as prototypers make only a
limited number of each component. Study participants are at the lowest risk for exposure
as they spend limited time with the materials and do not interact with them as closely. Yet
participants may have particular concerns or chemical sensitivities that heighten the
importance of these exposures; for example Green Housing Study families contain a child
with asthma.
Fully addressing these exposures is outside the scope of this study but is a very important
long term consideration for the success of Data Experiences in environmental health. First
steps include finding replacements for items with known exposure risks, such as
MDF. Other easily exchangeable items with less certain exposure risks could also be
replaced; for example exclusively organic textiles could be used. Assessing and minimizing
chemical exposures from items such as electronics may require action on a policy level or
close partnerships with manufacturers with similar goals.
Preliminary actions have been taken in an attempt to minimize exposures during
fabrication. First, hampers and telescoping poles were left open in a well-ventilated area
upon receipt until their smell decreased. Telescoping poles were also washed with dish
soap and warm water to eliminate the light dust-like coating. Many plastics have been
removed from later designs, including Tupperware and 3D printed parts, and hot glue use
has been minimized. This is beneficial from a chemical exposure standpoint, mechanical
standpoint, and aesthetic standpoint as most of the parts have been replaced with metal
pieces that create stronger and more elegant connections. Alternative modes of creating
fast adhesive connections that are strong enough for short term testing would be a great
benefit to early prototyping efforts. Additionally, basic precautions were taken in creating
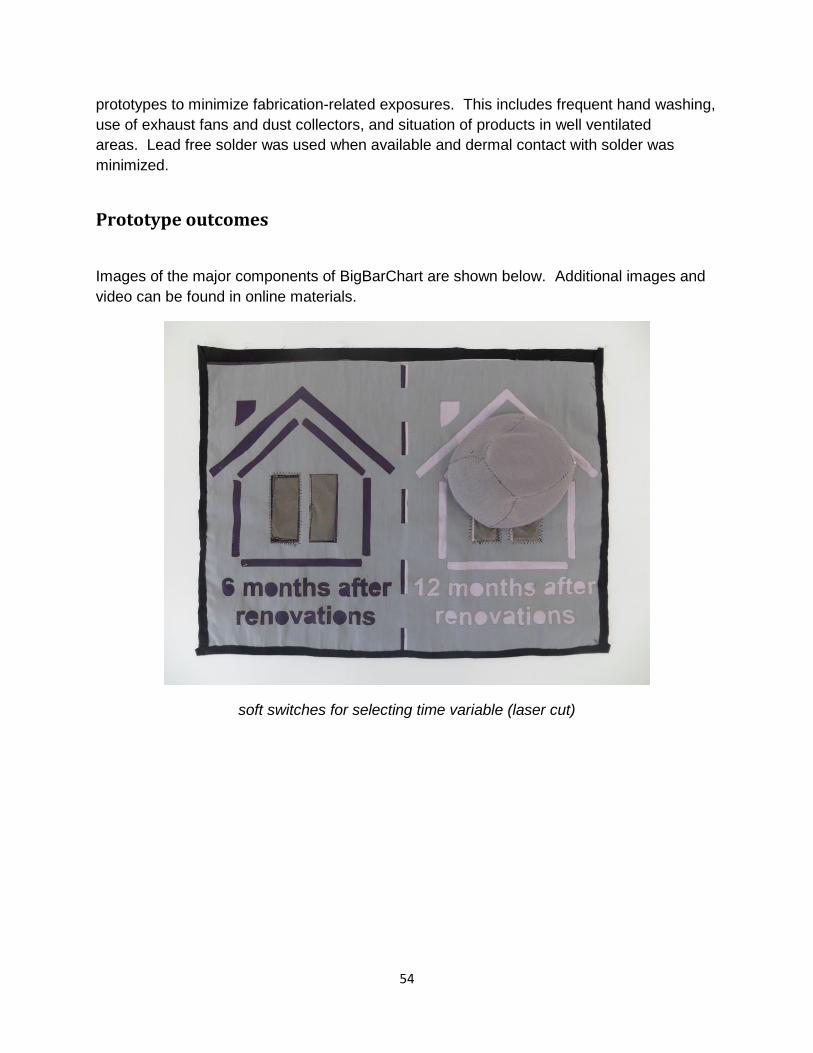
54
prototypes to minimize fabrication-related exposures. This includes frequent hand washing,
use of exhaust fans and dust collectors, and situation of products in well ventilated
areas. Lead free solder was used when available and dermal contact with solder was
minimized.
Prototype outcomes
Images of the major components of BigBarChart are shown below. Additional images and
video can be found in online materials.
soft switches for selecting time variable (laser cut)
55
soft switches for selecting chemical variable (laser cut)
bean bags for soft switches; one side conductive fabric
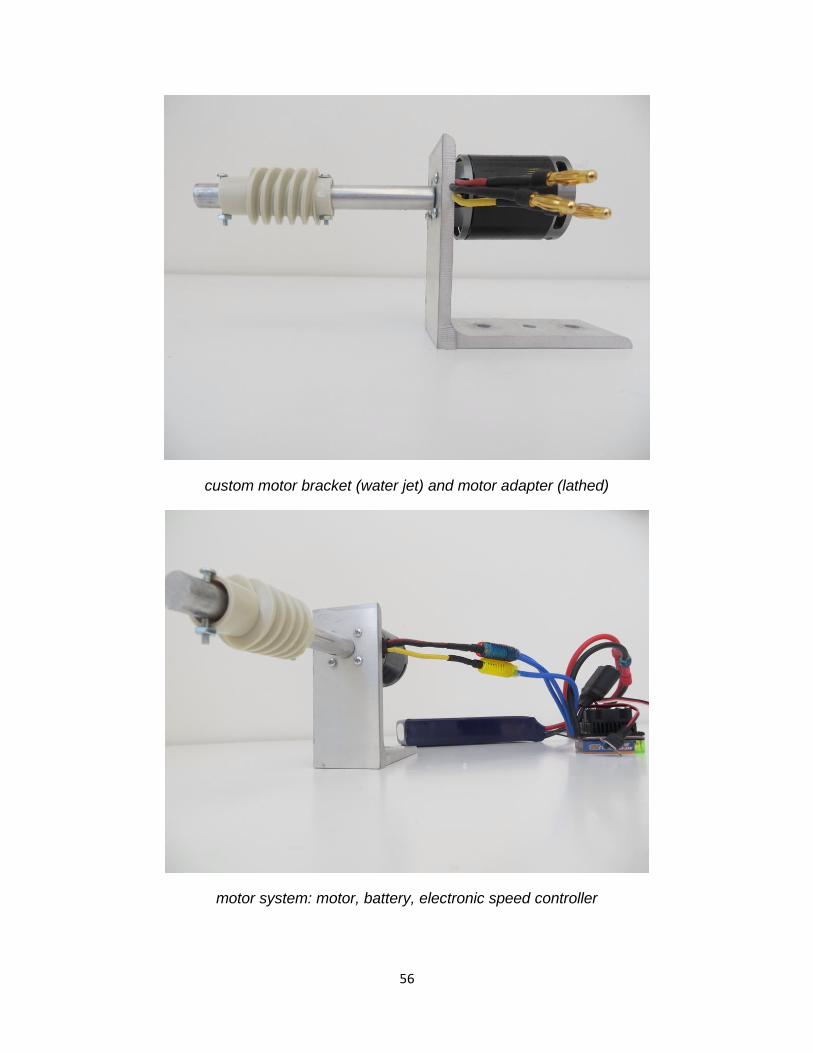
56
custom motor bracket (water jet) and motor adapter (lathed)
motor system: motor, battery, electronic speed controller
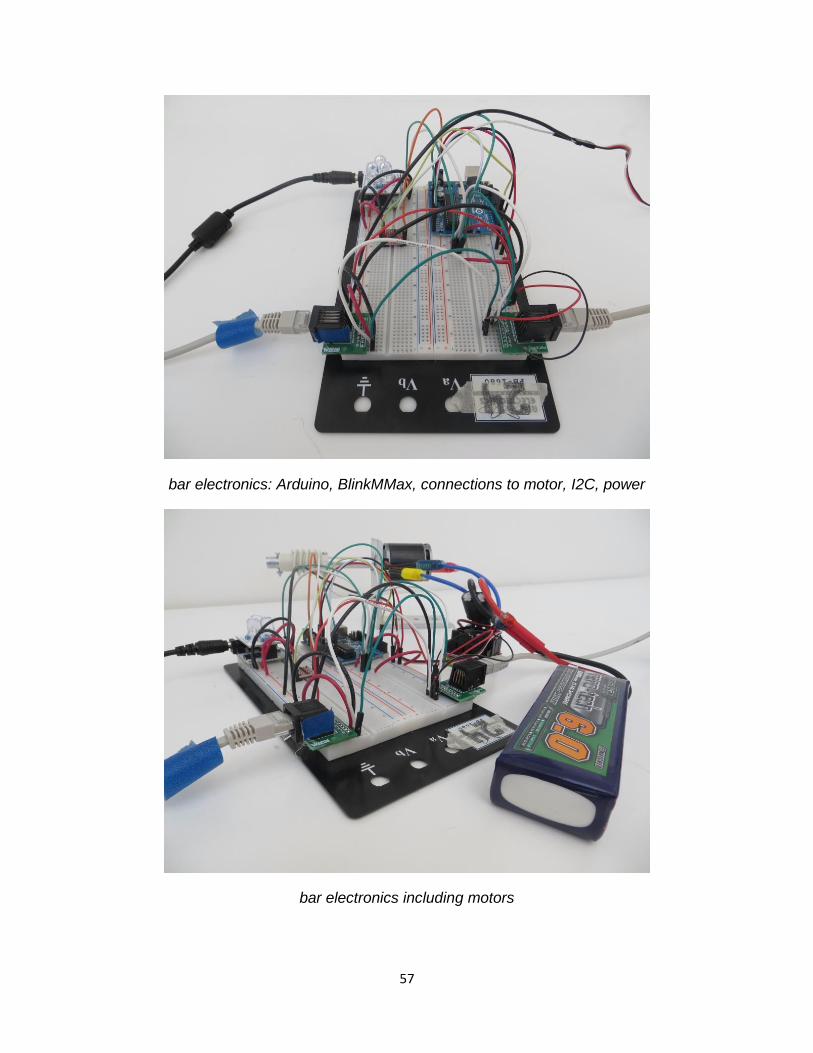
57
bar electronics: Arduino, BlinkMMax, connections to motor, I2C, power
bar electronics including motors
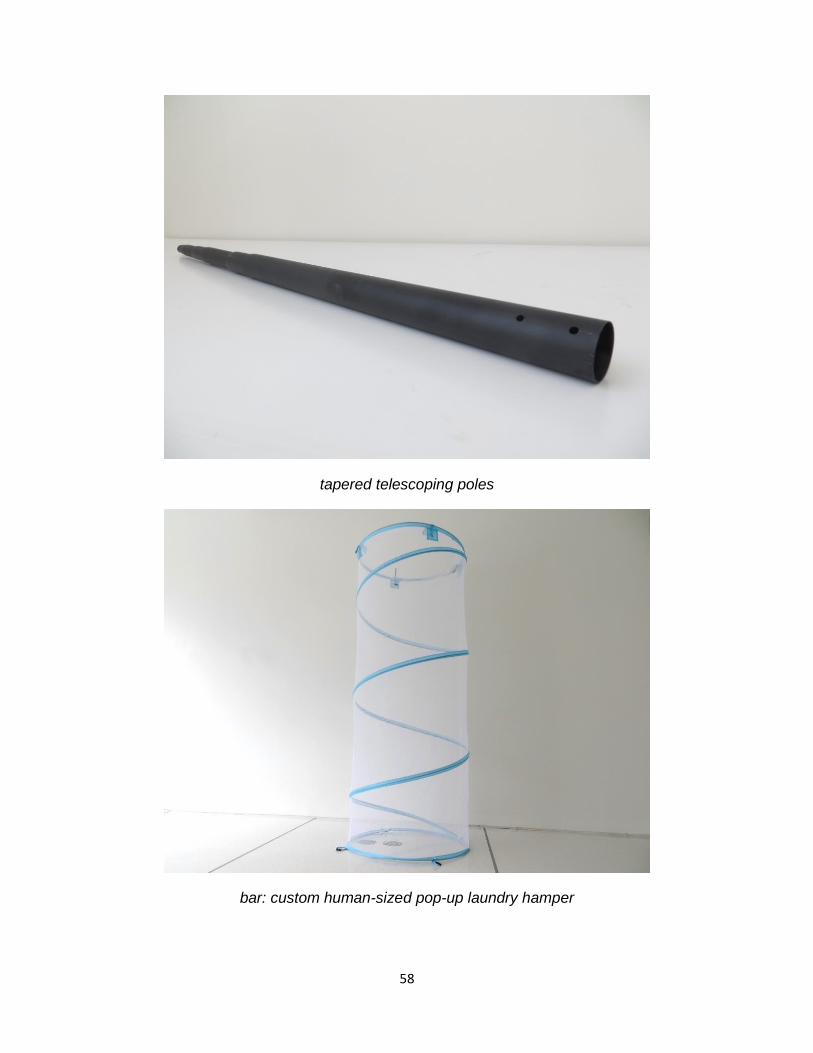
58
tapered telescoping poles
bar: custom human-sized pop-up laundry hamper
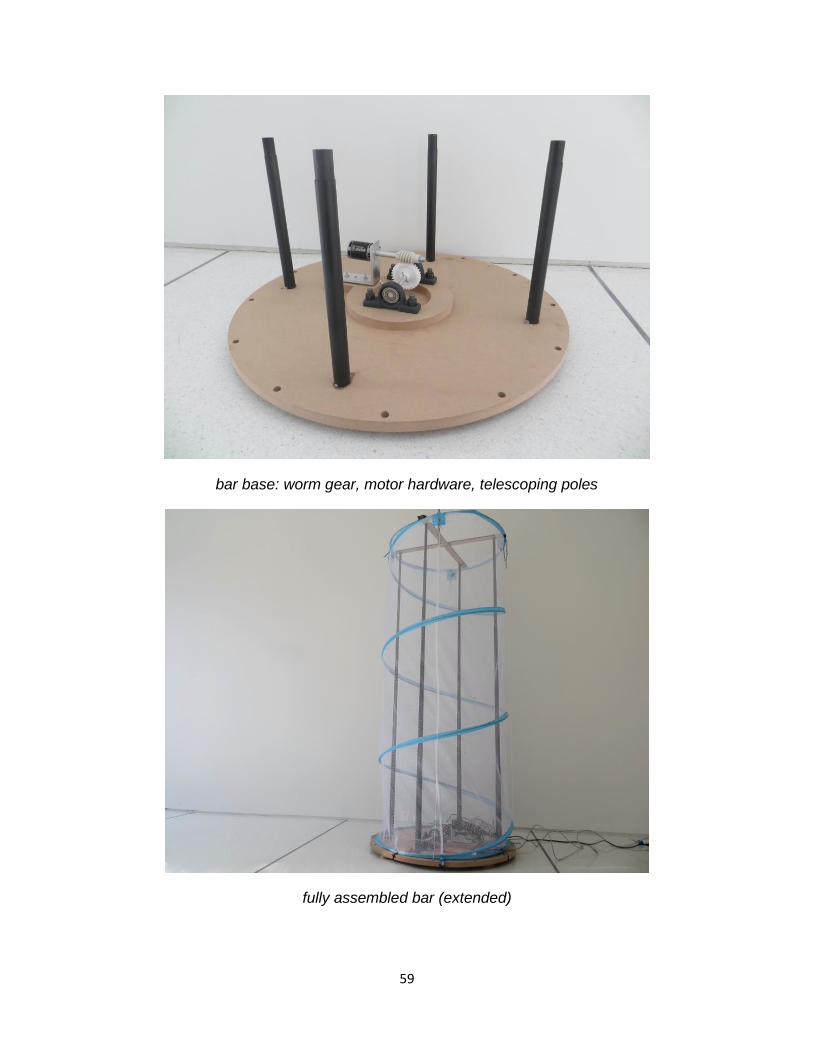
59
bar base: worm gear, motor hardware, telescoping poles
fully assembled bar (extended)
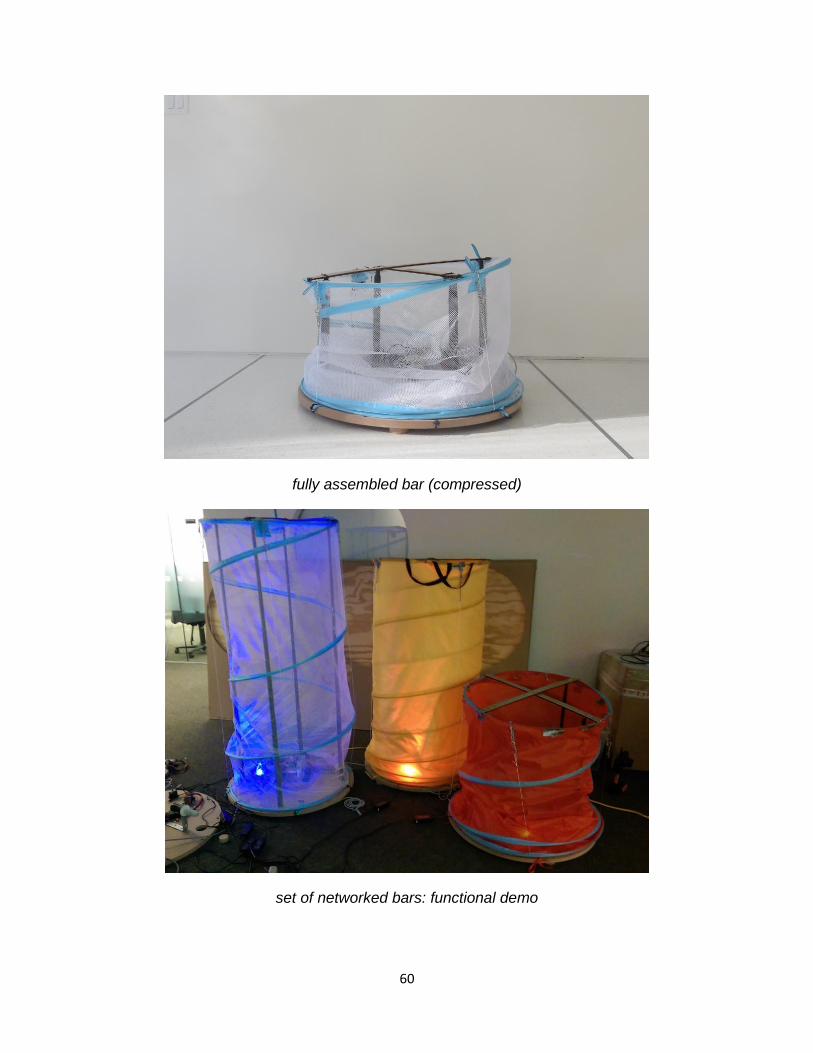
60
fully assembled bar (compressed)
set of networked bars: functional demo
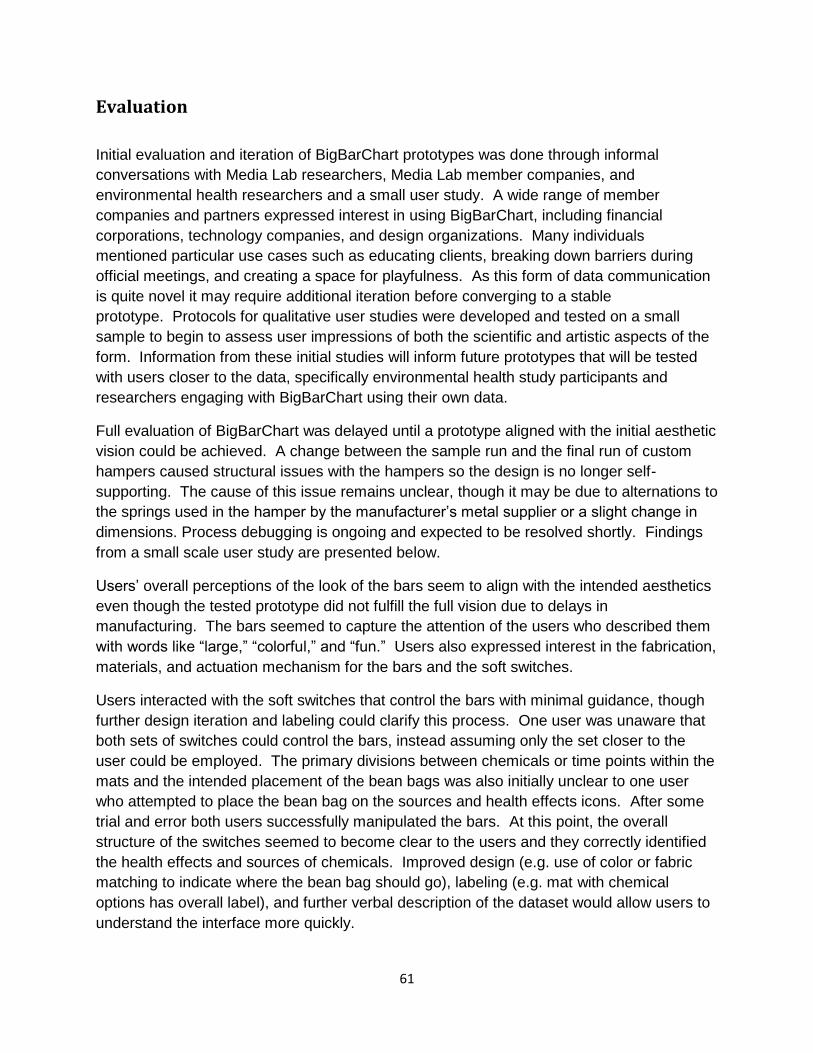
61
Evaluation
Initial evaluation and iteration of BigBarChart prototypes was done through informal
conversations with Media Lab researchers, Media Lab member companies, and
environmental health researchers and a small user study. A wide range of member
companies and partners expressed interest in using BigBarChart, including financial
corporations, technology companies, and design organizations. Many individuals
mentioned particular use cases such as educating clients, breaking down barriers during
official meetings, and creating a space for playfulness. As this form of data communication
is quite novel it may require additional iteration before converging to a stable
prototype. Protocols for qualitative user studies were developed and tested on a small
sample to begin to assess user impressions of both the scientific and artistic aspects of the
form. Information from these initial studies will inform future prototypes that will be tested
with users closer to the data, specifically environmental health study participants and
researchers engaging with BigBarChart using their own data.
Full evaluation of BigBarChart was delayed until a prototype aligned with the initial aesthetic
vision could be achieved. A change between the sample run and the final run of custom
hampers caused structural issues with the hampers so the design is no longer self-
supporting. The cause of this issue remains unclear, though it may be due to alternations to
the springs used in the hamper by the manufacturer’s metal supplier or a slight change in
dimensions. Process debugging is ongoing and expected to be resolved shortly. Findings
from a small scale user study are presented below.
Users’ overall perceptions of the look of the bars seem to align with the intended aesthetics
even though the tested prototype did not fulfill the full vision due to delays in
manufacturing. The bars seemed to capture the attention of the users who described them
with words like “large,” “colorful,” and “fun.” Users also expressed interest in the fabrication,
materials, and actuation mechanism for the bars and the soft switches.
Users interacted with the soft switches that control the bars with minimal guidance, though
further design iteration and labeling could clarify this process. One user was unaware that
both sets of switches could control the bars, instead assuming only the set closer to the
user could be employed. The primary divisions between chemicals or time points within the
mats and the intended placement of the bean bags was also initially unclear to one user
who attempted to place the bean bag on the sources and health effects icons. After some
trial and error both users successfully manipulated the bars. At this point, the overall
structure of the switches seemed to become clear to the users and they correctly identified
the health effects and sources of chemicals. Improved design (e.g. use of color or fabric
matching to indicate where the bean bag should go), labeling (e.g. mat with chemical
options has overall label), and further verbal description of the dataset would allow users to
understand the interface more quickly.
62
Fluidity and clarity of interaction with BigBarChart could be improved by increasing the
responsiveness of the bars. The current prototype includes a number of delays and bars
take over a second to start responding to a change in the switch. This delay caused users
to pick up and replace the bean bag or to move it again as if they doubted that it was
working. Users also did not observe the color changes because of the slow response times
(colors change after the motors), limited strength of the LEDs, and difficulty in seeing colors
through the colored fabric; these issues are addressed in future designs. Overall, the
interface must meet people’s expectations of immediate reaction time for real world
objects. It is expected that many of these delays can be removed in future iterations and
that during any remaining delays a blinking light or equivalent physical counterpart to
Apple’s spinning pinwheel can be used to assure the user that something is happening.
Users immediately inquired about the scale of the data, while also recognizing the relative
changes (e.g. the data was less than, more than, or almost the same as the previous
set). One user expressed interest in knowing more about the context of the amounts; they
wondered whether values were dangerous and expressed interest in including a
comparison bar where the hazardous levels could be displayed. Future work will explore
this approach as well as bar color and wall projection for providing context.
Limitations & future work
Future work on BigBarChart includes technical and interaction modifications to create a next
generation prototype for larger scale testing.
Technical modifications will increase the durability and aesthetics of the system and
decrease its exposure impact. The MDF base will be replaced with a healthier alternative,
solder options will be explored, and textiles will be replaced with organic alternatives where
available. Electronics will also be replaced with RoHS compliant electronics. This will
decrease the chemical exposures of prototypers and study participants, a particularly
relevant concern when displaying environmental health data to study participants who may
have chemical sensitivities.
Technical modifications to the code and the electronics will increase robustness and
interaction possibilities. I2C networking may be replaced with an option more suitable to
distance. Wireless communication will be explored to increase the mobility of the
bars. Motor, LED, and Arduino powering will be streamlined to one battery source to further
reduce wiring. Mechanical components, such as telescoping pole support system, will be
further refined to increase the reliability and aesthetics of the system. A second round of
user testing will occur with ~10 units to gather feedback on aesthetic and experiential goals.
Later, a further refined system will be fabricated on a larger scale (~30-50 units) to increase
wonderment and display larger datasets. This includes a more complete version of the
63
GHS data as well as new datasets, for example live streamed time series data, financial
data, and personal health data. Bars will be enhanced with additional interaction
capabilities in response to user feedback and to suit the new datasets, perhaps showing
relationships between variables such as traffic and pollution. Tangible interfaces for
variable selection will also be scaled up further (e.g. bean bag chairs) to increase the bodily
nature of the interaction.
Future user testing will occur with environmental health study participants and researchers
to assess the impact of the experience when interacting with one’s own data. This also
allows comparisons with other methods of reporting, such as paper based or digital report-
back systems currently in use and under development. As BigBarChart is designed to
promote community interaction and engagement, the system will be tested with multiple
concurrent users, including study participants and environmental health researchers, to look
for effects on engagement levels and styles (e.g. length of interaction, depth of interaction).
These studies will help assess whether BigBarChart achieves its goal of lowing the barrier
to data engagement, helping participants achieve a deeper understanding of environmental
health data from their community, and prompting participants and researchers to interact in
novel ways. They will also evaluate the extent to which BigBarChart succeeds in being
immersive, interactive, artistic, and tangible.
64
Conclusion
Data experiences in environmental health
BigBarChart and Dressed in Data are early manifestations of a growing field of Data
Experiences created using environmental health data from two Silent Spring Institute
studies. Dressed in Data uses data from the Household Exposure Study conducted in
Northern California in 2006 and BigBarChart uses phthalate data from the Green Housing
Study conducted in Cincinnati and Boston in 2013.
More broadly, BigBarChart and Dressed in Data serve as example Data Experiences that
help define an emerging space. They differ from existing physical manifestations of data by
being highly immersive, flexible, and human-scaled. These particular Data Experiences are
also a somewhat “neutral form”—the objects displaying the data are not exclusively
designed for environmental health data and so can be quickly used with a range of small to
middle sized datasets, from social media data to finance data to health data.
The development of Data Experiences responds to research needs in environmental health
and science. Science communication and public engagement is of increasing interest as
demonstrated by the citizen scientist movement and community based research
practice. Specifically, multiple research agencies have called for increased results-reporting
in environmental health and study participants are eager to receive this information in an
engaging and empowering manner (BEST, 2006; The National Conversation on Public
Health and Chemical Exposures, 2011). Future implementations of BigBarChart and
Dressed in Data with Green Housing Study participants will serve as a starting point for new
methods of interaction between researchers and communities.
Future work
BigBarChart and Dressed in Data suggest many areas of future work in Data
Experiences. This includes open source Data Experiences, iterations on current Data
Experiences, field-specific Data Experiences, and further testing of Data Experiences.
Furthermore, both Data Experiences could add features based on user feedback and
hardware and software could be iterated to develop a fully deployable product.
Immediate next steps along these lines for both Dressed in Data and BigBarChart include:
Full open source documentation and support: Code, parts lists, and fabrication files and
instructions are available for BigBarChart and Dressed in Data through the website
http://dataexperiences.media.mit.edu. This provides a strong starting point for groups to
65
fabricate their own data experiences and explore new directions and implementations. Yet
this documentation may not be sufficient for community groups or organizations without
engineering or technology resource—both in personnel and machinery. Future work
includes creation of accessible documentation of these processes including tutorials and
physical resource documentation to empower a broad range of groups to use these
approaches on their own data (e.g. high school students creating clothing expressing their
Facebook data; BigBarChart used in financial meetings). Partnerships may be established
with interested organizations to create example projects that can serve as a template and
inspiration for others.
Design iteration based on increased robustness and design values: Fabrication and initial
researcher testing brought to light functional weaknesses in the prototype in normal use
scenarios. For example, communication between bars in BigBarChart can fail or become
prohibitively slow when more than eight bars are networked. Also, two dimensional areas
were initially used to compare concentrations in Dressed in Data to create an aesthetically
pleasing pattern, but research suggests this pattern may not be as legible as one-
dimensional representations (e.g. lines or bars). This information will be integrated into the
next generation prototypes before full user testing.
User studies and full scale implementation as a report-back tool: Protocols (see appendix)
for initial qualitative user studies of these Data Experiences have been developed and
tested. Full studies will be conducted as future work, and will provide a launching point for
design iteration so Data Experiences can be used to report environmental health study
results to participants. Report-back testing will be conducted with study participants as well
as environmental health researchers. This phase of the study will include semi-structured
interviews similar to those used to measure and describe the success of paper and digital
report-backs in similar household exposure studies.
Topically focused data experiences: BigBarChart and Dressed in Data are designed to be
flexible platforms for use with a range of data beyond environmental health data. This has
the benefit of bringing Data Experiences to broad audiences and encouraging brainstorming
across fields. Yet it does not capitalize on specifically themed objects that can strengthen
messaging and promote behavior change. Future work will consider forms specific to
emerging contaminants in the indoor and community environment. Partnerships with
advocacy organizations and designers will help develop appropriate action-based Data
Experiences related to environmental health. For example, the forms of each bar in the
barchart could be made to represent the source of the particular pollutant (e.g. smokestack
for industrial pollutants, hairspray can for personal care products). Or, a Data Experience
around exposure to personal care products could be a bathroom mirror that reflects both the
user’s image and their internal “chemical image” as make-up and other products are
applied, showing the user the potential harms of their beautification routine.
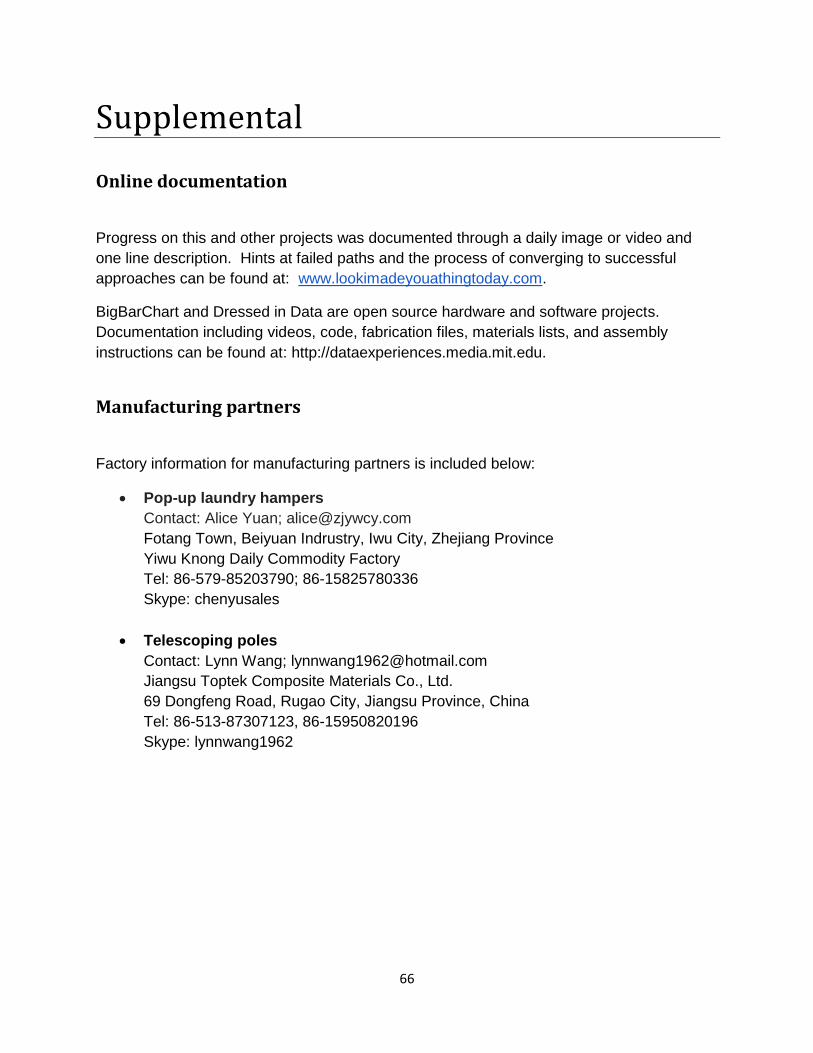
66
Supplemental
Online documentation
Progress on this and other projects was documented through a daily image or video and
one line description. Hints at failed paths and the process of converging to successful
approaches can be found at: www.lookimadeyouathingtoday.com.
BigBarChart and Dressed in Data are open source hardware and software projects.
Documentation including videos, code, fabrication files, materials lists, and assembly
instructions can be found at: http://dataexperiences.media.mit.edu.
Manufacturing partners
Factory information for manufacturing partners is included below:
Pop-up laundry hampers
Contact: Alice Yuan; [email protected]
Fotang Town, Beiyuan Indrustry, Iwu City, Zhejiang Province
Yiwu Knong Daily Commodity Factory
Tel: 86-579-85203790; 86-15825780336
Skype: chenyusales
Telescoping poles
Contact: Lynn Wang; [email protected]
Jiangsu Toptek Composite Materials Co., Ltd.
69 Dongfeng Road, Rugao City, Jiangsu Province, China
Tel: 86-513-87307123, 86-15950820196
Skype: lynnwang1962
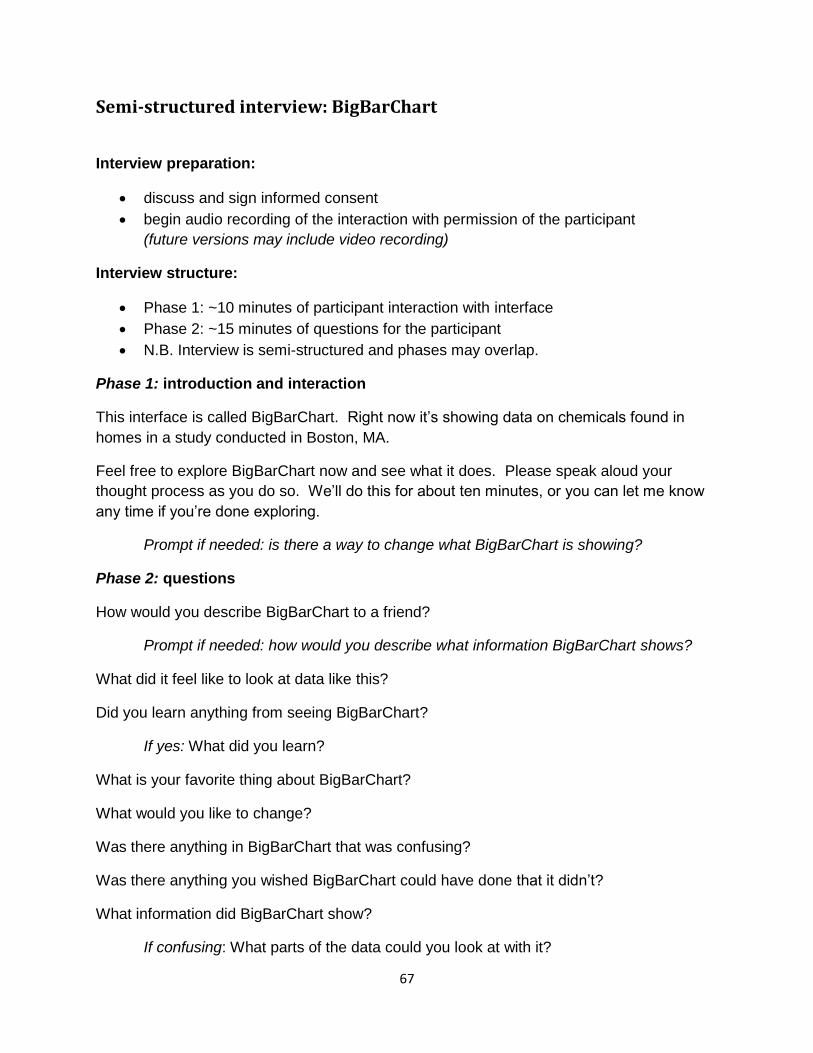
67
Semi-structured interview: BigBarChart
Interview preparation:
discuss and sign informed consent
begin audio recording of the interaction with permission of the participant
(future versions may include video recording)
Interview structure:
Phase 1: ~10 minutes of participant interaction with interface
Phase 2: ~15 minutes of questions for the participant
N.B. Interview is semi-structured and phases may overlap.
Phase 1: introduction and interaction
This interface is called BigBarChart. Right now it’s showing data on chemicals found in
homes in a study conducted in Boston, MA.
Feel free to explore BigBarChart now and see what it does. Please speak aloud your
thought process as you do so. We’ll do this for about ten minutes, or you can let me know
any time if you’re done exploring.
Prompt if needed: is there a way to change what BigBarChart is showing?
Phase 2: questions
How would you describe BigBarChart to a friend?
Prompt if needed: how would you describe what information BigBarChart shows?
What did it feel like to look at data like this?
Did you learn anything from seeing BigBarChart?
If yes: What did you learn?
What is your favorite thing about BigBarChart?
What would you like to change?
Was there anything in BigBarChart that was confusing?
Was there anything you wished BigBarChart could have done that it didn’t?
What information did BigBarChart show?
If confusing: What parts of the data could you look at with it?
68
How would you describe the bars? What three adjectives would you use to describe them?
Is there anything you would like to add about your experience with BigBarChart?
Interview close: thank you and questions
Thank you for participating in the study. If you have any questions about the study or the
interface you just interacted with, I’m happy to answer them now.
Thank you for your participation [[$15 Amazon gift card]].
69
Semi-structured interview: Dressed in Data
Interview preparation:
discuss and sign informed consent
begin audio recording of the interaction with permission of the participant
(future versions may include video recording)
Interview structure
Phase 1: ~5 minutes of garment introduction and observation
Phase 2: ~15 minutes of questions for the participant
N.B. Interview is semi-structured and phases may overlap.
Phase 1: introduction
These outfits display information about chemicals found in one person’s home. The data is
represented in the lace pattern on the outfits. The squares represent individual chemicals
found in the person’s home. The size of the squares represents the relative amount of the
chemical that was found. Each garment looks at one type of chemical—for example, the
red outfit shows data about chemicals from plastics. Overall, data from over 100 chemicals
are included in the outfits.
This shirt shows the same data that’s in the lace pattern on the yellow factory pollutants
outfit. We won’t consider it for the first questions, but we will look at it in the later ones.
Phase 2: questions
At first glance, which garment seems to have the most chemicals? What makes you pick
that one?
At first glance, which garment seems to have the highest relative concentration of
chemicals? What makes you pick that one?
What do you think when you look at the lace pattern?
If you touch the garments, how do they feel?
Where do you think a garment like this might be seen or worn? At what sort of occasion?
[[both sets of garments]]
Have you ever designed, sewn, knitted, crocheted, or made other things from textiles
before?
If no: Is this something you find interesting or you think you might learn in the future?
70
If yes: What sort of things have you made?
Would you consider wearing a garment like this that was about chemicals found in your
home or your town? What if it showed data about something else? Why is it or isn’t it an
appealing idea to you? [[daily wear]]
Would you consider sharing data on chemicals detected in your home online—say on social
media, on a blog, or as part of a research study—if it was available to you? Why or why
not?
What if the pollution was measured outside your home—say somewhere within a half mile
of your home? Would you consider sharing it on social media, a blog, or as part of a
research dataset? Why or why not?
Do you have any other thoughts, comments or questions you’d like to share?
Interview close: thank you and questions
Thanks so much for participating in the study. If you have any questions about the study or
the garments you just saw, I’m happy to answer them now.
Thank you for your participation. [[$15 Amazon gift card]]
71
Bibliography
23andMe. https://www.23andme.com/, 2014.
23andMe. “Health.” https://www.23andme.com/health/, 2014
Agency for Toxic Substances and Disease Registry. "Polycyclic Aromatic Hydrocarbons
(PAHs)". http://www.atsdr.cdc.gov/toxfaqs/tf.asp?id=121&tid=25. 1996.
Altman, R.G., Morello-Frosch, R., Brody, J.G., Rudel, R.A., Brown, P., Averick, M. Pollution
Comes Home and Gets Personal: Women's Experience of Household Chemical Exposure.
J Health Soc Behav. 2009.
Angrist, M. Eyes wide open: the personal genome project, citizen science and veracity in
informed consent. Per Med. Nov; 6(6): 691–699, 2009.
Api, A.M. Toxicological profile of diethyl phthalate: a vehicle for fragrance and cosmetic
ingredients. Food Chem Toxicology. 2001 Feb;39(2):97-108.
AQS Electronic Manufacturing Solutions. www.aqs-inc.com, 2014.
Bevans, Chrisopher. Personal communication, January 2014.
Bhargava, Rahul. Data as Disempowerment.
http://datatherapy.wordpress.com/2012/12/26/data-as-disempowerment/. 2012.
Bhargava, Rahul. Data Therapy. http://datatherapy.wordpress.com. 2014.
72
Board on Environmental Studies and Toxicology (BEST). Human Biomonitoring for
Environmental Chemicals: The National Academy Press, 2006.
Brody, J. G., Dunagan, S.C., Morello-Frosch, R., Brown, P., Patton, S., Rudel,
R.A. Reporting individual results for biomonitoring and environmental exposures: lessons
learned from environmental communication case studies. Environmental Health, 13:40,
2014.
Brody, J.G., Morello-Frosch, R., Brown, P., Rudel, R.A., Altman, R.G., Frye, M., Osimo,
C.A., Perez, C., Seryak, L.M. Improving disclosure and consent: “Is it safe?”: New ethics for
reporting personal exposures to environmental chemicals. American Journal of Public
Health, 97: 1547 - 1554. 2007.
Brody, J. G., Morello-Frosch, R.A., Zota, A.R., Brown, P., Perez, C., Rudel, R. Linking
exposure assessment science with policy objectives for environmental justice and breast
cancer advocacy: The Northern California Household Exposure Study. American Journal of
Public Health 2009, 99 (3), S600–609, 2009.
Chen, R., Peng, P.D., Meng, X., Zhou, Z., Chen, B., Kan, H. Seasonal variation in the acute
effect of particulate air pollution on mortality in the China Air Pollution and Health Effects
Study (CAPES). Sci Total Environ. April 15; 0: 2013
Chen, X. “X.pose” http://xc-xd.com/x-pose, 2014.
Chi, P., Xiao, X., Chung, K., Chiu, C., Ishii, H. Burn Your Memory Away: One-time Use
Video Capture and Storage Device to Encourage Memory Appreciation. CHI 2009.
Dodson, R.E., Perovich, L.J., Covaci, A., Van den Eede, N., Ionas, A.C., Dirtu, A.C., Brody,
J.G., Rudel, R.A. After the PBDE phase-out: A broad suite of flame retardants in repeat
house dust samples from California. Environmental Science & Technology, 2012.
Follmer, S., Leithinger, L., Olwal, A., Hogge, A., Ishii, H.. inFORM: Dynamic Physical
73
Affordances and Constraints through Shape and Object Actuation. Proceedings of the 26th
annual ACM symposium on User interface software and technology, 2013.
Food and Drug Administration. “Inspections, Compliance, Enforcement, and Criminal
Investigations.”
http://www.fda.gov/iceci/enforcementactions/warningletters/2013/ucm376296.htm, 2013.
Futurlec. “Gas Sensors,” http://www.futurlec.com/Gas_Sensors.shtml, 2014.
Gillum, N., Karabekian, Z., Swift, L.M., Brown, R.P., Kay, M.W., Sarvazyan, N. Clinically
relevant concentrations of di (2-ethylhexyl) phthalate (DEHP) uncouple cardiac syncytium.
Toxicology and Applied Pharmacology 236 (1): 25–38, 2009.
Gong, M., Zhang, Y., Weschler, C.J. Measurement of Phthalates in Skin Wipes: Estimating
Exposure from Dermal Absorption. Environmental Science and Technology, 48 (13), 2014.
Gong, P., Liang, S., Carlton, E.J., Jiang, Q., Wu, J., Wang, L., Remais, J.V. Urbanisation
and health in China. Lancet. Mar 3; 379(9818): 843–852, 2012.
Green Facts. “Benzyl butyl phthalate.” http://www.greenfacts.org/glossary/abc/bbp-benzyl-
butyl-phthalate.htm, 2014.
Hendrik Wermter, Thomas Futterer, Sven Fünderich. Flame retardant composition for
thermoplastic molding compounds. http://www.google.com/patents/US20120322923, 2012.
Hodgson, A.T., Beal, D., McIlvaine, J.E.R.. Sources of formaldehyde, other aldehydes and
terpenes in a new manufactured house. Indoor Air. Volume 12 Issue 4. 2002.
Ishii, H. The tangible user interface and its evolution. June 2008, Communications of the
ACM, Volume 51 Issue 6, 2008.
74
Ishii, H., Lakatos, D., Bonanni, L., Labrune, J.B.. Radical atoms: beyond tangible bits,
toward transformable materials. Interactions 19, 1, 38-51, 2012.
Jacobs, J. Masters Thesis: Algorithmic Craft: the Synthesis of Computational Design,
Digital Fabrication, and Hand Craft. Media Arts and Sciences, Massachusetts Institute of
Technology, Cambridge, MA, August 2013.
Jacobs J., Buechley, L., Codeable Objects: Computational Design and Digital Fabrication
for Novice Programmers. Proceedings of the ACM SIGCHI Conference on Human Factors
in Computing Systems, Paris, France, April 2013.
Jansen, Y., Dragicevic, P., Fekete, J.D. Evaluating the Efficiency of Physical Visualizations.
Proceedings of the 2013 Annual Conference on Human Factors in Computing Systems,
2013.
Jordà, S., Geiger, G., Alonso, M., Kaltenbrunner, M. The reacTable: exploring the synergy
between live music performance and tabletop tangible interfaces. February 2007 TEI '07:
Proceedings of the 1st international conference on Tangible and embedded interaction,
2007.
Jurewicz J, Radwan M, Sobala W, Ligocka D, Radwan P, Bochenek M, Hawuła W, Jakubowski
L, Hanke W. Human urinary phthalate metabolites level and main semen parameters, sperm
chromatin structure, spermaneuploidy and reproductive hormones. Reprod Toxicol. 42:232-41,
2013.
Kim, S., Paulos, E. inAir: Sharing Indoor Air Quality Measurements and Visualizations, CHI
2010.
Kim, S., Paulos, E. Listening to Air Quality. EISE, 2009.
Knight Foundation. “Knight News Challenge Health Winners Announced.”
http://www.knightfoundation.org/blogs/knightblog/2014/1/14/seven-projects-win-22-million-
knight-news-challenge-health/. 2014.
75
Kosslyn, Stephen; Graph Design for the Eye and Mind. Oxford University Press, 2006.
Leung, M, Tomitsch, M, Vande Moere, A. Designing for Self-Expression: A Personal
Visualization Projection of Real-Time Social Data. CHI 2011.
Lin, J., Pan, P., Davis, S.J., Zhang, Q., He, K., Wang, C., Streets, D.G., Wuebbles, D.J.,
Guan, D. China’s international trade and air pollution in the United States. Proc Natl Acad
Sci, February 4; 111(5): 1736–1741, 2014.
Lohmann, R., Stapleton, H.M., Hites, R.A. Science Should Guide TSCA Reform. Environ.
Sci. Technol., 2013, 47 (16), pp 8995–8996, 2013.
Luescher, S. Beyond Visualization – Designing Interfaces to Contextualize Geospatial Data.
MIT Media Lab, 2013.
McMaster. www.mcmaster.com, 2014.
Miebach, N. http://nathaliemiebach.com/, 2014.
Ministry of Environmental Protection: the People’s Republic of China. “National Standards
on Environmental Protection.”
http://english.sepa.gov.cn/standards_reports/standards/Catalogue_Standards/201308/t2013
0815_257518.htm, 2013.
Miebach, N. Weather Data. http://nathaliemiebach.com/. 2013.
Miodovnik, A. Endocrine disruptors and childhood social impairment. Neurotoxicology 32
(2): 261–267, 2011.
76
Mrak, S. “Pedro's Oranj Peelz Degreaser.”
http://www.epinions.com/review/Pedro_s_Oranj_Peelz_Degreaser/content_632071360132?
sb=1, 2013.
National Conversation on Public Health and Chemical Exposures. Addressing Public
Health and Chemical Exposures: An Action Agenda. http://www.nationalconversation.us/
June 2011.
National Oceanic and Atmospheric Administration & Environmental Protection Agency. “Air
Quality.” http://www.noaawatch.gov/themes/air_quality.php, 2014.
NewForm Tech. “3D wire bending machine MB-R series.” http://youtu.be/D13KfrGSMC0,
2010.
Parlett L.E., Calafat A.M., Swan S.H.. Women's exposure to phthalates in relation to use of
personal care products. J Expo Sci Environ Epidemiol. Mar; 23(2): 197-206, 2013.
Parsons The New School for Design. Data Toys.
http://www.knightfoundation.org/grants/20120262/, 2013.
Patten, J. “Thumbles.’ http://www.pattenstudio.com/projects/thumbles/, 2014.
Paulos, E. Designing for Doubt: Citizen Science and the Challenge of Change. Engaging
Data: First International Forum on the Application and Management of Personal Electronic
Information. 2009.
Paulos, E. Jenkins, T., Joki A., Vora, P. Objects of Wonderment, DIS 2008.
77
Pedro’s. “Pedro’s Oranj Peelz.” http://pedros.com/products/clean-and-lube/degreasers-
andcleaners/oranj-peelz/, 2014.
Pedro's NA. “Safety Data Sheet, Pedro’s Orange Peelz.” http://pedros.com/wp-
content/msds/OranjPeelz_US_CAN_MEX_English.pdf, 2012.
Perovich, L, Mothersill, P, Broutin-Farah, J. Awakened Apparel: Embedded Soft Actuators
for Expressive Fashion and Functional Garments. TEI: International Conference on
Tangible, Embedded and Embodied Interaction, Germany, 2014.
Personal Genome Project: Harvard. http://www.personalgenomes.org/harvard, 2014.
Personal Genome Project. http://www.personalgenomes.org/organization/network, 2014.
ReivaxMaquinas English. “MAQ-3D-CNC.” http://youtu.be/uZO_vFtX1jI, 2011.
RoHS. “RoHS Guide Compliance.” http://www.rohsguide.com/, 2014.
Rudel, R.A., Camann, D.E., Spengler, J.D., Korn, L.R., Brody, J.G. Phthalates,
alkylphenols, pesticides, polybrominated diphenyl ethers, and other endocrine-disrupting
compounds in indoor air and dust. Environmental Science & Technology, 37(20), 2003.
Rudel, R.A., Dodson, R.E., Perovich, L.J., Morello‐Frosch, R., Camann, D.E., Zuniga, M.M.,
Yau, A.Y., Just, A.C., Brody, J.G.. Semivolatile endocrine disrupting compounds in paired
indoor and outdoor air in two northern California communities. Environmental Science &
Technology, 44 (17), 2010.
Rudel R.A., Gray J.M., Engel C.L., Rawsthorne T.W., Dodson R.E., Ackerman J.M., et al.
Food packaging and bisphenol a and bis(2-ethylhexyl) phthalate exposure: findings from a
dietary intervention. Environ Health Perspect 119914–920.920, 2011.
78
Rudel, R.A., Perovich, L.J. Endocrine disrupting chemicals in indoor and outdoor air.
Atmospheric Environment, 43: 170-181, 2009.
Ryokai, K., Marti, S., Ishii, H. I/O brush: drawing with everyday objects as ink. CHI '04
Proceedings of the SIGCHI Conference on Human Factors in Computing Systems, 2004.
Scottish Environmental Protection Agency. “Benzyl Butyl phthalate”. 2014.
http://apps.sepa.org.uk/spripa/Pages/SubstanceInformation.aspx?pid=23
Segrera, F. “TRANS-ELEMENTAL.” http://abstraks.com/?p=2708, 2012.
Silent Spring Institute. “Reporting Individual Exposure Results.”
http://silentspring.org/research-area/reporting-individual-exposure-results, 2014.
Silent Spring Institute, Brown University, Communities for a Better Environment. “Household
Exposure Study Chemicals,” http://silentspring.org/resource/chemicals-sampled, 2007
Sparkfun. “Conductive Fabric - 12"x13" MedTex180.”
https://www.sparkfun.com/products/10055, 2014.
Sparkfun. “Arduino Uno.” https://www.sparkfun.com/products/11021, 2014.
Swan, S.H. Environmental phthalate exposure in relation to reproductive outcomes and
other health endpoints in humans. Environmental Research 108 (2): 177–184, 2008.
Taiwan Spring Machine. “WB-4120 3D CNC wire bender.” http://youtu.be/3d1irXIZGtw.
2011.
79
Taking Space. “AirBeam”, http://www.takingspace.org/, 2014.
Tangible, Embedded and Embodied Interaction. http://www.tei-conf.org/15/, 2014.
Tangible Media Group. http://tangible.media.mit.edu/. MIT Media Lab, 2013.
Terry, S.F., Terri, P., Data Sharing: Power to the People: Participant Ownership of Clinical
Trial Data. Sci Transl Med: Vol. 3, Issue 69, 2011.
Thorp, Jer. Big Data Is Not the New Oil. Harvard Business Review: Nov 2012.
http://blogs.hbr.org/2012/11/data-humans-and-the-new-oil/
Underkoffler, J., Ishii, H. Urp: a luminous-tangible workbench for urban planning and design.
May 1999 CHI '99: Proceedings of the SIGCHI conference on Human factors in computing
systems, 1999.
Urbano. Crossing Urban Boundaries. http://www.urbanoproject.org/mbta/. 2013.
Vande Moere, A. Beyond the tyranny of the pixel: Exploring the physicality of information
visualization. In IV’08, 2008.
Vande Moere, A., Patel, S. The Physical Visualization of Information: Designing Data
Sculptures in an Educational Context, 2009.
Vande Moere, A., Patel, S. Analyzing the design approaches of physical data sculptures in
a design education context. In Visual Information Communications International (VINCI’09),
2009.
80
Vande Moere, A., Tomitsch, M., Hoinkis, M., Trefz, E., Johansen, S., Jones, A. Comparative
Feedback in the Street: Exposing Residential Energy Consumption on House Façades.
Interact, 2011.
Wilson, M. Six views of embodied cognition. Psychonomic Bulletin & Review 9 (2002), 625–
636.
Wikipedia. “Solder.” http://en.wikipedia.org/wiki/Solder#Solder_alloys, 2014.
Wolff, M.S. Occupational exposure to polychlorinated biphenyls (PCBs). Environmental
Health Perspectives. May 1985; 60: 133–138, 1985.
Yiwu Kenong Daily Commodity Factory. http://ywknong.en.alibaba.com. Zhejiang Province,
2014.
Zhang, P., Dong, G., Sun, B., Zhang, L., Chen, X., Ma, N., Yu, F., Guo, H., Huang, H., Lee,
Y.L., Tang, N., Chen, J. Long-Term Exposure to Ambient Air Pollution and Mortality Due to
Cardiovascular Disease and Cerebrovascular Disease in Shenyang, China. PLoS One.
2011; 6(6): e20827. 2011.
Zhou L.L., Wu G.L., Xue N.D., Yang B., Li F.S., Ding Q., Zhou D.D., Yan Y.Z., Liu B., Han
B.L.. Pollution patterns and health risk assessment for polychlorinated biphenyls in soils
from a capacitor storage site. Huan Jing Ke Xue. Feb; 35(2): 704-10, 2014.
Zoran, A. Hybrid Basketry: Interweaving digital practice within contemporary craft. In ACM
SIGGRAPH 2013 Art Gallery. New York, 2013.
Zoran, A. Hybrid Mediums. http://www.amitz.co/, 2014.
81
Zoran, A., Buechley, L. Hybrid reAssemblage: An Exploration of Craft, Digital Fabrication
and Artifact Uniqueness. Leonardo, Journal of Arts, Sciences and Technology, volume 46,
issue 1, 2013.
Zoran, A., Paradiso, J.A.. FreeD – A Freehand Digital Sculpting Tool. The 31th international
conference on Human factors in computing systems (CHI '13). ACM, Paris, 2013.
Zoran, A., Shilkrot, R., Goyal, P., Maes, P., Paradiso, J.A. 2014. The Wise Chisel: The Rise
of the Smart Handheld Tool. Pervasive Computing, IEEE , vol.13, no.3, pp.48,57, 2014.
Zoran, A., Shilkrot, R., Nanyakkara, S., Paradiso, J.A. The Hybrid Artisans: A Case Study in
Smart Tools. ACM Trans. Computer-Human Interactions. 21, 3, Article 15, 2013.
Zoran, A., Shilkrot, R. Paradiso, J.A. Human-computer Interaction for Hybrid Carving. The
26th annual ACM symposium on User Interface Software and Technology. St. Andrews,
Scotland, 2013.