Embed Size (px)
Citation preview

• Rai, Rashmi. 2017. “Emotions and Performance: Role of Emotional Intelligence.” NMIMS Management Review
34 (1): 94-105.
• Salanova, Marisa, Sonia Agut, and Jose M. Peiro. 2005. “Linking Organizational Resources and Work
Engagement to Employee Performance and Customer Loyalty: The Mediation of Service Climate.” Journal of
Applied Psychology 90 (6): 1217-1227.
• Schaufeli, Wilmar B., and Esther R. Greenglass. 2001. “Introduction to Special Issue on Burnout and Health.”
Psychology and Health 16, 501-506.
• Schippers, Michaéla. 1993. “Social Loafing Tendencies and Team Performance: The Compensating Effect of
Agreeableness and Conscientiousness.” Academy of Management Learning and Education 13 (1): 62-81.
• Serinkan, Celalettin, and Ahmet Bardakcı. 2009. “Pamukkale Üniversitesi'ndeki Akademik Personelin İş
Tatminleri ve Tükenmişlik Düzeylerine İlişkin Bir Araştırma.” Sosyal Bilimler Dergisi 21, 115-132.
• Şeşen, Harun, and Çağdaş Aktif Kahraman. 2014. “İş Arkadaşlarının Sosyal Kaytarmasının, Bireyin İş Tatmini,
Örgütsel Bağlılık ve Kendi Kaytarma Davranışlarına Etkisi.” İş ve İnsan Dergisi 1 (1): 43-51.
• Sünnetçioğlu, Serdar, Halil Korkmaz, and Mustafa Koyuncu. 2014. “Konaklama İşletmelerinde Algılanan Örgüt
Kültür Tipinin Çalışanların Sosyal Kaytarma Davranışlarını Algılamasına Etkisi Üzerine Bir Araştırma.” Mustafa
Kemal Üniversitesi Sosyal Bilimler Enstitüsü Dergisi 11 (28): 17-34.
• Sürgevil, Olca. 2006. Çalışma Hayatında Tükenmişlik Sendromu Tükenmişlikle Mücadele Teknikleri. Ankara,
Nobel Yayın Dağıtım.
• Ülke, Hilal E. 2006. “Investigating the Role of Personality and Justice Perceptions on Social Loafing”
(Yayınlanmamış Yüksek Lisans Tezi): Orta Doğu Teknik Üniversitesi, Sosyal Bilimler Enstitüsü, Ankara.
• Webb, Noreen M. 1989. “Assessing Students in Small Collaborative Groups.” Theory into Practice 36 (4): 205-
213.
• Yadav, Lalit Kumar, and Nagendra Yadav. 2016. “Organizational Justice: An Analysis of Approaches, Dimensions
and Outcomes.” NMIMS Management Review 31, 14-40.
H. Tezcan Uysal is a Lecturer at the Bülent Ecevit University since 2012. Uysal's research interests have
spanned a wide range of topics, from job satisfaction, motivation, stress, organizational climate, mobbing,
reverse mobbing, decision making, job performance, to benchmarking, individual service quality, behaviour
models, cynicism, burnout, and leadership. In recent years, he has focused on the new techniques and
models in work psychology such as Psychological Benchmarking. He has published over 30 articles in
international refereed journals and conference proceedings. He is also a regular reviewer for a number of
national and international refereed journals. He can be reached at [email protected]
Data Envelopment Analysis (DEA) –Application at NMIMS – SBM,a Leading AACSB Accredited
Indian Higher Education Business School
Pradeep Pai¹
Bilal Mustafa Khan²
P. N. Mukherjee³
AbstractThis study seeks to use the concept of Data
Envelopment Analysis for setting benchmarks of
efficiency using two inputs and two outputs. In the
process , the study h ighl ights the inherent
contradictions in the application. In case of deficient
divisions, instead of increasing the inputs to better the
output, the DEA analysis recommends reducing the
inputs.
Design / Methodology / Approach: Cross-sectional
study of data is used for analysis of the performance of
the various divisions in NMIMS.
Findings: Data Envelopment Analysis (DEA) is a
wonderful method for benchmarking and enhancing
productivity of services. As services are entirely
different from products, concepts like productivity
cannot be applied without modifications. Further,
services being customer-centric characterised by
customer participation, simultaneity, perishability,
intangibility, and hetereogeneity, the concept of an
'absolute' benchmark is also not feasible. With the
input and output metrics being ill-defined,setting
milestones and targets for improvement become
difficult. DEA technique uses the concept of 'relative'
benchmark and also provides sufficient directions for
improvement.
Practical Implications: In the Indian context, these
concepts become very relevent because in the present
state of evolution of services, we have much to
improvise. Further, India being a geographical expanse
with wide variation in customer preferences,
expectations and preceptions, the process of
improvement of services becomes more complex. At
present, the demand for services exceeds supply and
hence, the need for competitiveness is not felt. In the
near future when the performance metrics of services
becomes an important criteria for business success,
the role of DEA will be crucial for productivity
improvements and in deciding the viability of service
outlets.
Originality / Value: This DEA analysis in the Indian
higher education context is one of the few analyses
that demonstrate the utility of the DEA technique, its
limitations and its role in qualitative aspects of services
benchmarking. DEA analysis is applied in the context
of linear relationships of inputs and outputs with the
focus on controlling the inputs rather than focusing on
output performance. The outputs in terms of
performance are more difficult to manage whereas
the inputs are comparitively easy to manage.
Keywords: Benchmarking, Data Envelopment
Analysis, Productivity, efficiency, shadow price.
ISSN: 0971-1023 | NMIMS Management ReviewVolume XXXVI | Issue 4 | January 2019
Data Envelopment Analysis (DEA) – Application at NMIMS – SBM,a leading AACSB accredited Indian higher education Business School
ISSN: 0971-1023 | NMIMS Management ReviewVolume XXXVI | Issue 4 | January 2019
¹ Associate Professor, Narsee Monjee Institute of Management Studies, Mumbai, Maharashtra, India
² Professor, Department of Business Administration, Aligarh Muslim University, Aligarh, India
³ Director – Navi Mumbai campus, NMIMS University, Mumbai
The Effect of Social Loafing Perception to Workers'Feelings of Burnout in Organisations*
84 85
cities of India, and therefore street
Contents
mall farmers. Majority of the
farmers (82%) borrow less than
Rs 5 lakhs, and 18% borrow
between Rs 5 – 10 lakhs on a
per annum basis. Most farmers
(65.79%) ar
Table source heading
Table 23: The Results of Mann-Whitney U Test for DOWJONES Index Daily Returns
Dr. Rosy KalraMr. Piyuesh Pandey
References
Antecedents to Job Satisfactionin the Airline Industry
1 footnote footnote footnote footnote footnote footnote published earlier in NMIMS
footnote published earlier in NMIMS footnote published earlier in NMIMS footnote
published earlier in NMIMS footnote published earlier in NMIMS footnote
ISSN: 0971-1023 | NMIMS Management ReviewVolume XXXVI | Issue 4 | January 2019
Data Envelopment Analysis (DEA) – Application at NMIMS – SBM,a leading AACSB accredited Indian higher education Business School
ISSN: 0971-1023 | NMIMS Management ReviewVolume XXXVI | Issue 4 | January 2019
Data Envelopment Analysis (DEA) – Application at NMIMS – SBM,a leading AACSB accredited Indian higher education Business School
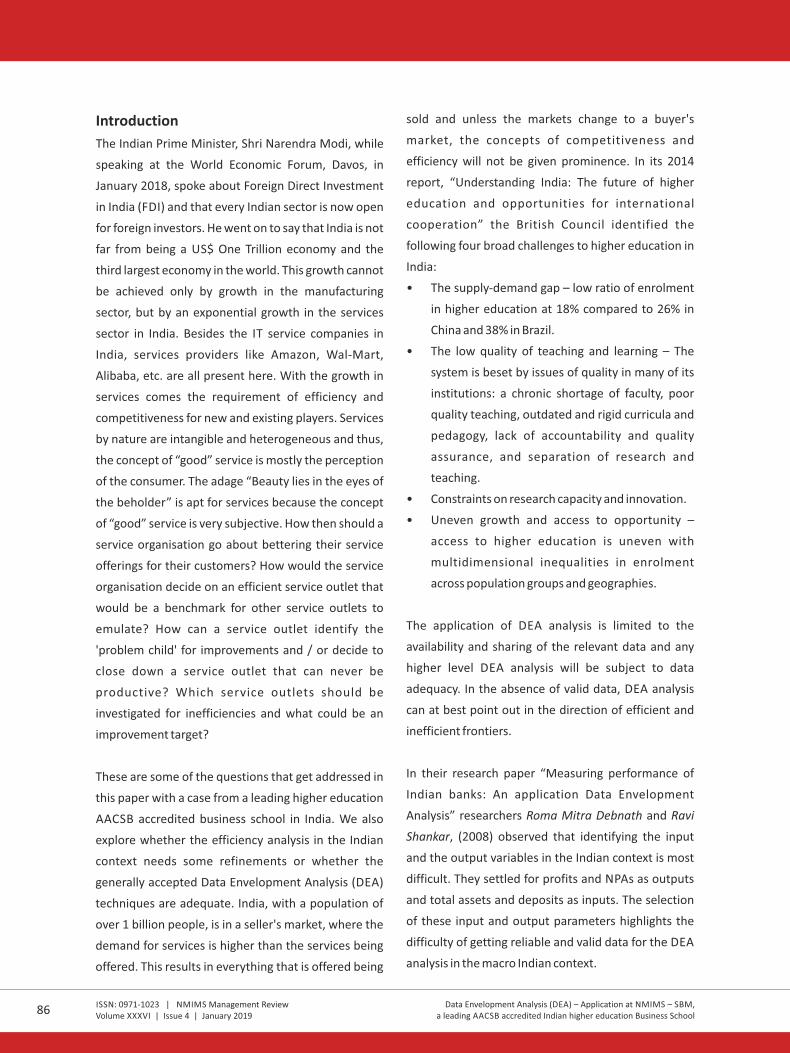
Introduction
The Indian Prime Minister, Shri Narendra Modi, while
speaking at the World Economic Forum, Davos, in
January 2018, spoke about Foreign Direct Investment
in India (FDI) and that every Indian sector is now open
for foreign investors. He went on to say that India is not
far from being a US$ One Trillion economy and the
third largest economy in the world. This growth cannot
be achieved only by growth in the manufacturing
sector, but by an exponential growth in the services
sector in India. Besides the IT service companies in
India, services providers like Amazon, Wal-Mart,
Alibaba, etc. are all present here. With the growth in
services comes the requirement of efficiency and
competitiveness for new and existing players. Services
by nature are intangible and heterogeneous and thus,
the concept of “good” service is mostly the perception
of the consumer. The adage “Beauty lies in the eyes of
the beholder” is apt for services because the concept
of “good” service is very subjective. How then should a
service organisation go about bettering their service
offerings for their customers? How would the service
organisation decide on an efficient service outlet that
would be a benchmark for other service outlets to
emulate? How can a service outlet identify the
'problem child' for improvements and / or decide to
close down a service outlet that can never be
productive? Which service outlets should be
investigated for inefficiencies and what could be an
improvement target?
These are some of the questions that get addressed in
this paper with a case from a leading higher education
AACSB accredited business school in India. We also
explore whether the efficiency analysis in the Indian
context needs some refinements or whether the
generally accepted Data Envelopment Analysis (DEA)
techniques are adequate. India, with a population of
over 1 billion people, is in a seller's market, where the
demand for services is higher than the services being
offered. This results in everything that is offered being
sold and unless the markets change to a buyer's
market, the concepts of competitiveness and
efficiency will not be given prominence. In its 2014
report, “Understanding India: The future of higher
education and opportunities for international
cooperation” the British Council identified the
following four broad challenges to higher education in
India:
• The supply-demand gap – low ratio of enrolment
in higher education at 18% compared to 26% in
China and 38% in Brazil.
• The low quality of teaching and learning – The
system is beset by issues of quality in many of its
institutions: a chronic shortage of faculty, poor
quality teaching, outdated and rigid curricula and
pedagogy, lack of accountability and quality
assurance, and separation of research and
teaching.
• Constraints on research capacity and innovation.
• Uneven growth and access to opportunity –
access to higher education is uneven with
multidimensional inequalities in enrolment
across population groups and geographies.
The application of DEA analysis is limited to the
availability and sharing of the relevant data and any
higher level DEA analysis will be subject to data
adequacy. In the absence of valid data, DEA analysis
can at best point out in the direction of efficient and
inefficient frontiers.
In their research paper “Measuring performance of
Indian banks: An application Data Envelopment
Analysis” researchers Roma Mitra Debnath and Ravi
Shankar, (2008) observed that identifying the input
and the output variables in the Indian context is most
difficult. They settled for profits and NPAs as outputs
and total assets and deposits as inputs. The selection
of these input and output parameters highlights the
difficulty of getting reliable and valid data for the DEA
analysis in the macro Indian context.
Literature review and observations
Bivraj Bhushan Parida (2013) in his research paper
“Measuring moderating effects of service recovery
and CRM on consumer trust, re-patronisation and
advocacy with distribution variation of the same
across recovery zone-of-tolerance” mentioned about
the effects of service failure related to its transactions
and quality perceptions. In this paper, the author
mentions about the banking sector and the
moderating effect of perceived service recovery and
zone of tolerance of customers on some specific
behavioural manifestation, again referring to inputs
and outputs.
Rita Chopra (2014) in her research paper “Service
Quality in Higher Education: A Comparative Study of
Management and Education Institutions” identifies
the gaps between perceptions and expectations of
students seeking higher education in the country. The
paper using SERVQUAL concluded that there is a
significant dissatisfaction due to the negative gap in
service quality.
Kunjal Sinha (2014) in her research paper “An Empirical
Study on Employees' Perception towards Learning and
Development: A Self-Learning Perspective” identifies
the fact that many organisations would like to have
some benchmark and correlation between learning,
innovation and high-performance. This paper speaks
about the qualitative aspects and the problems
involved in assessing the qualitative aspects and then
linking it to performance.
Mani Shreshta (2014) in his paper “Customers'
Preference Towards Functional Benefits Versus
Experiential Benefits from Bank Brands” speaks about
the aspect of competitiveness in the banking space
and the need to have a system to ensure that bank
services are acceptable to the customers.
Dr. Tejinder Sharma (2015) in his paper “Faculty
Perspectives of Internal Marketing Practices – An
Exploratory Study in B-Schools of Punjab” speaks
about the internal customer and external customer
concept in education institutes again highlighting the
competitive scenario in the education “services”
sector.
Gordhan K. Saini, S. K. Pandey, Archana Singh,
Gurumurthy Kalyanaram (2018) in their research
paper “Role of Empathy and Customer Orientation in
Job Satisfaction and Organisational Commitment
Indian Stock Markets” explored the concept of
customer orientation in the services sector. The paper
speaks about the reasons for customer dissatisfaction
after their interactions with the customer contact
personnel. A measurement of the dissatisfaction level
and a benchmark for customer contact personnel
empathy is mentioned in the paper.
M Abbot & C Doucouliagos (2003) in their research
paper “The efficiency of Australian Universities – A
Data Envelopment Analysis” observed that Australian
Universities as a whole had higher degrees of
efficiency relative to each other irrespective of the
output-input mix. The need for higher efficiency in the
Operations of the universities across the globe was felt
because of increasing numbers of students registering
for participation in higher education and the finance
constraints for governments in funding these
universities.
Y. H. B. WONG and J. E. BEASLEY, (1990) in their
research paper Restricting Weight Flexibility in Data
Envelopment Analysis, studied three inputs namely
number of academic staff, academic staff salaries and
support staff salaries vis-a-vis three outputs which are
- number of under-graduate students, number of post-
graduate students and number of research papers
published across all departments. The researchers
describe a method to give priority or proportions of
weightings to the inputs and outputs rather than
86 87
cities of India, and therefore street
Contents
mall farmers. Majority of the
farmers (82%) borrow less than
Rs 5 lakhs, and 18% borrow
between Rs 5 – 10 lakhs on a
per annum basis. Most farmers
(65.79%) ar
Table source heading
Table 23: The Results of Mann-Whitney U Test for DOWJONES Index Daily Returns
Dr. Rosy KalraMr. Piyuesh Pandey
References
Antecedents to Job Satisfactionin the Airline Industry
1 footnote footnote footnote footnote footnote footnote published earlier in NMIMS
footnote published earlier in NMIMS footnote published earlier in NMIMS footnote
published earlier in NMIMS footnote published earlier in NMIMS footnote

ISSN: 0971-1023 | NMIMS Management ReviewVolume XXXVI | Issue 4 | January 2019
Data Envelopment Analysis (DEA) – Application at NMIMS – SBM,a leading AACSB accredited Indian higher education Business School
ISSN: 0971-1023 | NMIMS Management ReviewVolume XXXVI | Issue 4 | January 2019
Data Envelopment Analysis (DEA) – Application at NMIMS – SBM,a leading AACSB accredited Indian higher education Business School
Introduction
The Indian Prime Minister, Shri Narendra Modi, while
speaking at the World Economic Forum, Davos, in
January 2018, spoke about Foreign Direct Investment
in India (FDI) and that every Indian sector is now open
for foreign investors. He went on to say that India is not
far from being a US$ One Trillion economy and the
third largest economy in the world. This growth cannot
be achieved only by growth in the manufacturing
sector, but by an exponential growth in the services
sector in India. Besides the IT service companies in
India, services providers like Amazon, Wal-Mart,
Alibaba, etc. are all present here. With the growth in
services comes the requirement of efficiency and
competitiveness for new and existing players. Services
by nature are intangible and heterogeneous and thus,
the concept of “good” service is mostly the perception
of the consumer. The adage “Beauty lies in the eyes of
the beholder” is apt for services because the concept
of “good” service is very subjective. How then should a
service organisation go about bettering their service
offerings for their customers? How would the service
organisation decide on an efficient service outlet that
would be a benchmark for other service outlets to
emulate? How can a service outlet identify the
'problem child' for improvements and / or decide to
close down a service outlet that can never be
productive? Which service outlets should be
investigated for inefficiencies and what could be an
improvement target?
These are some of the questions that get addressed in
this paper with a case from a leading higher education
AACSB accredited business school in India. We also
explore whether the efficiency analysis in the Indian
context needs some refinements or whether the
generally accepted Data Envelopment Analysis (DEA)
techniques are adequate. India, with a population of
over 1 billion people, is in a seller's market, where the
demand for services is higher than the services being
offered. This results in everything that is offered being
sold and unless the markets change to a buyer's
market, the concepts of competitiveness and
efficiency will not be given prominence. In its 2014
report, “Understanding India: The future of higher
education and opportunities for international
cooperation” the British Council identified the
following four broad challenges to higher education in
India:
• The supply-demand gap – low ratio of enrolment
in higher education at 18% compared to 26% in
China and 38% in Brazil.
• The low quality of teaching and learning – The
system is beset by issues of quality in many of its
institutions: a chronic shortage of faculty, poor
quality teaching, outdated and rigid curricula and
pedagogy, lack of accountability and quality
assurance, and separation of research and
teaching.
• Constraints on research capacity and innovation.
• Uneven growth and access to opportunity –
access to higher education is uneven with
multidimensional inequalities in enrolment
across population groups and geographies.
The application of DEA analysis is limited to the
availability and sharing of the relevant data and any
higher level DEA analysis will be subject to data
adequacy. In the absence of valid data, DEA analysis
can at best point out in the direction of efficient and
inefficient frontiers.
In their research paper “Measuring performance of
Indian banks: An application Data Envelopment
Analysis” researchers Roma Mitra Debnath and Ravi
Shankar, (2008) observed that identifying the input
and the output variables in the Indian context is most
difficult. They settled for profits and NPAs as outputs
and total assets and deposits as inputs. The selection
of these input and output parameters highlights the
difficulty of getting reliable and valid data for the DEA
analysis in the macro Indian context.
Literature review and observations
Bivraj Bhushan Parida (2013) in his research paper
“Measuring moderating effects of service recovery
and CRM on consumer trust, re-patronisation and
advocacy with distribution variation of the same
across recovery zone-of-tolerance” mentioned about
the effects of service failure related to its transactions
and quality perceptions. In this paper, the author
mentions about the banking sector and the
moderating effect of perceived service recovery and
zone of tolerance of customers on some specific
behavioural manifestation, again referring to inputs
and outputs.
Rita Chopra (2014) in her research paper “Service
Quality in Higher Education: A Comparative Study of
Management and Education Institutions” identifies
the gaps between perceptions and expectations of
students seeking higher education in the country. The
paper using SERVQUAL concluded that there is a
significant dissatisfaction due to the negative gap in
service quality.
Kunjal Sinha (2014) in her research paper “An Empirical
Study on Employees' Perception towards Learning and
Development: A Self-Learning Perspective” identifies
the fact that many organisations would like to have
some benchmark and correlation between learning,
innovation and high-performance. This paper speaks
about the qualitative aspects and the problems
involved in assessing the qualitative aspects and then
linking it to performance.
Mani Shreshta (2014) in his paper “Customers'
Preference Towards Functional Benefits Versus
Experiential Benefits from Bank Brands” speaks about
the aspect of competitiveness in the banking space
and the need to have a system to ensure that bank
services are acceptable to the customers.
Dr. Tejinder Sharma (2015) in his paper “Faculty
Perspectives of Internal Marketing Practices – An
Exploratory Study in B-Schools of Punjab” speaks
about the internal customer and external customer
concept in education institutes again highlighting the
competitive scenario in the education “services”
sector.
Gordhan K. Saini, S. K. Pandey, Archana Singh,
Gurumurthy Kalyanaram (2018) in their research
paper “Role of Empathy and Customer Orientation in
Job Satisfaction and Organisational Commitment
Indian Stock Markets” explored the concept of
customer orientation in the services sector. The paper
speaks about the reasons for customer dissatisfaction
after their interactions with the customer contact
personnel. A measurement of the dissatisfaction level
and a benchmark for customer contact personnel
empathy is mentioned in the paper.
M Abbot & C Doucouliagos (2003) in their research
paper “The efficiency of Australian Universities – A
Data Envelopment Analysis” observed that Australian
Universities as a whole had higher degrees of
efficiency relative to each other irrespective of the
output-input mix. The need for higher efficiency in the
Operations of the universities across the globe was felt
because of increasing numbers of students registering
for participation in higher education and the finance
constraints for governments in funding these
universities.
Y. H. B. WONG and J. E. BEASLEY, (1990) in their
research paper Restricting Weight Flexibility in Data
Envelopment Analysis, studied three inputs namely
number of academic staff, academic staff salaries and
support staff salaries vis-a-vis three outputs which are
- number of under-graduate students, number of post-
graduate students and number of research papers
published across all departments. The researchers
describe a method to give priority or proportions of
weightings to the inputs and outputs rather than
86 87
cities of India, and therefore street
Contents
mall farmers. Majority of the
farmers (82%) borrow less than
Rs 5 lakhs, and 18% borrow
between Rs 5 – 10 lakhs on a
per annum basis. Most farmers
(65.79%) ar
Table source heading
Table 23: The Results of Mann-Whitney U Test for DOWJONES Index Daily Returns
Dr. Rosy KalraMr. Piyuesh Pandey
References
Antecedents to Job Satisfactionin the Airline Industry
1 footnote footnote footnote footnote footnote footnote published earlier in NMIMS
footnote published earlier in NMIMS footnote published earlier in NMIMS footnote
published earlier in NMIMS footnote published earlier in NMIMS footnote

deciding arbitrarily the importance of each input or
output.
H David Sherman and Franklin Gold (1985) in their
research paper “Bank branch operating efficiency:
Evaluation with Data Envelopment Analysis” analyses
efficient and inefficient bank branches using the DEA
technique. They considered the services provided as
outputs and resources used to provide these services
as inputs. They concluded that the DEA approach is a
beneficial complement to other methods measuring
the banking efficiency.
Yong Joo Lee, Seong-Jong Joo, Hong Gyun Park, (2017)
in their research paper "An application of data
envelopment analysis for Korean banks with negative
data", found out that the performance difference
between special banks and regional banks is
statistically significant. This is because of the national
presence of these special banks and their ownership.
In this paper, the authors advocate the use of Modified
Slacks Based Measure of efficiency model (MSBM)
over the Banker, Charles and Cooper (BCC) model as
the MSBM model can handle negative data.
Tomáš Rosenmayer, (2014) in his research paper
“Using Data Envelopment Analysis: a Case of
Universities” mentions that the university is a social
construct and a subjective matter related to the
objectives of the stakeholders and as such, inter
university comparisons may not be entirely correct. As
per the author, it is necessary to set an objective
function that accepts the objectives of the given
stakeholders and not just focus on the inputs and
outputs.
Bernard Montoneri, 2014, in his research paper
“Teaching Improvement Model Designed with DEA
Method and Management Matrix” studied the
student evaluation of teachers to design a teaching
improvement matrix based on teaching efficiency and
performance using the DEA analysis. Two inputs,
teaching clarity and teaching enthusiasm, and two
outputs, students learning interest and students
satisfaction with the grades were considered, as these
inputs and outputs were highly correlated.
In the context of this paper, three key concepts need to
be explained:
1. Concept of Benchmarking.
2. Concept of Data Envelopment Analysis (DEA).
3. Concept of Shadow price.
Concept of Benchmarking
Benchmarking is the process of comparing one's
business processes and performance metrics with the
best performing organisations with a singular
objective to improve upon one's performance. Some
of the measures used in benchmarking could include
cost per unit of measure, productivity per unit of
measure, cycle time per unit of measure or defects per
unit of measure. In the case of services, cost is never
the focus with revenues being more important. In case
of revenue, there is no universal benchmark feasible as
a lot depends on many extraneous factors like location,
customer profile, demographics, etc. It would be
unwise to compare the performance of a bank branch
located in a residential area with a branch located in a
commercial district. Similarly the pizza outlets or
burger outlets operating only vegetarian outlets will
have different cost structure when compared with the
outlets also offering non-vegetarian products. Cycle
time per customer cannot be a measure because the
requirements of the customers may vary and the
customer profile may also vary, in which case fixing a
benchmark cycle time or customer turn-around time is
also not admissible. Heterogeneity of services rule out
the concept of customer satisfaction as a benchmark
and for similar reasons, defects per unit cannot be a
measure of services benchmark. The only option for
services benchmarking is therefore productivity per
service centre also known as efficiency per service
centre.
Concept of Data Envelopment Analysis
DEA is a non-parametric method used to compute the
efficiency frontier, and measure the productive
efficiency of each decision making unit. In our case of
services, we can identify any number of tangible
outputs and likewise any number of tangible inputs
which can be measured on a common scale and use
this data to identify the best performing centres. These
best performing centres then become a reference
point for the other centres to emulate. In the process,
the best performing centres are all relative to each
other and the best performing centre may or may not
continue to be the best performing centre in the next
round of analysis. Wherever possible, all the inputs
and all the outputs must be considered and weightings
for the inputs and outputs should be considered. In our
research paper, for the sake of simplicity we have
considered two inputs and two outputs with equal
weights. Any quantifiable input and output must not
be ignored in the DEA analysis.
In the words of Cook, Tone and Zhu (2014) DEA may
not form a production frontier but would lead to a best
practice frontier. DEA differs from the ordinary least
squares (OLS) method which bases comparison
relative to an average service centre with the DEA
comparing everyone with the most efficient service
centre amongst themselves.
In the example given in Figure1, we have six service
centres having two common inputs but different
values and presuming the same output for all outlets
we have identified the best service centres. The
service centres A (2, 200), B (4, 150), C (4, 100), D (6,
100), E (8, 80) and F (10, 50) are plotted and it is
observed that centre A, C & F are efficient centres.
Centres B, D & E are inefficient at present and can be
efficient only when their coordinates are those at the
intersection of dotted line from origin and the efficient
boundary or envelope.
Figure 1: DEA efficiency frontier
Since DEA identifies a frontier characterised by
extreme points method, it forms an envelope with the
best service centres lying on this frontier and the
inefficient centres lying inside the envelope. As per
Berg (2010), the most efficient producers form a
composite producer or service benchmark centre,
allowing the computation of an efficient solution for
every level of input or output. Although theoretically
ISSN: 0971-1023 | NMIMS Management ReviewVolume XXXVI | Issue 4 | January 2019
Data Envelopment Analysis (DEA) – Application at NMIMS – SBM,a leading AACSB accredited Indian higher education Business School
ISSN: 0971-1023 | NMIMS Management ReviewVolume XXXVI | Issue 4 | January 2019
Data Envelopment Analysis (DEA) – Application at NMIMS – SBM,a leading AACSB accredited Indian higher education Business School
88 89
cities of India, and therefore street
Contents
mall farmers. Majority of the
farmers (82%) borrow less than
Rs 5 lakhs, and 18% borrow
between Rs 5 – 10 lakhs on a
per annum basis. Most farmers
(65.79%) ar
Table source heading
Table 23: The Results of Mann-Whitney U Test for DOWJONES Index Daily Returns
Dr. Rosy KalraMr. Piyuesh Pandey
References
Antecedents to Job Satisfactionin the Airline Industry
1 footnote footnote footnote footnote footnote footnote published earlier in NMIMS
footnote published earlier in NMIMS footnote published earlier in NMIMS footnote
published earlier in NMIMS footnote published earlier in NMIMS footnote
we can increase the output of a service centre to better
its efficiency, we prefer to reduce the inputs of a
service centre in order to increase the centre
efficiency. This is for the obvious fact that we can
better control and manage the inputs and not the
outputs due to external factors.
DEA is not without its disadvantages; a comprehensive
selection of all inputs and outputs is not always
possible. Moreover with an increase in the inputs and
outputs, the number of efficient firms increases, which
can make benchmarking complicated. We can come
across situations where some firms are efficient on
parameters A & B, whereas some other firms are
efficient on parameters B & C. One method to
overcome this is by of assigning weights to the input
parameters, besides just identifying them. We then
use the cross-efficiency ranking method of assigning
weights to each of the input and output parameters to
reduce some of these disadvantages of multiple inputs
and outputs. In this paper, we have used the basic DEA
model to explain the advantages and disadvantages of
the method.
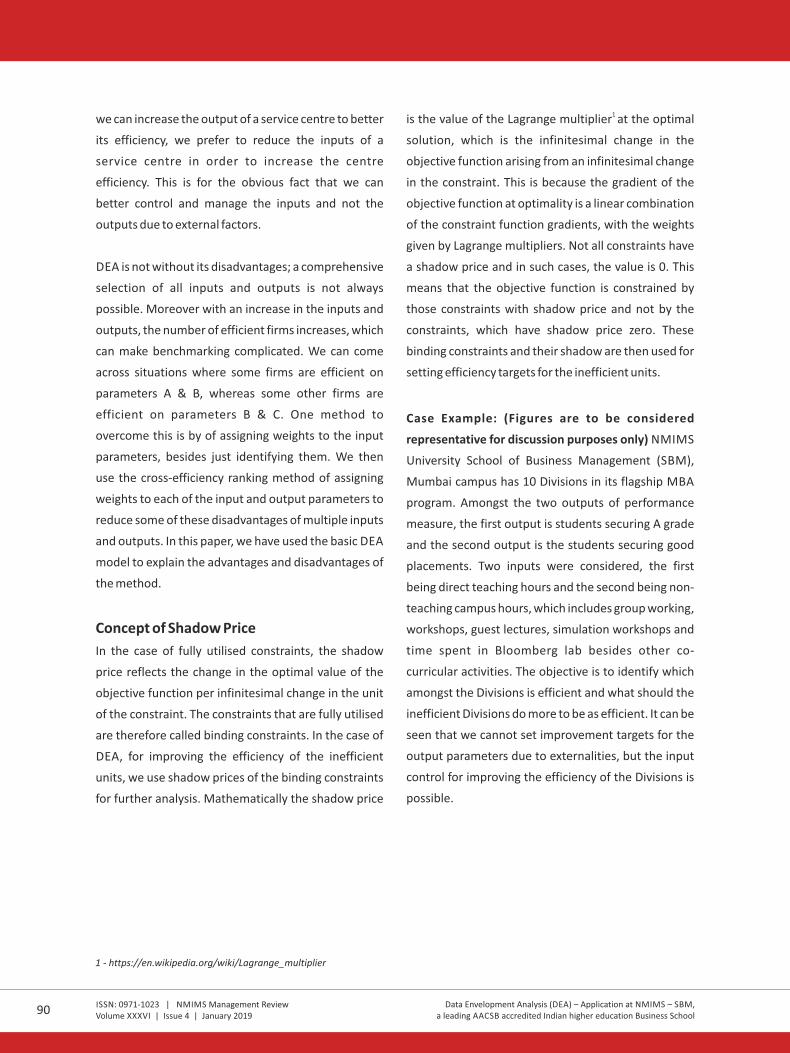
Concept of Shadow Price
In the case of fully utilised constraints, the shadow
price reflects the change in the optimal value of the
objective function per infinitesimal change in the unit
of the constraint. The constraints that are fully utilised
are therefore called binding constraints. In the case of
DEA, for improving the efficiency of the inefficient
units, we use shadow prices of the binding constraints
for further analysis. Mathematically the shadow price
1 is the value of the Lagrange multiplier at the optimal
solution, which is the infinitesimal change in the
objective function arising from an infinitesimal change
in the constraint. This is because the gradient of the
objective function at optimality is a linear combination
of the constraint function gradients, with the weights
given by Lagrange multipliers. Not all constraints have
a shadow price and in such cases, the value is 0. This
means that the objective function is constrained by
those constraints with shadow price and not by the
constraints, which have shadow price zero. These
binding constraints and their shadow are then used for
setting efficiency targets for the inefficient units.
Case Example: (Figures are to be considered
representative for discussion purposes only) NMIMS
University School of Business Management (SBM),
Mumbai campus has 10 Divisions in its flagship MBA
program. Amongst the two outputs of performance
measure, the first output is students securing A grade
and the second output is the students securing good
placements. Two inputs were considered, the first
being direct teaching hours and the second being non-
teaching campus hours, which includes group working,
workshops, guest lectures, simulation workshops and
time spent in Bloomberg lab besides other co-
curricular activities. The objective is to identify which
amongst the Divisions is efficient and what should the
inefficient Divisions do more to be as efficient. It can be
seen that we cannot set improvement targets for the
output parameters due to externalities, but the input
control for improving the efficiency of the Divisions is
possible.
The input and output data is provided in table 2.
1 - https://en.wikipedia.org/wiki/Lagrange_multiplier
Division Students with Grade A
Good Placements Teaching Time (Hours per week)
Non-teaching Time (Hours per week)
A
30
25
40
35
B
28
26
38
33
C
27
29
36
37
D
31
20
37
32
E
30
27
35
35
F
32
22
38
33
G
29
28
31
34
H
27
30
32
30
I
26
31
38
32
J 31 28 36 33
Table 2: NMIMS SBM data
Variables
Output Variable – Students with grade A (u ) and good 1
placements (u )2
Input Variables – Teaching hours (v ) and non-teaching 1
hours (v )2
Objective Function Formulation (For Division A)
Max Z = 30 u + 25 u1 2
Subject to
30 u + 25 u – (40 v + 35 v ) ≤ 0 Division A constraint1 2 1 2
28 u + 26 u – (38 v + 33 v ) ≤ 0 Division B constraint1 2 1 2
27 u + 29 u – (36 v + 37 v ) ≤ 0 Division C constraint1 2 1 2
31 u + 20 u – (37 v + 32 v ) ≤ 0 Division D constraint1 2 1 2
30 u + 27 u – (35 v + 35 v ) ≤ 0 Division E constraint1 2 1 2
32 u + 22 u – (38 v + 33 v ) ≤ 0 Division F constraint1 2 1 2
29u + 28u – (31v + 34v ) ≤ 0 Division G constraint1 2 1 2
27u + 30 u – (32v + 30v ) ≤ 0 Division H constraint1 2 1 2
26 u + 31 u – (38 v + 32 v ) ≤ 0 Division I constraint1 2 1 2
31 u + 28 u – (36 v + 33 v ) ≤ 0 Division J constraint1 2 1 2
(40 v + 35 v ) = 1 Division A unique1 2
constraint
u , u , v , v ≥ 0 non-negativity1 2 1 2
constraint
Objective Function Formulation: (For Division B)
Max Z = 28 u + 26 u1 2
Subject to
30 u + 25 u – (40 v + 35 v ) ≤ 0 Division A constraint1 2 1 2
28 u + 26 u – (38 v + 33 v ) ≤ 0 Division B constraint1 2 1 2
27 u + 29 u – (36 v + 37 v ) ≤ 0 Division C constraint1 2 1 2
31 u + 20 u – (37 v + 32 v ) ≤ 0 Division D constraint1 2 1 2
30 u + 27 u – (35 v + 35 v ) ≤ 0 Division E constraint1 2 1 2
32 u + 22 u – (38 v + 33 v ) ≤ 0 Division F constraint1 2 1 2
29 u + 28 u – (31 v + 34 v ) ≤ 0 Division G constraint1 2 1 2
27 u + 30 u – (32 v + 30 v ) ≤ 0 Division H constraint1 2 1 2
26 u + 31 u – (38 v + 32 v ) ≤ 0 Division I constraint1 2 1 2
31 u + 28 u – (36 v + 33 v ) ≤ 0 Division J constraint1 2 1 2
(38 v + 33 v ) = 1 Division B unique1 2
constraint
u , u , v , v ≥ 0 non-negativity1 2 1 2
constraint
ISSN: 0971-1023 | NMIMS Management ReviewVolume XXXVI | Issue 4 | January 2019
Data Envelopment Analysis (DEA) – Application at NMIMS – SBM,a leading AACSB accredited Indian higher education Business School
ISSN: 0971-1023 | NMIMS Management ReviewVolume XXXVI | Issue 4 | January 2019
Data Envelopment Analysis (DEA) – Application at NMIMS – SBM,a leading AACSB accredited Indian higher education Business School
90 91
cities of India, and therefore street
Contents
mall farmers. Majority of the
farmers (82%) borrow less than
Rs 5 lakhs, and 18% borrow
between Rs 5 – 10 lakhs on a
per annum basis. Most farmers
(65.79%) ar
Table source heading
Table 23: The Results of Mann-Whitney U Test for DOWJONES Index Daily Returns
Dr. Rosy KalraMr. Piyuesh Pandey
References
Antecedents to Job Satisfactionin the Airline Industry
1 footnote footnote footnote footnote footnote footnote published earlier in NMIMS
footnote published earlier in NMIMS footnote published earlier in NMIMS footnote
published earlier in NMIMS footnote published earlier in NMIMS footnote

we can increase the output of a service centre to better
its efficiency, we prefer to reduce the inputs of a
service centre in order to increase the centre
efficiency. This is for the obvious fact that we can
better control and manage the inputs and not the
outputs due to external factors.
DEA is not without its disadvantages; a comprehensive
selection of all inputs and outputs is not always
possible. Moreover with an increase in the inputs and
outputs, the number of efficient firms increases, which
can make benchmarking complicated. We can come
across situations where some firms are efficient on
parameters A & B, whereas some other firms are
efficient on parameters B & C. One method to
overcome this is by of assigning weights to the input
parameters, besides just identifying them. We then
use the cross-efficiency ranking method of assigning
weights to each of the input and output parameters to
reduce some of these disadvantages of multiple inputs
and outputs. In this paper, we have used the basic DEA
model to explain the advantages and disadvantages of
the method.
Concept of Shadow Price
In the case of fully utilised constraints, the shadow
price reflects the change in the optimal value of the
objective function per infinitesimal change in the unit
of the constraint. The constraints that are fully utilised
are therefore called binding constraints. In the case of
DEA, for improving the efficiency of the inefficient
units, we use shadow prices of the binding constraints
for further analysis. Mathematically the shadow price
1 is the value of the Lagrange multiplier at the optimal
solution, which is the infinitesimal change in the
objective function arising from an infinitesimal change
in the constraint. This is because the gradient of the
objective function at optimality is a linear combination
of the constraint function gradients, with the weights
given by Lagrange multipliers. Not all constraints have
a shadow price and in such cases, the value is 0. This
means that the objective function is constrained by
those constraints with shadow price and not by the
constraints, which have shadow price zero. These
binding constraints and their shadow are then used for
setting efficiency targets for the inefficient units.
Case Example: (Figures are to be considered
representative for discussion purposes only) NMIMS
University School of Business Management (SBM),
Mumbai campus has 10 Divisions in its flagship MBA
program. Amongst the two outputs of performance
measure, the first output is students securing A grade
and the second output is the students securing good
placements. Two inputs were considered, the first
being direct teaching hours and the second being non-
teaching campus hours, which includes group working,
workshops, guest lectures, simulation workshops and
time spent in Bloomberg lab besides other co-
curricular activities. The objective is to identify which
amongst the Divisions is efficient and what should the
inefficient Divisions do more to be as efficient. It can be
seen that we cannot set improvement targets for the
output parameters due to externalities, but the input
control for improving the efficiency of the Divisions is
possible.
The input and output data is provided in table 2.
1 - https://en.wikipedia.org/wiki/Lagrange_multiplier
Division Students with Grade A
Good Placements Teaching Time (Hours per week)
Non-teaching Time (Hours per week)
A
30
25
40
35
B
28
26
38
33
C
27
29
36
37
D
31
20
37
32
E
30
27
35
35
F
32
22
38
33
G
29
28
31
34
H
27
30
32
30
I
26
31
38
32
J 31 28 36 33
Table 2: NMIMS SBM data
Variables
Output Variable – Students with grade A (u ) and good 1
placements (u )2
Input Variables – Teaching hours (v ) and non-teaching 1
hours (v )2
Objective Function Formulation (For Division A)
Max Z = 30 u + 25 u1 2
Subject to
30 u + 25 u – (40 v + 35 v ) ≤ 0 Division A constraint1 2 1 2
28 u + 26 u – (38 v + 33 v ) ≤ 0 Division B constraint1 2 1 2
27 u + 29 u – (36 v + 37 v ) ≤ 0 Division C constraint1 2 1 2
31 u + 20 u – (37 v + 32 v ) ≤ 0 Division D constraint1 2 1 2
30 u + 27 u – (35 v + 35 v ) ≤ 0 Division E constraint1 2 1 2
32 u + 22 u – (38 v + 33 v ) ≤ 0 Division F constraint1 2 1 2
29u + 28u – (31v + 34v ) ≤ 0 Division G constraint1 2 1 2
27u + 30 u – (32v + 30v ) ≤ 0 Division H constraint1 2 1 2
26 u + 31 u – (38 v + 32 v ) ≤ 0 Division I constraint1 2 1 2
31 u + 28 u – (36 v + 33 v ) ≤ 0 Division J constraint1 2 1 2
(40 v + 35 v ) = 1 Division A unique1 2
constraint
u , u , v , v ≥ 0 non-negativity1 2 1 2
constraint
Objective Function Formulation: (For Division B)
Max Z = 28 u + 26 u1 2
Subject to
30 u + 25 u – (40 v + 35 v ) ≤ 0 Division A constraint1 2 1 2
28 u + 26 u – (38 v + 33 v ) ≤ 0 Division B constraint1 2 1 2
27 u + 29 u – (36 v + 37 v ) ≤ 0 Division C constraint1 2 1 2
31 u + 20 u – (37 v + 32 v ) ≤ 0 Division D constraint1 2 1 2
30 u + 27 u – (35 v + 35 v ) ≤ 0 Division E constraint1 2 1 2
32 u + 22 u – (38 v + 33 v ) ≤ 0 Division F constraint1 2 1 2
29 u + 28 u – (31 v + 34 v ) ≤ 0 Division G constraint1 2 1 2
27 u + 30 u – (32 v + 30 v ) ≤ 0 Division H constraint1 2 1 2
26 u + 31 u – (38 v + 32 v ) ≤ 0 Division I constraint1 2 1 2
31 u + 28 u – (36 v + 33 v ) ≤ 0 Division J constraint1 2 1 2
(38 v + 33 v ) = 1 Division B unique1 2
constraint
u , u , v , v ≥ 0 non-negativity1 2 1 2
constraint
ISSN: 0971-1023 | NMIMS Management ReviewVolume XXXVI | Issue 4 | January 2019
Data Envelopment Analysis (DEA) – Application at NMIMS – SBM,a leading AACSB accredited Indian higher education Business School
ISSN: 0971-1023 | NMIMS Management ReviewVolume XXXVI | Issue 4 | January 2019
Data Envelopment Analysis (DEA) – Application at NMIMS – SBM,a leading AACSB accredited Indian higher education Business School
90 91
cities of India, and therefore street
Contents
mall farmers. Majority of the
farmers (82%) borrow less than
Rs 5 lakhs, and 18% borrow
between Rs 5 – 10 lakhs on a
per annum basis. Most farmers
(65.79%) ar
Table source heading
Table 23: The Results of Mann-Whitney U Test for DOWJONES Index Daily Returns
Dr. Rosy KalraMr. Piyuesh Pandey
References
Antecedents to Job Satisfactionin the Airline Industry
1 footnote footnote footnote footnote footnote footnote published earlier in NMIMS
footnote published earlier in NMIMS footnote published earlier in NMIMS footnote
published earlier in NMIMS footnote published earlier in NMIMS footnote

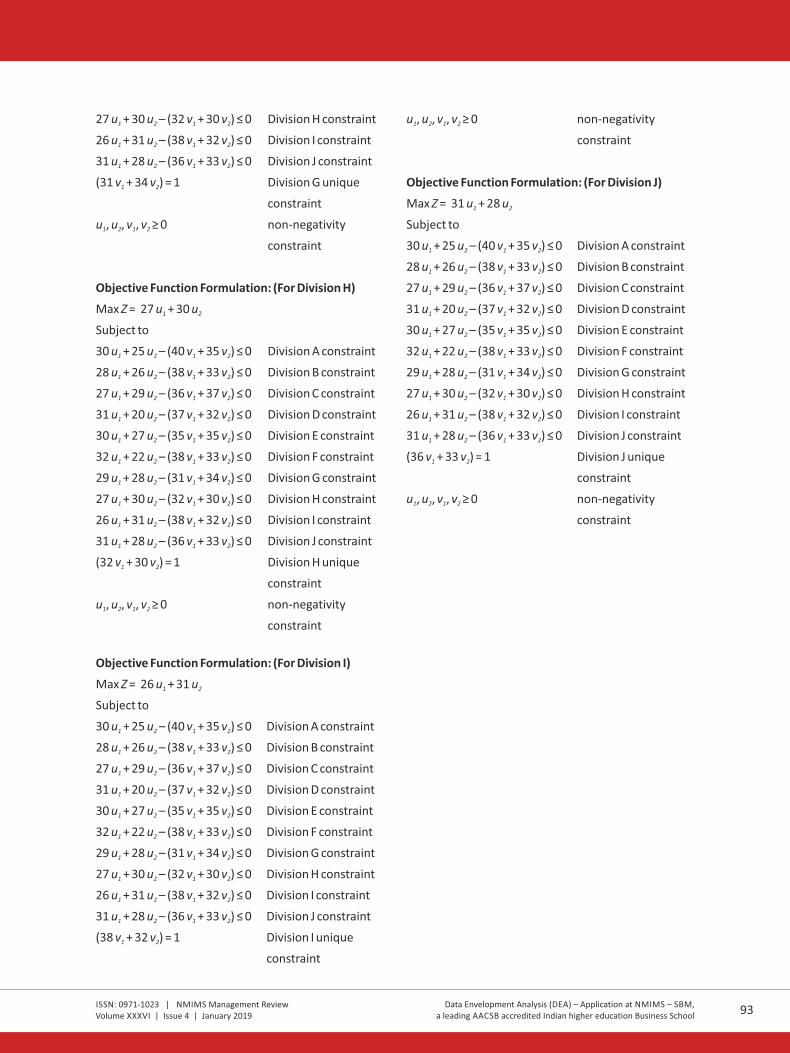
Objective Function Formulation: (For Division C)
Max Z = 27 u + 29 u1 2
Subject to
30 u + 25 u – (40 v + 35 v ) ≤ 0 Division A constraint1 2 1 2
28 u + 26 u – (38 v + 33 v ) ≤ 0 Division B constraint1 2 1 2
27 u + 29 u – (36 v + 37 v ) ≤ 0 Division C constraint1 2 1 2
31 u + 20 u – (37 v + 32 v ) ≤ 0 Division D constraint1 2 1 2
30 u + 27 u – (35 v + 35 v ) ≤ 0 Division E constraint1 2 1 2
32 u + 22 u – (38 v + 33 v ) ≤ 0 Division F constraint1 2 1 2
29 u + 28 u – (31 v + 34 v ) ≤ 0 Division G constraint1 2 1 2
27 u + 30 u – (32 v + 30 v ) ≤ 0 Division H constraint1 2 1 2
26 u + 31 u – (38 v + 32 v ) ≤ 0 Division I constraint1 2 1 2
31 u + 28 u – (36 v + 33 v ) ≤ 0 Division J constraint1 2 1 2
(36 v + 37 v ) = 1 Division C unique1 2
constraint
u , u , v , v ≥ 0 non-negativity1 2 1 2
constraint
Objective Function Formulation: (For Division D)
Max Z = 31 u + 20 u1 2
Subject to
30 u + 25 u – (40 v + 35 v ) ≤ 0 Division A constraint1 2 1 2
28 u + 26 u – (38 v + 33 v ) ≤ 0 Division B constraint1 2 1 2
27 u + 29 u – (36 v + 37 v ) ≤ 0 Division C constraint1 2 1 2
31 u + 20 u – (37 v + 32 v ) ≤ 0 Division D constraint1 2 1 2
30 u + 27 u – (35 v + 35 v ) ≤ 0 Division E constraint1 2 1 2
32 u + 22 u – (38 v + 33 v ) ≤ 0 Division F constraint1 2 1 2
29 u + 28 u – (31 v + 34 v ) ≤ 0 Division G constraint1 2 1 2
27 u + 30 u – (32 v + 30 v ) ≤ 0 Division H constraint1 2 1 2
26 u + 31 u – (38 v + 32 v ) ≤ 0 Division I constraint1 2 1 2
31 u + 28 u – (36 v + 33 v ) ≤ 0 Division J constraint1 2 1 2
(37 v + 32 v ) = 1 Division D unique1 2
constraint
u , u , v , v ≥ 0 non-negativity1 2 1 2
constraint
Objective Function Formulation: (For Division E)
Max Z = 30 u + 27 u1 2
Subject to
30 u + 25 u – (40 v + 35 v ) ≤ 0 Division A constraint1 2 1 2
28 u + 26 u – (38 v + 33 v ) ≤ 0 Division B constraint1 2 1 2
27 u + 29 u – (36 v + 37 v ) ≤ 0 Division C constraint1 2 1 2
31 u + 20 u – (37 v + 32 v ) ≤ 0 Division D constraint1 2 1 2
30 u + 27 u – (35 v + 35 v ) ≤ 0 Division E constraint1 2 1 2
32 u + 22 u – (38 v + 33 v ) ≤ 0 Division F constraint1 2 1 2
29 u + 28 u – (31 v + 34 v ) ≤ 0 Division G constraint1 2 1 2
27 u + 30 u – (32 v + 30 v ) ≤ 0 Division H constraint1 2 1 2
26 u + 31 u – (38 v + 32 v ) ≤ 0 Division I constraint1 2 1 2
31 u + 28 u – (36 v + 33 v ) ≤ 0 Division J constraint1 2 1 2
(35 v + 35 v ) = 1 Division E unique1 2
constraint
u , u , v , v ≥ 0 non-negativity1 2 1 2
constraint
Objective Function Formulation: (For Division F)
Max Z = 32 u + 22 u1 2
Subject to
30 u + 25 u – (40 v + 35 v ) ≤ 0 Division A constraint1 2 1 2
28 u + 26 u – (38 v + 33 v ) ≤ 0 Division B constraint1 2 1 2
27 u + 29 u – (36 v + 37 v ) ≤ 0 Division C constraint1 2 1 2
31 u + 20 u – (37 v + 32 v ) ≤ 0 Division D constraint1 2 1 2
30 u + 27 u – (35 v + 35 v ) ≤ 0 Division E constraint1 2 1 2
32 u + 22 u – (38 v + 33 v ) ≤ 0 Division F constraint1 2 1 2
29 u + 28 u – (31 v + 34 v ) ≤ 0 Division G constraint1 2 1 2
27 u + 30 u – (32 v + 30 v ) ≤ 0 Division H constraint1 2 1 2
26 u + 31 u – (38 v + 32 v ) ≤ 0 Division I constraint1 2 1 2
31 u + 28 u – (36 v + 33 v ) ≤ 0 Division J constraint1 2 1 2
(38 v + 33 v ) = 1 Division F unique1 2
constraint
u , u , v , v ≥ 0 non-negativity1 2 1 2
constraint
Objective Function Formulation: (For Division G)
Max Z = 29 u + 28 u1 2
Subject to
30 u + 25 u – (40 v + 35 v ) ≤ 0 Division A constraint1 2 1 2
28 u + 26 u – (38 v + 33 v ) ≤ 0 Division B constraint1 2 1 2
27 u + 29 u – (36 v + 37 v ) ≤ 0 Division C constraint1 2 1 2
31 u + 20 u – (37 v + 32 v ) ≤ 0 Division D constraint1 2 1 2
30 u + 27 u – (35 v + 35 v ) ≤ 0 Division E constraint1 2 1 2
32 u + 22 u – (38 v + 33 v ) ≤ 0 Division F constraint1 2 1 2
29 u + 28 u – (31 v + 34 v ) ≤ 0 Division G constraint1 2 1 2
Objective Function Formulation: (For Division I)
Max Z = 26 u + 31 u1 2
Subject to
30 u + 25 u – (40 v + 35 v ) ≤ 0 Division A constraint1 2 1 2
28 u + 26 u – (38 v + 33 v ) ≤ 0 Division B constraint1 2 1 2
27 u + 29 u – (36 v + 37 v ) ≤ 0 Division C constraint1 2 1 2
31 u + 20 u – (37 v + 32 v ) ≤ 0 Division D constraint1 2 1 2
30 u + 27 u – (35 v + 35 v ) ≤ 0 Division E constraint1 2 1 2
32 u + 22 u – (38 v + 33 v ) ≤ 0 Division F constraint1 2 1 2
29 u + 28 u – (31 v + 34 v ) ≤ 0 Division G constraint1 2 1 2
27 u + 30 u – (32 v + 30 v ) ≤ 0 Division H constraint1 2 1 2
26 u + 31 u – (38 v + 32 v ) ≤ 0 Division I constraint1 2 1 2
31 u + 28 u – (36 v + 33 v ) ≤ 0 Division J constraint1 2 1 2
(38 v + 32 v ) = 1 Division I unique1 2
constraint
27 u + 30 u – (32 v + 30 v ) ≤ 0 Division H constraint1 2 1 2
26 u + 31 u – (38 v + 32 v ) ≤ 0 Division I constraint1 2 1 2
31 u + 28 u – (36 v + 33 v ) ≤ 0 Division J constraint1 2 1 2
(31 v + 34 v ) = 1 Division G unique1 2
constraint
u , u , v , v ≥ 0 non-negativity1 2 1 2
constraint
Objective Function Formulation: (For Division H)
Max Z = 27 u + 30 u1 2
Subject to
30 u + 25 u – (40 v + 35 v ) ≤ 0 Division A constraint1 2 1 2
28 u + 26 u – (38 v + 33 v ) ≤ 0 Division B constraint1 2 1 2
27 u + 29 u – (36 v + 37 v ) ≤ 0 Division C constraint1 2 1 2
31 u + 20 u – (37 v + 32 v ) ≤ 0 Division D constraint1 2 1 2
30 u + 27 u – (35 v + 35 v ) ≤ 0 Division E constraint1 2 1 2
32 u + 22 u – (38 v + 33 v ) ≤ 0 Division F constraint1 2 1 2
29 u + 28 u – (31 v + 34 v ) ≤ 0 Division G constraint1 2 1 2
27 u + 30 u – (32 v + 30 v ) ≤ 0 Division H constraint1 2 1 2
26 u + 31 u – (38 v + 32 v ) ≤ 0 Division I constraint1 2 1 2
31 u + 28 u – (36 v + 33 v ) ≤ 0 Division J constraint1 2 1 2
(32 v + 30 v ) = 1 Division H unique1 2
constraint
u , u , v , v ≥ 0 non-negativity1 2 1 2
constraint
u , u , v , v ≥ 0 non-negativity1 2 1 2
constraint
Objective Function Formulation: (For Division J)
Max Z = 31 u + 28 u1 2
Subject to
30 u + 25 u – (40 v + 35 v ) ≤ 0 Division A constraint1 2 1 2
28 u + 26 u – (38 v + 33 v ) ≤ 0 Division B constraint1 2 1 2
27 u + 29 u – (36 v + 37 v ) ≤ 0 Division C constraint1 2 1 2
31 u + 20 u – (37 v + 32 v ) ≤ 0 Division D constraint1 2 1 2
30 u + 27 u – (35 v + 35 v ) ≤ 0 Division E constraint1 2 1 2
32 u + 22 u – (38 v + 33 v ) ≤ 0 Division F constraint1 2 1 2
29 u + 28 u – (31 v + 34 v ) ≤ 0 Division G constraint1 2 1 2
27 u + 30 u – (32 v + 30 v ) ≤ 0 Division H constraint1 2 1 2
26 u + 31 u – (38 v + 32 v ) ≤ 0 Division I constraint1 2 1 2
31 u + 28 u – (36 v + 33 v ) ≤ 0 Division J constraint1 2 1 2
(36 v + 33 v ) = 1 Division J unique1 2
constraint
u , u , v , v ≥ 0 non-negativity1 2 1 2
constraint
ISSN: 0971-1023 | NMIMS Management ReviewVolume XXXVI | Issue 4 | January 2019
Data Envelopment Analysis (DEA) – Application at NMIMS – SBM,a leading AACSB accredited Indian higher education Business School
ISSN: 0971-1023 | NMIMS Management ReviewVolume XXXVI | Issue 4 | January 2019
Data Envelopment Analysis (DEA) – Application at NMIMS – SBM,a leading AACSB accredited Indian higher education Business School
92 93
cities of India, and therefore street
Contents
mall farmers. Majority of the
farmers (82%) borrow less than
Rs 5 lakhs, and 18% borrow
between Rs 5 – 10 lakhs on a
per annum basis. Most farmers
(65.79%) ar
Table source heading
Table 23: The Results of Mann-Whitney U Test for DOWJONES Index Daily Returns
Dr. Rosy KalraMr. Piyuesh Pandey
References
Antecedents to Job Satisfactionin the Airline Industry
1 footnote footnote footnote footnote footnote footnote published earlier in NMIMS
footnote published earlier in NMIMS footnote published earlier in NMIMS footnote
published earlier in NMIMS footnote published earlier in NMIMS footnote

The Excel solver solution for Division A is as given in table 3
Division A
u1 u2 v1 v2
30
25
0
0
Changing Cells
0.026435
0.004406
0
0.028571
Efficiency
0.903204
Constraints
Division A
30
25
-40
-35
-0.0968
<= 0
Division B
28
26
-38
-33
-0.08812
<= 0
Division C
27
29
-36
-37
-0.21562
<= 0
Division D
31
20
-37
-32
-0.00668
<= 0
Division E
30
27
-35
-35
-0.08798
<= 0
Division F
32
22
-38
-33
1.98E-13
<= 0
Division G
29
28
-31
-34
-0.08144
<= 0
Division H
27
30
-32
-30
-0.01121
<= 0
Division I
26
31
-38
-32
-0.09039
<= 0
Division J 31 28 -36 -33 7.32E-14 <= 0
40 35 1 = 1
Table3: Excel solver solution for Division A
Division Efficiency
A 0.903
B 0.908
C 0.867
D 0.999
E 0.957
F 1
G 1
H 1
I 0.969
J 1
Table 4: Efficiency summary for each Division
Table 4 gives the efficiency summary for all the Divisions. From this we can observe that Divisions D, F, G, H & J are
highly efficient with their efficiencies being the maximum, i.e. 1, and the other Divisions, namely A, B, C, E &I have
to catch up. Let us next consider Division A for improvements. We cannot as mentioned earlier increase the
output, but can manage the inputs for better efficiency. For this we need the shadow values (prices) in regards to
Division A and the same is as shown in table 5.
Name Shadow Price
Division A Efficiency
0
Division B Efficiency
0
Division C Efficiency
0
Division D Efficiency
0
Division E Efficiency 0
Division F Efficiency 0.303738318
Division G Efficiency
0
Division H Efficiency
0
Division I Efficiency
0 Division J Efficiency 0.654205607
Unique Efficiency 0.903204272
Table 5: Sensitivity Analysis for Division A
The shadow values indicate that Division A can consider the input parameters of Division F in proportion 0.3037&
of Division J in proportion 0.6543 for setting a benchmark. Thus, the teaching hours and non-teaching hours for
Division A would be,
0.3037 x 38 + 0.6542 x 36 = 35.1 hours (presently 40)
0.3037 x 33 + 0.6542 x 33 = 31.62 hours (presently 35)
If we change the input parameters as derived above, we get the efficiency as 0.9997 or approximately 1, which is
shown in table 6.
Division A
u1 u2 v1 v2
30
25
0
0
Changing Cells
0.033173 0.000184
0.016034
0.013826
Efficiency
0.999787
Constraints
Division A
30
25
-35.1
-31.62
-0.00021
<= 0
Division B
28
26
-38
-33
-0.13196
<= 0
Division C
27
29
-36
-37
-0.18781
<= 0
Division D
31
20
-37
-32
-0.00368
<= 0
Division E
30
27
-35
-35
-0.04498
<= 0
Division F
32
22
-38
-33
9.45E-14
<= 0
Division G
29
28
-31
-34
2.49E-13
<= 0
Division H
27
30
-32
-30
-0.02671
<= 0
Division I
26
31
-38
-32
-0.18355
<= 0
Division J 31 28 -36 -33 1.6E-13 <= 0
Unique 35.1 31.62 1 = 1
Table 6: Revised Efficiency for Division A using benchmark input targets
ISSN: 0971-1023 | NMIMS Management ReviewVolume XXXVI | Issue 4 | January 2019
Data Envelopment Analysis (DEA) – Application at NMIMS – SBM,a leading AACSB accredited Indian higher education Business School
ISSN: 0971-1023 | NMIMS Management ReviewVolume XXXVI | Issue 4 | January 2019
Data Envelopment Analysis (DEA) – Application at NMIMS – SBM,a leading AACSB accredited Indian higher education Business School
94 95
cities of India, and therefore street
Contents
mall farmers. Majority of the
farmers (82%) borrow less than
Rs 5 lakhs, and 18% borrow
between Rs 5 – 10 lakhs on a
per annum basis. Most farmers
(65.79%) ar
Table source heading
Table 23: The Results of Mann-Whitney U Test for DOWJONES Index Daily Returns
Dr. Rosy KalraMr. Piyuesh Pandey
References
Antecedents to Job Satisfactionin the Airline Industry
1 footnote footnote footnote footnote footnote footnote published earlier in NMIMS
footnote published earlier in NMIMS footnote published earlier in NMIMS footnote
published earlier in NMIMS footnote published earlier in NMIMS footnote
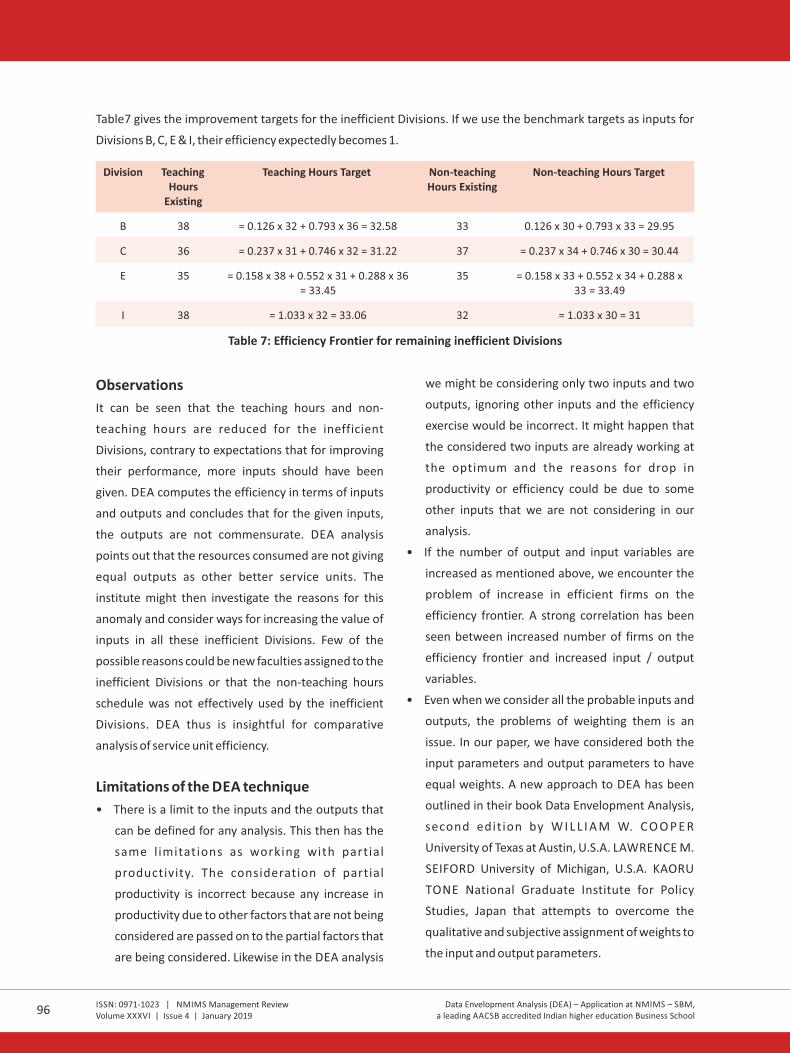
Table7 gives the improvement targets for the inefficient Divisions. If we use the benchmark targets as inputs for
Divisions B, C, E & I, their efficiency expectedly becomes 1.
Division Teaching Hours
Existing
Teaching Hours Target Non-teaching Hours Existing
Non-teaching Hours Target
B
38
= 0.126 x 32 + 0.793 x 36 = 32.58
33
0.126 x 30 + 0.793 x 33 = 29.95
C
36
= 0.237 x 31 + 0.746 x 32 = 31.22
37
= 0.237 x 34 + 0.746 x 30 = 30.44
E
35
= 0.158 x 38 + 0.552 x 31 + 0.288 x 36 = 33.45
35
= 0.158 x 33 + 0.552 x 34 + 0.288 x 33 = 33.49
I 38 = 1.033 x 32 = 33.06 32 = 1.033 x 30 = 31
Table 7: Efficiency Frontier for remaining inefficient Divisions
Observations
It can be seen that the teaching hours and non-
teaching hours are reduced for the inefficient
Divisions, contrary to expectations that for improving
their performance, more inputs should have been
given. DEA computes the efficiency in terms of inputs
and outputs and concludes that for the given inputs,
the outputs are not commensurate. DEA analysis
points out that the resources consumed are not giving
equal outputs as other better service units. The
institute might then investigate the reasons for this
anomaly and consider ways for increasing the value of
inputs in all these inefficient Divisions. Few of the
possible reasons could be new faculties assigned to the
inefficient Divisions or that the non-teaching hours
schedule was not effectively used by the inefficient
Divisions. DEA thus is insightful for comparative
analysis of service unit efficiency.
Limitations of the DEA technique
• There is a limit to the inputs and the outputs that
can be defined for any analysis. This then has the
same l imitations as working with partial
productivity. The consideration of partial
productivity is incorrect because any increase in
productivity due to other factors that are not being
considered are passed on to the partial factors that
are being considered. Likewise in the DEA analysis
we might be considering only two inputs and two
outputs, ignoring other inputs and the efficiency
exercise would be incorrect. It might happen that
the considered two inputs are already working at
the optimum and the reasons for drop in
productivity or efficiency could be due to some
other inputs that we are not considering in our
analysis.
• If the number of output and input variables are
increased as mentioned above, we encounter the
problem of increase in efficient firms on the
efficiency frontier. A strong correlation has been
seen between increased number of firms on the
efficiency frontier and increased input / output
variables.
• Even when we consider all the probable inputs and
outputs, the problems of weighting them is an
issue. In our paper, we have considered both the
input parameters and output parameters to have
equal weights. A new approach to DEA has been
outlined in their book Data Envelopment Analysis,
second edit ion by W I L L I A M W. C O O P E R
University of Texas at Austin, U.S.A. LAWRENCE M.
SEIFORD University of Michigan, U.S.A. KAORU
TONE National Graduate Institute for Policy
Studies, Japan that attempts to overcome the
qualitative and subjective assignment of weights to
the input and output parameters.
• DEA analysis ignores the effect of exogenous
variables in the analysis and any efficiency increase
of a service unit is attr ibuted to better
management of their inputs. The ambitious smart
cities project of the Government of India is bound
to increase the efficiencies of service outlets
operating in such smart cities while the service
centres in non-smart cities will have an unfair
disadvantage. The effects of such exogenous
factors cannot be factored in the DEA analysis.
• The DEA analysis identifies the inefficient service
c e n t r e a n d a l s o s e t s a b e n c h m a r k fo r
improvement. However, it fails to address the issue
of how to improve the existing services or what was
lacking in these service centres to result in
inefficiency. In the NMIMS SBM case, inefficient
divisions A, B, C, E & J were identified, but the DEA
analysis cannot indicate the factors for the
deficiency in teaching and non-teaching hours and
neither does it show the path to improvement. At
best, it stops by identifying the inefficient divisions.
In our opinion, rather than spending too much
effort to identify the best DEA technique, it would
be advisable to use the basic DEA technique and
spend time and effort in identifying the root cause
or solutions to improve the efficiency of the
inefficient service centres.
• DEA analysis can best be a complement to the
other analysis of efficiency in the service industry
in general and the education sector in particular.
An output measured by the students' scores in
exams and their placements may also be
dependent on other factors like their graduation,
personality, verbal and non-verbal communication
skills other than just the teaching and non-teaching
inputs provided at NMIMS.
• As a standard formulation for DEA creates a
separate linear programming problem for each
s e r v i c e c e n t re , l a rg e p ro b l e m s c a n b e
computationally difficult. In our NMIMS SBM
problem we required 10 formulations, with one for
each Division. Imagine a modern generation bank
with 100 branches in the city of Mumbai wanting to
identify the efficient and inefficient branches. This
will require 100 formulations with each problem
having 101 constraints.
Limitations of the DEA techniques in the
Indian context
• That a theoretical efficient unit for benchmarking is
not feasible given the nature of services is well
known. It is also equally necessary to know that a
fast changing and evolving services sector further
complicates the definition of an efficient unit. The
“services” sector is in a relative infancy stage in
India and is fast evolving. When compared with the
mature services sector in developed countries like
the USA, the stark contrast in India is very clear
(Figure8a and 8b).
Figure 8a: Services in India
Figure 8b: Services in USA
70
60
50
40
30
20
10
0
1950 1960 1970 1980 1990 2000 2010
Services
Industry
Agriculture
59
27
14
Sector Contribution to GDP (%)
140
120
100
80
60
40
20
01965 1970 1975 1980 1985 1990 1995 2000 2005 2010 2015
Mill
ion
s o
f P
ers
on
s Em
plo
yed
Manufacturing Service-providing
ISSN: 0971-1023 | NMIMS Management ReviewVolume XXXVI | Issue 4 | January 2019
Data Envelopment Analysis (DEA) – Application at NMIMS – SBM,a leading AACSB accredited Indian higher education Business School
ISSN: 0971-1023 | NMIMS Management ReviewVolume XXXVI | Issue 4 | January 2019
Data Envelopment Analysis (DEA) – Application at NMIMS – SBM,a leading AACSB accredited Indian higher education Business School
96 97
cities of India, and therefore street
Contents
mall farmers. Majority of the
farmers (82%) borrow less than
Rs 5 lakhs, and 18% borrow
between Rs 5 – 10 lakhs on a
per annum basis. Most farmers
(65.79%) ar
Table source heading
Table 23: The Results of Mann-Whitney U Test for DOWJONES Index Daily Returns
Dr. Rosy KalraMr. Piyuesh Pandey
References
Antecedents to Job Satisfactionin the Airline Industry
1 footnote footnote footnote footnote footnote footnote published earlier in NMIMS
footnote published earlier in NMIMS footnote published earlier in NMIMS footnote
published earlier in NMIMS footnote published earlier in NMIMS footnote

• India is geographically very large with area being
approximately 3,287,263 sq km. This expanse
brings with it many diverse cultures and practices.
To measure the efficiency parameters for such vast
exogenous divergences is a mammoth challenge.
For example, in the NMIMS SBM case discussed
here, if the comparisons are made with divisions of
other NMIMS centres like the Hyderabad campus
or the Indore campus or the Bangalore campus, the
analysis could be redundant. Neither can we
compare the NMIMS SBM Mumbai campus
performance data with performance data of other
institutes within Mumbai. This then puts a question
mark on the practical application of the DEA
analysis in the Indian context.
• DEA analysis for services efficiency besides being a
relative measure requires the data to be current
and relies heavily on the cross-sectional data.
Temporal data can make the analysis in fructuous.
• Data reliability or the lack of it can adversely impact
the correctness of the DEA analysis. Data in the
Indian context is generally not very reliable in terms
of being current and error free. The ex-Reserve
Bank of India governor, Dr. Subba Rao had
mentioned 5 major problems of the economic
statistic systems in India, they being more data
revisions, inflation measurement practices, limited
information on key indicators for business cycles,
limited financial soundness indicators and data on
employment.
• DEA analysis requires the data to be homogenous
and this could be a major limitation in the Indian
context. Finding homogeneity in a heterogeneous
business limits the space of operations to a very
limited area and also subjects it to wide variations
in its applications. Nevertheless the DEA approach
with refinements could be the only approach for
services efficiency benchmarking.
• Another weakness of the DEA approach to service
efficiency is that the results tend to be sensitive to
the selection of appropriate inputs and outputs. In
our case, we have only focused on the materialistic
outputs whereas the learning or the long term
developments of the students are not considered,
in the absence of metrics to measure these
qualitative aspects. It can well mean that if some of
the additional qualitative outputs were considered,
the analysis and efficiency frontier could have been
different. In a developing economy like India,
getting all the important and relevant input and
output data for a service centre could be difficult,
thus weakening the efficiency frontier calculations
using DEA.
• One of the generic disadvantages of the DEA
method is that it does not indicate the best
specification for efficiency and would keep on
changing the efficiency frontier along with changes
in data. This in a fast changing and expanding
businesses country like India could seriously impact
the efficacy of the process. A cross-efficiency
approach developed by Saxton in 1985, giving
factor weightages to the various inputs and outputs
may be considered for further analysis for services
in India.
Conclusions:
The services sector is not only the dominant sector in
India's GDP, but has also attracted significant foreign
investment flows, contributing significantly to exports
and employment. The services sector in India
comprises activities like trade, hotel and restaurants,
transport, storage, retail, communications, financing,
insurance, real estate advisory, social and personal
services besides many more. With growth comes
competition and with competition comes the need for
efficiency. Sooner or later the quest will be for highly
efficient working in all these areas. Given the inherent
nature of services, an absolute benchmark is not
possible and we are required to develop relative
benchmarks. Data Envelopment Analysis provides the
required framework to identify and enhance the
efficiency of services. Although the DEA analysis is not
entirely perfect, its imperfections can be overruled for
the sake of improving the efficiency of services. With
an example of a B school, the application of the DEA
analysis is demonstrated in this paper. If the data is
accurate, current and homogenous, the DEA analysis
could provide an opportunity for efficient working.
Managerial Implications:
DEA is a benchmarking technique and the efficiency
scores provide information about a firm's capacity to
improve output or input and thus DEA offers strong
support in decision making. In case of services in India,
the outputs and inputs are not well defined as the
services are growing at a very fast pace. The success of
the process of Benchmarking with DEA depends on
the availability of the correct and relevant data. The
accuracy of the data is also important from the
perspective that in a service setup, it is at times
acceptable to be inefficient, which may be termed as a
“special” case. Factually the service centres can each
claim to be different than the others as some may
possess a specificity which others do not. However,
since it is likely that the difference in specificity of one
output or input is compensated by the other outputs
or inputs, any such claim can be disregarded. The
efficiency figures obtained by solving the formulations
should at best be considered as an order of magnitude.
What we are saying is that in case a service centre
obtains an efficiency of 85 percent, it does not mean
that it has a capacity to improve 15 percent on all
counts. Thus this number should be more of an
objective for improvement rather than being strictly
implemented, as often this may not be entirely
feasible. It is not always necessary that efficiency is the
only measure of a service outlet's performance.
Effectiveness or Equity or market share may also be
considered as criteria for overall performance. A last
point that needs to be noted is that the gap between
the efficient frontier and the inefficient service units
should be realistic. If the gap is too wide (say an
inefficient firm is at 45 percent efficiency) then this
may not be because of something drastically wrong
with the inefficient firm. It could well be because the
problem parameters were not defined correctly.
Applicability and Generalizability:
• Data Envelopment Analysis (DEA) is the most
commonly used approach for evaluating service
centre efficiency but a long-standing concern is that
DEA assumes that data are measured without
error. This is quite unlikely, and DEA and other
efficiency analysis techniques may yield biased
efficiency estimates if the data is not without error.
• Another factor that needs to be considered is that
the data needs to be dynamic, real and current. In
the NMIMS SBM case, the analysis did identify the
inefficient divisions and management could review
the reasons behind the inefficiency. However, the
corrections, if any, can only be carried out in the
next academic year for the next batch of students.
There is no method by which those students from
the inefficient divisions can be coached to better
their performance on the output parameters. The
lack of real time improvement measures is the
limitation of this analysis, which a researcher
should be aware about. As such, the DEA analysis
technique cannot be a prescriptive tool whereas in
present times, prescriptive data analytics is the
need of the hour.
• DEA analysis is more about the input variables and
less about the output variables. It is so because the
internal factors like inputs can be within the realm
of the service centre, but the outputs are external
to them. Any macro factor affecting the output
variable can skew the input efficiency analysis.
• Although DEA analysis uses quantitative data, the
result interpretation is more subjective and
qualitative. As a result, the post DEA analysis can
lose its efficacy. Just identifying the inefficient
service centres without identifying the reasons for
the inefficiency does not help in the improvement
process.
ISSN: 0971-1023 | NMIMS Management ReviewVolume XXXVI | Issue 4 | January 2019
Data Envelopment Analysis (DEA) – Application at NMIMS – SBM,a leading AACSB accredited Indian higher education Business School
ISSN: 0971-1023 | NMIMS Management ReviewVolume XXXVI | Issue 4 | January 2019
Data Envelopment Analysis (DEA) – Application at NMIMS – SBM,a leading AACSB accredited Indian higher education Business School
98 99
cities of India, and therefore street
Contents
mall farmers. Majority of the
farmers (82%) borrow less than
Rs 5 lakhs, and 18% borrow
between Rs 5 – 10 lakhs on a
per annum basis. Most farmers
(65.79%) ar
Table source heading
Table 23: The Results of Mann-Whitney U Test for DOWJONES Index Daily Returns
Dr. Rosy KalraMr. Piyuesh Pandey
References
Antecedents to Job Satisfactionin the Airline Industry
1 footnote footnote footnote footnote footnote footnote published earlier in NMIMS
footnote published earlier in NMIMS footnote published earlier in NMIMS footnote
published earlier in NMIMS footnote published earlier in NMIMS footnote
References
• Abbott, M., & Doucouliagos, C. (2003). The efficiency of Australian universities: A data envelopment analysis.
Economics of Education Review,22(1), 89-97. doi:10.1016/s0272-7757(01)00068-1
• Amindoust, A., Shamsuddin, A., & Saghafinia, A. (2014). Learning Improvement of DEA Technique in Decision
Making for Manufacturing Applications Using DEA Excel-Solver. Advanced Materials Research,903, 425-430.
doi:10.4028/www.scientific.net/amr.903.425
• Annals of operations research. (2009). Basel: Baltzer.
• British Council 2014 report, Understanding India – The future of higher education and opportunities for
International cooperation”.
• Bakshi Arup Kumar, Parida Bivraj Bhushan, (2013), Measuring moderating effects of service recovery and CRM
on consumer trust, repatronization and advocacy with distribution variation of the same across recovery zone-
of-tolerance.
• Charnes, A., Cooper, W. and Rhodes, E. (2018). Measuring the efficiency of decision making units. [online]
Econpapers.repec.org. Available at: https://econpapers.repec.org/RePEc:eee:ejores:v:2:y:1978:i:6:p:429-
444 [Accessed 14 Dec. 2018].
• Chopra Dr (Mrs) Rita, Chawla Mamta, Sharma Dr. Tejinder, (2014), Service Quality in Higher Education: A
Comparative Study of Management and Education Institutions.
• Cook, W. D. (2016). Data envelopment analysis. Place of publication not identified: Springer-Verlag New York.
• Cooper, W. W., Seiford, L. M., & Zhu, J. (2004). Handbook on data envelopment analysis. Boston, MA: Kluwer
Academic.
• Data Envelopment Analysis. (n.d.). Modeling Performance Measurement,1-27. doi:10.1007/0-387-24138-8_1
• Debnath, R. M., & Shankar, R. (2008). Measuring performance of Indian banks: An application Data
Envelopment Analysis. International Journal of Business Performance Management,10(1), 57.
doi:10.1504/ijbpm.2008.015921
• Doyle, J. and Green, R. (2018). .Efficiency and Cross-efficiency in DEA: Derivations, Meanings and Uses
• Dyson, R. G., & Shale, E. A. (2010). Data envelopment analysis, operational research and uncertainty. Journal of
the Operational Research Society,61(1), 25-34. doi:10.1057/jors.2009.145
• Gandhi, A., & Shankar, R. (2014). Efficiency measurement of Indian retailers using Data Envelopment Analysis.
International Journal of Retail & Distribution Management,42(6), 500-520. doi:10.1108/ijrdm-10-2012-0094.
• Gajewski, B. J., Lee, R., & Dunton, N. (2012). :Data Envelopment Analysis in the Presence of Measurement Error
• Gordhan K. Saini, S. K. Pandey, Archana Singh, Gurumurthy Kalyanaram, Role of Empathy and Customer
Orientation in Job Satisfaction and Organizational Commitment Indian Stock Markets.
• Kaur Reena (Ramneek), Sharma Tejinder, Faculty Perspectives of Internal Marketing Practices – An Exploratory
Study in B-Schools of Punjab.
• Kaur, S., & Gupta, P. (2015). Productive Efficiency Mapping of the Indian Banking System Using Data
Envelopment Analysis. Procedia Economics and Finance,25, 227-238. doi:10.1016/s2212-5671(15)00733-9
• Sexton, T., Silkman, R. and Hogan, A. (2018). .Data envelopment analysis: Critique and extensions
• Sinha Kunjal, Dwivedi Stuti, An Empirical Study on Employees' Perception towards Learning and Development:
A Self-Learning Perspective.
• Shreshtha Mani, Dugar Anurag, Customers' Preference Towards Functional Benefits Versus Experiential
Benefits from Bank Brands.
• Lee, Y. J., Joo, S., & Park, H. G. (2017). An application of data envelopment analysis for Korean banks with
negative data. Benchmarking: An International Journal,24(4), 1052-1064. doi:10.1108/bij-02-2016-0023.
• Montoneri, B. (2014). Teaching Improvement Model Designed with DEA Method and Management Matrix.
IAFOR Journal of Education,2(1). doi:10.22492/ije.2.1.05
• Rosenmayer, T. (2014). Using Data Envelopment Analysis: A Case of Universities. Review of Economic
Perspectives,14(1), 34-54. doi:10.2478/revecp-2014-0003.
• Service Management, Mcgraw Hill, Fitzsimmons James A, Fitzsimmons Mona J.
• Sherman, H., & Gold, F. (1985). Bank branch operating efficiency. Journal of Banking & Finance,9(2), 297-315.
doi:10.1016/0378-4266(85)90025-1.
• Teter, W. (2014). Exploring Future Student Recruitment in India. Global Opportunities and Challenges for
Higher Education Leaders,173-177. doi:10.1007/978-94-6209-863-3_39.
• Thanassoulis, E., Boussofiane, A., & Dyson, R. (1996). A comparison of data envelopment analysis and ratio
analysis as tools for performance assessment. Omega,24(3), 229-244. doi:10.1016/0305-0483(95)00060-7.
• Wong, Y. B., & Beasley, J. E. (1990). Restricting Weight Flexibility in Data Envelopment Analysis. The Journal of
the Operational Research Society,41(9), 829. doi:10.2307/2583498.
• Zarinkamar, R. T., & Alam-Tabriz, A. (2014). Bank branch operating efficiency: Evaluation with data
envelopment analysis. Management Science Letters,2307-2312. doi:10.5267/j.msl.2014.9.004.
https://en.wikipedia.org/wiki/Economy_of_India
http://www.informit.com/articles/article.aspx?p=2095734&seqNum=3
https://mostlyeconomics.wordpress.com/2009/07/06/limitations-in-indian-economics-statistics-system/
https://journals.openedition.org/viatourism/1005
Pradeep Pai received the Bachelor's degree in Production Engineering and Master's degree in Management
from University of Mumbai in the year 1989 and 1991, respectively. After having worked in Industry and as a
visiting faculty teaching Decision Sciences related subjects for over 22 years, he is now working as a full time
Associate Professor in Narsee Monjee Institute of Management Studies and Research, School of Business
Management. He is currently pursuing his PhD in Business Administration from Faculty of Management
Studies, Aligarh Muslim University under the guidance of Dr. Bilal M Khan and Dr. P N Mukherjee. He can be
reached at [email protected]
Bilal Mustafa Khan is a Professor in the Department of Business Administration, Aligarh Muslim University. He
was the Head of Department of Management Studies at Manipal University, Dubai Campus, UAE. He has an
Engineering background with an M.B.A and a Doctorate in the areas of Marketing Management. He has more
than 20 years of experience in teaching research. He has numerous publications to his credit both in national as
well as international journals such as International Journal of Business Transformation, International Journal
of Business and Entrepreneurship, Asia Pacific Journal of Business Administration (Emerald), Journal of Global
Business Advancement amongst many. He has travelled to Europe, Africa and Middle East for academic and
other activities. His research interests are Luxury Fashion Brands and Structural Equation Modelling.
P. N. Mukherjee is senior Professor and Director at SVKM's NMIMS, Navi Mumbai campus. He has over 21
years of academic experience and is a Ph.D. guide for Mumbai University, SNDT Women's University, NMIMS
University, BITS, Meshra, Swami Vivekananda Technical University, Chhattisgarh and is presently guiding 9
Ph.D. students. He has been an academic council member of NMIMS and other prestigious Universities in
India. His expertise covers Decision area subjects like Operation Management, Productivity Techniques, Supply
Chain Management, Total Quality Management, Technology Management, Six Sigma, Logistics
Management, Enterprise Resource Planning, Customer Relationship Management, World Class Management
System, Bench Marking and Business Process Reengineering.
ISSN: 0971-1023 | NMIMS Management ReviewVolume XXXVI | Issue 4 | January 2019
Data Envelopment Analysis (DEA) – Application at NMIMS – SBM,a leading AACSB accredited Indian higher education Business School
ISSN: 0971-1023 | NMIMS Management ReviewVolume XXXVI | Issue 4 | January 2019
Data Envelopment Analysis (DEA) – Application at NMIMS – SBM,a leading AACSB accredited Indian higher education Business School
100 101
cities of India, and therefore street
Contents
mall farmers. Majority of the
farmers (82%) borrow less than
Rs 5 lakhs, and 18% borrow
between Rs 5 – 10 lakhs on a
per annum basis. Most farmers
(65.79%) ar
Table source heading
Table 23: The Results of Mann-Whitney U Test for DOWJONES Index Daily Returns
Dr. Rosy KalraMr. Piyuesh Pandey
References
Antecedents to Job Satisfactionin the Airline Industry
1 footnote footnote footnote footnote footnote footnote published earlier in NMIMS
footnote published earlier in NMIMS footnote published earlier in NMIMS footnote
published earlier in NMIMS footnote published earlier in NMIMS footnote

References
• Abbott, M., & Doucouliagos, C. (2003). The efficiency of Australian universities: A data envelopment analysis.
Economics of Education Review,22(1), 89-97. doi:10.1016/s0272-7757(01)00068-1
• Amindoust, A., Shamsuddin, A., & Saghafinia, A. (2014). Learning Improvement of DEA Technique in Decision
Making for Manufacturing Applications Using DEA Excel-Solver. Advanced Materials Research,903, 425-430.
doi:10.4028/www.scientific.net/amr.903.425
• Annals of operations research. (2009). Basel: Baltzer.
• British Council 2014 report, Understanding India – The future of higher education and opportunities for
International cooperation”.
• Bakshi Arup Kumar, Parida Bivraj Bhushan, (2013), Measuring moderating effects of service recovery and CRM
on consumer trust, repatronization and advocacy with distribution variation of the same across recovery zone-
of-tolerance.
• Charnes, A., Cooper, W. and Rhodes, E. (2018). Measuring the efficiency of decision making units. [online]
Econpapers.repec.org. Available at: https://econpapers.repec.org/RePEc:eee:ejores:v:2:y:1978:i:6:p:429-
444 [Accessed 14 Dec. 2018].
• Chopra Dr (Mrs) Rita, Chawla Mamta, Sharma Dr. Tejinder, (2014), Service Quality in Higher Education: A
Comparative Study of Management and Education Institutions.
• Cook, W. D. (2016). Data envelopment analysis. Place of publication not identified: Springer-Verlag New York.
• Cooper, W. W., Seiford, L. M., & Zhu, J. (2004). Handbook on data envelopment analysis. Boston, MA: Kluwer
Academic.
• Data Envelopment Analysis. (n.d.). Modeling Performance Measurement,1-27. doi:10.1007/0-387-24138-8_1
• Debnath, R. M., & Shankar, R. (2008). Measuring performance of Indian banks: An application Data
Envelopment Analysis. International Journal of Business Performance Management,10(1), 57.
doi:10.1504/ijbpm.2008.015921
• Doyle, J. and Green, R. (2018). .Efficiency and Cross-efficiency in DEA: Derivations, Meanings and Uses
• Dyson, R. G., & Shale, E. A. (2010). Data envelopment analysis, operational research and uncertainty. Journal of
the Operational Research Society,61(1), 25-34. doi:10.1057/jors.2009.145
• Gandhi, A., & Shankar, R. (2014). Efficiency measurement of Indian retailers using Data Envelopment Analysis.
International Journal of Retail & Distribution Management,42(6), 500-520. doi:10.1108/ijrdm-10-2012-0094.
• Gajewski, B. J., Lee, R., & Dunton, N. (2012). :Data Envelopment Analysis in the Presence of Measurement Error
• Gordhan K. Saini, S. K. Pandey, Archana Singh, Gurumurthy Kalyanaram, Role of Empathy and Customer
Orientation in Job Satisfaction and Organizational Commitment Indian Stock Markets.
• Kaur Reena (Ramneek), Sharma Tejinder, Faculty Perspectives of Internal Marketing Practices – An Exploratory
Study in B-Schools of Punjab.
• Kaur, S., & Gupta, P. (2015). Productive Efficiency Mapping of the Indian Banking System Using Data
Envelopment Analysis. Procedia Economics and Finance,25, 227-238. doi:10.1016/s2212-5671(15)00733-9
• Sexton, T., Silkman, R. and Hogan, A. (2018). .Data envelopment analysis: Critique and extensions
• Sinha Kunjal, Dwivedi Stuti, An Empirical Study on Employees' Perception towards Learning and Development:
A Self-Learning Perspective.
• Shreshtha Mani, Dugar Anurag, Customers' Preference Towards Functional Benefits Versus Experiential
Benefits from Bank Brands.
• Lee, Y. J., Joo, S., & Park, H. G. (2017). An application of data envelopment analysis for Korean banks with
negative data. Benchmarking: An International Journal,24(4), 1052-1064. doi:10.1108/bij-02-2016-0023.
• Montoneri, B. (2014). Teaching Improvement Model Designed with DEA Method and Management Matrix.
IAFOR Journal of Education,2(1). doi:10.22492/ije.2.1.05
• Rosenmayer, T. (2014). Using Data Envelopment Analysis: A Case of Universities. Review of Economic
Perspectives,14(1), 34-54. doi:10.2478/revecp-2014-0003.
• Service Management, Mcgraw Hill, Fitzsimmons James A, Fitzsimmons Mona J.
• Sherman, H., & Gold, F. (1985). Bank branch operating efficiency. Journal of Banking & Finance,9(2), 297-315.
doi:10.1016/0378-4266(85)90025-1.
• Teter, W. (2014). Exploring Future Student Recruitment in India. Global Opportunities and Challenges for
Higher Education Leaders,173-177. doi:10.1007/978-94-6209-863-3_39.
• Thanassoulis, E., Boussofiane, A., & Dyson, R. (1996). A comparison of data envelopment analysis and ratio
analysis as tools for performance assessment. Omega,24(3), 229-244. doi:10.1016/0305-0483(95)00060-7.
• Wong, Y. B., & Beasley, J. E. (1990). Restricting Weight Flexibility in Data Envelopment Analysis. The Journal of
the Operational Research Society,41(9), 829. doi:10.2307/2583498.
• Zarinkamar, R. T., & Alam-Tabriz, A. (2014). Bank branch operating efficiency: Evaluation with data
envelopment analysis. Management Science Letters,2307-2312. doi:10.5267/j.msl.2014.9.004.
https://en.wikipedia.org/wiki/Economy_of_India
http://www.informit.com/articles/article.aspx?p=2095734&seqNum=3
https://mostlyeconomics.wordpress.com/2009/07/06/limitations-in-indian-economics-statistics-system/
https://journals.openedition.org/viatourism/1005
Pradeep Pai received the Bachelor's degree in Production Engineering and Master's degree in Management
from University of Mumbai in the year 1989 and 1991, respectively. After having worked in Industry and as a
visiting faculty teaching Decision Sciences related subjects for over 22 years, he is now working as a full time
Associate Professor in Narsee Monjee Institute of Management Studies and Research, School of Business
Management. He is currently pursuing his PhD in Business Administration from Faculty of Management
Studies, Aligarh Muslim University under the guidance of Dr. Bilal M Khan and Dr. P N Mukherjee. He can be
reached at [email protected]
Bilal Mustafa Khan is a Professor in the Department of Business Administration, Aligarh Muslim University. He
was the Head of Department of Management Studies at Manipal University, Dubai Campus, UAE. He has an
Engineering background with an M.B.A and a Doctorate in the areas of Marketing Management. He has more
than 20 years of experience in teaching research. He has numerous publications to his credit both in national as
well as international journals such as International Journal of Business Transformation, International Journal
of Business and Entrepreneurship, Asia Pacific Journal of Business Administration (Emerald), Journal of Global
Business Advancement amongst many. He has travelled to Europe, Africa and Middle East for academic and
other activities. His research interests are Luxury Fashion Brands and Structural Equation Modelling.
P. N. Mukherjee is senior Professor and Director at SVKM's NMIMS, Navi Mumbai campus. He has over 21
years of academic experience and is a Ph.D. guide for Mumbai University, SNDT Women's University, NMIMS
University, BITS, Meshra, Swami Vivekananda Technical University, Chhattisgarh and is presently guiding 9
Ph.D. students. He has been an academic council member of NMIMS and other prestigious Universities in
India. His expertise covers Decision area subjects like Operation Management, Productivity Techniques, Supply
Chain Management, Total Quality Management, Technology Management, Six Sigma, Logistics
Management, Enterprise Resource Planning, Customer Relationship Management, World Class Management
System, Bench Marking and Business Process Reengineering.
ISSN: 0971-1023 | NMIMS Management ReviewVolume XXXVI | Issue 4 | January 2019
Data Envelopment Analysis (DEA) – Application at NMIMS – SBM,a leading AACSB accredited Indian higher education Business School
ISSN: 0971-1023 | NMIMS Management ReviewVolume XXXVI | Issue 4 | January 2019
Data Envelopment Analysis (DEA) – Application at NMIMS – SBM,a leading AACSB accredited Indian higher education Business School
100 101
cities of India, and therefore street
Contents
mall farmers. Majority of the
farmers (82%) borrow less than
Rs 5 lakhs, and 18% borrow
between Rs 5 – 10 lakhs on a
per annum basis. Most farmers
(65.79%) ar
Table source heading
Table 23: The Results of Mann-Whitney U Test for DOWJONES Index Daily Returns
Dr. Rosy KalraMr. Piyuesh Pandey
References
Antecedents to Job Satisfactionin the Airline Industry
1 footnote footnote footnote footnote footnote footnote published earlier in NMIMS
footnote published earlier in NMIMS footnote published earlier in NMIMS footnote
published earlier in NMIMS footnote published earlier in NMIMS footnote