Embed Size (px)
Citation preview
Data-driven urban planning & design
ULI Leadership Convivium
Singapore12th November 2019
Tim StonorArchitect | Urban Planner
@Tim_StonorData-driven urban planning & design Space Syntax © 2019
@Tim_StonorData-driven urban planning & design Space Syntax © 2019
@Tim_StonorData-driven urban planning & design Space Syntax © 2019
@Tim_StonorData-driven urban planning & design Space Syntax © 2019

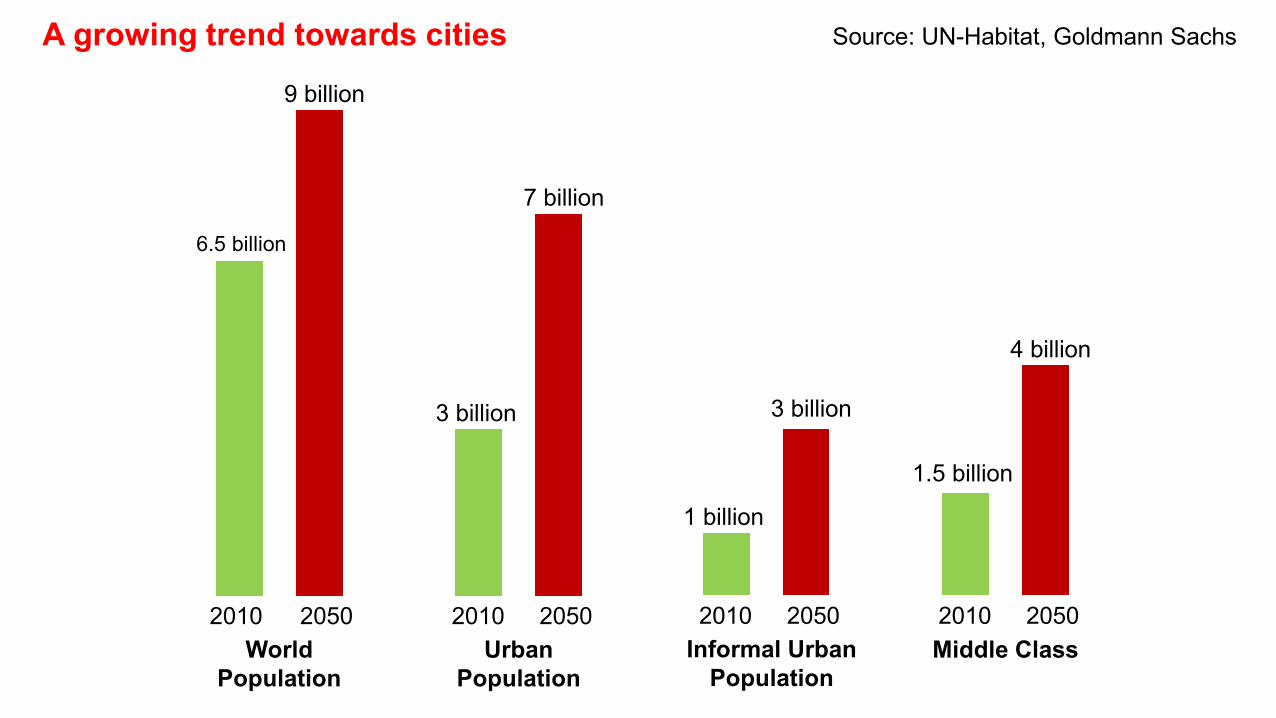
6.5 billion
9 billion
2010 2050World
Population
3 billion
7 billion
2010 2050Urban
Population
1 billion
3 billion
2010 2050
1.5 billion
2010 2050Middle Class
4 billion
Informal Urban Population
Source: UN-Habitat, Goldmann SachsA growing trend towards cities
@Tim_StonorData-driven urban planning & design Space Syntax © 2019
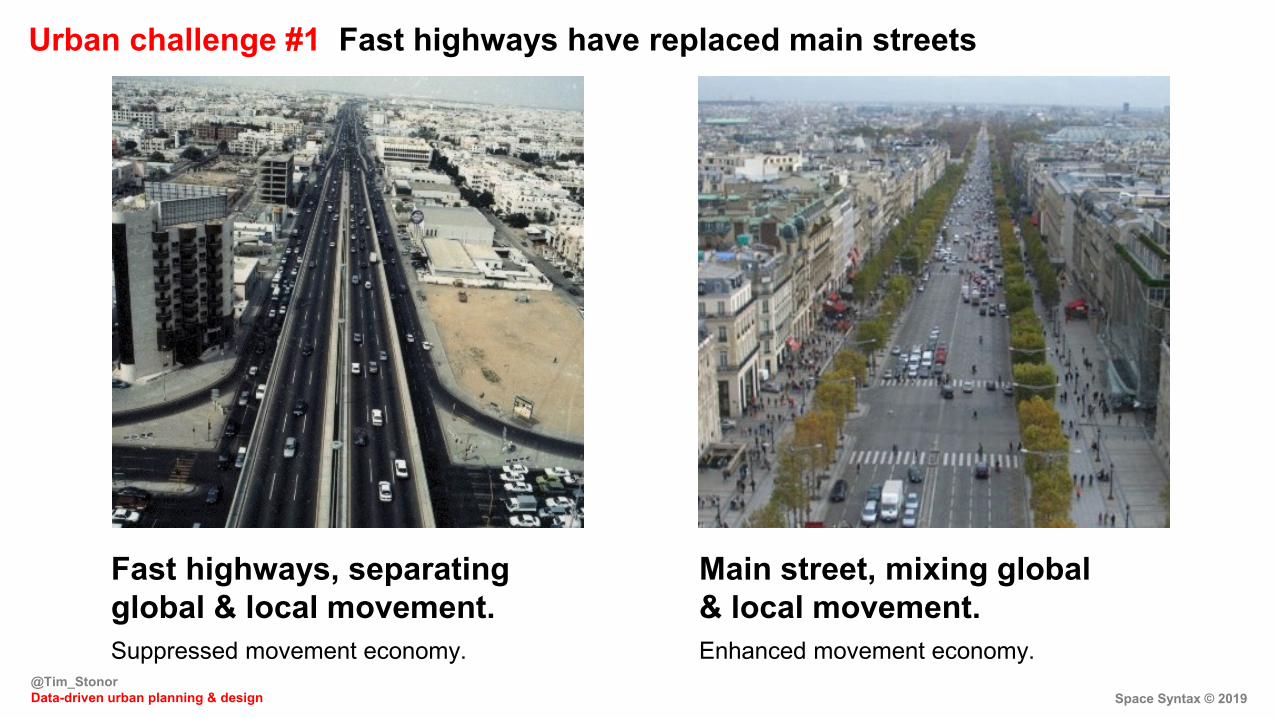
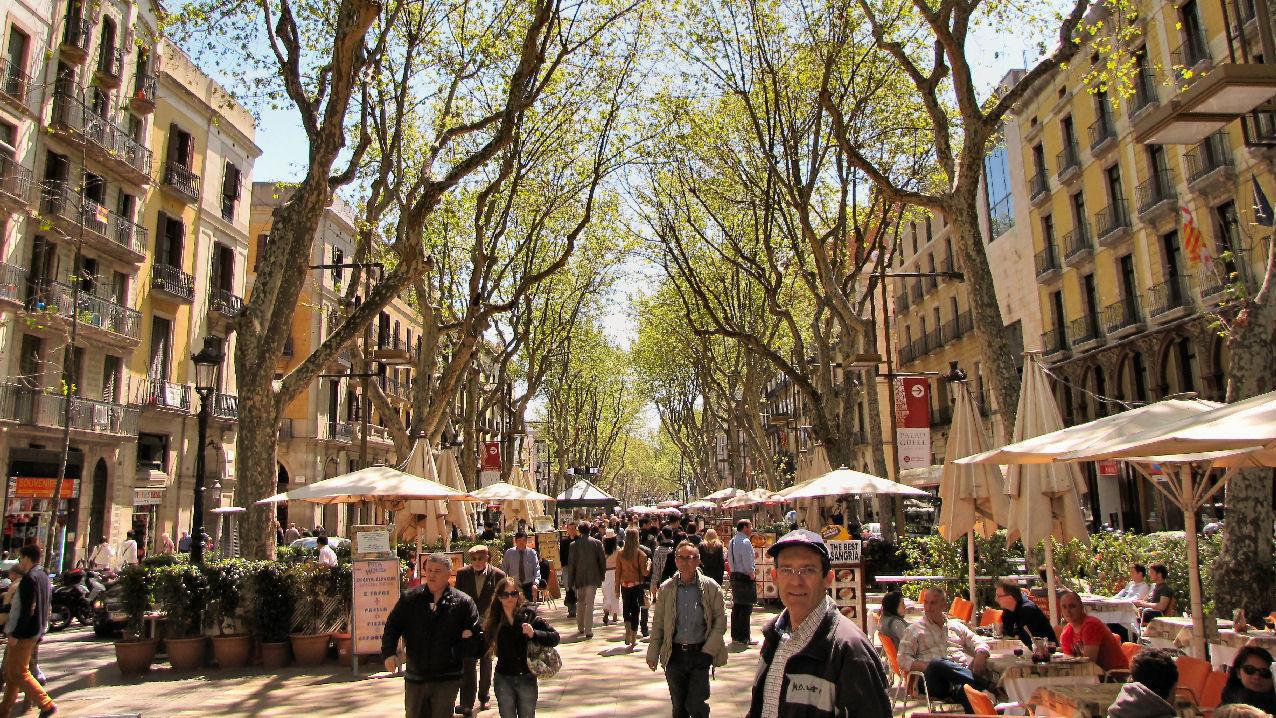
Suppressed movement economy. Enhanced movement economy.
Main street, mixing global & local movement.
Fast highways, separating global & local movement.
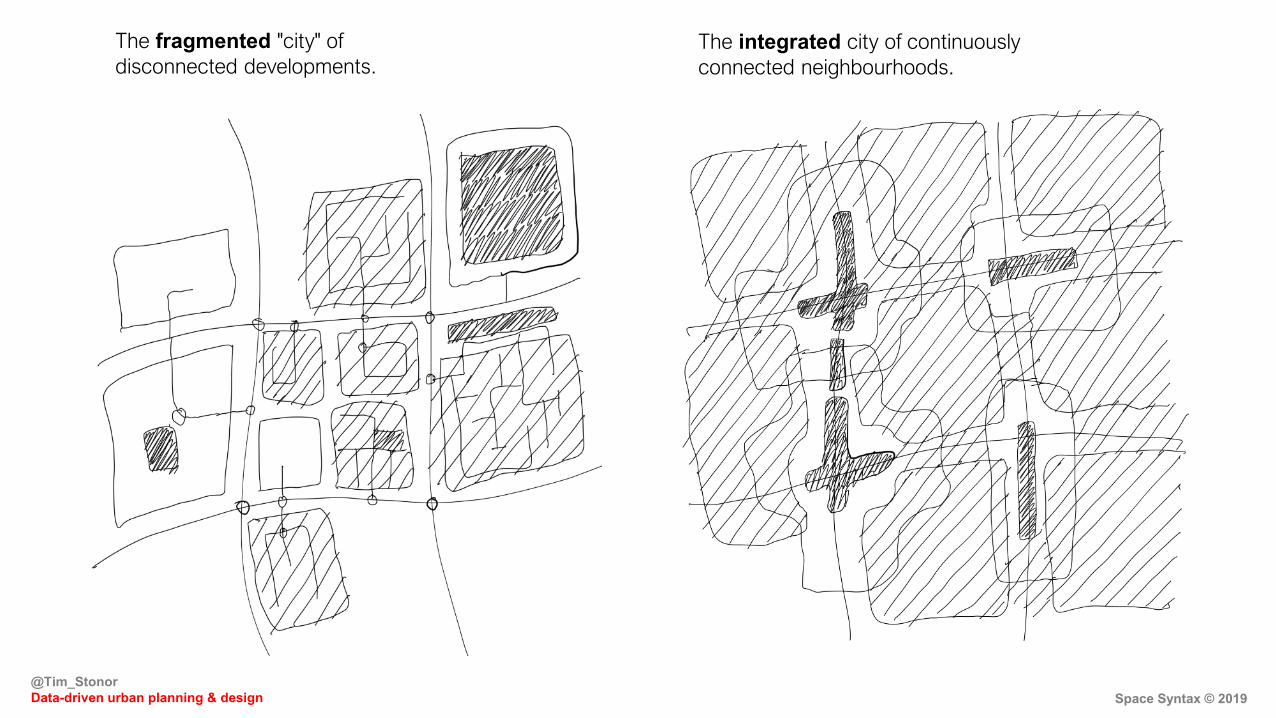
Urban challenge #1 Fast highways have replaced main streets
@Tim_StonorData-driven urban planning & design Space Syntax © 2019
The fragmented "city" of disconnected developments.
The integrated city of continuously connected neighbourhoods.
@Tim_StonorData-driven urban planning & design Space Syntax © 2019
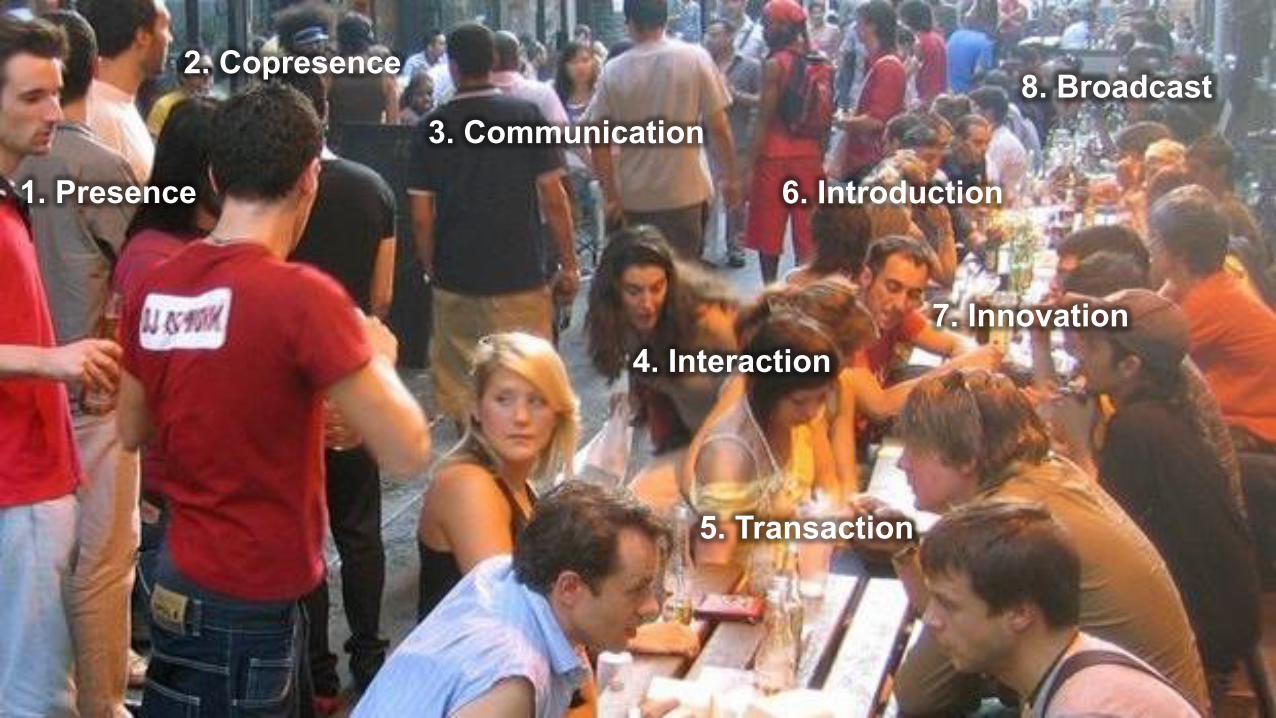
1. Presence
2. Copresence
3. Communication
4. Interaction
5. Transaction
6. Introduction
7. Innovation
8. Broadcast

Transaction machine
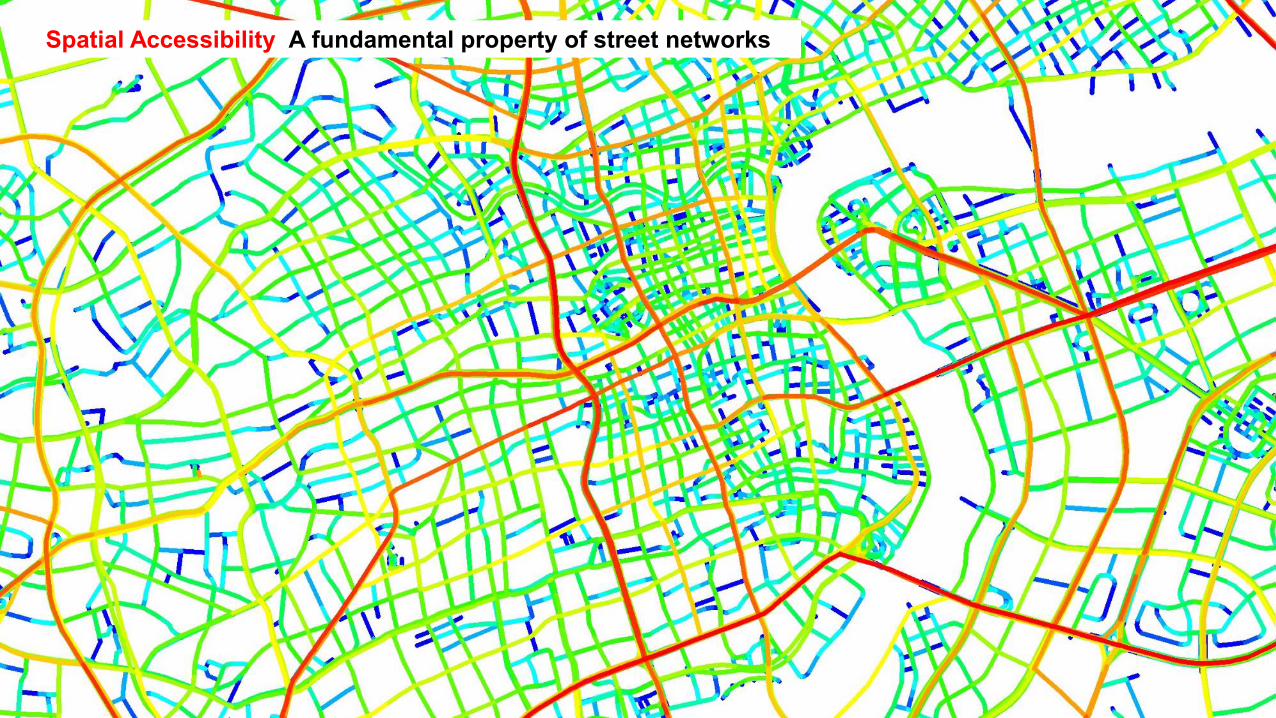
Spatial Accessibility A fundamental property of street networks
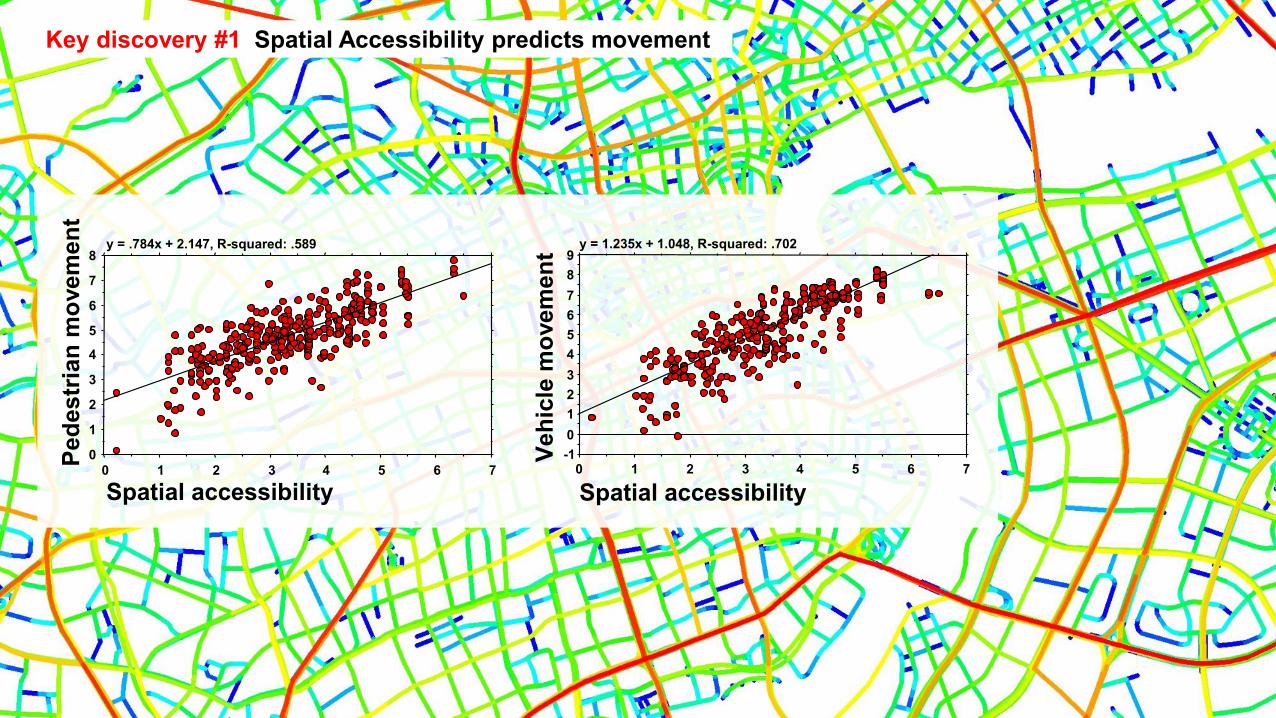
Key discovery #1 Spatial Accessibility predicts movement
0
1
2
3
4
5
6
7
8
0 1 2 3 4 5 6 7
y = .784x + 2.147, R-squared: .589
Spatial accessibility
Pede
stria
n m
ovem
ent
Spatial accessibility-10123456789
0 1 2 3 4 5 6 7
y = 1.235x + 1.048, R-squared: .702
Vehi
cle
mov
emen
t
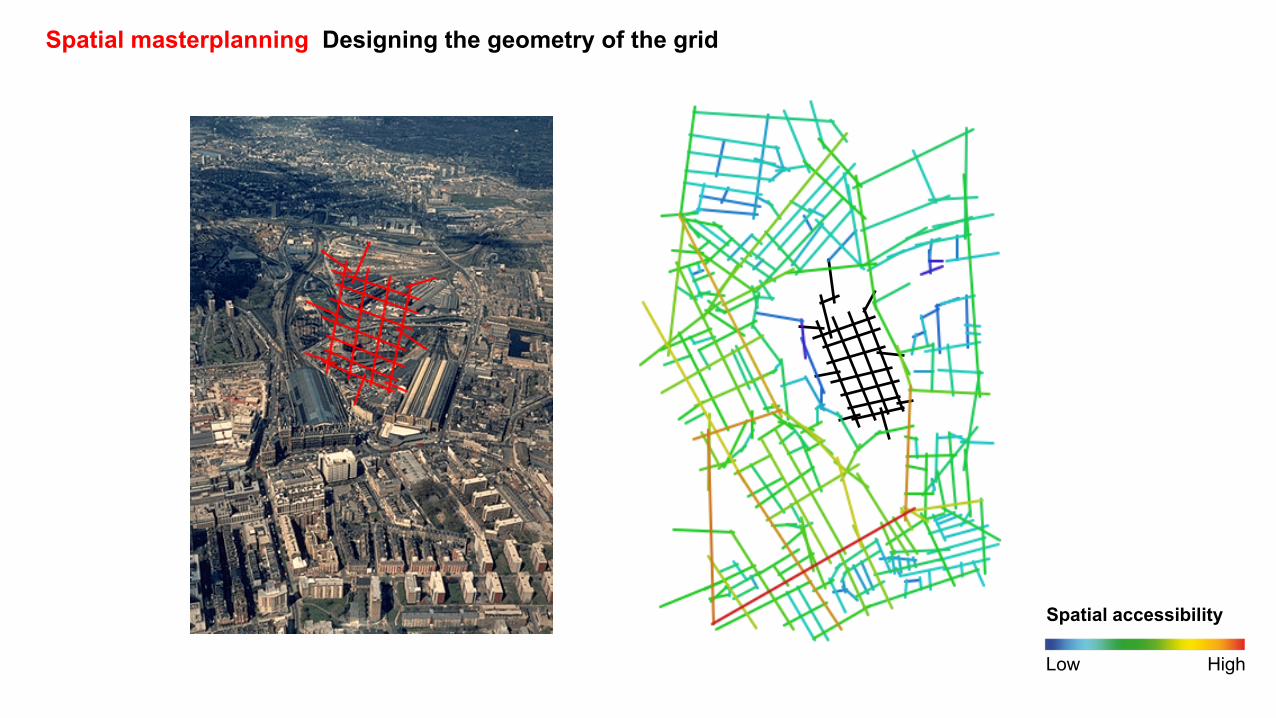
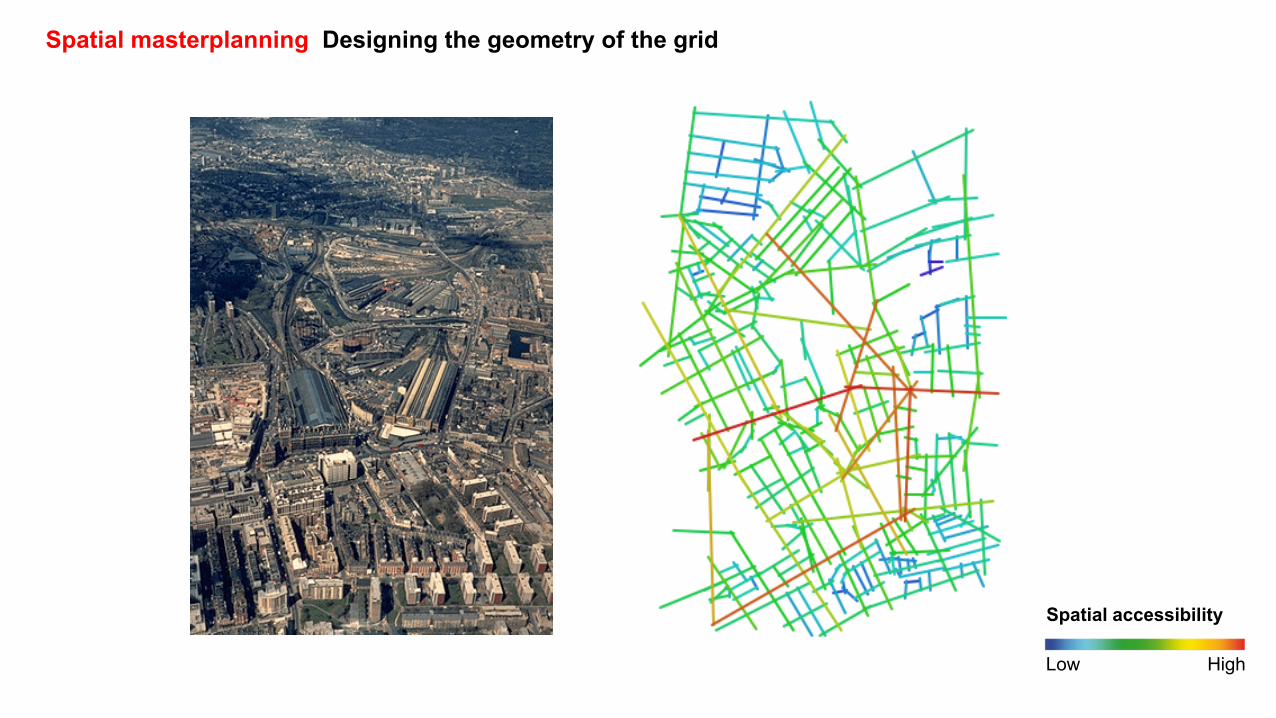
Spatial masterplanning Designing the geometry of the grid
Spatial accessibility
Low High
Spatial accessibility
Low High
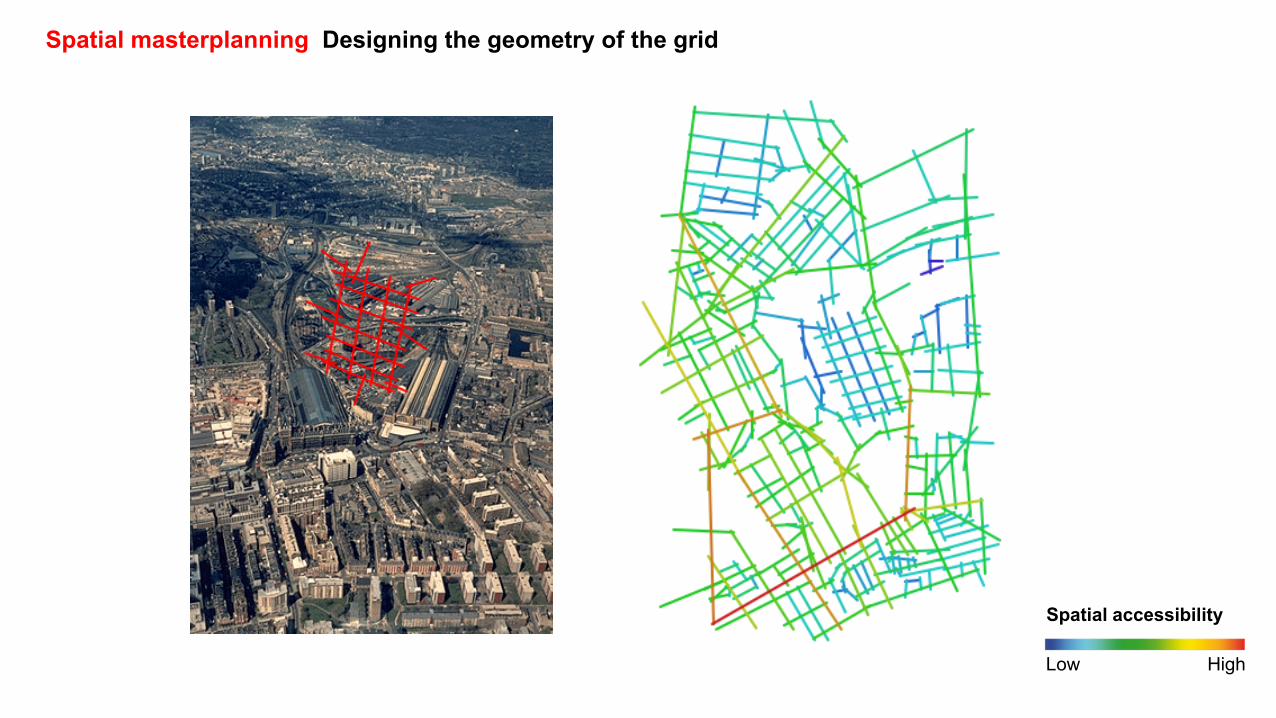
Spatial masterplanning Designing the geometry of the grid
Spatial accessibility
Low High
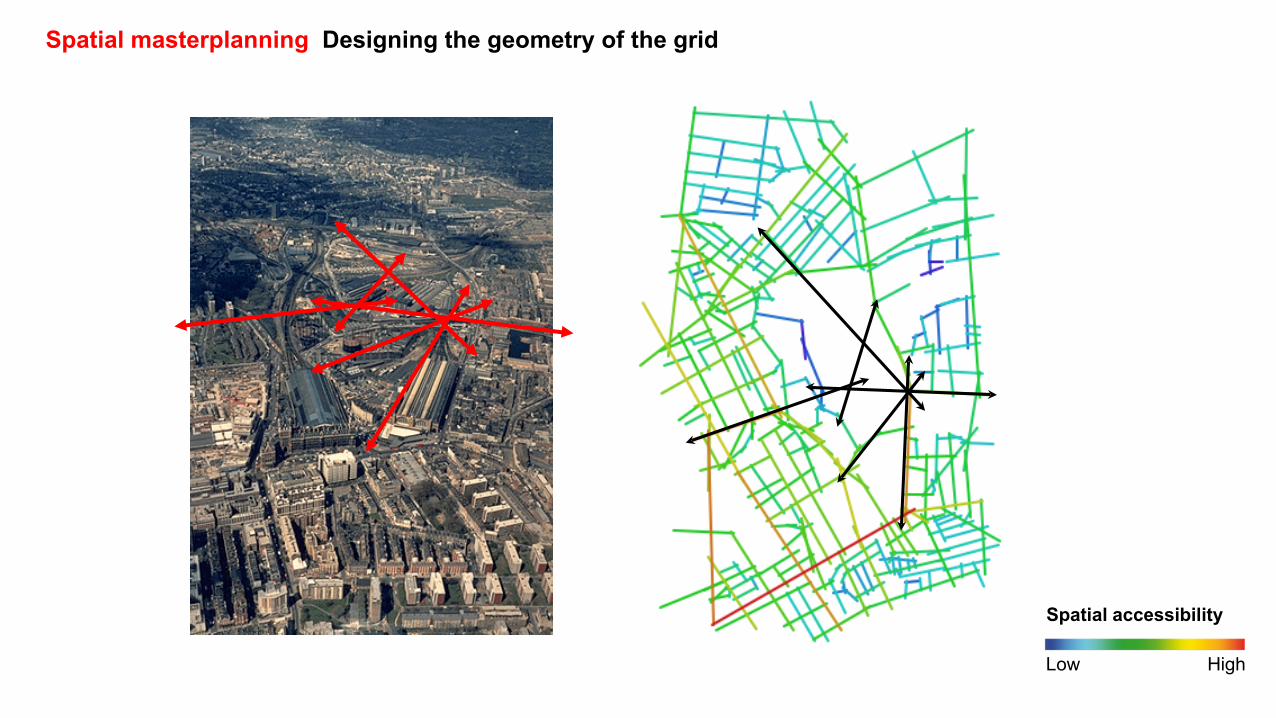
Spatial masterplanning Designing the geometry of the grid
Spatial accessibility
Low High
Spatial masterplanning Designing the geometry of the grid
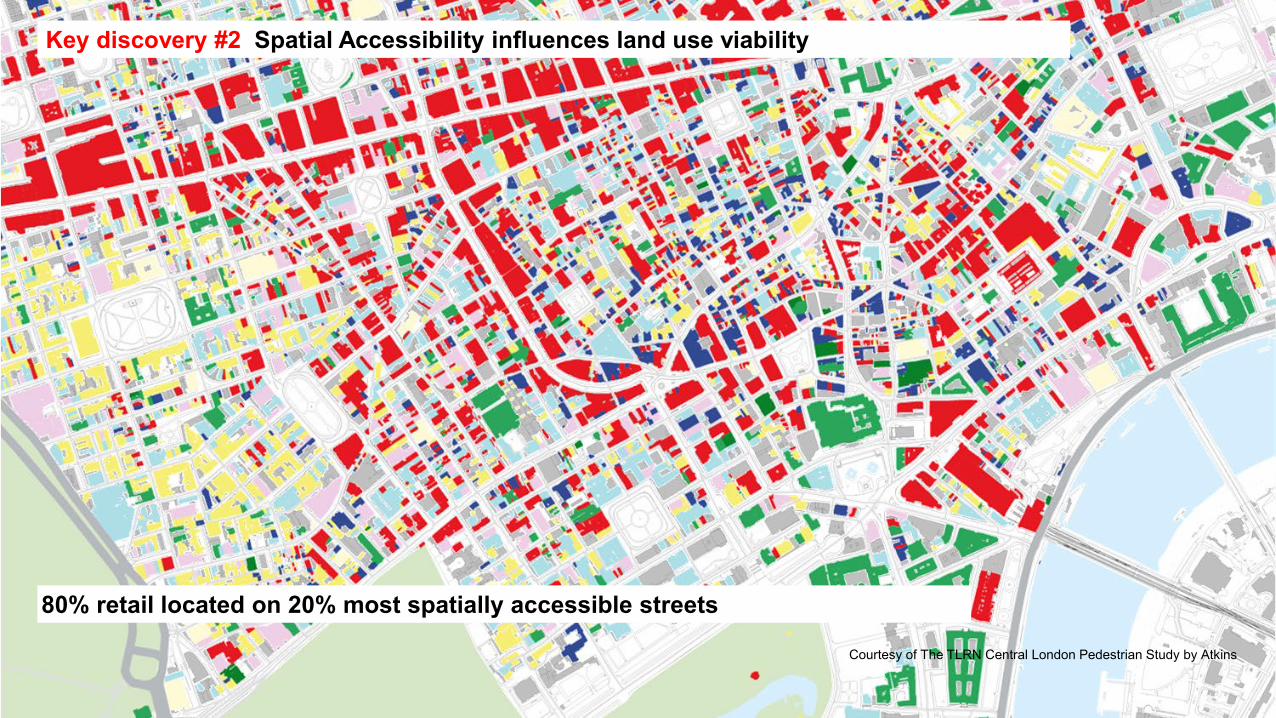
Courtesy of The TLRN Central London Pedestrian Study by Atkins
80% retail located on 20% most spatially accessible streets
Key discovery #2 Spatial Accessibility influences land use viability

Nur-Sultan Masterplan, Kazakhstan
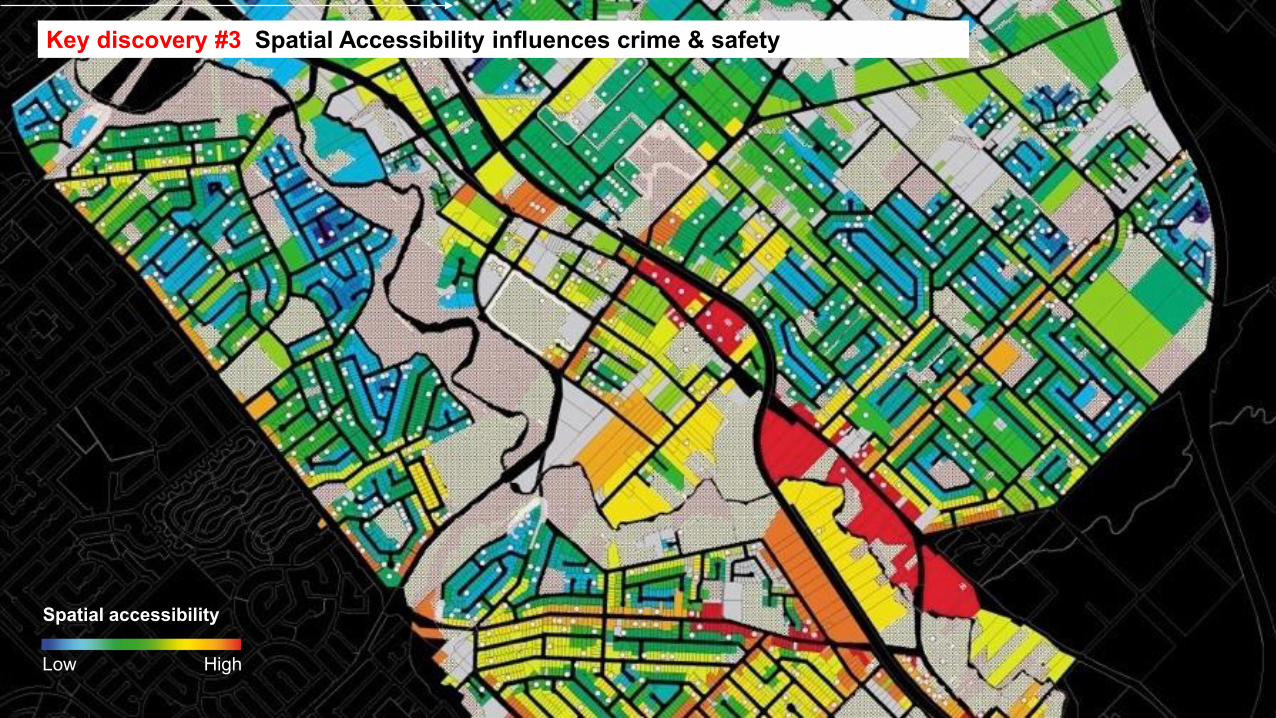
Key discovery #3 Spatial Accessibility influences crime & safety
Spatial accessibility
Low High
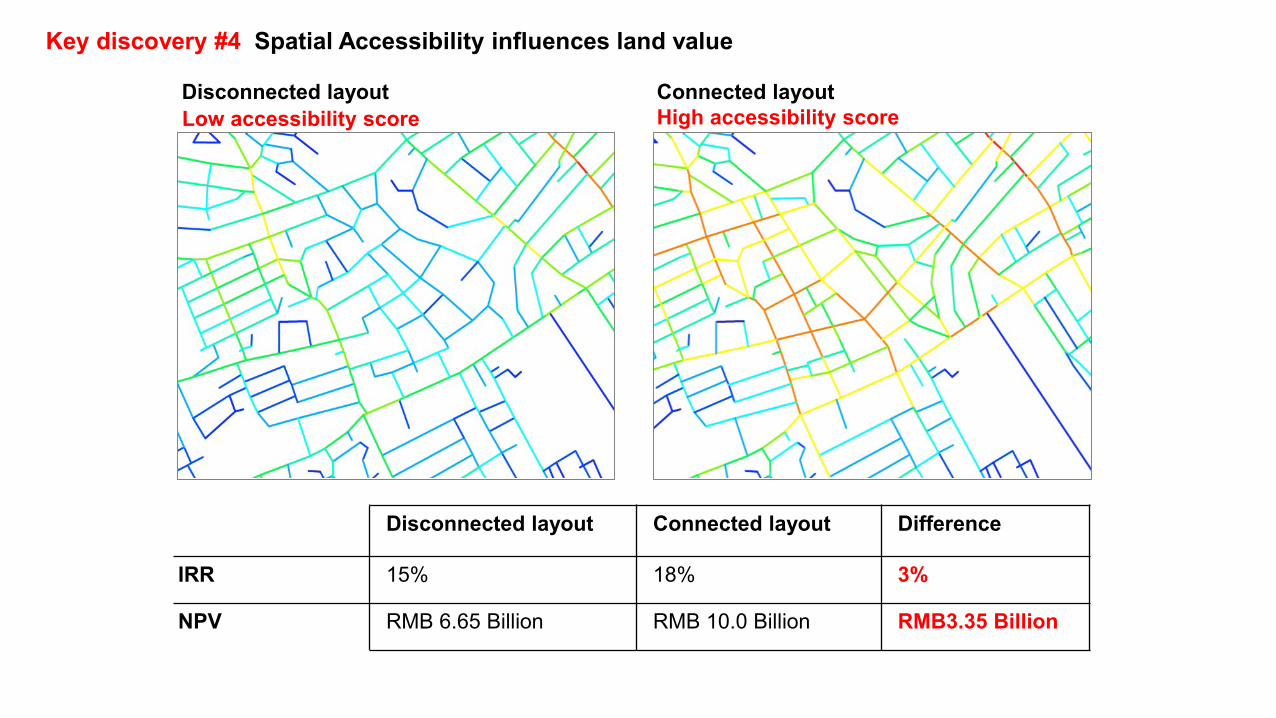
Connected layout Disconnected layout High accessibility scoreLow accessibility score
Disconnected layout Connected layout Difference
IRR 15% 18% 3%
NPV RMB 6.65 Billion RMB 10.0 Billion RMB3.35 Billion
Key discovery #4 Spatial Accessibility influences land value
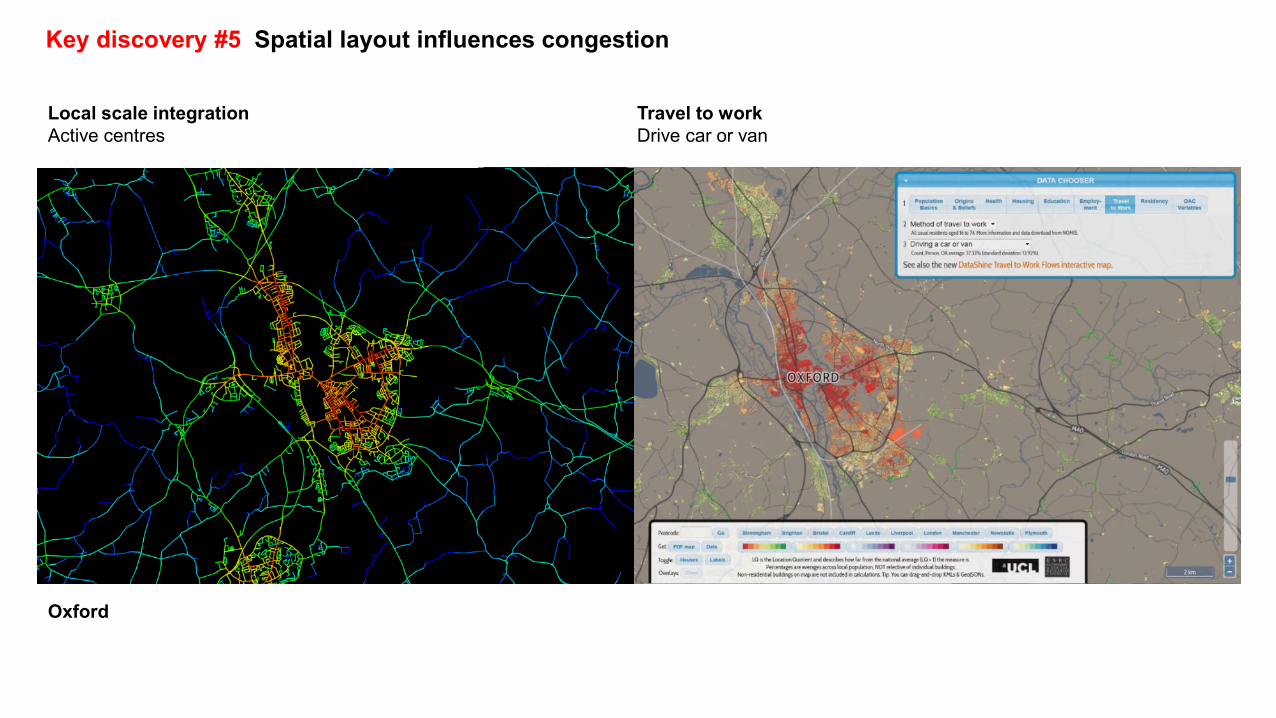
Travel to workDrive car or van
Local scale integrationActive centres
Oxford
Key discovery #5 Spatial layout influences congestion
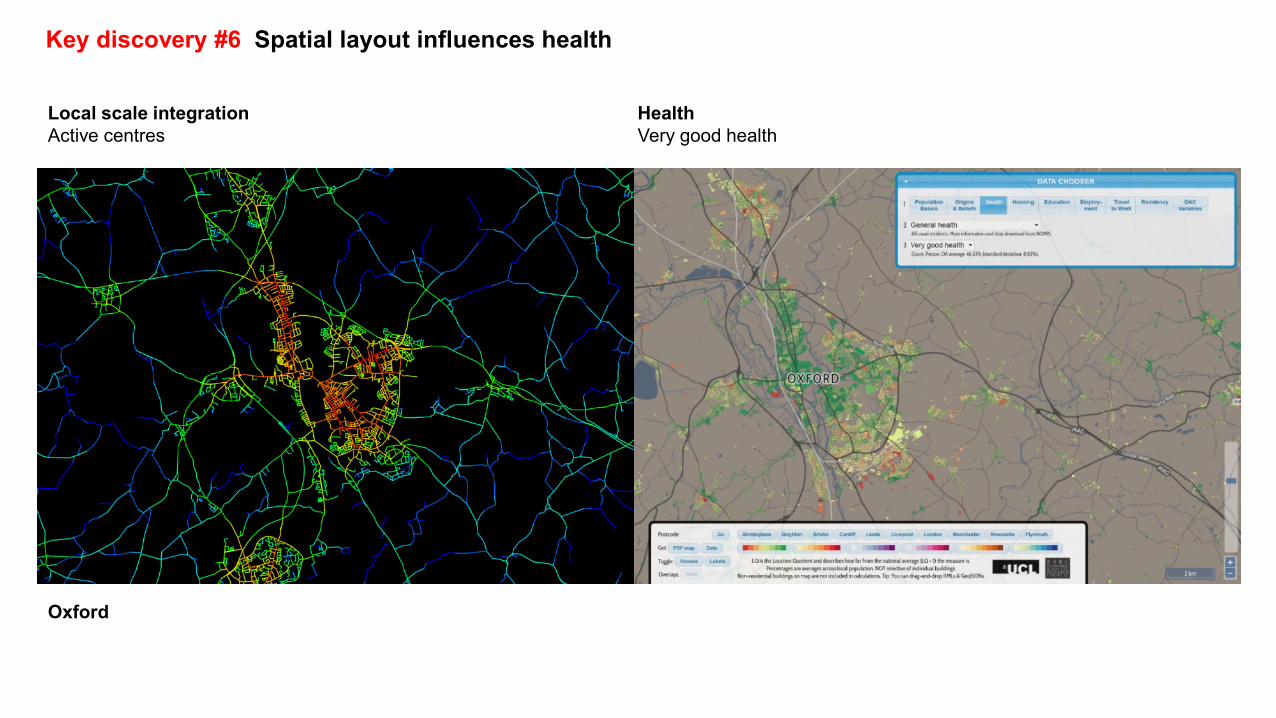
HealthVery good health
Local scale integrationActive centres
Oxford
Key discovery #6 Spatial layout influences health
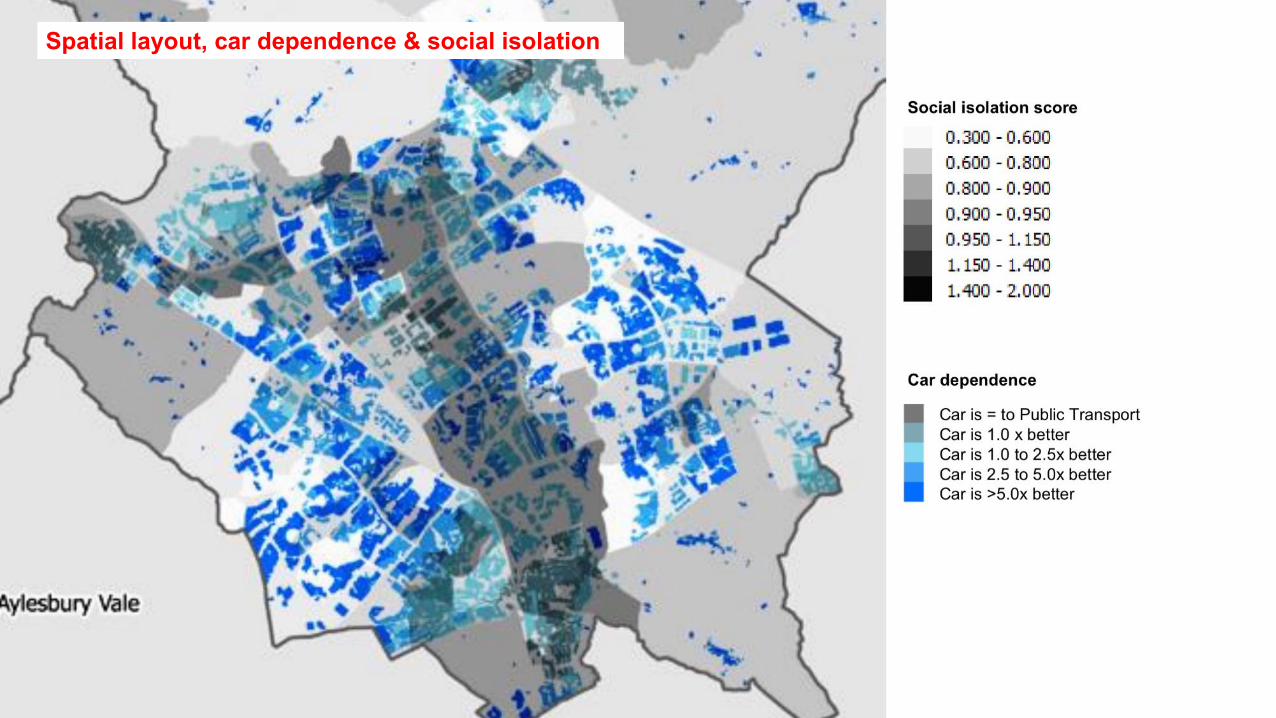
Spatial layout, car dependence & social isolation
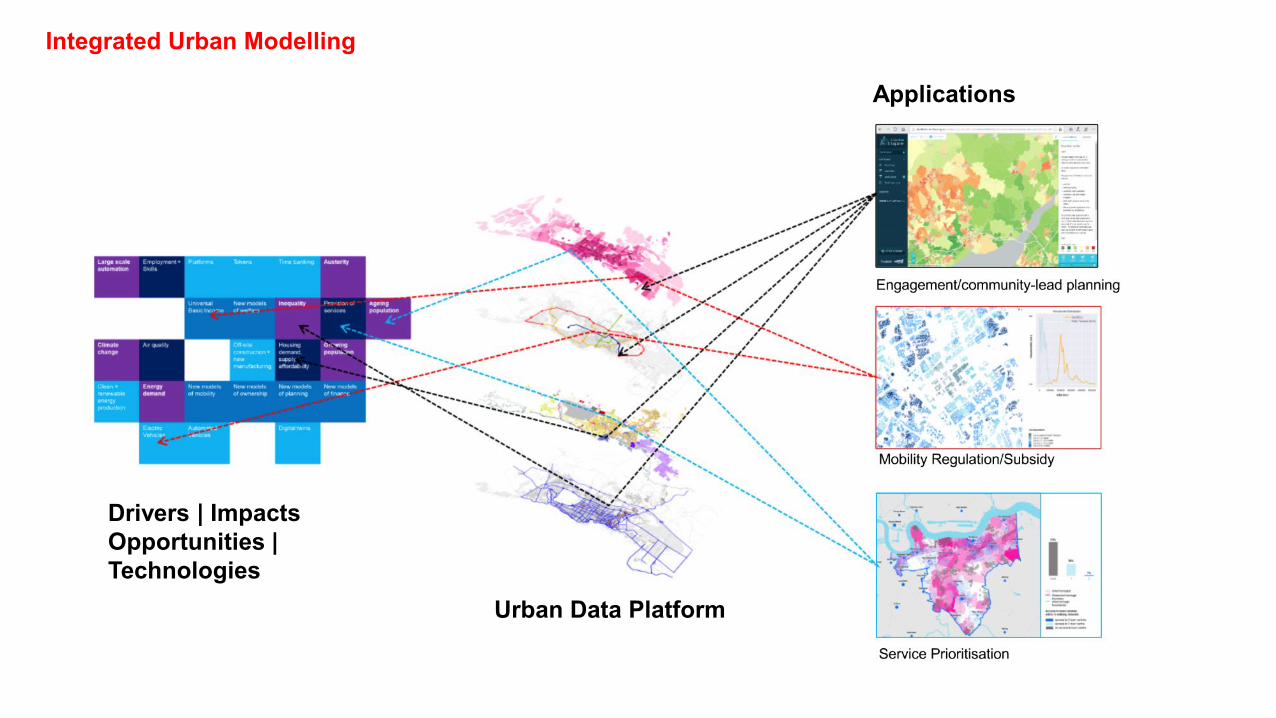
Integrated Urban Modelling
Urban Data Platform
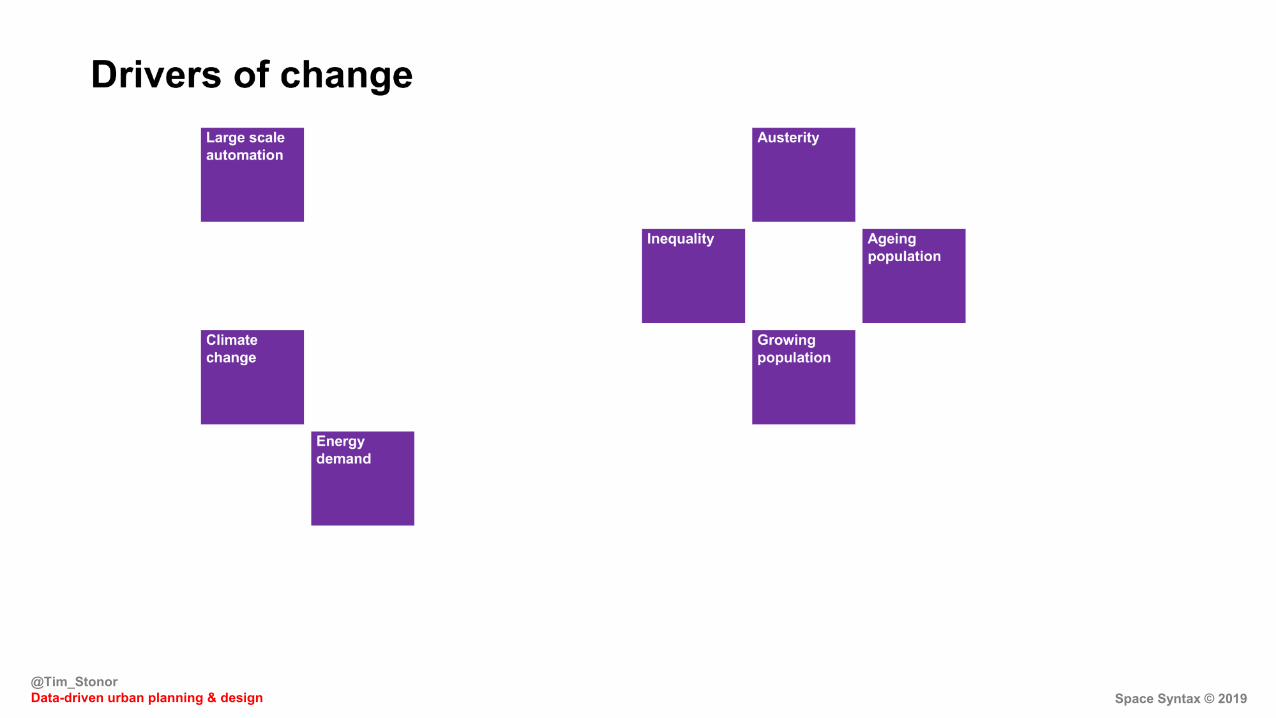
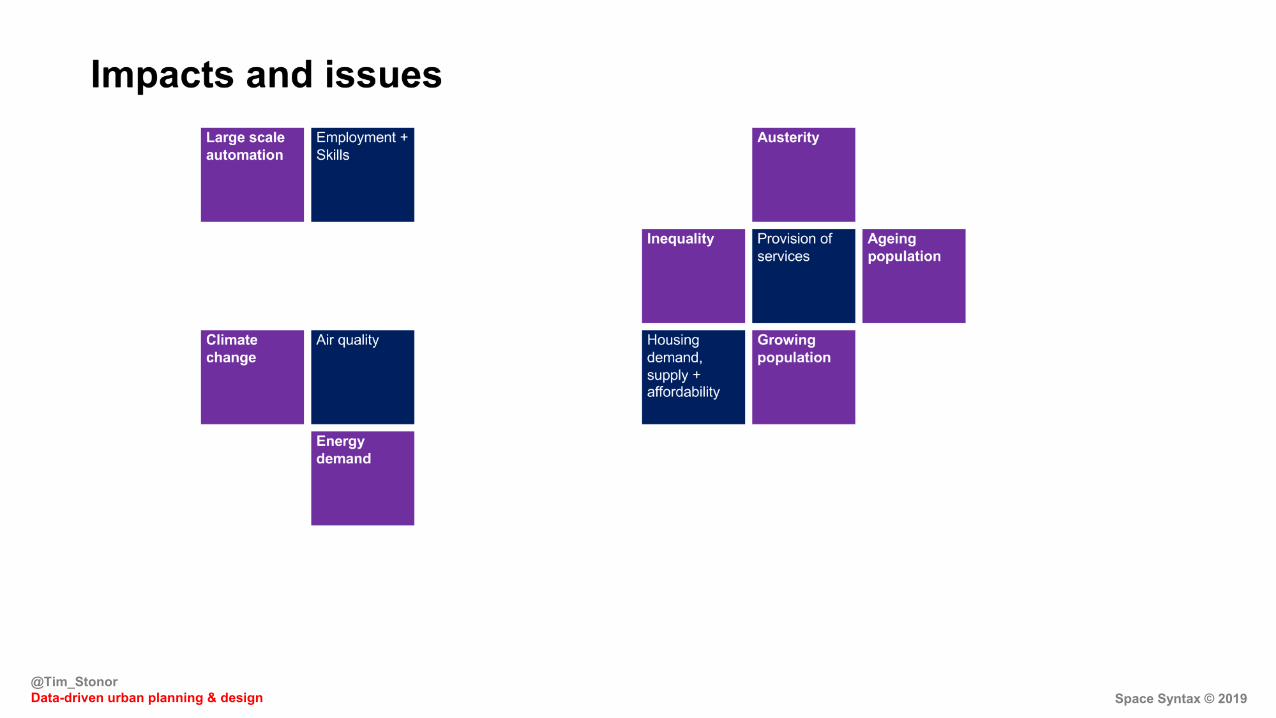
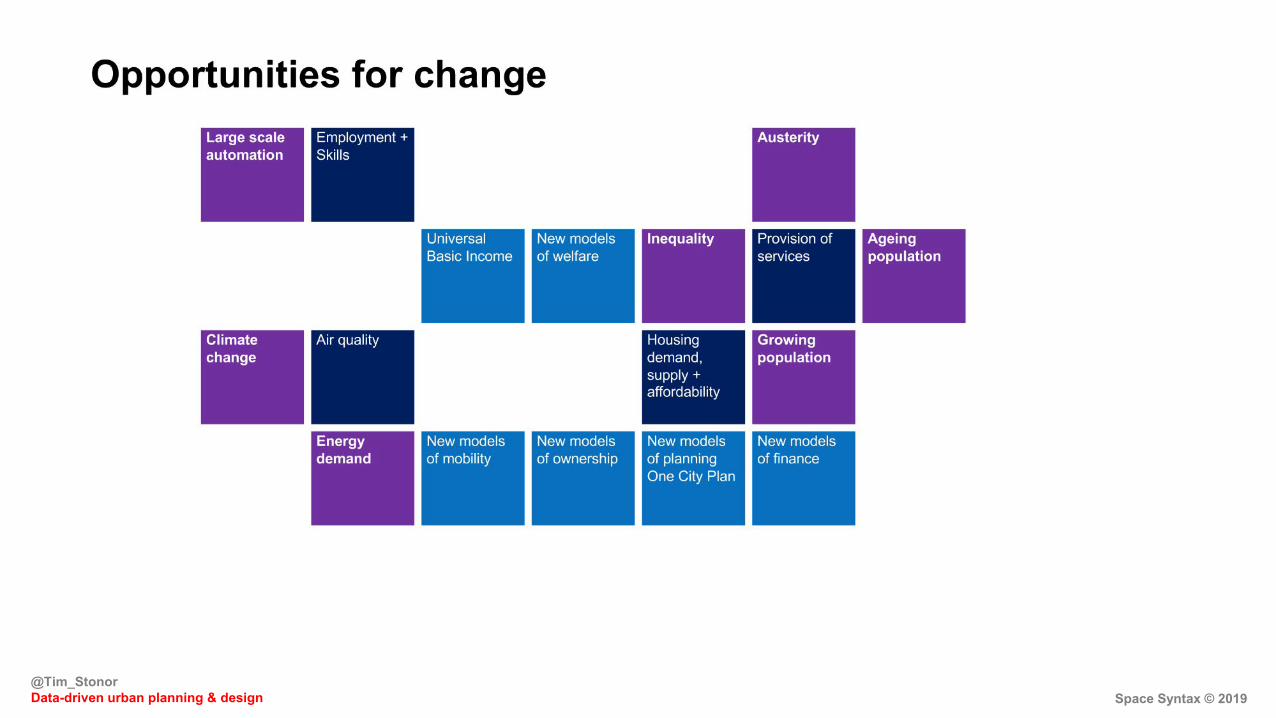
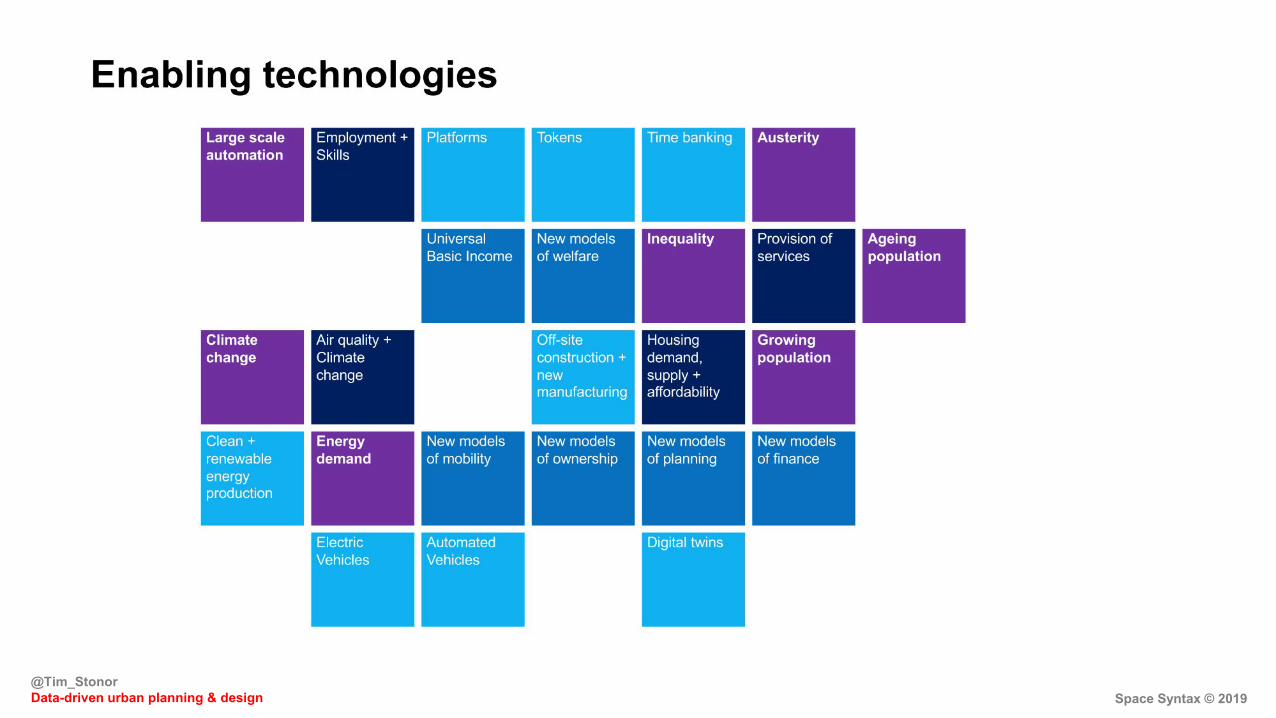
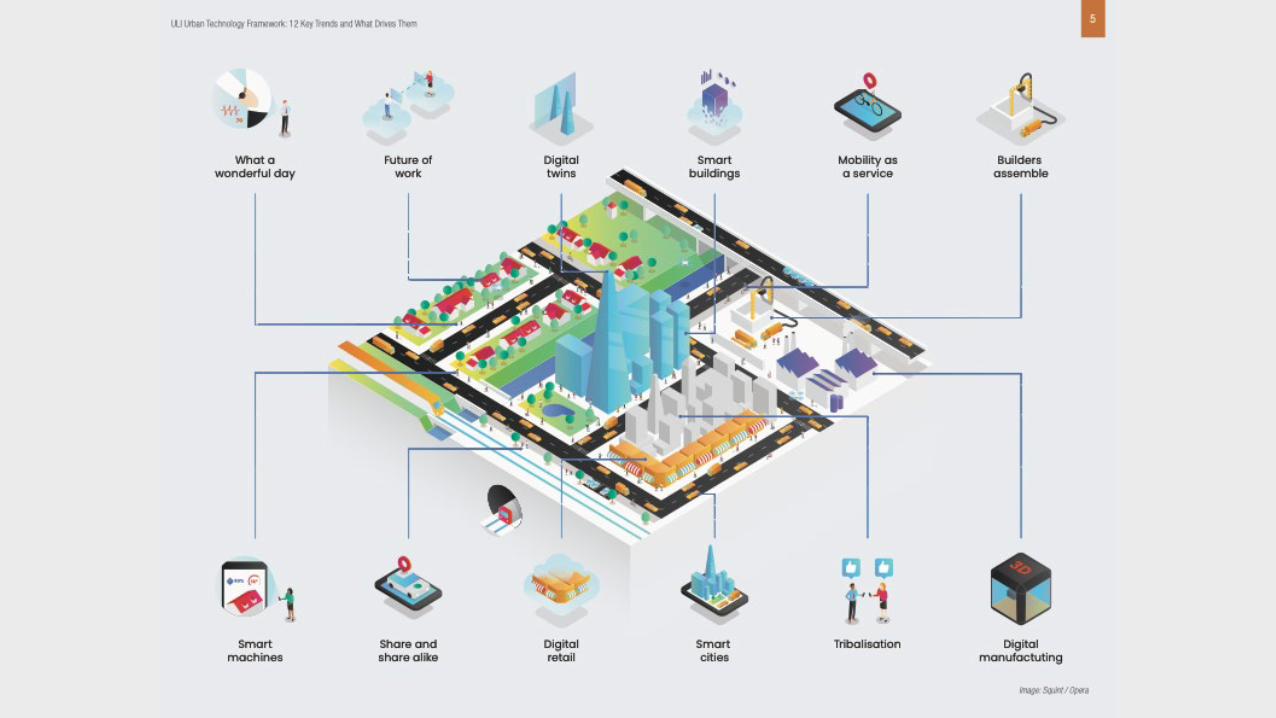
Drivers | ImpactsOpportunities | Technologies
Applications
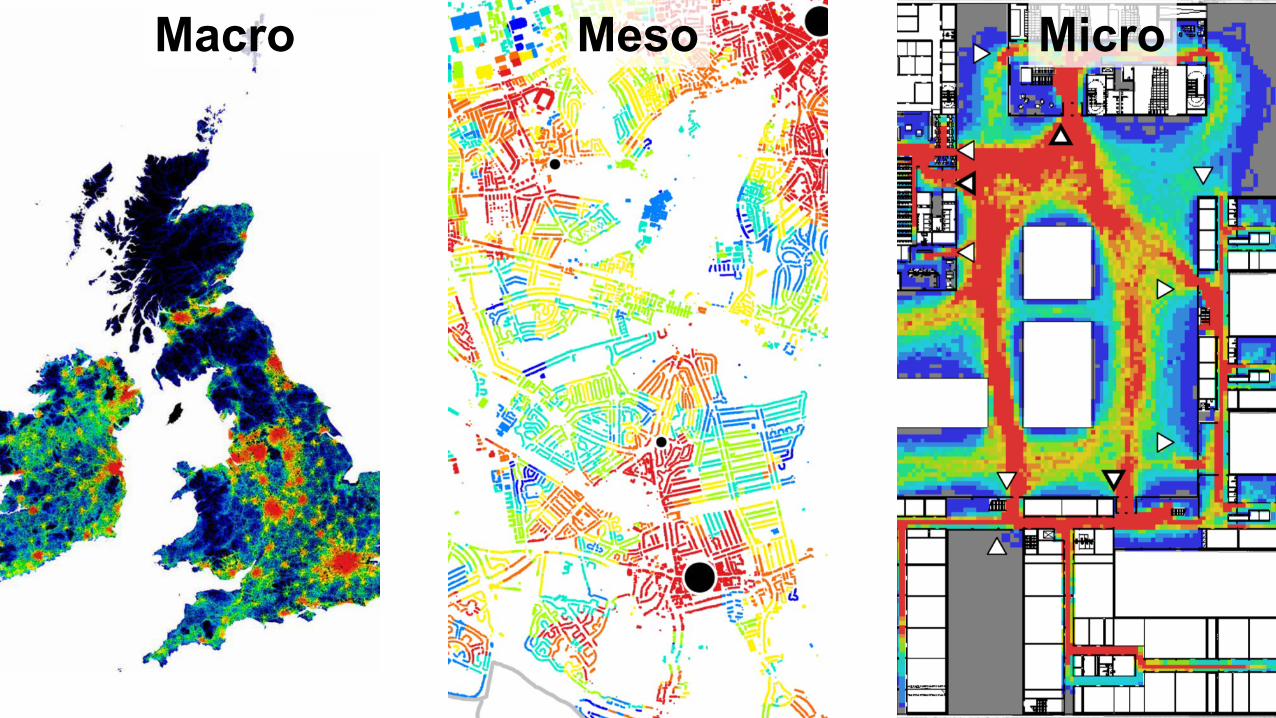
Macro Meso Micro
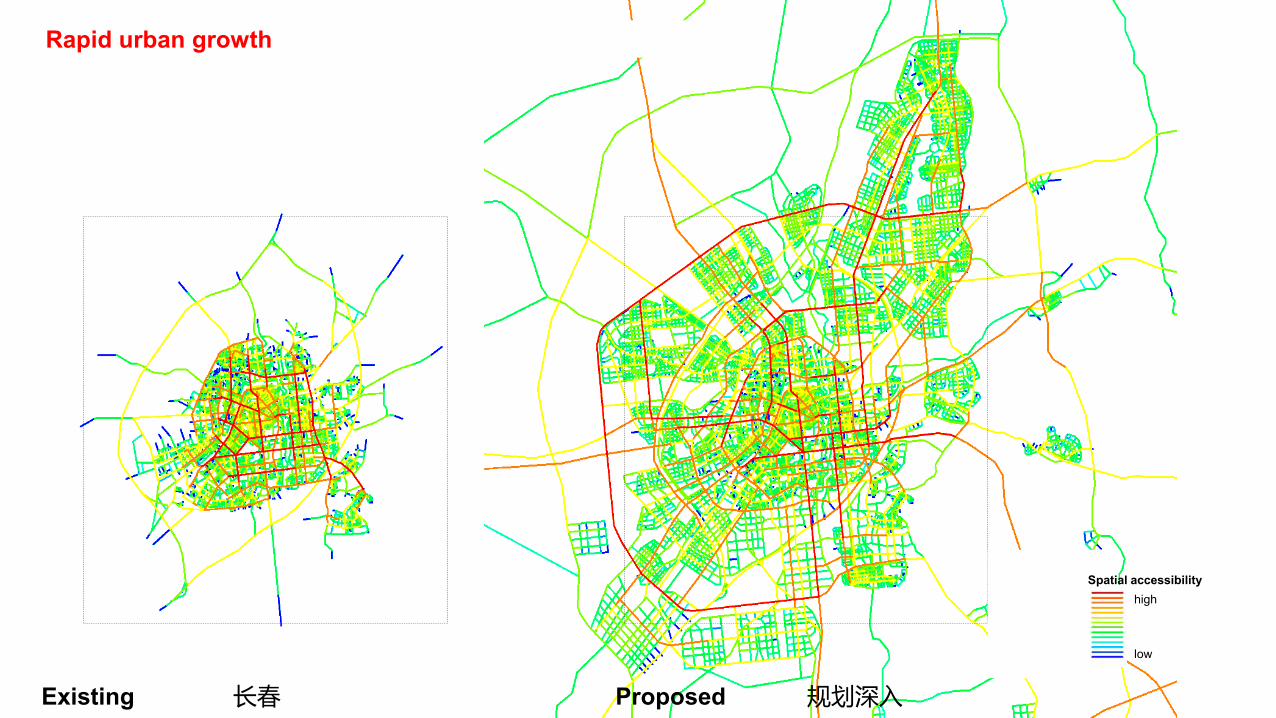
Existing 长春 Proposed 规划深入
Spatial accessibilityhigh
low
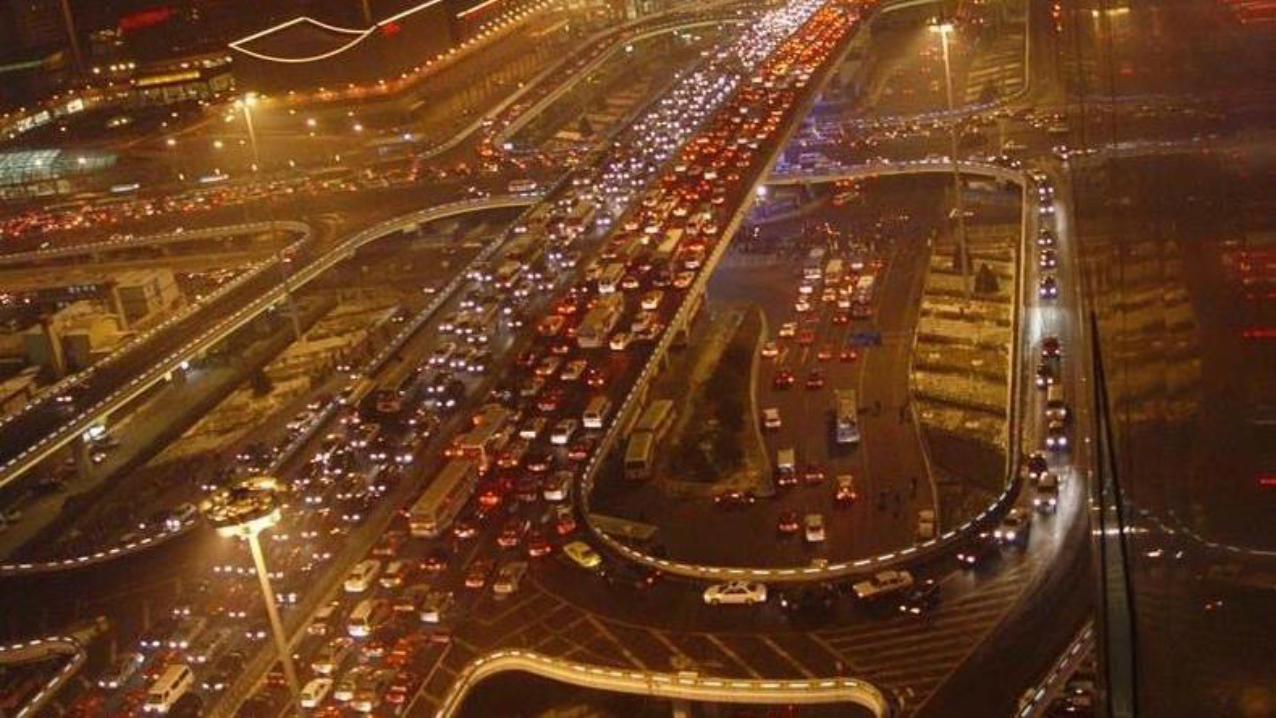
Rapid urban growth

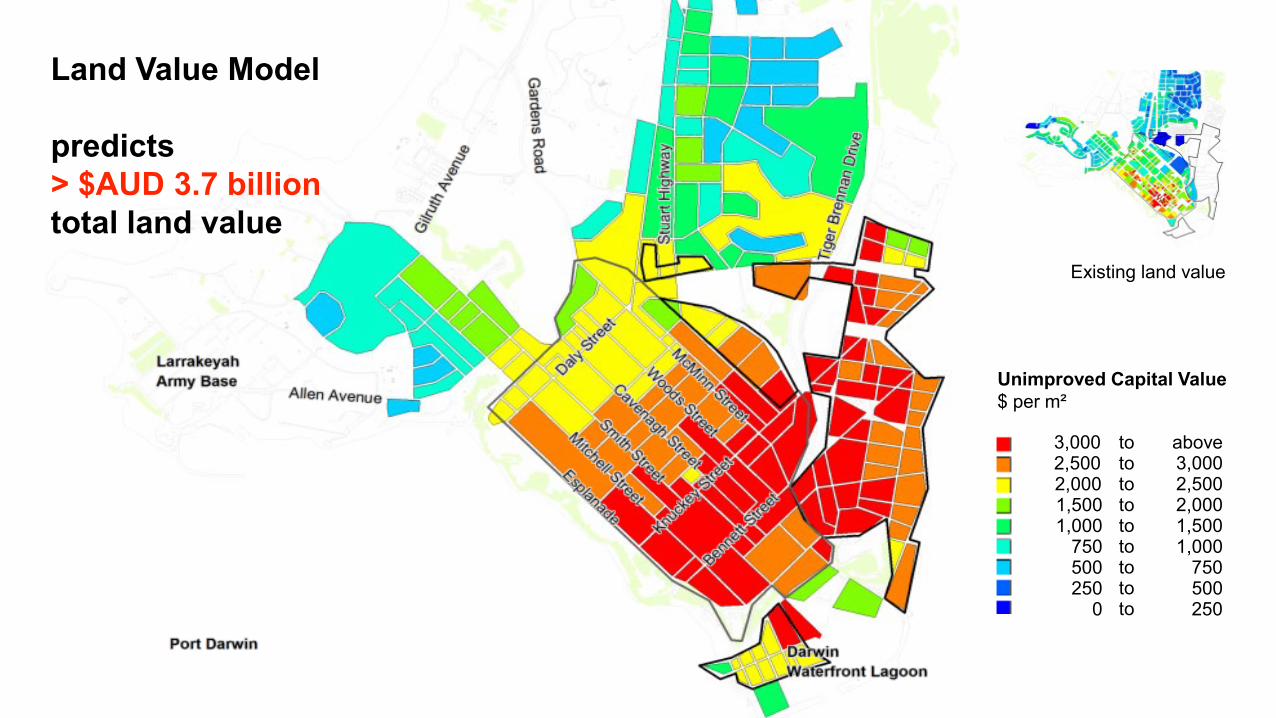
Darwin CBD Masterplan, Australia
2,000
3,000
750
2,500
1,5001,000
500250
2,000
750
2,500
1,5001,000
500250
0
totototototototo
Unimproved Capital Value$ per m²
above3,000 to
Existing land value
Land Value Model
predicts> $AUD 3.7 billiontotal land value
Space Syntax © 2019@Tim_StonorData-driven urban planning & design
NAC
h10k
&1.2
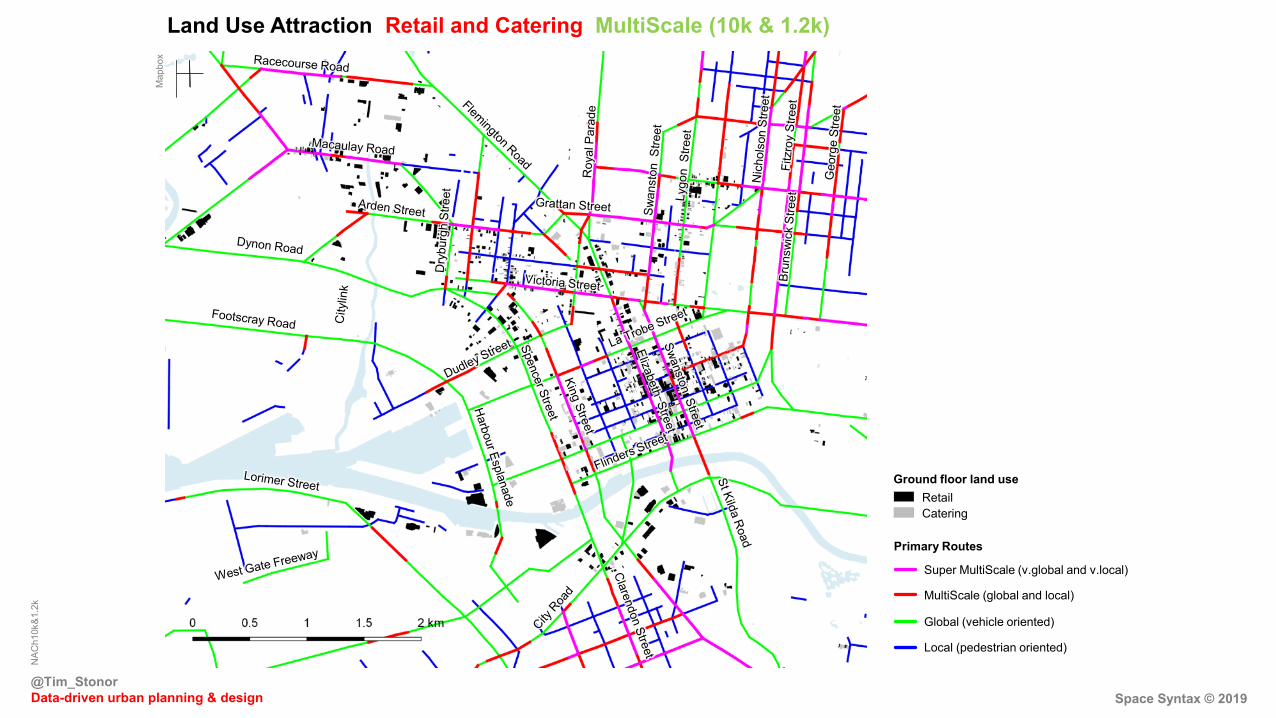
kLand Use Attraction Retail and Catering MultiScale (10k & 1.2k)
Map
box
MultiScale (global and local)
Primary Routes
Global (vehicle oriented)
Local (pedestrian oriented)
Super MultiScale (v.global and v.local)
RetailCatering
Ground floor land use
Space Syntax © 2019@Tim_StonorData-driven urban planning & design
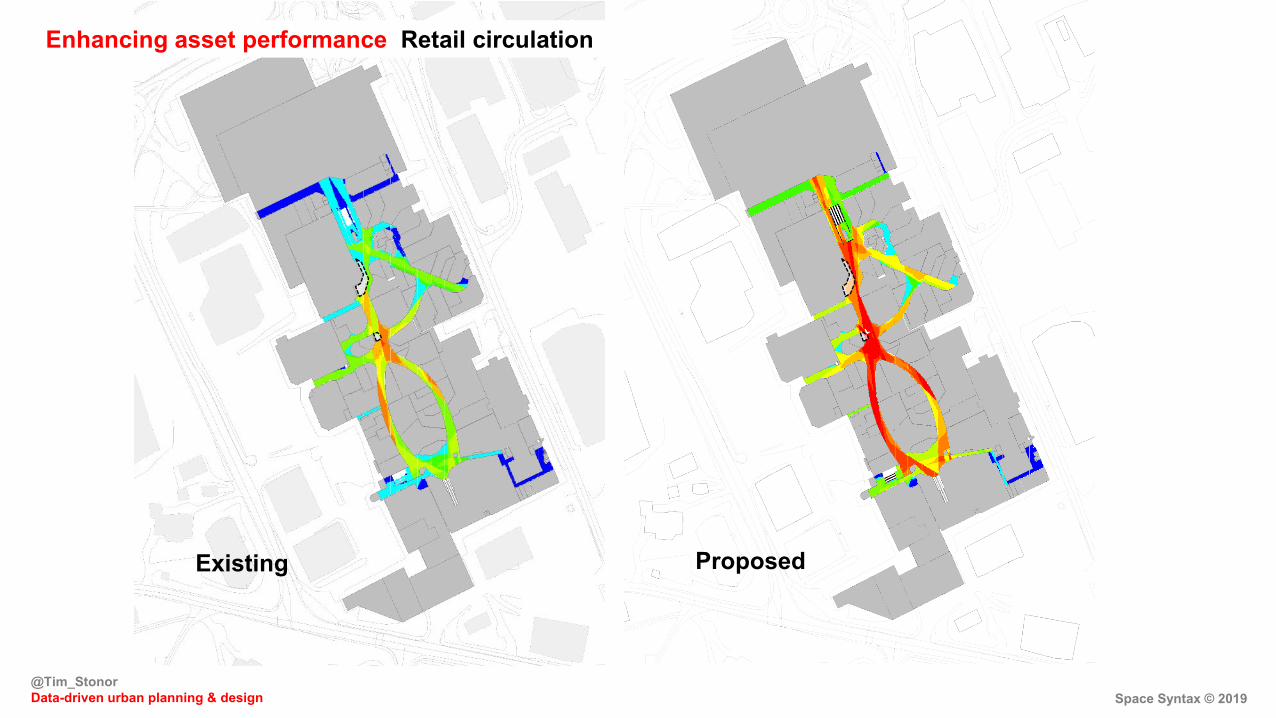
Existing
First floor
Visibility
Low High
Proposed
Enhancing asset performance Retail circulation
Space Syntax © 2019@Tim_StonorData-driven urban planning & design
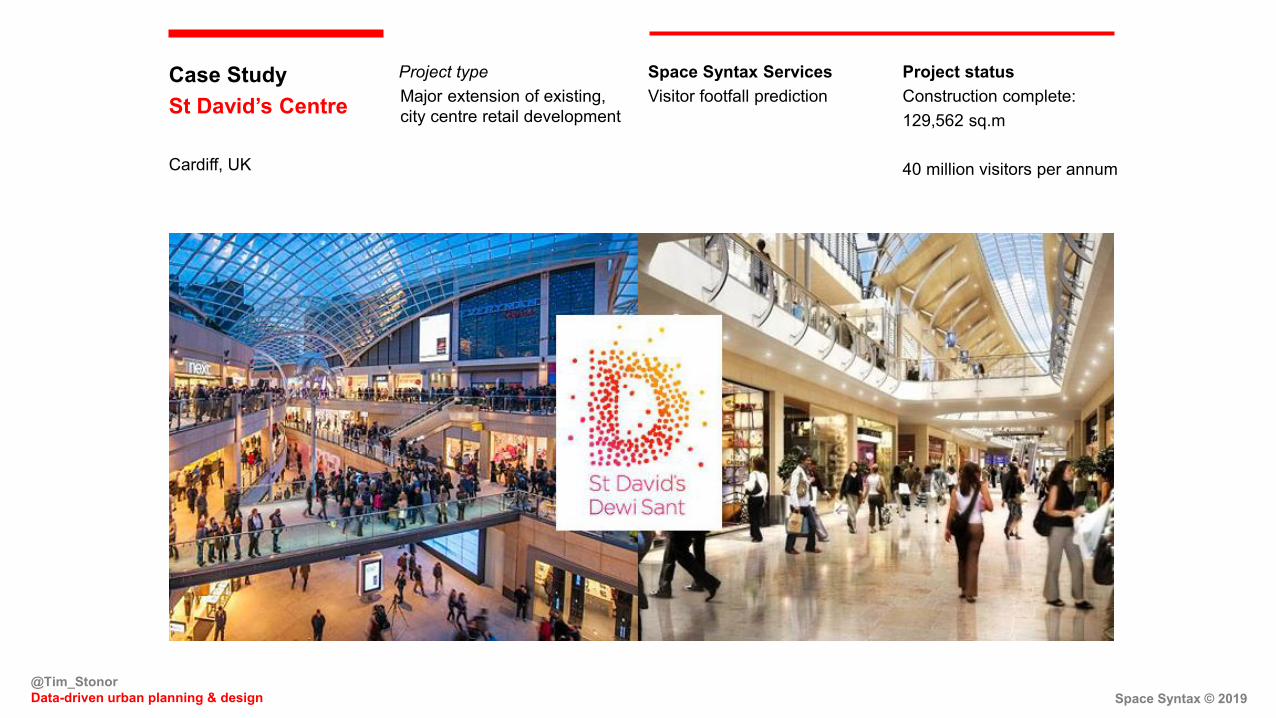
Case Study St David’s Centre
Cardiff, UK
Space Syntax ServicesVisitor footfall prediction
Project statusConstruction complete:129,562 sq.m
40 million visitors per annum
Project typeMajor extension of existing, city centre retail development
Greyfriars Road
Space Syntax © 2019@Tim_StonorData-driven urban planning & design
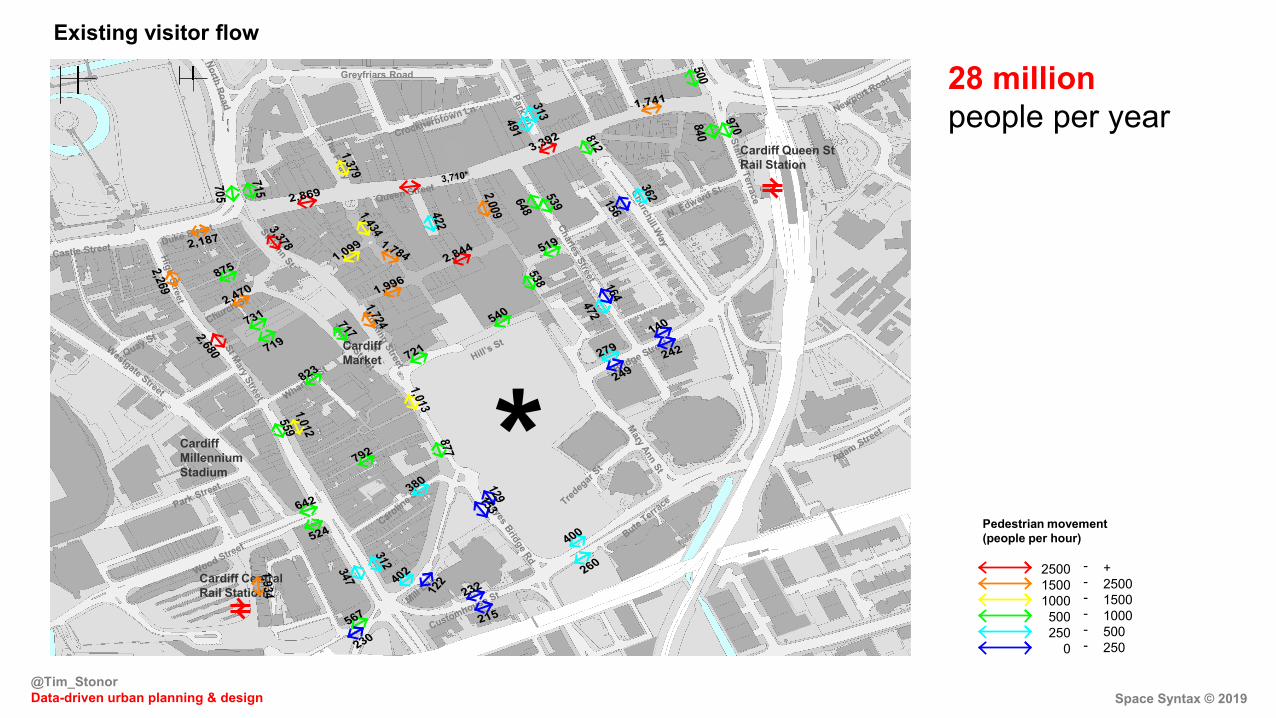
Existing visitor flow
Cardiff Central Rail Station
Cardiff Queen St Rail Station
Cardiff Millennium Stadium
Cardiff Market
2,187
705
719
840
491648 156
472
242
249
230
524
347
122
215
260
2,680
2,269
1,434
1,099
1,996
721
1,784 2,844
2,009
2,869
3,392
1,379
519
7153,378
2,470
823
380
1,724717
164
402
792
877
1,013
400
642
1,012
559
875
812
279140
312
567362
153129
232
1,741
500
731
422
538
540
539313 970
1,934
250015001000500250
0
+250015001000500250
------
Pedestrian movement (people per hour)
*
28 million people per year
Greyfriars Road
Space Syntax © 2019@Tim_StonorData-driven urban planning & design
Cardiff Central Rail Station
Cardiff Queen St Rail Station
Cardiff Millennium Stadium
Cardiff Market
0 100 200
metres
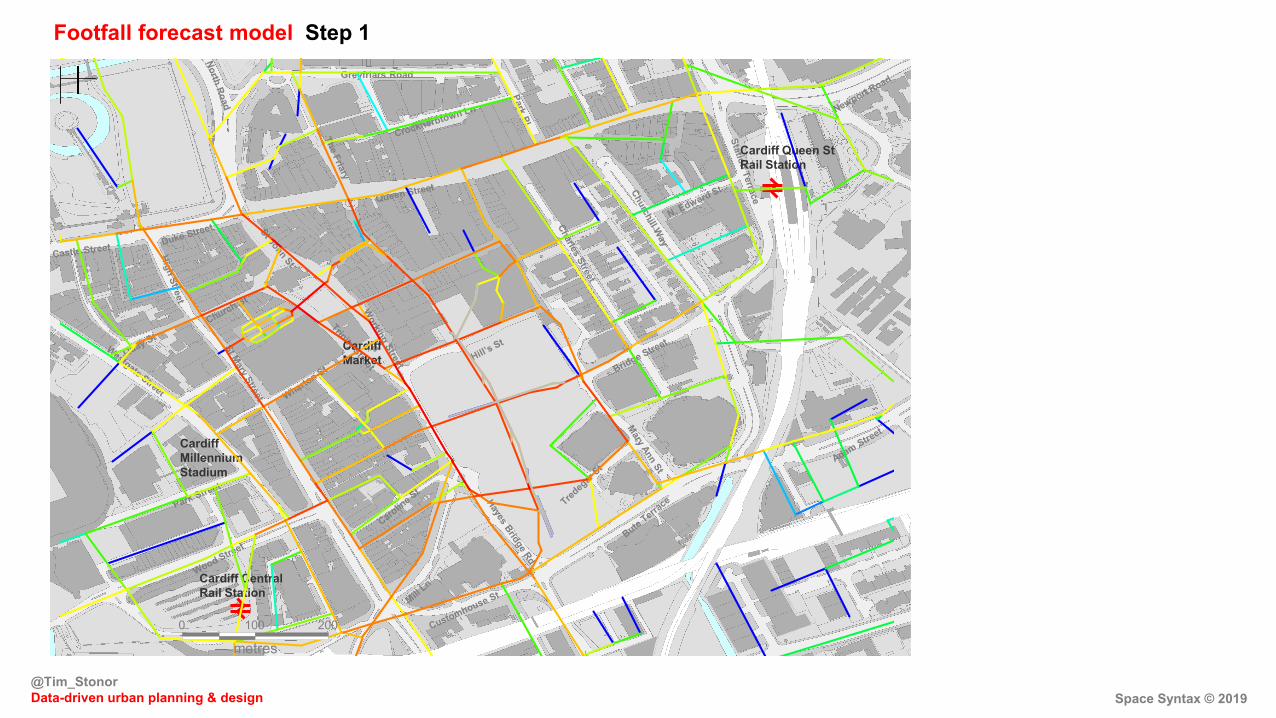
Footfall forecast model Step 1
Greyfriars Road
0 100 200
metres
Space Syntax © 2019@Tim_StonorData-driven urban planning & design
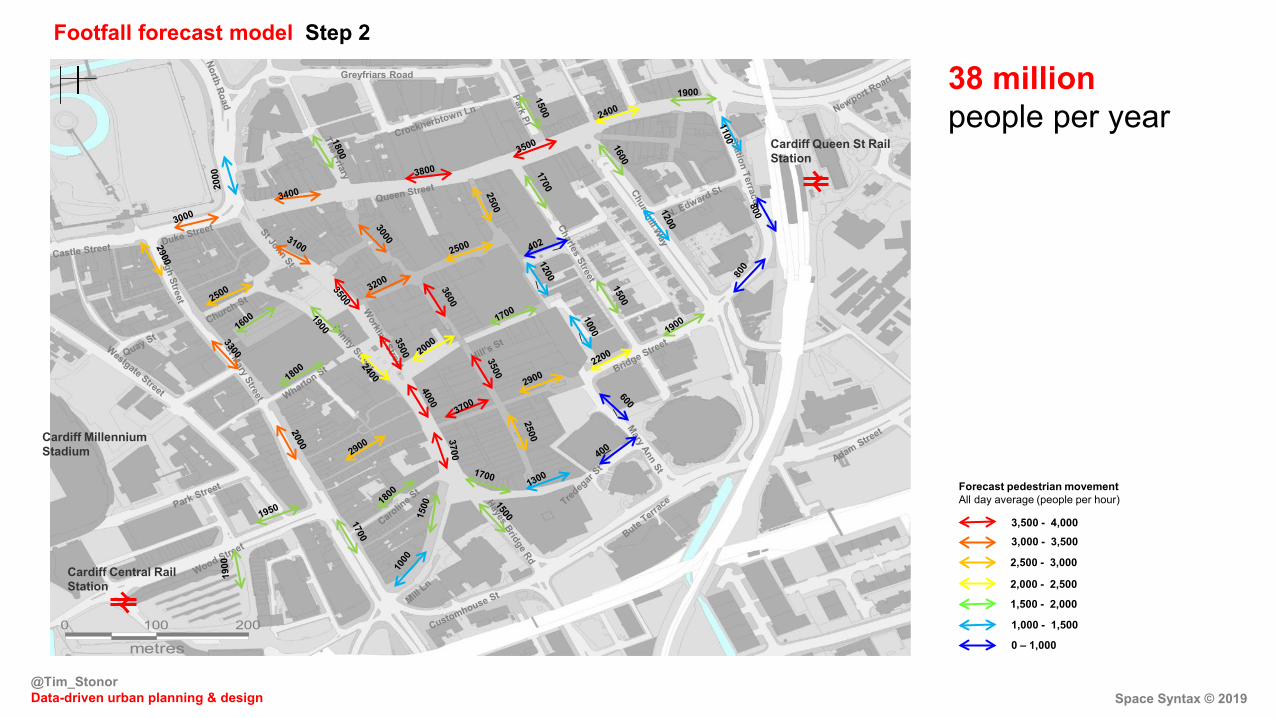
Forecast pedestrian movementAll day average (people per hour)
3,500 - 4,0003,000 - 3,500
2,500 - 3,000
2,000 - 2,500
1,500 - 2,000
1,000 - 1,500
0 – 1,000
\
\
\
Cardiff Central Rail Station
Cardiff Queen St Rail Station
Cardiff Millennium Stadium
Footfall forecast model Step 2
38 million people per year
Space Syntax © 2019@Tim_StonorData-driven urban planning & design
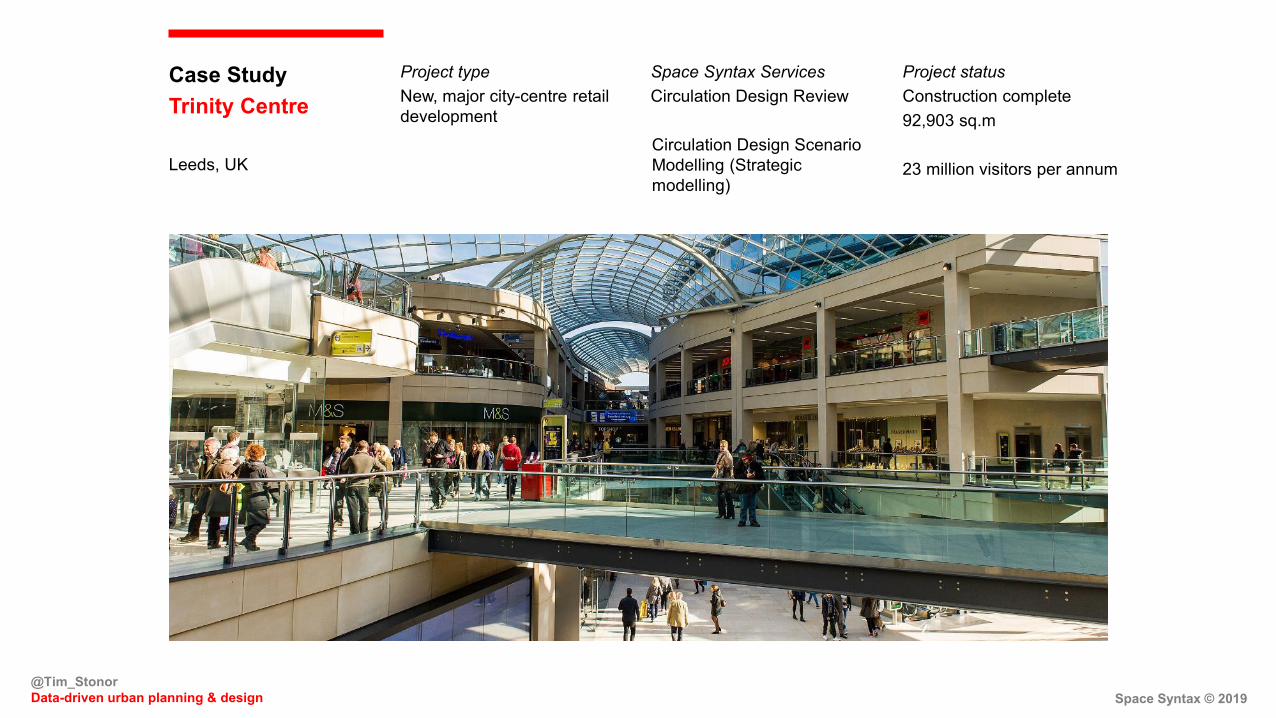
Case Study Trinity Centre
Leeds, UK
Space Syntax ServicesCirculation Design Review
Circulation Design Scenario Modelling (Strategic modelling)
Project statusConstruction complete92,903 sq.m
23 million visitors per annum
Project typeNew, major city-centre retail development
0 25 50
metres
Albi
on S
tree
t
Mill
Hill
Brig
gate
Mill Hill Chapel
Space Syntax © 2019@Tim_StonorData-driven urban planning & design
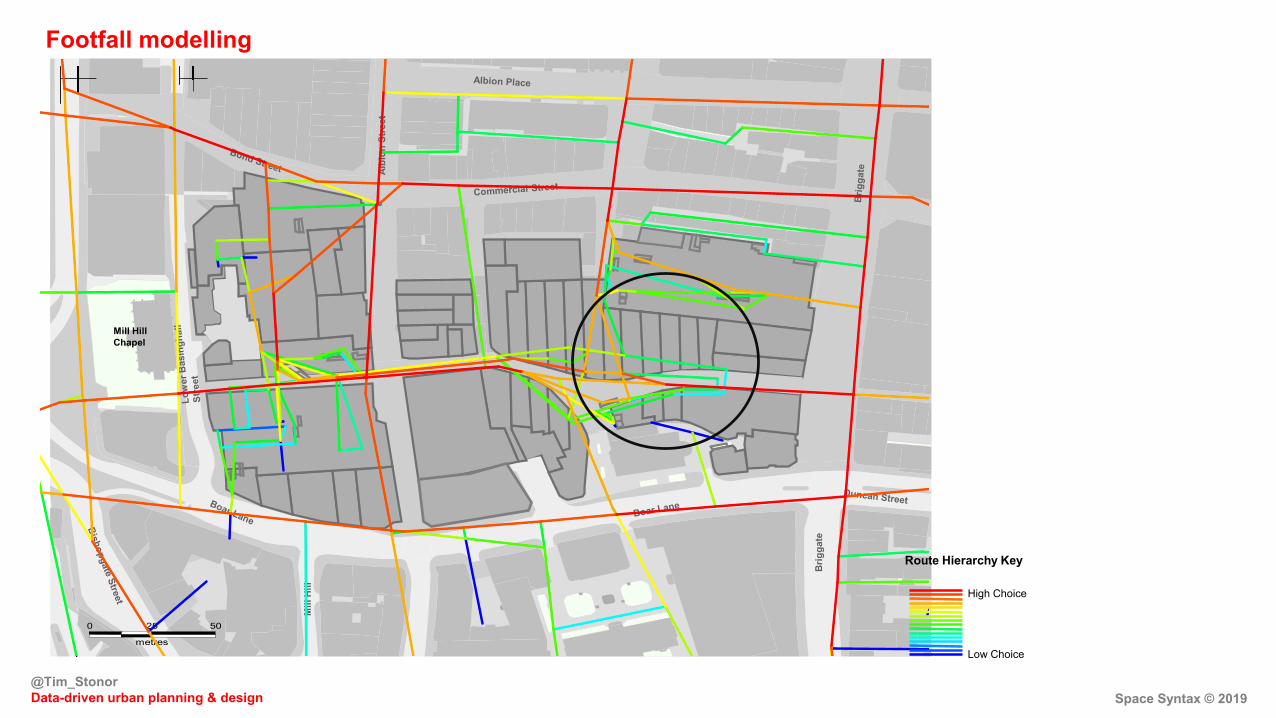
Route Hierarchy Key
High Choice
Low Choice
Footfall modelling
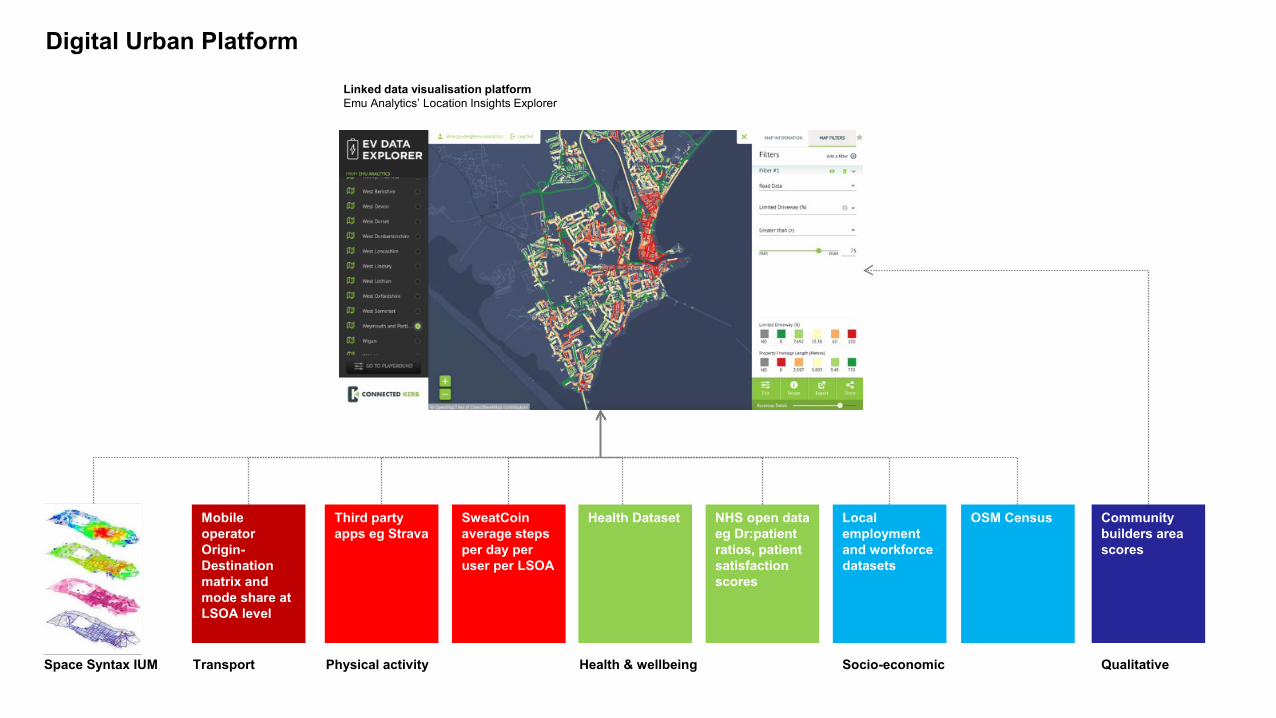
Space Syntax IUM Transport
Mobile operator Origin-Destination matrix and mode share at LSOA level
Physical activity
Third party apps eg Strava
SweatCoinaverage steps per day per user per LSOA
Health & wellbeing
Health Dataset NHS open data eg Dr:patientratios, patient satisfaction scores
Socio-economic
Local employment and workforce datasets
OSM Census
Qualitative
Community builders area scores
Linked data visualisation platformEmu Analytics’ Location Insights Explorer
Digital Urban Platform