Embed Size (px)
Citation preview

The 24th International Conference on Auditory Display (ICAD 2018) June 10 -15 2018, Michigan Technological University
DATA-DRIVEN SONIFICATION OF CFD ANEURYSM MODELS
Daniel E. MacDonaldUniversity of Toronto
Biomedical Simulation LaboratoryToronto, Canada
Thangam NatarajanUniversity of Toronto
Biomedical Simulation LaboratoryToronto, Canada
Richard C. WindeyerUniversity of Toronto
Centre for Drama, Theatre,and Performance Studies
Toronto, [email protected]
Peter CoppinOCAD University
Perceptual Artifacts LabToronto, Canada
David A. SteinmanUniversity of Toronto
Biomedical Simulation LaboratoryToronto, Canada
ABSTRACT
A novel method is presented for inspecting and characteriz-ing turbulent-like hemodynamic structures in intracranial cerebralaneurysms by sonification of data generated using ComputationalFluid Dynamics (CFD). The intention of the current research isto intuitively communicate flow complexity by augmenting con-ventional flow visualizations with data-driven sound, thereby in-creasing the ease of interpretation of dense spatiotemporal datathrough multimodal presentation. The described implementationallows the user to listen to flow fluctuations thought to indicateturbulent-like blood flow patterns that are often visually difficultto discriminate in conventional flow visualizations.
1. INTRODUCTION
1.1. Aneurysms and sounds
A cerebral aneurysm is the localized bulging of a weakened arterywall within the brain. Often, no symptoms of the aneurysm arepresent in unruptured cerebral aneurysms. An estimated 2-5% ofadults harbour an aneurysm, of which the risk of rupture per yearis approximately 1%. Of ruptured aneurysms, 40% are fatal [1].Rupture occurs when the stresses exerted on the artery wall exceedthe strength of the wall.
Blood flow patterns (hemodynamics) are thought to contributeto the initiation, growth, and rupture of intracranial aneurysms [2],by stimulating degenerative remodelling (weakening) of the arterywall. Because the forces associated with these flows are diffi-cult to measure non-invasively using current technologies, medicalimage-based CFD has been used to investigate these hemodynamicforces retroactively [2, 3, 4]. Using digitized patient-specific vas-culature models extracted using 3D angiography techniques, bloodflow is simulated using advanced numerical methods. The resultsof such simulations are typically visualized as part of the processof data analysis.
These previous investigations have revealed turbulent-likeflow instabilities within aneurysms or the vessels that host them,
This work is licensed under Creative Commons AttributionNon Commercial 4.0 International License. The full terms of the Licenseare available at http://creativecommons.org/licenses/by-nc/4.0This research was funded by the Canadian Natural Sciences and Engineer-ing Research Council, the Social Sciences and Humanities Research Coun-cil, and the Heart & Stroke Foundation.
with implications for aneurysm rupture and initiation [2, 3]. Suchinstabilities are typically represented through conventional visual-ization paradigms (glyphs, streamlines, isosurfaces), and thoughthese can provide tangible and intuitive representations of thehemodynamics, visual differences among unstable laminar, transi-tional, and turbulent flow regimes in complex vascular geometriesare often indiscernible. In this context, a novel method originallyinspired by Doppler ultrasound auscultation is presented for com-municating the nature of the flow by augmenting conventional flowvisualizations with data-driven sound (sonification).
Auscultation refers to the established medical technique of lis-tening to the sounds of the body for evaluation purposes [5]. Forexample, clinicians are trained to identify turbulent blood flowsby recognizing auditory properties of duration, quality, and timingduring examination of bruits in the carotid artery [5]. Doppler aus-cultation has been used in preliminary stages to listen to valvularmovements and blood flow velocity sounds during cardiac exami-nation, resolving sounds undetected by stethoscope [6], though toour knowledge, this technique has not been demonstrated on in-tracranial aneurysms.
Intracranial saccular aneurysms have been observed to emitacoustic signals (bruits) as a result of fluctuating hemodynamicflows thought to be characterized as turbulent-like [7, 8, 9]. Thesevibrations are difficult to measure in vivo due to difficulty differ-entiating these bruits from other bodily sounds, and as such are nota reliable source of diagnostic information [8].
Inspired by these techniques, we present a method for sonify-ing numerically simulated flow of intracranial aneurysms for thepurposes of identifying hemodynamic flow complexity during theprocess of flow visualization.
1.2. Conventional visualization of CFD data
Standard visualization techniques for representing multidimen-sional CFD datasets include static or animated views of isosur-face rendering, glyphs, or pathline and streamline representations.Fig. 1 shows these conventional representations applied to our in-tracranial aneurysm CFD data set.
Particle pathline animations from CFD data provides a tangi-ble representation of fluid flow and are often in good agreementwith our intuitive understanding of structure and movement. Dueto the large number of particles required to represent the spatiotem-poral flow, the visual difference between laminar, transitional, andturbulent flow is difficult to discern - all may look chaotic, but each
The 24th International Conference on Auditory Display (ICAD 2018) June 10 -15 2018, Michigan Technological University
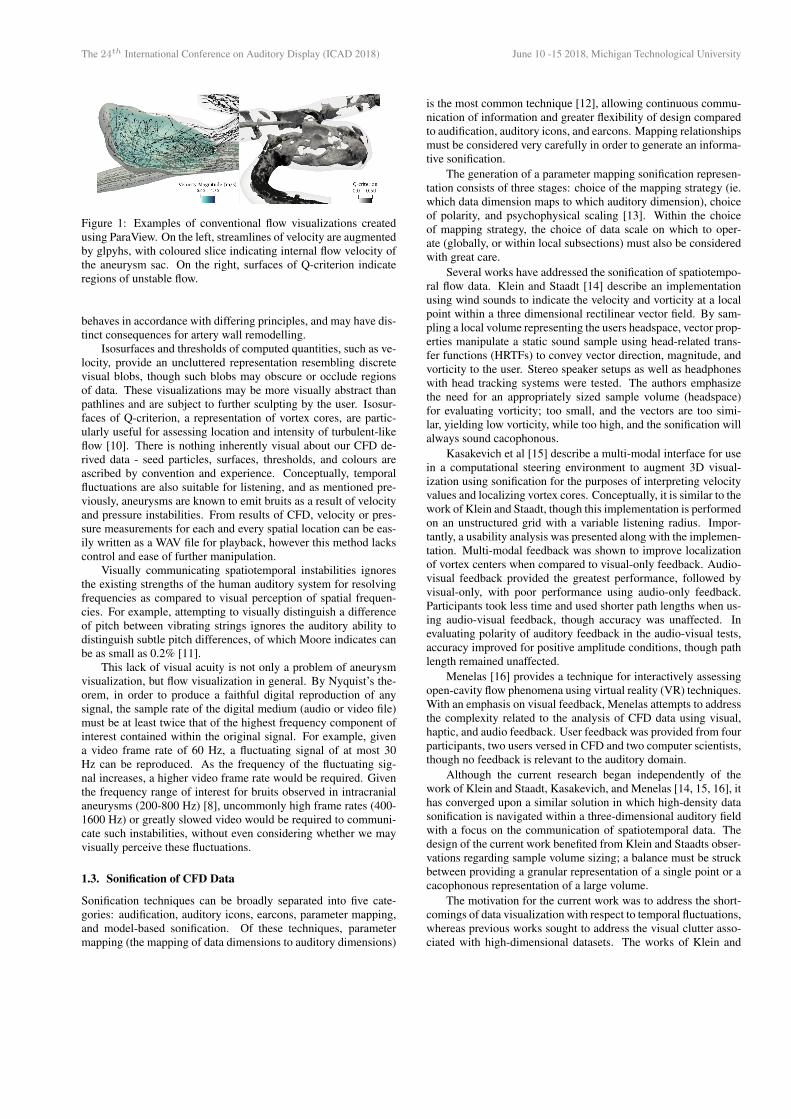
Figure 1: Examples of conventional flow visualizations createdusing ParaView. On the left, streamlines of velocity are augmentedby glpyhs, with coloured slice indicating internal flow velocity ofthe aneurysm sac. On the right, surfaces of Q-criterion indicateregions of unstable flow.
behaves in accordance with differing principles, and may have dis-tinct consequences for artery wall remodelling.
Isosurfaces and thresholds of computed quantities, such as ve-locity, provide an uncluttered representation resembling discretevisual blobs, though such blobs may obscure or occlude regionsof data. These visualizations may be more visually abstract thanpathlines and are subject to further sculpting by the user. Isosur-faces of Q-criterion, a representation of vortex cores, are partic-ularly useful for assessing location and intensity of turbulent-likeflow [10]. There is nothing inherently visual about our CFD de-rived data - seed particles, surfaces, thresholds, and colours areascribed by convention and experience. Conceptually, temporalfluctuations are also suitable for listening, and as mentioned pre-viously, aneurysms are known to emit bruits as a result of velocityand pressure instabilities. From results of CFD, velocity or pres-sure measurements for each and every spatial location can be eas-ily written as a WAV file for playback, however this method lackscontrol and ease of further manipulation.
Visually communicating spatiotemporal instabilities ignoresthe existing strengths of the human auditory system for resolvingfrequencies as compared to visual perception of spatial frequen-cies. For example, attempting to visually distinguish a differenceof pitch between vibrating strings ignores the auditory ability todistinguish subtle pitch differences, of which Moore indicates canbe as small as 0.2% [11].
This lack of visual acuity is not only a problem of aneurysmvisualization, but flow visualization in general. By Nyquist’s the-orem, in order to produce a faithful digital reproduction of anysignal, the sample rate of the digital medium (audio or video file)must be at least twice that of the highest frequency component ofinterest contained within the original signal. For example, givena video frame rate of 60 Hz, a fluctuating signal of at most 30Hz can be reproduced. As the frequency of the fluctuating sig-nal increases, a higher video frame rate would be required. Giventhe frequency range of interest for bruits observed in intracranialaneurysms (200-800 Hz) [8], uncommonly high frame rates (400-1600 Hz) or greatly slowed video would be required to communi-cate such instabilities, without even considering whether we mayvisually perceive these fluctuations.
1.3. Sonification of CFD Data
Sonification techniques can be broadly separated into five cate-gories: audification, auditory icons, earcons, parameter mapping,and model-based sonification. Of these techniques, parametermapping (the mapping of data dimensions to auditory dimensions)
is the most common technique [12], allowing continuous commu-nication of information and greater flexibility of design comparedto audification, auditory icons, and earcons. Mapping relationshipsmust be considered very carefully in order to generate an informa-tive sonification.
The generation of a parameter mapping sonification represen-tation consists of three stages: choice of the mapping strategy (ie.which data dimension maps to which auditory dimension), choiceof polarity, and psychophysical scaling [13]. Within the choiceof mapping strategy, the choice of data scale on which to oper-ate (globally, or within local subsections) must also be consideredwith great care.
Several works have addressed the sonification of spatiotempo-ral flow data. Klein and Staadt [14] describe an implementationusing wind sounds to indicate the velocity and vorticity at a localpoint within a three dimensional rectilinear vector field. By sam-pling a local volume representing the users headspace, vector prop-erties manipulate a static sound sample using head-related trans-fer functions (HRTFs) to convey vector direction, magnitude, andvorticity to the user. Stereo speaker setups as well as headphoneswith head tracking systems were tested. The authors emphasizethe need for an appropriately sized sample volume (headspace)for evaluating vorticity; too small, and the vectors are too simi-lar, yielding low vorticity, while too high, and the sonification willalways sound cacophonous.
Kasakevich et al [15] describe a multi-modal interface for usein a computational steering environment to augment 3D visual-ization using sonification for the purposes of interpreting velocityvalues and localizing vortex cores. Conceptually, it is similar to thework of Klein and Staadt, though this implementation is performedon an unstructured grid with a variable listening radius. Impor-tantly, a usability analysis was presented along with the implemen-tation. Multi-modal feedback was shown to improve localizationof vortex centers when compared to visual-only feedback. Audio-visual feedback provided the greatest performance, followed byvisual-only, with poor performance using audio-only feedback.Participants took less time and used shorter path lengths when us-ing audio-visual feedback, though accuracy was unaffected. Inevaluating polarity of auditory feedback in the audio-visual tests,accuracy improved for positive amplitude conditions, though pathlength remained unaffected.
Menelas [16] provides a technique for interactively assessingopen-cavity flow phenomena using virtual reality (VR) techniques.With an emphasis on visual feedback, Menelas attempts to addressthe complexity related to the analysis of CFD data using visual,haptic, and audio feedback. User feedback was provided from fourparticipants, two users versed in CFD and two computer scientists,though no feedback is relevant to the auditory domain.
Although the current research began independently of thework of Klein and Staadt, Kasakevich, and Menelas [14, 15, 16], ithas converged upon a similar solution in which high-density datasonification is navigated within a three-dimensional auditory fieldwith a focus on the communication of spatiotemporal data. Thedesign of the current work benefited from Klein and Staadts obser-vations regarding sample volume sizing; a balance must be struckbetween providing a granular representation of a single point or acacophonous representation of a large volume.
The motivation for the current work was to address the short-comings of data visualization with respect to temporal fluctuations,whereas previous works sought to address the visual clutter asso-ciated with high-dimensional datasets. The works of Klein and
The 24th International Conference on Auditory Display (ICAD 2018) June 10 -15 2018, Michigan Technological University
Staadt, Kasakevich, and Menelas directly communicate time do-main values, such as velocity of flow, in order to reduce the strainon visual bandwidth by mapping magnitude of vectors directly toamplitude or filter cutoff [14, 15, 16]. For those previous works,this is suitable, allowing the user to directly query the data and re-ceive auditory feedback proportional to the measured data. Ratherthan communicating vector magnitude, the current research seeksto sonify the temporal evolution of the vector, particularly the com-plexity of instability through time. For example, a region of highflow velocity that is stable in time may indicate a region of lowcomplexity, while a slow-moving but unsteady flow may indicatea region of high complexity.
The current work seeks to decompose the time domain values(velocity) in the frequency domain in order to discriminate regionsof unstable flow. The current method allows inspection of individ-ual frequency bands independently. Although point vector valuesremain the basis for our current work, the frequency domain pro-cessing between these vector values and the audio output distin-guishes the current research from previous works. By sonifyingthe spectrogram, the envelope shape (percussive or smooth nature)is communicated along with spectral content.
Additionally, the flow is pulsatile, indicating that greater con-sideration should be given to the evolution of the signal througheach period, i.e., cardiac cycle. The temporal resolution of the datais therefore considered very important in order to perform mean-ingful manipulations in the frequency domain, and as such is finerthan previous works. In combination with use of a fine, unstruc-tured mesh, our datasets tend to be large and unwieldy, with num-ber of points on the order of hundreds of thousands or millions,and temporal resolutions on the order of milliseconds.
2. METHOD
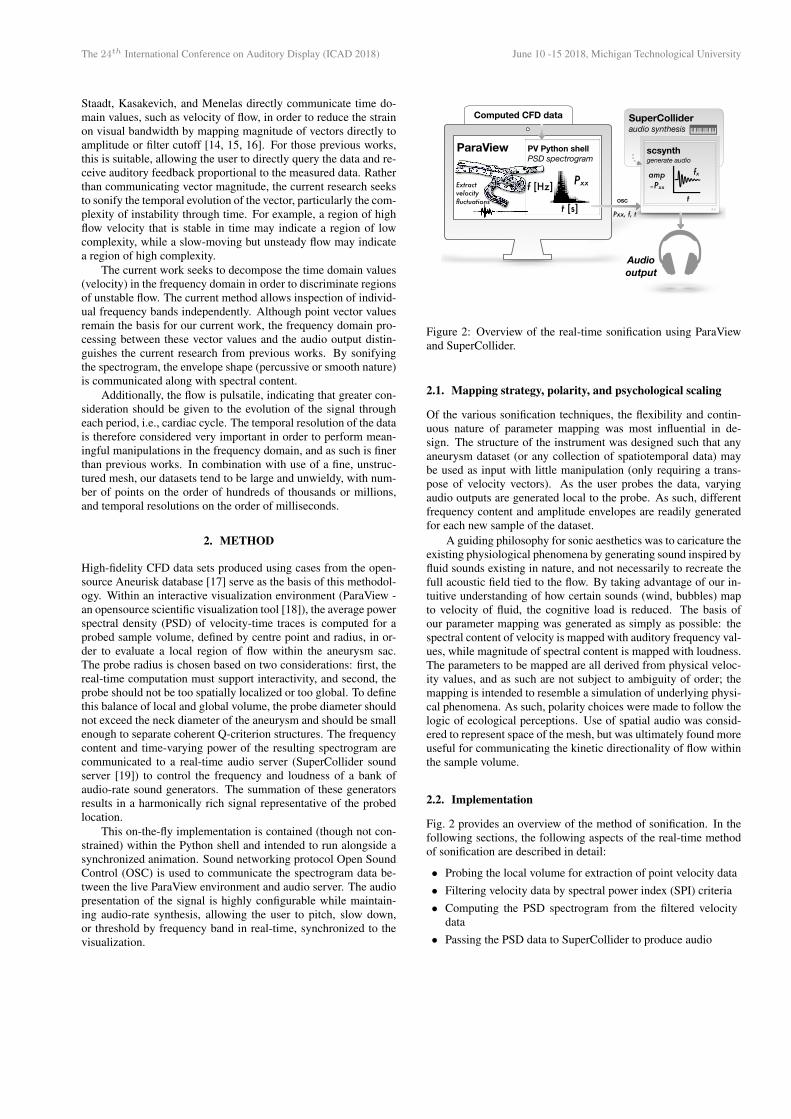
High-fidelity CFD data sets produced using cases from the open-source Aneurisk database [17] serve as the basis of this methodol-ogy. Within an interactive visualization environment (ParaView -an opensource scientific visualization tool [18]), the average powerspectral density (PSD) of velocity-time traces is computed for aprobed sample volume, defined by centre point and radius, in or-der to evaluate a local region of flow within the aneurysm sac.The probe radius is chosen based on two considerations: first, thereal-time computation must support interactivity, and second, theprobe should not be too spatially localized or too global. To definethis balance of local and global volume, the probe diameter shouldnot exceed the neck diameter of the aneurysm and should be smallenough to separate coherent Q-criterion structures. The frequencycontent and time-varying power of the resulting spectrogram arecommunicated to a real-time audio server (SuperCollider soundserver [19]) to control the frequency and loudness of a bank ofaudio-rate sound generators. The summation of these generatorsresults in a harmonically rich signal representative of the probedlocation.
This on-the-fly implementation is contained (though not con-strained) within the Python shell and intended to run alongside asynchronized animation. Sound networking protocol Open SoundControl (OSC) is used to communicate the spectrogram data be-tween the live ParaView environment and audio server. The audiopresentation of the signal is highly configurable while maintain-ing audio-rate synthesis, allowing the user to pitch, slow down,or threshold by frequency band in real-time, synchronized to thevisualization.
PV Python shell PSD spectrogram
ParaView
f [Hz]
t [s]
Extract velocity fluctuations
Pxx
Audio output
OSC
Pxx, f, t
scsynth generate audio
fx
t
amp ∝Pxx
SuperCollider audio synthesis
Computed CFD data
Figure 2: Overview of the real-time sonification using ParaViewand SuperCollider.
2.1. Mapping strategy, polarity, and psychological scaling
Of the various sonification techniques, the flexibility and contin-uous nature of parameter mapping was most influential in de-sign. The structure of the instrument was designed such that anyaneurysm dataset (or any collection of spatiotemporal data) maybe used as input with little manipulation (only requiring a trans-pose of velocity vectors). As the user probes the data, varyingaudio outputs are generated local to the probe. As such, differentfrequency content and amplitude envelopes are readily generatedfor each new sample of the dataset.
A guiding philosophy for sonic aesthetics was to caricature theexisting physiological phenomena by generating sound inspired byfluid sounds existing in nature, and not necessarily to recreate thefull acoustic field tied to the flow. By taking advantage of our in-tuitive understanding of how certain sounds (wind, bubbles) mapto velocity of fluid, the cognitive load is reduced. The basis ofour parameter mapping was generated as simply as possible: thespectral content of velocity is mapped with auditory frequency val-ues, while magnitude of spectral content is mapped with loudness.The parameters to be mapped are all derived from physical veloc-ity values, and as such are not subject to ambiguity of order; themapping is intended to resemble a simulation of underlying physi-cal phenomena. As such, polarity choices were made to follow thelogic of ecological perceptions. Use of spatial audio was consid-ered to represent space of the mesh, but was ultimately found moreuseful for communicating the kinetic directionality of flow withinthe sample volume.
2.2. Implementation
Fig. 2 provides an overview of the method of sonification. In thefollowing sections, the following aspects of the real-time methodof sonification are described in detail:
• Probing the local volume for extraction of point velocity data• Filtering velocity data by spectral power index (SPI) criteria• Computing the PSD spectrogram from the filtered velocity
data• Passing the PSD data to SuperCollider to produce audio
The 24th International Conference on Auditory Display (ICAD 2018) June 10 -15 2018, Michigan Technological University
0.0 0.2 0.4 0.6 0.8 1.0Time (seconds)
0.2
0.0
0.2
0.4
0.6
0.8V
eloc
ity (m
/s)
UnfilteredWindowed, filtered
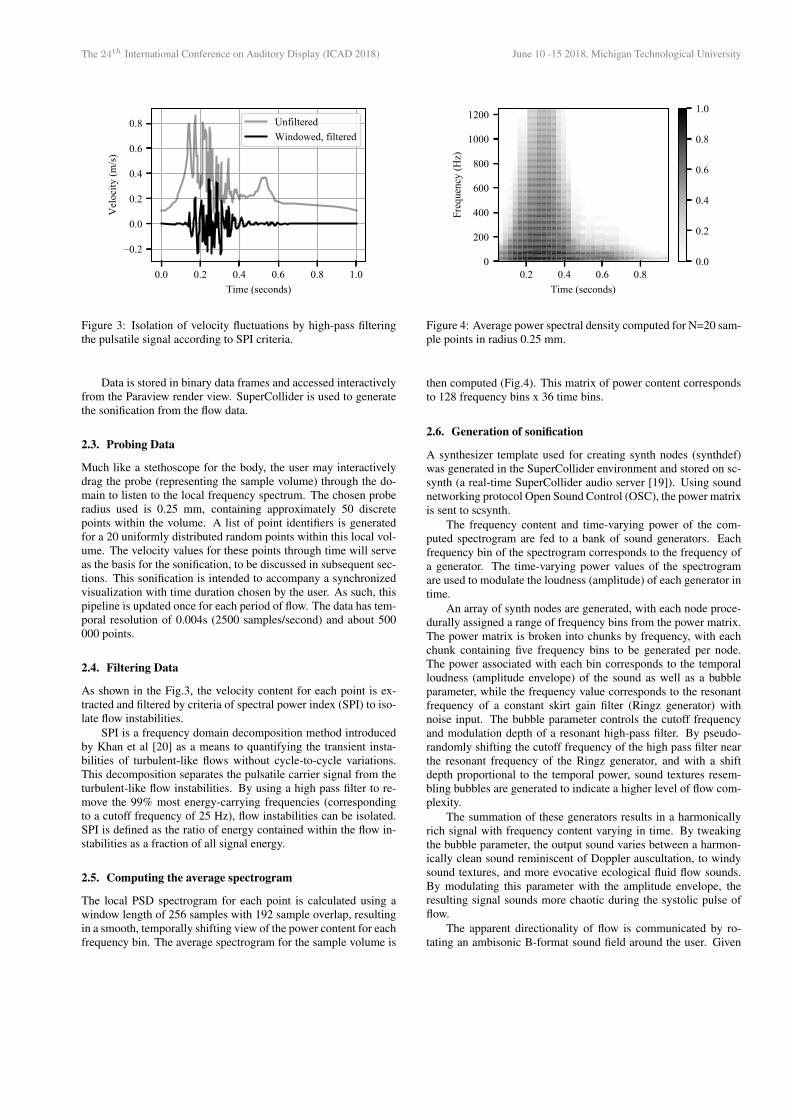
Figure 3: Isolation of velocity fluctuations by high-pass filteringthe pulsatile signal according to SPI criteria.
Data is stored in binary data frames and accessed interactivelyfrom the Paraview render view. SuperCollider is used to generatethe sonification from the flow data.
2.3. Probing Data
Much like a stethoscope for the body, the user may interactivelydrag the probe (representing the sample volume) through the do-main to listen to the local frequency spectrum. The chosen proberadius used is 0.25 mm, containing approximately 50 discretepoints within the volume. A list of point identifiers is generatedfor a 20 uniformly distributed random points within this local vol-ume. The velocity values for these points through time will serveas the basis for the sonification, to be discussed in subsequent sec-tions. This sonification is intended to accompany a synchronizedvisualization with time duration chosen by the user. As such, thispipeline is updated once for each period of flow. The data has tem-poral resolution of 0.004s (2500 samples/second) and about 500000 points.
2.4. Filtering Data
As shown in the Fig.3, the velocity content for each point is ex-tracted and filtered by criteria of spectral power index (SPI) to iso-late flow instabilities.
SPI is a frequency domain decomposition method introducedby Khan et al [20] as a means to quantifying the transient insta-bilities of turbulent-like flows without cycle-to-cycle variations.This decomposition separates the pulsatile carrier signal from theturbulent-like flow instabilities. By using a high pass filter to re-move the 99% most energy-carrying frequencies (correspondingto a cutoff frequency of 25 Hz), flow instabilities can be isolated.SPI is defined as the ratio of energy contained within the flow in-stabilities as a fraction of all signal energy.
2.5. Computing the average spectrogram
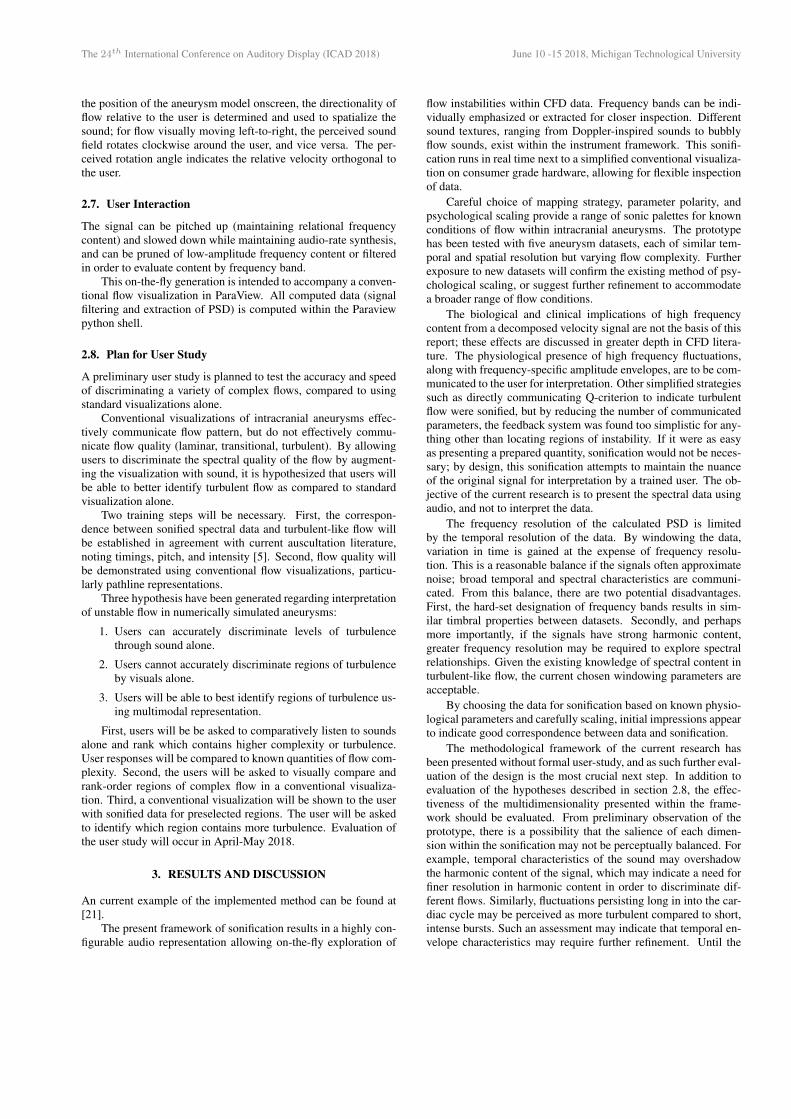
The local PSD spectrogram for each point is calculated using awindow length of 256 samples with 192 sample overlap, resultingin a smooth, temporally shifting view of the power content for eachfrequency bin. The average spectrogram for the sample volume is
0.2 0.4 0.6 0.8Time (seconds)
0
200
400
600
800
1000
1200
Freq
uenc
y (H
z)
0.0
0.2
0.4
0.6
0.8
1.0
Figure 4: Average power spectral density computed for N=20 sam-ple points in radius 0.25 mm.
then computed (Fig.4). This matrix of power content correspondsto 128 frequency bins x 36 time bins.
2.6. Generation of sonification
A synthesizer template used for creating synth nodes (synthdef)was generated in the SuperCollider environment and stored on sc-synth (a real-time SuperCollider audio server [19]). Using soundnetworking protocol Open Sound Control (OSC), the power matrixis sent to scsynth.
The frequency content and time-varying power of the com-puted spectrogram are fed to a bank of sound generators. Eachfrequency bin of the spectrogram corresponds to the frequency ofa generator. The time-varying power values of the spectrogramare used to modulate the loudness (amplitude) of each generator intime.
An array of synth nodes are generated, with each node proce-durally assigned a range of frequency bins from the power matrix.The power matrix is broken into chunks by frequency, with eachchunk containing five frequency bins to be generated per node.The power associated with each bin corresponds to the temporalloudness (amplitude envelope) of the sound as well as a bubbleparameter, while the frequency value corresponds to the resonantfrequency of a constant skirt gain filter (Ringz generator) withnoise input. The bubble parameter controls the cutoff frequencyand modulation depth of a resonant high-pass filter. By pseudo-randomly shifting the cutoff frequency of the high pass filter nearthe resonant frequency of the Ringz generator, and with a shiftdepth proportional to the temporal power, sound textures resem-bling bubbles are generated to indicate a higher level of flow com-plexity.
The summation of these generators results in a harmonicallyrich signal with frequency content varying in time. By tweakingthe bubble parameter, the output sound varies between a harmon-ically clean sound reminiscent of Doppler auscultation, to windysound textures, and more evocative ecological fluid flow sounds.By modulating this parameter with the amplitude envelope, theresulting signal sounds more chaotic during the systolic pulse offlow.
The apparent directionality of flow is communicated by ro-tating an ambisonic B-format sound field around the user. Given
The 24th International Conference on Auditory Display (ICAD 2018) June 10 -15 2018, Michigan Technological University
the position of the aneurysm model onscreen, the directionality offlow relative to the user is determined and used to spatialize thesound; for flow visually moving left-to-right, the perceived soundfield rotates clockwise around the user, and vice versa. The per-ceived rotation angle indicates the relative velocity orthogonal tothe user.
2.7. User Interaction
The signal can be pitched up (maintaining relational frequencycontent) and slowed down while maintaining audio-rate synthesis,and can be pruned of low-amplitude frequency content or filteredin order to evaluate content by frequency band.
This on-the-fly generation is intended to accompany a conven-tional flow visualization in ParaView. All computed data (signalfiltering and extraction of PSD) is computed within the Paraviewpython shell.
2.8. Plan for User Study
A preliminary user study is planned to test the accuracy and speedof discriminating a variety of complex flows, compared to usingstandard visualizations alone.
Conventional visualizations of intracranial aneurysms effec-tively communicate flow pattern, but do not effectively commu-nicate flow quality (laminar, transitional, turbulent). By allowingusers to discriminate the spectral quality of the flow by augment-ing the visualization with sound, it is hypothesized that users willbe able to better identify turbulent flow as compared to standardvisualization alone.
Two training steps will be necessary. First, the correspon-dence between sonified spectral data and turbulent-like flow willbe established in agreement with current auscultation literature,noting timings, pitch, and intensity [5]. Second, flow quality willbe demonstrated using conventional flow visualizations, particu-larly pathline representations.
Three hypothesis have been generated regarding interpretationof unstable flow in numerically simulated aneurysms:
1. Users can accurately discriminate levels of turbulencethrough sound alone.
2. Users cannot accurately discriminate regions of turbulenceby visuals alone.
3. Users will be able to best identify regions of turbulence us-ing multimodal representation.
First, users will be be asked to comparatively listen to soundsalone and rank which contains higher complexity or turbulence.User responses will be compared to known quantities of flow com-plexity. Second, the users will be asked to visually compare andrank-order regions of complex flow in a conventional visualiza-tion. Third, a conventional visualization will be shown to the userwith sonified data for preselected regions. The user will be askedto identify which region contains more turbulence. Evaluation ofthe user study will occur in April-May 2018.
3. RESULTS AND DISCUSSION
An current example of the implemented method can be found at[21].
The present framework of sonification results in a highly con-figurable audio representation allowing on-the-fly exploration of
flow instabilities within CFD data. Frequency bands can be indi-vidually emphasized or extracted for closer inspection. Differentsound textures, ranging from Doppler-inspired sounds to bubblyflow sounds, exist within the instrument framework. This sonifi-cation runs in real time next to a simplified conventional visualiza-tion on consumer grade hardware, allowing for flexible inspectionof data.
Careful choice of mapping strategy, parameter polarity, andpsychological scaling provide a range of sonic palettes for knownconditions of flow within intracranial aneurysms. The prototypehas been tested with five aneurysm datasets, each of similar tem-poral and spatial resolution but varying flow complexity. Furtherexposure to new datasets will confirm the existing method of psy-chological scaling, or suggest further refinement to accommodatea broader range of flow conditions.
The biological and clinical implications of high frequencycontent from a decomposed velocity signal are not the basis of thisreport; these effects are discussed in greater depth in CFD litera-ture. The physiological presence of high frequency fluctuations,along with frequency-specific amplitude envelopes, are to be com-municated to the user for interpretation. Other simplified strategiessuch as directly communicating Q-criterion to indicate turbulentflow were sonified, but by reducing the number of communicatedparameters, the feedback system was found too simplistic for any-thing other than locating regions of instability. If it were as easyas presenting a prepared quantity, sonification would not be neces-sary; by design, this sonification attempts to maintain the nuanceof the original signal for interpretation by a trained user. The ob-jective of the current research is to present the spectral data usingaudio, and not to interpret the data.
The frequency resolution of the calculated PSD is limitedby the temporal resolution of the data. By windowing the data,variation in time is gained at the expense of frequency resolu-tion. This is a reasonable balance if the signals often approximatenoise; broad temporal and spectral characteristics are communi-cated. From this balance, there are two potential disadvantages.First, the hard-set designation of frequency bands results in sim-ilar timbral properties between datasets. Secondly, and perhapsmore importantly, if the signals have strong harmonic content,greater frequency resolution may be required to explore spectralrelationships. Given the existing knowledge of spectral content inturbulent-like flow, the current chosen windowing parameters areacceptable.
By choosing the data for sonification based on known physio-logical parameters and carefully scaling, initial impressions appearto indicate good correspondence between data and sonification.
The methodological framework of the current research hasbeen presented without formal user-study, and as such further eval-uation of the design is the most crucial next step. In addition toevaluation of the hypotheses described in section 2.8, the effec-tiveness of the multidimensionality presented within the frame-work should be evaluated. From preliminary observation of theprototype, there is a possibility that the salience of each dimen-sion within the sonification may not be perceptually balanced. Forexample, temporal characteristics of the sound may overshadowthe harmonic content of the signal, which may indicate a need forfiner resolution in harmonic content in order to discriminate dif-ferent flows. Similarly, fluctuations persisting long in into the car-diac cycle may be perceived as more turbulent compared to short,intense bursts. Such an assessment may indicate that temporal en-velope characteristics may require further refinement. Until the
The 24th International Conference on Auditory Display (ICAD 2018) June 10 -15 2018, Michigan Technological University
framework is evaluated through user training and user study, theeffectiveness of this sonification can by only incompletely assessedbased on the design criteria of the authors.
A fundamental design limitation of the present framework liesin the ill-defined relationship between hemodynamic forces anddegenerative remodelling of the aneurysm wall [2]. As such, har-monic and temporal components of the decomposed flow data aretreated approximately equally to retain characteristics of the phys-ical phenomena.
This work extends previous sonifications of multidimensionalvector data by directly addressing the shortcomings of data vi-sualization with respect to temporal instability. This insight re-sulted from in-depth knowledge of the physical and simulatedhemodynamics specific to the current application of intracranialaneurysms.
The proposed method for interpreting cerebral flows is notlimited by application, and may be useful for other time-series spa-tial datasets containing instabilities. A similar implementation hasalso been tested in the 3D creation suite Blender [22], and wouldpresumably function in any other python-based environment.
4. CONCLUSIONS
A novel method for sonifying CFD data for the purpose of bettercommunicating high frequency fluctuations within simulated in-tracranial aneurysmal flows is described. This frequency-domainmethod is intended to augment conventional visualization in orderto ease the interpretation of dense spatiotemporal datasets by al-lowing the user to visually concentrate on one field while listeningto another. This method for data inspection builds on establishedanalysis of intracranial hemodynamics with a focus on real-timeinspection inspired by the existing field of auscultation.
5. REFERENCES
[1] “Brain aneurysm statistics and facts,” Web Site,2018. [Online]. Available: https://www.bafound.org/about-brain-aneurysms/brain-aneurysm-basics/brain-aneurysm-statistics-and-facts/
[2] K. Valen-Sendstad, K. A. Mardal, and D. A. Steinman,“High-resolution CFD detects high-frequency velocity fluc-tuations in bifurcation, but not sidewall, aneurysms,” Journalof Biomechanics, vol. 46, no. 2, pp. 402–407, 2013.
[3] K. Valen-Sendstad, M. Piccinelli, and D. A. Steinman,“High-resolution computational fluid dynamics detects flowinstabilities in the carotid siphon: Implications for aneurysminitiation and rupture?” Journal of Biomechanics, vol. 47,no. 12, pp. 3210–3216, 2014.
[4] N. Varble, J. Xiang, N. Lin, E. Levy, and H. Meng, “Flow In-stability Detected by High-Resolution Computational FluidDynamics in Fifty-Six Middle Cerebral Artery Aneurysms,”Journal of Biomechanical Engineering, no. 6, p. 061009.
[5] A. J. Taylor, Learning Cardiac Auscultation: From Essen-tials to Expert Clinical Interpretation. Springer.
[6] M. J. Mc Loughlin and S. Mc Loughlin, “Cardiac ausculta-tion: Preliminary findings of a pilot study using continuousWave Doppler and comparison with classic auscultation,” In-ternational Journal of Cardiology, no. 2, pp. 590–591.
[7] L. N. Sekhar, M. Sun, D. Bonaddio, and R. J. Sclabassi,“Acoustic recordings from experimental saccular aneurysmsin dogs.” Stroke, no. 8, pp. 1215–21.
[8] G. G. Ferguson, “Turbulence in human intracranial saccularaneurysms.” Journal of neurosurgery, no. 5, pp. 485–97.
[9] Y. Kurokawa, S. Abiko, and K. Watanabe, “NoninvasiveDetection of Intracranial Vascular-Lesions By RecordingBlood-Flow Sounds,” Stroke, vol. 25, no. 2, pp. 397–402,1994.
[10] G. Haller, “An objective definition of a vortex,” Journal ofFluid Mechanics, vol. 525, pp. 1–26, 2005.
[11] B. C. J. Moore, “Frequency difference limens for short dura-tion tones,” The Journal of the Acoustical Society of America,no. 3, pp. 610–619.
[12] G. Dubus and R. Bresin, “A systematic review of mappingstrategies for the sonification of physical quantities,” PLoSONE, vol. 8, no. 12, 2013.
[13] T. Hermann, A. Hunt, and J. G. Neuhoff, The SonificationHandbook, 2011.
[14] E. Klein and O. G. Staadt, “Sonification of three-dimensionalvector fields,” in Proceedings of the 12th SCS High Perfor-mance Computing Symposium (HPC 2004), part of the SCSAdvanced Simulation Technologies Conference (ASTC’04),2004.
[15] M. Kasakevich, P. Boulanger, W. F. Bischof, and M. Garcia,“Augmentation of Visualisation Using Sonification : A CaseStudy in Computational Fluid Dynamics,” IPT-EGVE Sym-posium, 2007.
[16] B.-A. J. Menelas, “Interactive analysis of cavity-flows in avirtual environment,” Proceedings of the 28th Spring Con-ference on Computer Graphics, pp. 31–38, 2012.
[17] Aneurisk-Team, “AneuriskWeb project website,http://ecm2.mathcs.emory.edu/aneuriskweb,” Web Site,2012. [Online]. Available: http://ecm2.mathcs.emory.edu/aneuriskweb
[18] U. Ayachit, “The ParaView Guide: A Parallel VisualizationApplication,” Kitware.
[19] J. McCartney, SuperCollider, 2018. [Online]. Available:https://supercollider.github.io
[20] M. O. Khan, C. Chnafa, D. Gallo, F. Molinari, U. Mor-biducci, D. A. Steinman, and K. Valen-Sendstad, “On thequantification and visualization of transient periodic insta-bilities in pulsatile flows,” Journal of Biomechanics, vol. 52,pp. 179–182, 2017.
[21] D. MacDonald, Sonification of flow instabilities in in-tracranial aneurysms, Biomedical Simulation Labora-tory, University of Toronto, 2018. [Online]. Available:https://www.youtube.com/watch?v=UmDvnPjnpV4
[22] Blender Online Community, Blender - a 3D modellingand rendering package, Blender Foundation, BlenderInstitute, Amsterdam, 2017. [Online]. Available: http://www.blender.org