Embed Size (px)
Citation preview
Data Driven Mobile Networks
Sachin KattiStanford University
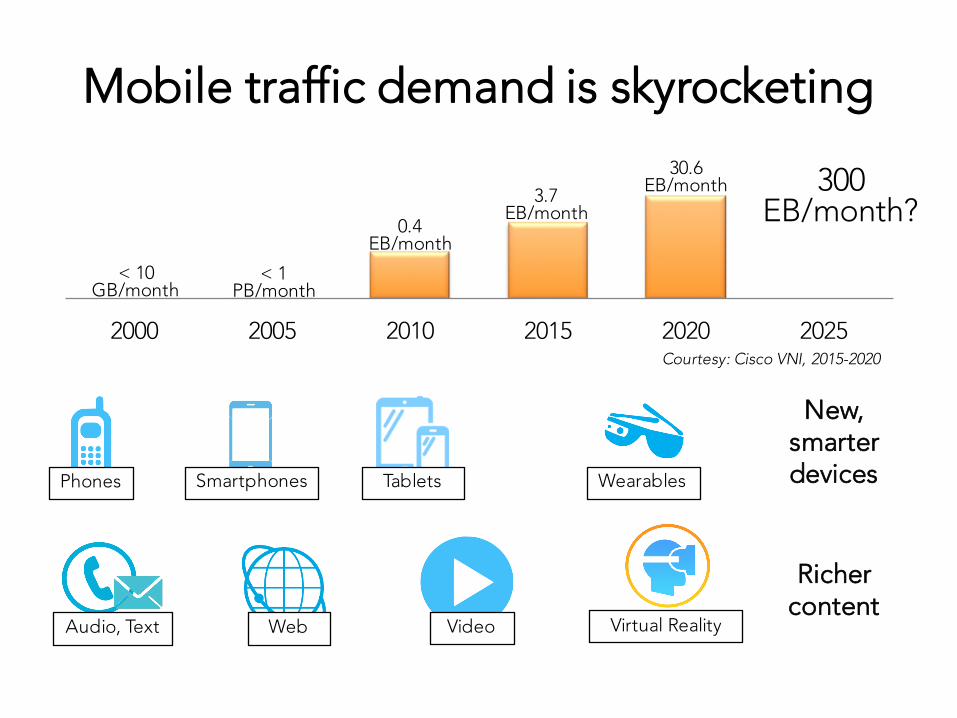
Mobile traffic demand is skyrocketing
2000 2005 2010 2015 2020 2025
3.7 EB/month
30.6 EB/month
0.4 EB/month
< 1 PB/month
300 EB/month?
Richer content
New, smarter devicesPhones Smartphones Tablets Wearables
Audio, Text Web Video Virtual Reality
< 10 GB/month
Courtesy: Cisco VNI, 2015-2020

How will mobile networks meet this surging traffic demand?
Densification will bring the next wave of capacity scaling in mobile access networks
Spectral efficiency
Densification
Spectrum
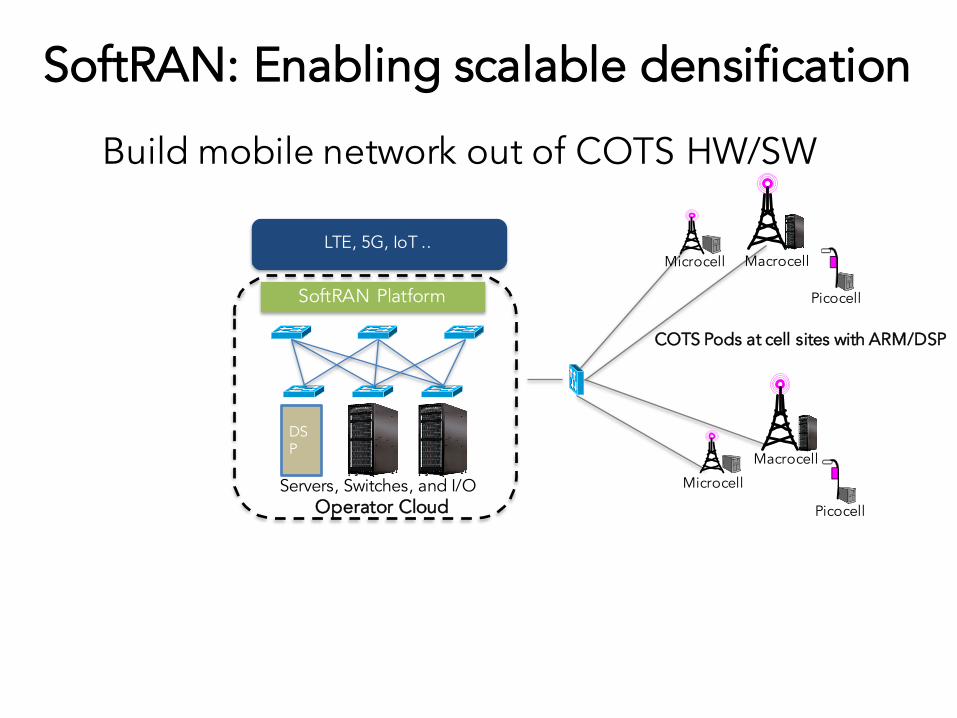
SoftRAN: Enabling scalable densification
Operator Cloud
COTS Pods at cell sites with ARM/DSP
DSP
SoftRAN Platform
LTE, 5G, IoT ..
Servers, Switches, and I/O
Build mobile network out of COTS HW/SW
Macrocell
Picocell
Microcell
Macrocell
Picocell
Microcell

SoftRAN: Decoupled Control Plane
5
5G, LTE-A, WiFi User/Data Planes
SoftRAN Connectivity Substrate
DSP
Commodity Servers, Switches, and I/O
Macrocell
Picocell
Microcell
Macrocell
PicocellMicrocell
5G, LTE-A, WiFi Control Planes
SoftRAN Network OS
SDN’s dirty secret: How to build the control plane?

Densification à Complex Control Planes
For densification to scale, networks need to proactively manage load, interference and mobility to optimize user experience
Load (demand) and other factors (e.g interference, mobility) become highly dynamic
à need to be proactively managed
E.g: Cells can offload users to less-congested neighbors to balance load,
need to know expected user experience

Why is this challenging?
Existing approachesAggregate cell-level counters
blind to dynamism across time and users;reactive
Need to predict user performance every ~1sfor the best load distribution
ChallengeUser performance is hard to predictComplex function of many, potentially unknown and/or dynamic, network variables
Need to predict user experience in advance,hard in practical networks with many unknown/dynamic variables
To packet core
13:00 14:00 15:00 16:00
05
1015
TIME
LOA
D (i
n M
B p
er s
econ
d)
13:00 14:00 15:00 16:00
05
1015
TIME
LOA
D (i
n M
B p
er s
econ
d)
0 10 20 30 40
01
23
4
USER #
LOAD
(in
MB)
Dedicated fiber/micro
wave
Public Internet

What do we need today to enable wide-scale densification?
Can we leverage a data driven approach to tackle this challenge?
without making invasive changes to existing network infrastructure
Predict user performance to know if and why user QoE will deteriorate before it happens
Coordinate across cells in real timeto proactively balance load, manage interference …
SoftRAN’s Network OS: ForeCData-driven control substrate
in dense mobile networks
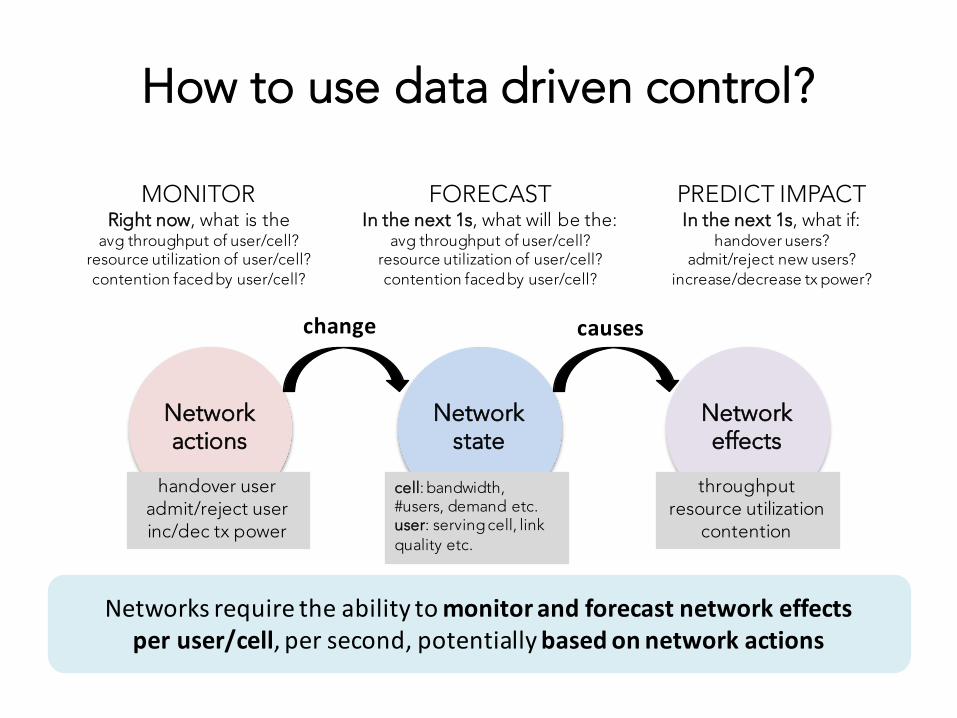
How to use data driven control?
Network effects
Network state
Network actions
change causes
Networks require the ability to monitor and forecast network effects per user/cell, per second, potentially based on network actions
MONITORRight now, what is the
avg throughput of user/cell?resource utilization of user/cell?contention faced by user/cell?
FORECASTIn the next 1s, what will be the:
avg throughput of user/cell?resource utilization of user/cell?contention faced by user/cell?
PREDICT IMPACTIn the next 1s, what if:
handover users?admit/reject new users?
increase/decrease tx power?
throughputresource utilization
contention
handover useradmit/reject userinc/dec tx power
cell: bandwidth, #users, demand etc.user: serving cell, link quality etc.
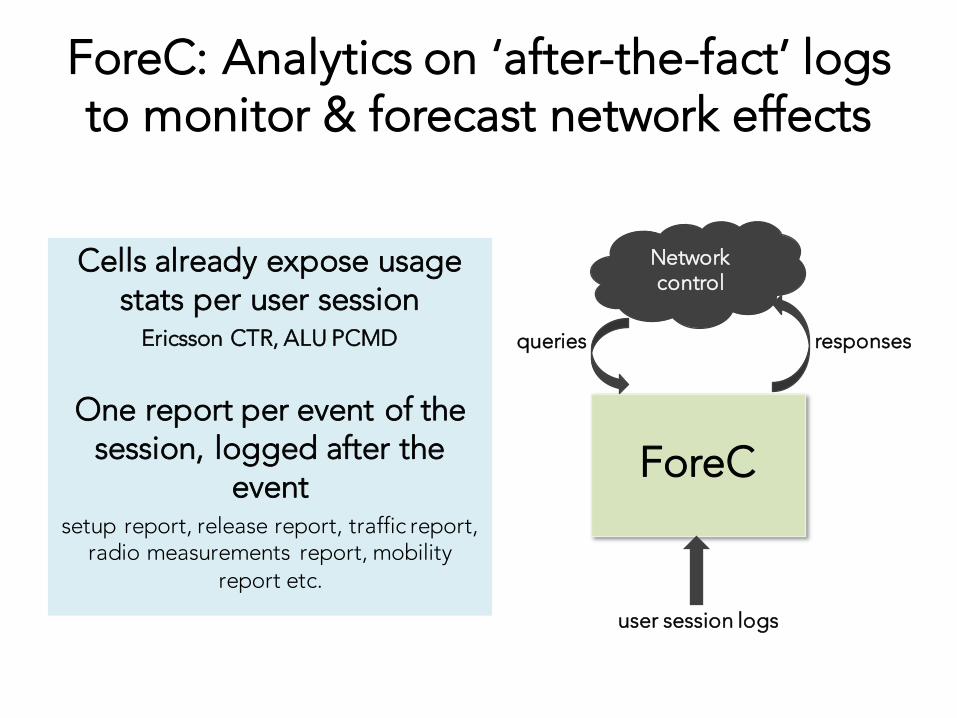
ForeC: Analytics on ‘after-the-fact’ logs to monitor & forecast network effects
ForeC
user session logs
queries responses
Network control
Cells already expose usage stats per user session
Ericsson CTR, ALU PCMD
One report per event of the session, logged after the
eventsetup report, release report, traffic report,
radio measurements report, mobility report etc.

ForeC has been tested in diverse deployments
Football Stadium Metro Area

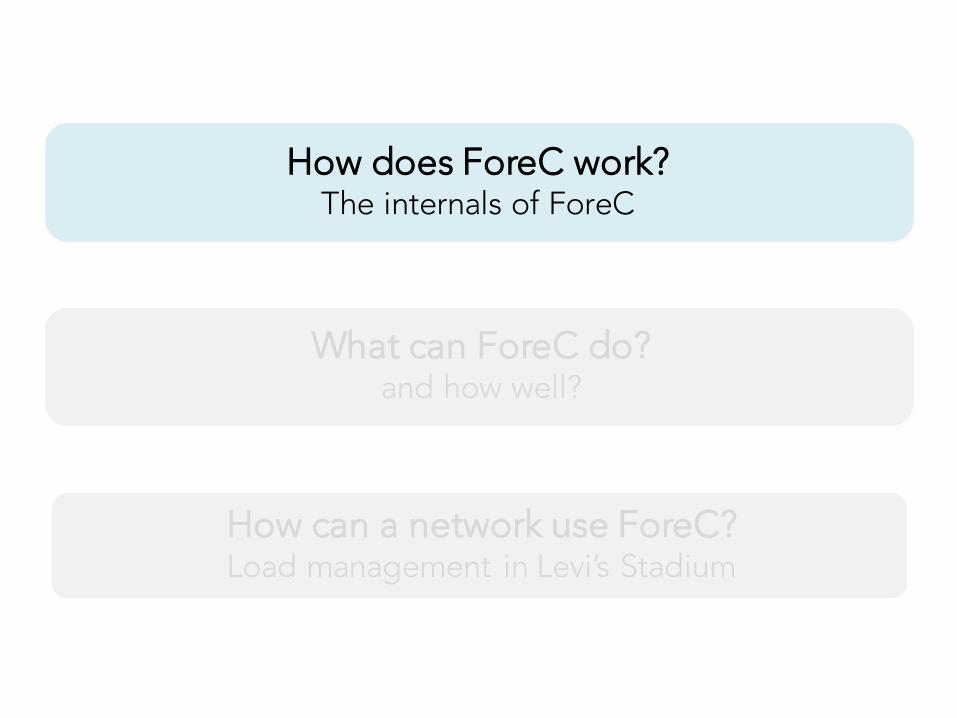
How does ForeC work?The internals of ForeC
What can ForeC do?and how well?
How can a network use ForeC?Load management in a stadium
How does ForeC work?The internals of ForeC
What can ForeC do?and how well?
How can a network use ForeC?Load management in Levi’s Stadium

futurepast now
EFFECTEFFECT
ACTION
How does ForeC forecast network effects?
STATE 2STATE 2STATE 1STATE 1
forecast causes predict
effect
ForeC’s approach: Forecast the causes, predict the effectDecoupling simplifies design and implementation, also works quite well!
What will be throughput of user A if handed over from cell 1 to 2
over the next 10 seconds?
forecast effect
decompose

The internals of ForeC
ANALYTICS LAYER
MODELING ENGINE
DATA LAYER: Data sanitization and organization
QUERY LAYER: Query parsing and response
FORECAST ENGINE
MONITORING ENGINE
PREDICTION ENGINE
Future effects
Future states
Currentstates
Currenteffects
Currentstates
OFFLINEPATH
ONLINEPATH
Current data
Past and current data
user session logs
queries responses
Proposed state change

How do we decompose an effect into its constituent causes?
ANALYTICS LAYER
MODELING ENGINE
DATA LAYER: Data sanitization and organization
QUERY LAYER: Query parsing and response
FORECAST ENGINE
MONITORING ENGINE
PREDICTION ENGINE
Future effect
s
Future states
Currentstates
Current
effectsCurrent
states
OFFLINEPATH
ONLINEPATH
Current data
Past and current data
user session logs
queries responses
Proposed state
change
Use domain knowledge to formulate/hypothesize causes, use learning tools to test significance and discover relationships
Spectral efficiencybits per resource element
Throughputbits per time
Cellbandwidth
Cell contention
User&totaldemand
Resource allocation rateresource elements per time
?
?Σ Active
users
Σ Pktrate, size
Rank
MCSCQI
X
0 20 40 60 80 100
-6-4
-20
24
6
USER SESSION #0 20 40 60 80 100
-6-4
-20
24
6
USER SESSION #0 20 40 60 80 100
-6-4
-20
24
6
USER SESSION #
58% error 40% error 12% error
00:00 01:00 02:00 03:00 04:00 05:00
1520
2530
3540
00:00 01:00 02:00 03:00 04:00 05:00
1520
2530
3540
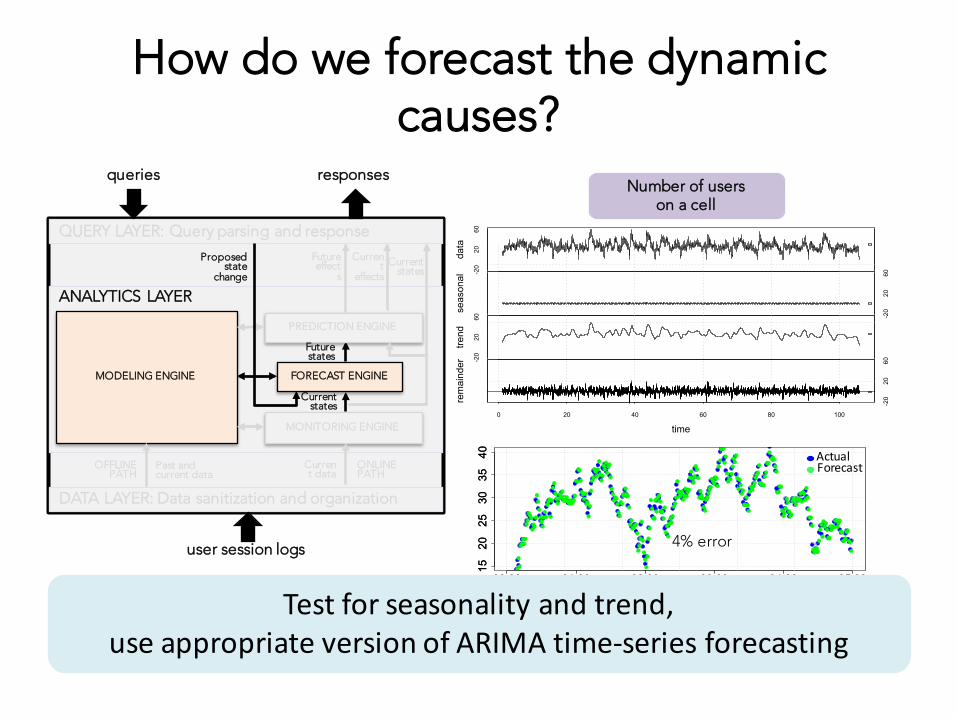
How do we forecast the dynamic causes?
ANALYTICS LAYER
MODELING ENGINE
DATA LAYER: Data sanitization and organization
QUERY LAYER: Query parsing and response
FORECAST ENGINE
MONITORING ENGINE
PREDICTION ENGINE
Future effect
s
Future states
Currentstates
Current
effectsCurrent
states
OFFLINEPATH
ONLINEPATH
Current data
Past and current data
user session logs
queries responses
Proposed state
change
Test for seasonality and trend, use appropriate version of ARIMA time-‐series forecasting
Number of users on a cell
-20
2060
data
-20
2060
seasonal
-20
2060
trend
-20
2060
0 20 40 60 80 100
remainder
time
ActualForecast
4% error

How does ForeC work?The internals of ForeC
What can ForeC do?and how well?
How can a network use ForeC?Load management in Levi’s Stadium

ForeC can predict network effects per user, per second, aggregates
Primitive Example query Medianerror
Basic primitivesPREDICT effect per userbased on (changes in) network state
Throughput of user A if it were on cell 2 instead of 1? 8.5 %
PREDICT effect per user per second Throughput of user A over the next 1s? 13.0 %
Extensions to aggregates over space and time
PREDICT effect per cell, sector, network… Average throughput of cell 1 in the next 1s? 4.0 %
PREDICT effect per 10s of seconds, minutes… Average throughput of cell 1 in the next 5s? 1.7 %
Network effects: throughput, resource utilization, contention…& any function of themNetwork actions: handover user, admit new user, increase/decrease transmit power

How does ForeC work?The internals of ForeC
What can ForeC do?and how well?
How can a network use ForeC?Load management in a stadium

ForeC lets operator monitor, predict and optimize network KPIs
[SWITCH TO TABLEAU]MONITOR – FORECAST – OPTIMIZE
Dash 1: Operators can monitor network KPIs at a fine resolution in space and time (show “ACTUAL” KPI for Band 700, 1900, 2100)[can also define new KPIs to monitor]
Dash 2: Operators can predict these KPIs to manage load proactively (show “ACTUAL” KPI and “FORECAST” KPI for a cell)
Dash 3: Operators can choose the best load management to optimize these KPIs (show “ACTUAL” and “OPTIMIZED” KPI)

Summary & Takeaways
• ForeC enables data-‐driven network optimization– fine-‐grained analytics can enable a host of novel applications and services – app delivery, spot bandwidth…
• Just the beginning …– SDN is helpful to open up the interfaces, but how do we use the interfaces?
– Modern networks are too complex for humans to figure out how to control & optimize them
– Data driven networks that automatically optimize user experience

Research Questions
• Can we track and predict the QoE of each user in the network in real time?– Tailored to each application?
• Can we learn the complex dependencies for applications across the various elements of the network?– Radio, packet core, compute cloud …
• Can we build what-‐if engines for networks?– Emulate accurately the impact of any control decision before taking it?
• Can we automatically learn the right control to apply?